
Abstract
Landslides are the most prevalent natural hazard in hilly regions of India. This study examines the landslide susceptibility of the Pithoragarh, Uttarakhand, India, using multi-criteria decision based analysis by analytical hierarchy process (AHP), and logistic regression (LR) analysis. The LSZ modelling was performed using fourteen landslide causative factors. Based on past landslide data, landslide locations were identified, which were further divided into a 70/30 ratio, with 70 representing training and 30 representing validation. Validation of the findings of the predicted maps of landslide susceptibility using Area under Curve (AUC) indicates that the predicted map using the LR approach has the highest prediction rate compared to other methods used for landslide susceptibility prediction. Also, validation of all the models was done using Landslide Density Index (LDI) which shows the validity of all models. Thus, the results of all models can be used to predict landslide susceptibility in Pithoragarh.
Introduction
Earthquakes, tsunamis, typhoons, landslides, and many other natural disasters can happen anywhere in the world and cause a lot of damage to lives and the economy. Therefore, knowing the behaviour of natural hazards is essential for implementing preventative measures whenever possible. Landslides are one of the natural disasters that are continuously increasing in hilly places, primarily as a result of an increase in human activity, negatively impacting the lives and economy of the region and the roadways to the tune of millions of dollars (Nautiyal et al. 2021). This study focuses on the vulnerability of landslides so that preventive actions can be performed in places susceptible to landslides. Various methods have been used throughout the years to create LSZ maps by utilising satellite data and thematic layers of factors affecting landslides in any given location.
The majority of hilly states in India, including Uttarakhand, Himachal Pradesh, the North Eastern region of India, etc., face a substantial geological threat in the form of landslides. It is important to understand the nature of landslide susceptibility so that a proper mitigation measure can be taken to prevent the disaster to some extent (Sharma et al. 2019; Kumar et al. 2020). Since the natural causes for landslides cannot be eliminated, proper investigation and planning in these areas should be done before any construction projects. In some instances, human activities might contribute to the occurrence of landslides. Many landslides caused by humans can be prevented or reduced. A number of terms such as landslide hazard zonation (LHZ), landslide susceptibility mapping (LSM), landslide hazard mapping (LHM), landslide susceptibility zonation (LSZ), landslide probability, etc. are in practice (Varnes 1984; Kanungo et al. 2006; Mathew et al. 2007; Ohlmacher 2007; Gupta et al. 2008; Yalcin 2008; Mathew et al. 2009; Yilmaz 2009; Chauhan et al. 2010) for the landslide hazard related. Many studies related to these have been conducted in the Himalayas using remote sensing and GIS, which provides a simple visualisation of such maps and assists the end-user in assessing their level of vulnerability and considering any future consequences (Sarkar and Kanungo 2004; Kanungo et al. 2006; Pareta et al. 2012; Sharma et al. 2012; Bilwa et al. 2015; Chawla et al. 2018; Bera et al. 2019; Chowdhuri et al. 2020; Pandey et al. 2020; Peethambaran et al. 2020; Ahmed et al. 2021; Batar and Watanabe 2021; Farooq and Akram 2021; Mandal et al. 2021; Das et al. 2023; Panchal and Shrivastava 2022). In the Darjeeling Himalayas, India, FR (Sarkar and Kanungo 2004; Das and Lepcha 2019), WOE (Saha and Saha 2020), AHP (Ghosh et al. 2011; Mandal and Mandal 2018; Das et al. 2023), and Particle Swarm Optimization-Support Vector Machine (SVM) (Chawla et al. 2018; Saha and Saha 2020) models were used for landslide susceptibility zonation. Because of its geological and topographical conditions, and seismic activities, the Indian Himalayas are prone to the occurrence of landslides (Veerappan et al. 2017; Meena and Tavakkoli Piralilou 2019). A research study was conducted in a road section of NH in the Indian Himalayas using LR and comparing it with rock mass classification (Das et al. 2010). The LR model was validated using ROC, which resulted in an AUC of ‘0.83’.
The FR and IV models were used in a study for LSZ in NH-154A in Himachal Pradesh (Singh and Kumar 2017). The study area was divided into five zones, and LSZ maps were validated using AUC, which resulted in higher accuracy for IV in comparison to the FR model (Singh and Kumar 2017). A research was conducted in part of mid-Himalaya in Himachal Pradesh using FR and IV models for landslide hazard zonation (Kumar et al. 2019). The results were validated using success rate curve and it was observed that FR has higher accuracy than IV model for the area. In recent years, machine learning (ML) algorithms have been widely used in natural hazard research, such as LSZ mapping. These algorithms include SVM, multivariate adaptive regression spline, boosted regression, classification and regression trees, Naïve Bayes, quadratic discriminant analysis, ANN, maximum entropy, RF, and generalised linear model (Kavzoglu et al. 2014; Ali et al. 2021). However, simple statistical methods/models are also used in landslide research to comprehend the relationship between influencing variables/factors and landslide incidence (Kumar et al. 2017). Part of the Pithoragarh district, Uttarakhand was studied for LSZ modelling (Fayez et al. 2018; Pham et al. 2019; Ngo et al. 2021; Tran et al. 2021; Dam et al. 2022) using Rotation Forest ensemble integrated with different base classifiers to develop different hybrid models, FR model (Fayez et al. 2018), Reduced Error Pruning Trees (REPT), Bagging REPT, Multiboost REPT, Rotation Forest based REPT, Random Subspace based REPT (Pham et al. 2019), Naive Bayes, Multilayer Perceptron Neural Network Classifier, Alternating Decision Tree (Tran et al. 2021), Linear Discriminant Analysis, LR, Radial Basis Function Network (Ngo et al. 2021), SE Model, and WOE Method (Dam et al. 2022). In this study, we have compared different models to produce landslide susceptibility maps for the Pithoragarh, Uttarakhand, which is one of the most landslide-prone regions in the Himalayas. For the evaluation of these models, five landslide-influencing parameters were utilised: slope (in degree), aspect, drainage and lineament density, and rainfall. Using the area under the curve (AUC) approach and Landslide Density Index (LDI), the performance of the models was evaluated.
Study area
After Uttarkashi and Gopeshwar, Pithorgarh is the third largest district in Uttarakhand, with an area of 7217.27 square kilometres. Because of its attractiveness, this urban region is known as ‘Little-Kashmir.’ The district (Figure 1) is known as the revenue division of Uttarakhand's Kumaon region and has a population density of 69 people per square km and an average growth rate of 4.58%. The area is situated at 29.58° North latitude and 80.22° East longitude, with an average elevation of 1627 m. According to the Indian Bureau of Standards (BIS), Pithoragarh is located in Seismic Zone V and is not a designated flood zone. As far as climate is concerned, the area is relatively warm from April to mid-June, with a maximum temperature of approximately 30°C, and receives occasional summer thunderstorms. From mid-June to mid-September, the district experiences nearly daily heavy rains, which frequently cause landslides. Due to the presence of glaciers to the north of the area, the winter temperature remains relatively cool and is characterised by frontal rainfall and sparse snowfall.
Location of the study area.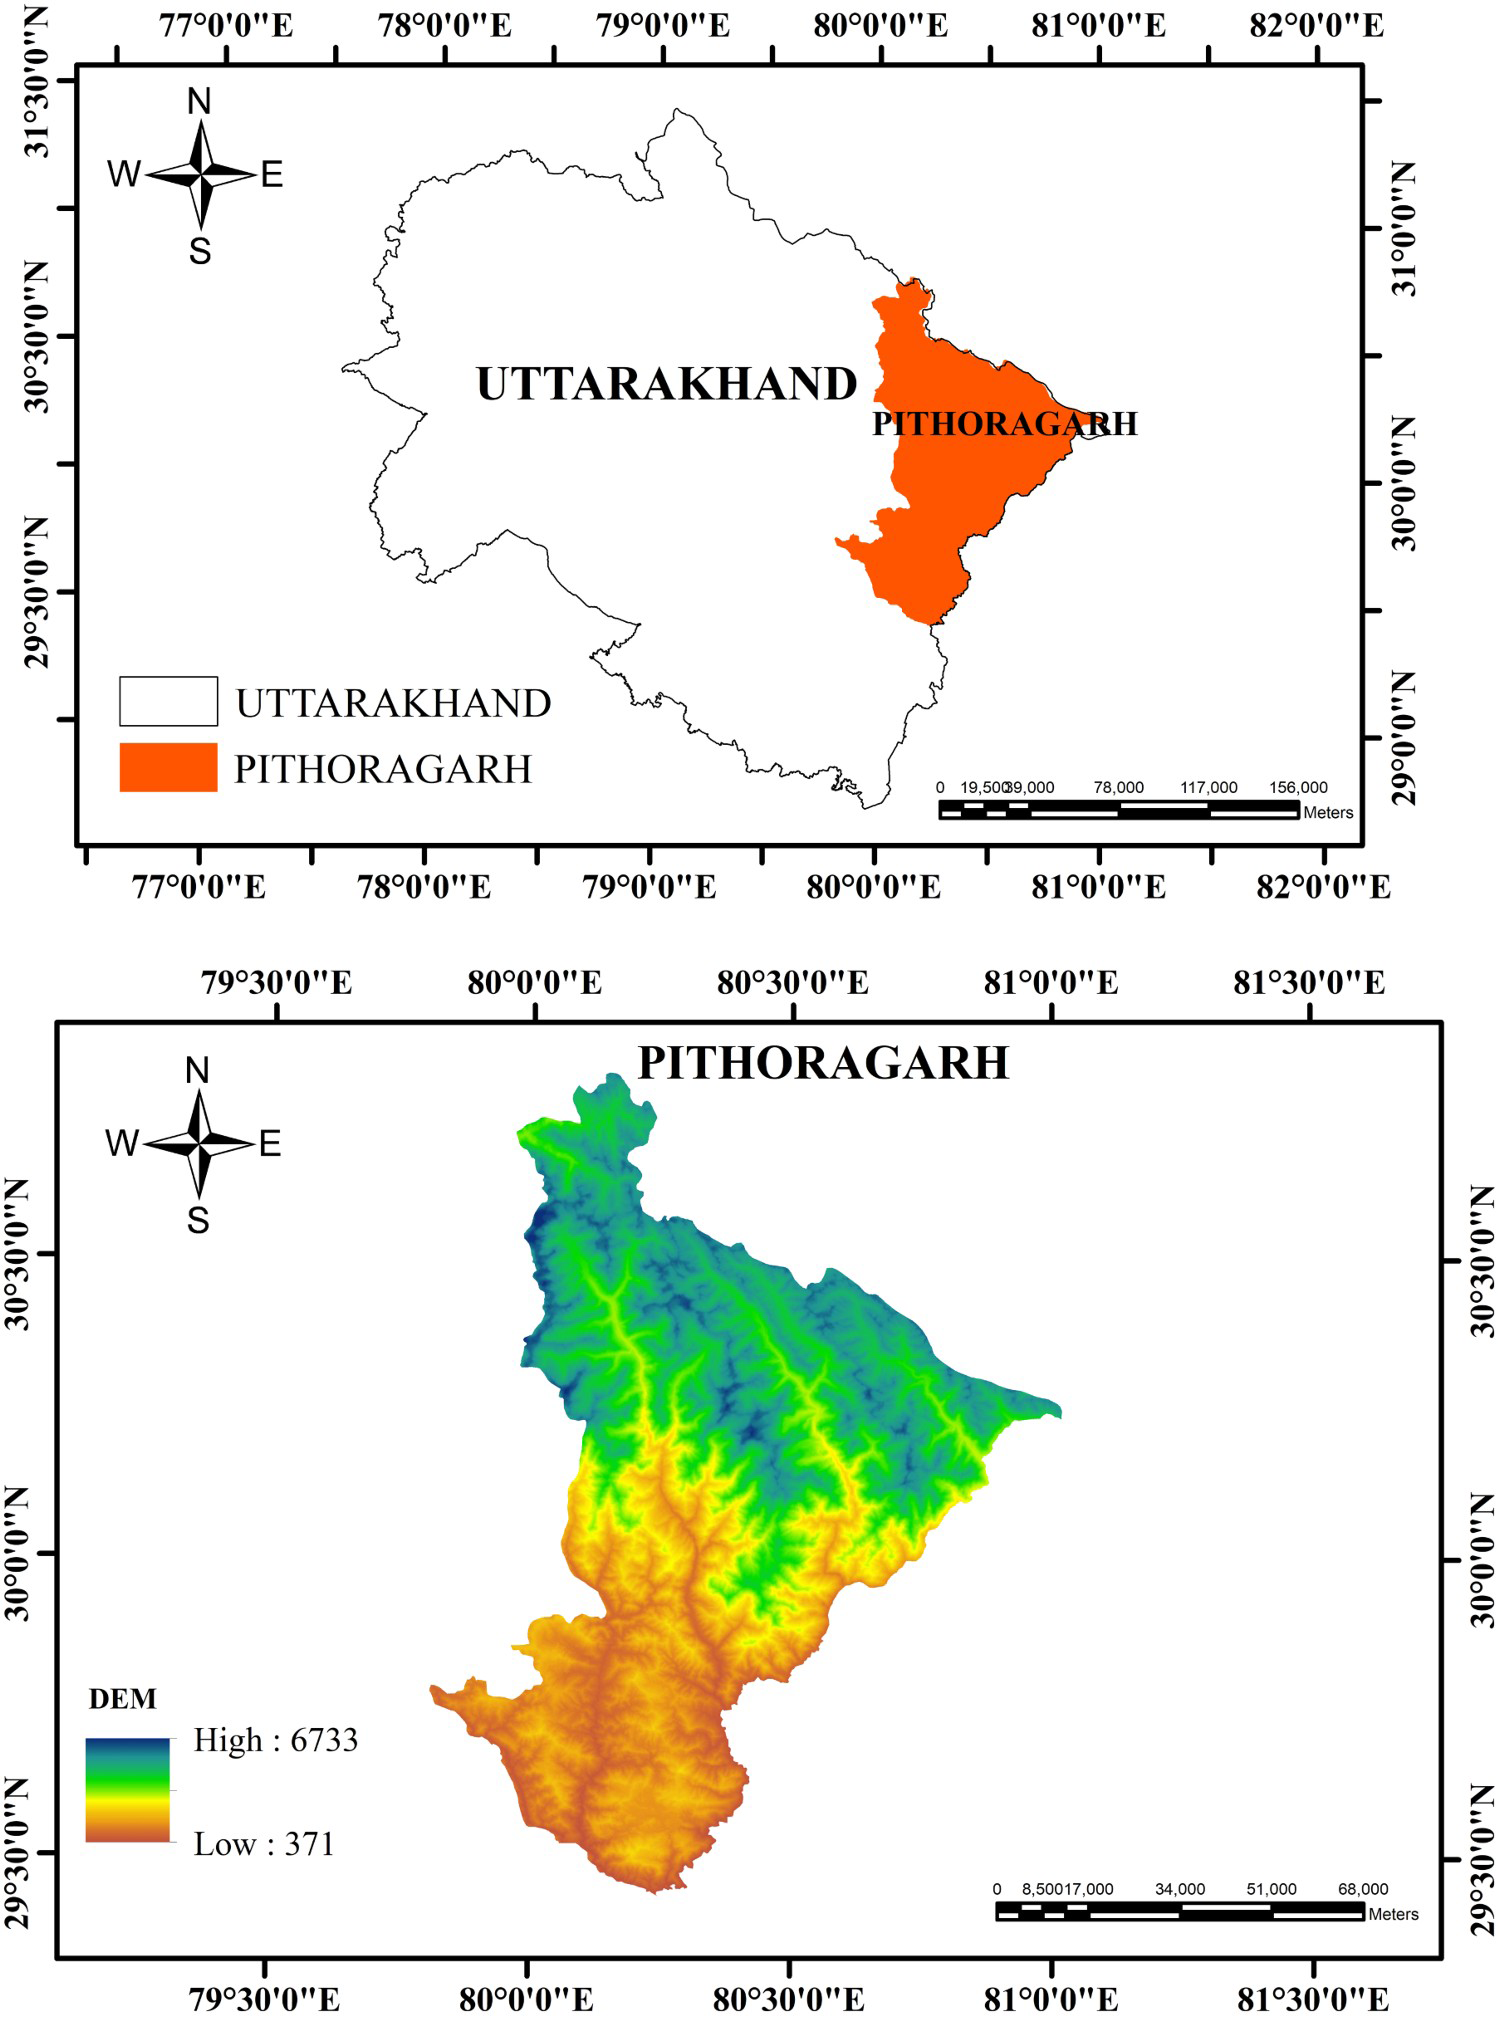
Landslide inventory
Landslide inventory is mapped based on past landslide data and field survey of the study area. In Pithoragarh, past landslide data was collected using field data and the Geological Survey of India (GSI) (Figure 2). Based on past landslide data, a total of 8810 landslide locations were identified, which were further divided into a 70/30 ratio for training (6501) and validation (2309) of predicted maps, respectively.
Landslide inventory of study area.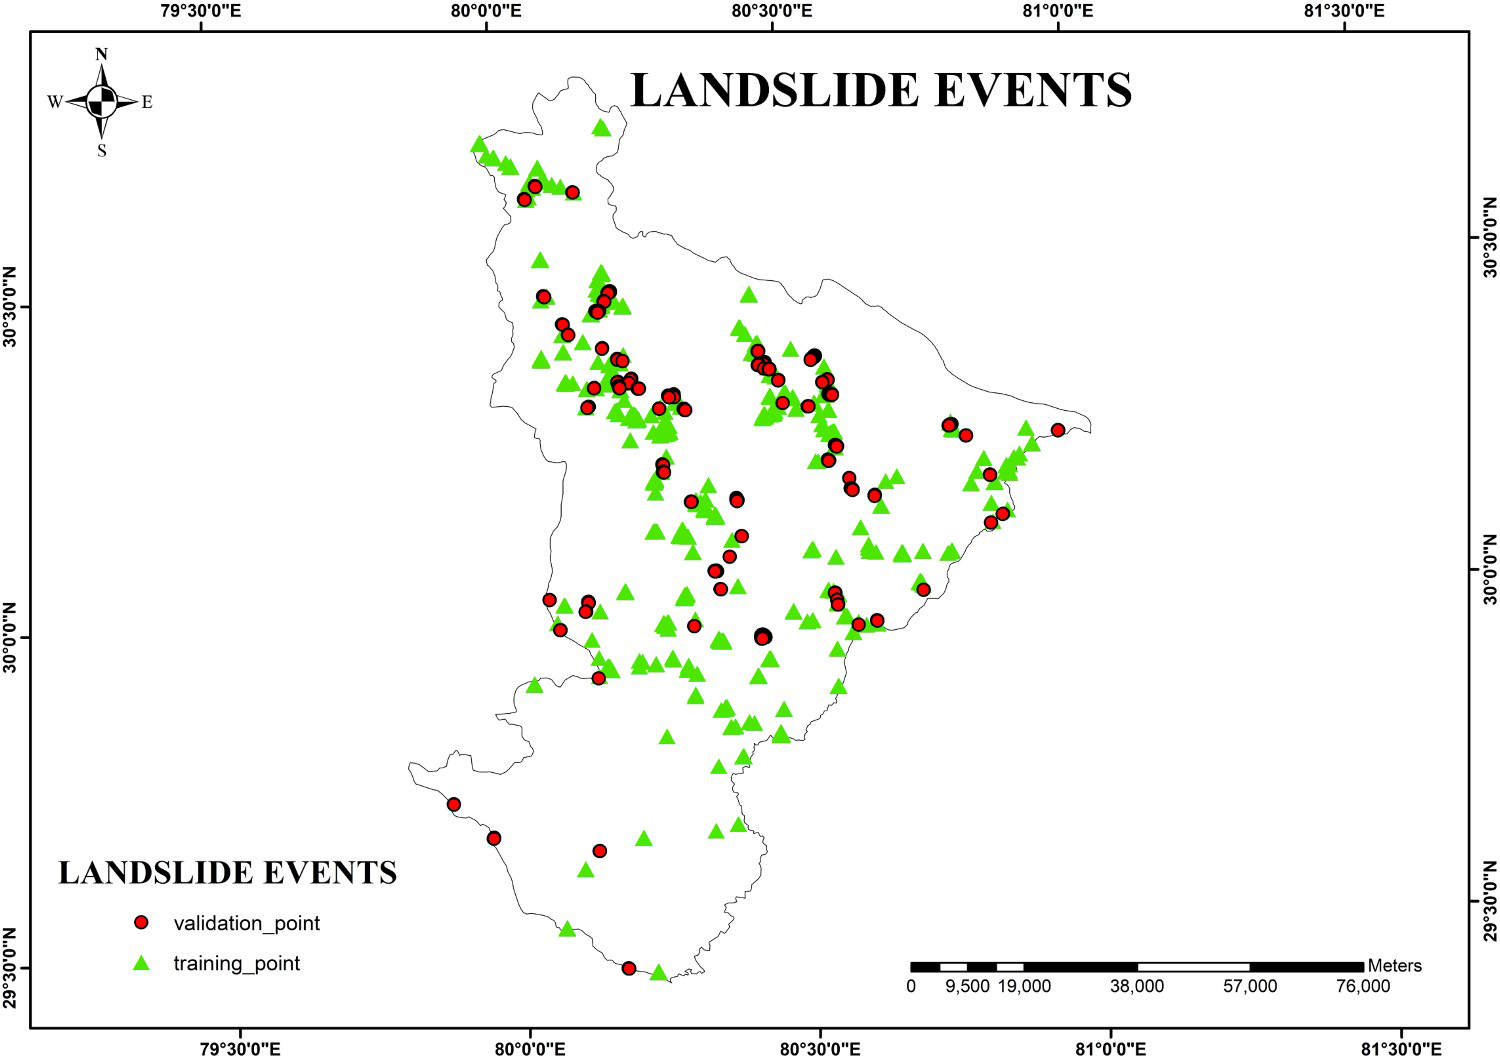
Results and discussion
Landslide causative factors mapping
Slope
Slope identifies the steepness at each point of topography. It is significant in hydrology and geomorphology as it alters the velocity of surface and subsurface flows (Anbalagan 1992; Ercanoglu and Gokceoglu 2004; Kannan et al. 2013). The slope map was prepared using the DEM and was divided into five classes based on the degree of inclination using Jenk's classification in GIS as shown in Figure 3(a).
(a) Slope, (b) Rainfall, (c) Drainage density, (d) Lineament density, and (e) Aspect.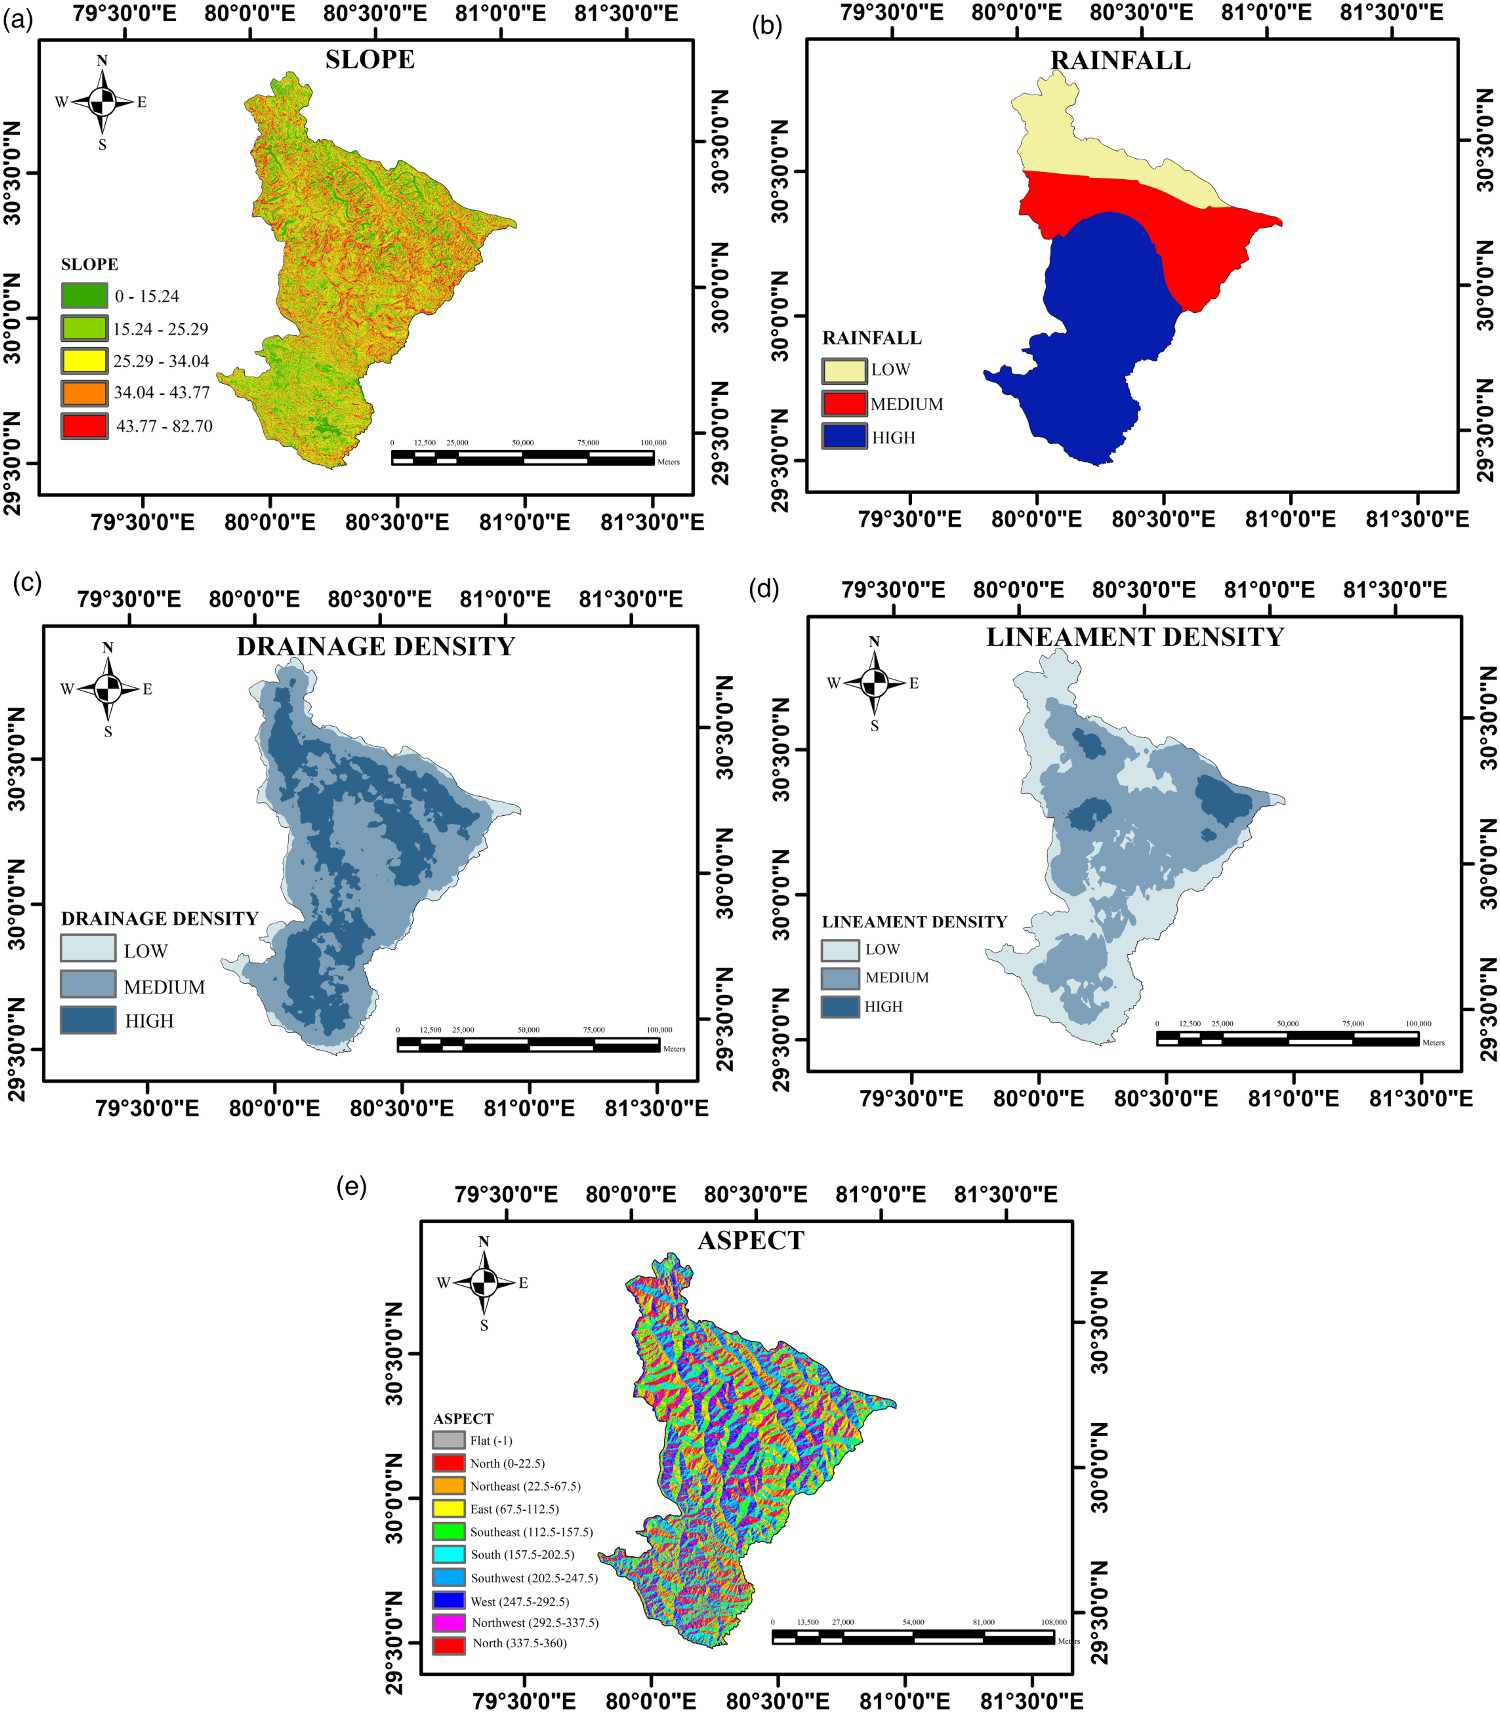
Rainfall
Rainfall is the most important determining factor for landslides in the hilly area. The study area under consideration received a lot of rain from mid-June to mid-September, as well as slight rainfalls in the winters. Therefore, it became important to study the rainfall in the area. The rainfall data were obtained from CRU, and the rainfall (Figure 3(b)) of the study area was classified into three categories based on the data from the previous 10 years.
Drainage density
Due to the drainage density, mass wasting and slope erosion occur. It is the ratio of total stream length to basin area (Demir 2019). Numerous specialists have discovered in the scientific literature that drainage density influences groundwater standards (Kavzoglu et al. 2014). The area was divided into three classes, as shown in Figure 3(c).
Lineament density
Fractures, faults, and rock cleavages are fundamental geological structures that contribute to the development of pore pressure (Ramakrishnan et al. 2013). Due to the intense shearing generated by active faults, the likelihood of landslides increases. The study area was divided into three categories, as shown in Figure 3(d).
Aspect
A slope's aspect describes its direction. Aspect demonstrates a strong inheritance from bedrock structure and effects solar exposure and consequently plant and evapotranspiration variations (Fernandez Merodo et al. 2004). In this study, aspect is divided into 10 classes as shown in Figure 3(e).
Landslide susceptibility zonation (LSZ) mapping
Methods used
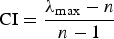
Analytic hierarchy process (AHP): Analytic Hierarchy Process (AHP) is a multi-criteria decision analysis semi-quantitative approach used for landslide susceptibility mapping (Kumar et al. 2018; Kumar et al. 2022). This method is analysed by developing pair-wise comparison matrix by assigning rank to each factor against other factor (Saaty 2000). The rank is assigned based on the degree of preference of factors influencing landslide (Saaty 1980). After determining pair-wise comparison matrix, weight for each landslide causative factor is calculated. Consistency ratio (CR) is used to determine that matrix is randomly generated, if CR is less than or equal to 0.10 then it is predicted that the matrix is randomly generated and if CR is greater than 0.10 than matrix is automatically rejected. The value of CR is determined using Equation (1) as (Saaty 1977),

The weights of each landslide causative factor calculated are accepted if CR value is less than or equal to 0.1, then it is implemented in ArcGIS and a landslide susceptibility map is provided for the entire study area distributed in different zones ranging from very low to very high depending on the occurrence of landslides. In this study, for AHP only five factors are considered for comparison with LR and SE. Figure 4(a) illustrates the AHP-generated LSZ map.
LSZ map using: (a) AHP and (b) LR.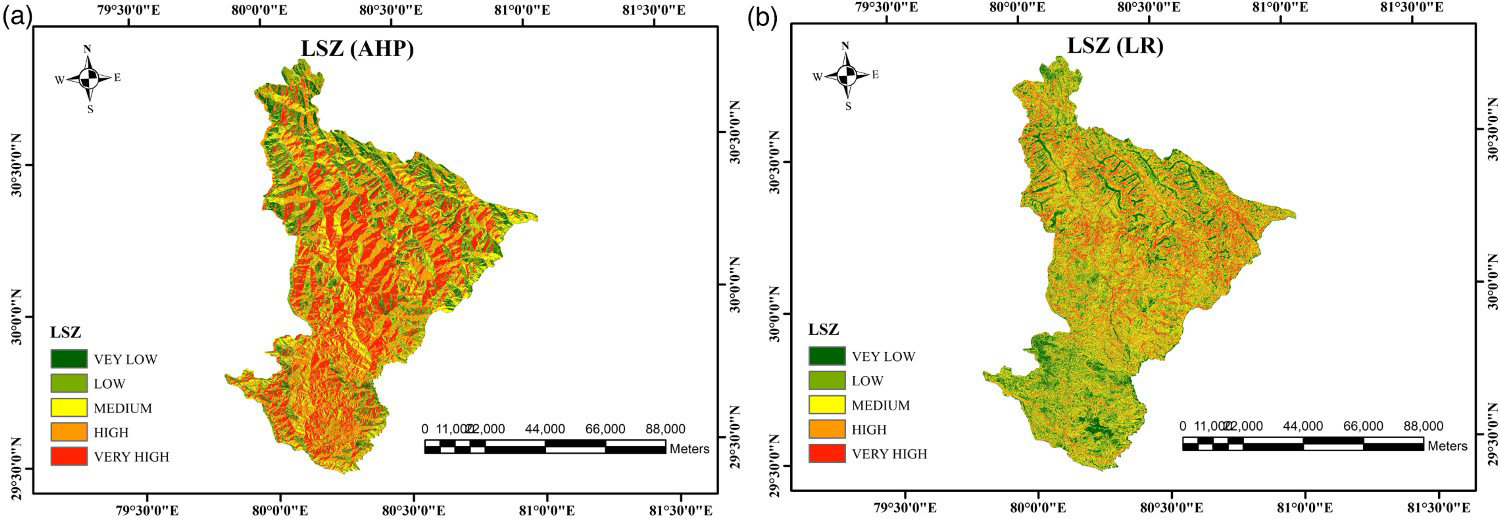
Logistic regression (LR) analysis: In several fields, including landslide research, ML techniques have recently seen significant traction. One of the kinds of machine learning technique utilised for LSZ mapping is logistic regression (LR) analysis. LR is an extension of multiple regressions where the dependent variable is neither a continuous or quantitative variable (George and Mallery 2000). In addition to producing a non-linear model, LR assesses predictor variables to determine if a process will succeed or fail based on a set of measurements of all types, including continuous, discrete, and dichotomous data. It demonstrates how dependent and independent variables are related to one another (Pradhan and Lee 2010). The relationship between the occurrence and dependency of different variables can be expressed as (Shrestha et al. 2018):


Validation of LSZ maps
Area under the curve (AUC) method: The area under the curve (AUC) method has been observed to yield significantly greater outcomes in prediction evaluation (Fawcett 2006; Nandi and Shakoor 2010; Feizizadeh et al. 2017). The AUC method was used in this study to validate the seven methods listed above. For this purpose, LSZ maps were classified using Jenk's natural classification method, and the reclassified map data was combined with the testing landslide inventory data using a raster calculator in GIS to determine the percentage of landslides in each class of LSZ maps. Areas of landslides from the testing dataset were plotted against the LSI values in Microsoft Office Excel in order to create prediction rate curves. The area percentage as well as the cumulative landslide area percentage has been determined. AUC values were calculated using the trapezium method (Kumar and Anbalagan 2016). According to their AUC values, the curves estimate the model's fitness. Chen et al. (2016) claim that the model is considered well-fitted if the AUC value is between 0.5 and 1. AUC values below 0.5 indicate a randomly fitted model. With the help of the trapezium method, the AUC of the LSZ maps generated using AHP and LR 86.41% and 87.73% as shown in Figure 5.
AUC for AHP and LR.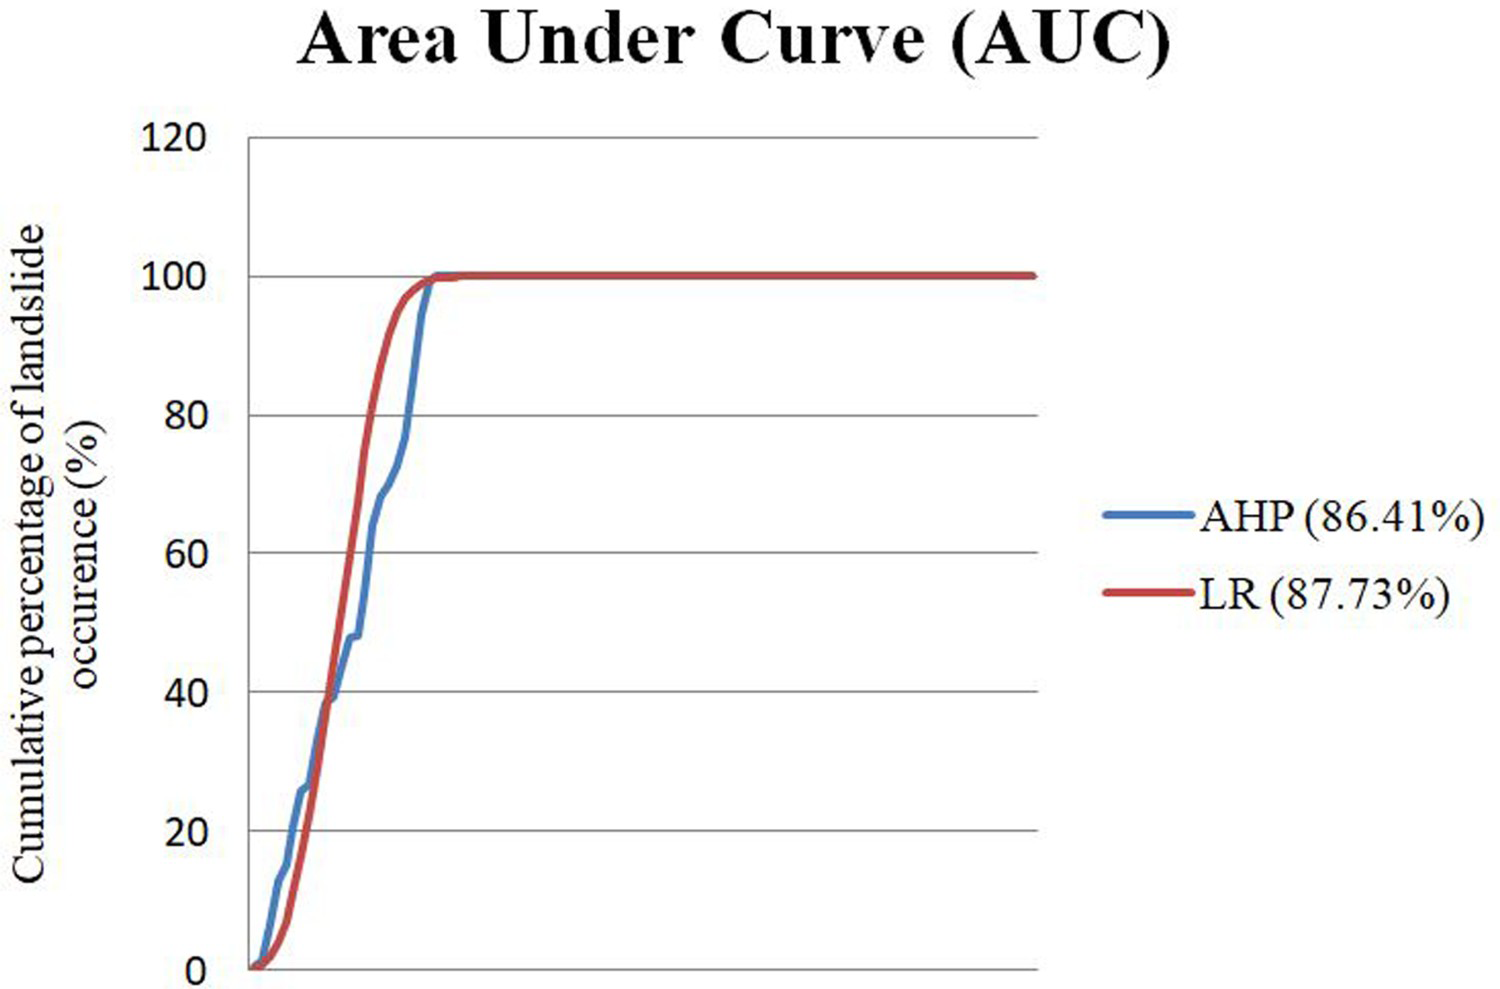
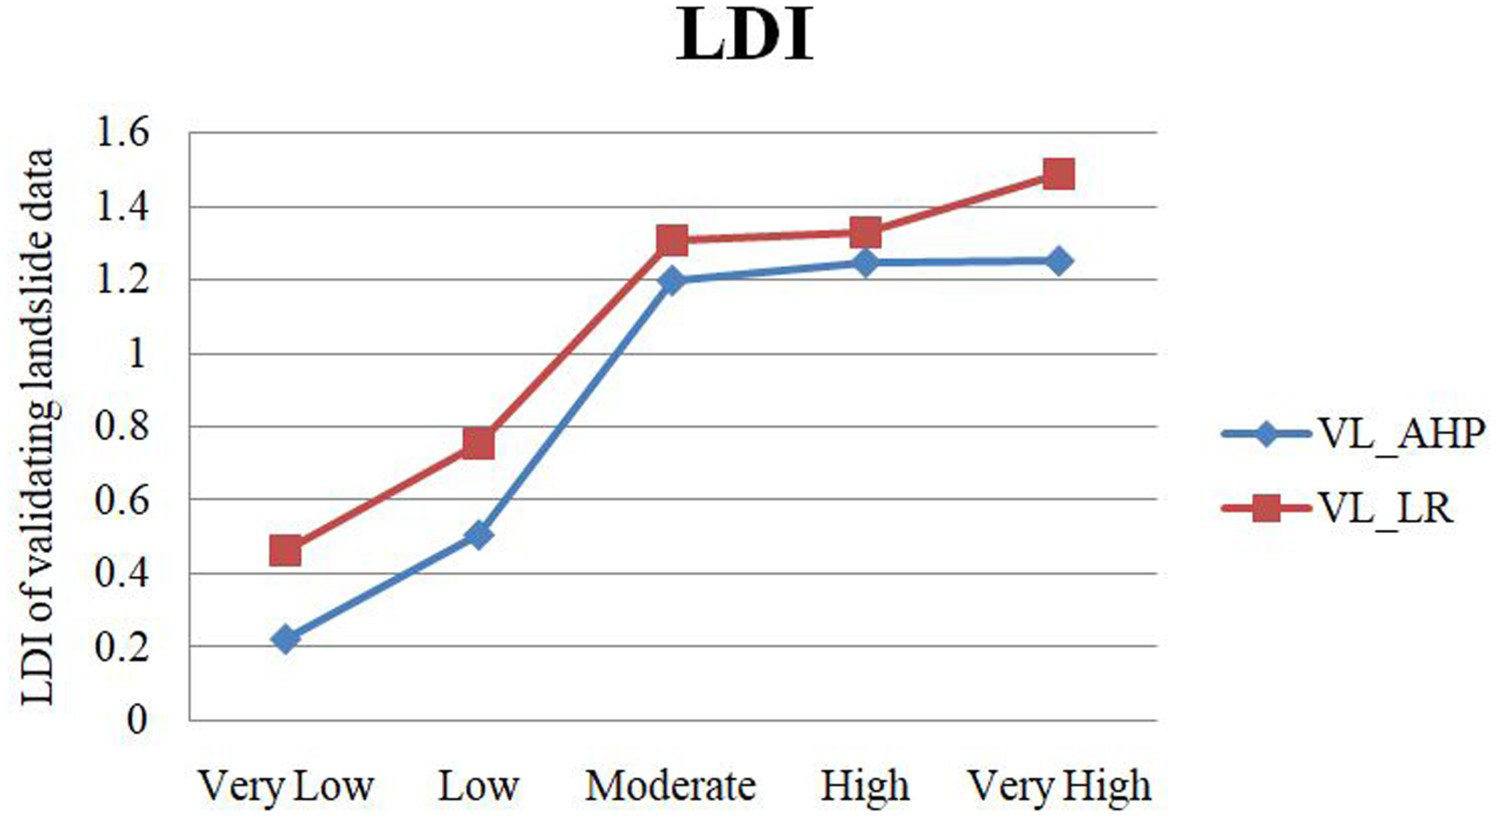
Landslide density index (LDI) method: Landslide density index (LDI) is the ratio of % of landslide pixels in each class to the % of class pixels of LSZ map (Pham et al. 2015). In this study, LDI is used to validate LSZ maps generated using applied models. For validation of LSZ models, 30% of landslide inventory data was used. It was observed that the LDI values for each model are increasing from very low to very high class of LSZ map, thus, the maps are considered to be valid. If more landslides occur in the high and very high susceptibility zones than other zones, it is possible to validate the applicability of any susceptibility map (Fayez et al. 2018). The features of LSZ classes for the validation of the AHP and LR using training and validating landslide data are shown in Figure 6 and Figure 7, respectively. The very high susceptibility class has the highest density of landslides, which generally indicates the accuracy of the LSZ maps generated using all the models.
LDI for training landslide data of AHP and LR. LDI for validating landslide data of AHP and LR.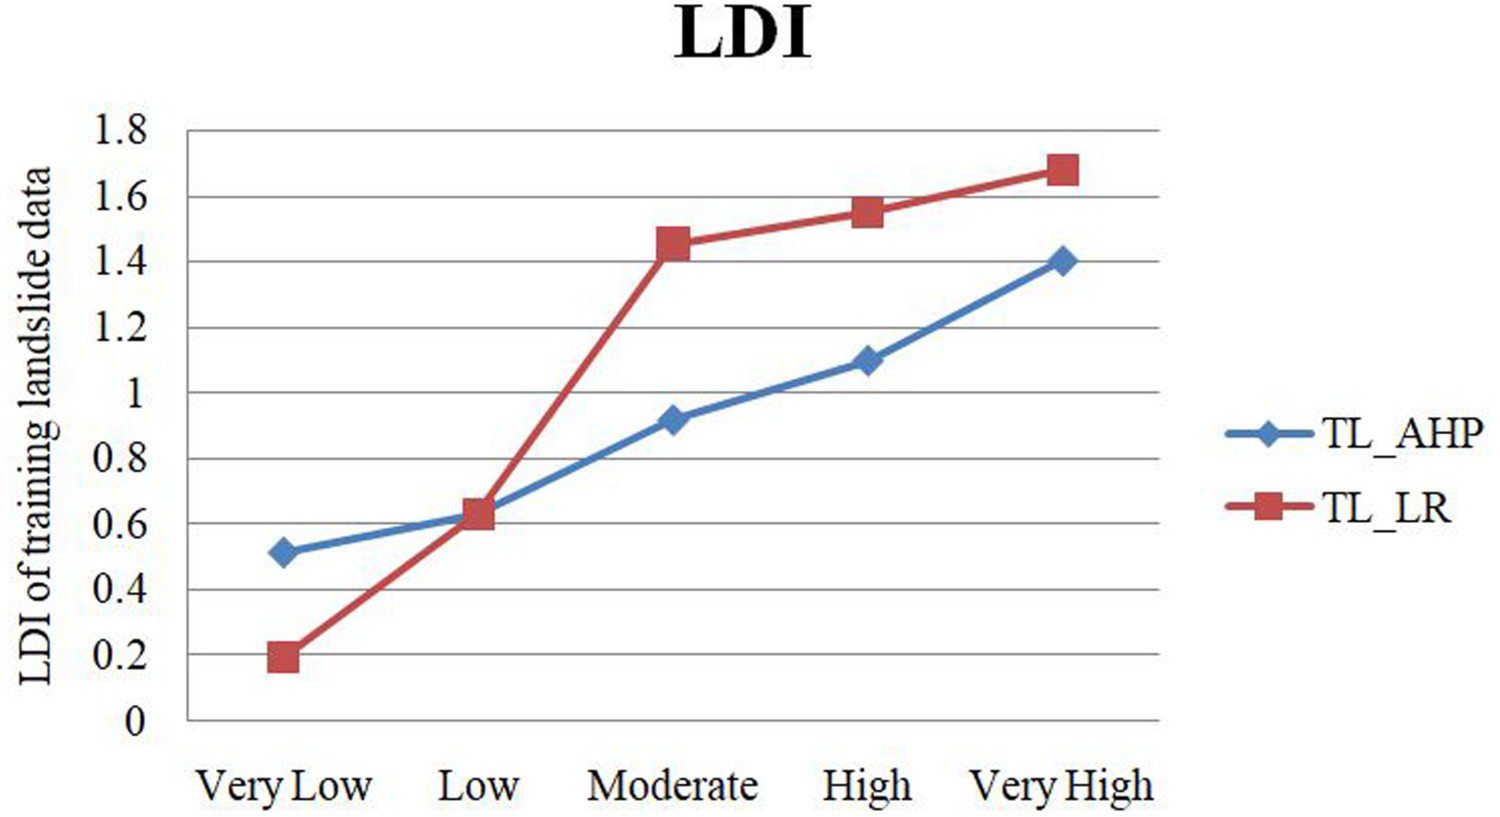
Conclusion
The study for landslide susceptibility was conducted in whole Pithoragarh, Uttarakhand, India. On the basis of this study following conclusions are made:
Landslides are the most prominent natural hazards occurring in hilly area, so, landslide susceptibility assessment should be carried out before any construction activity to be performed in the Pithoragarh district. For this purpose, different LSZ approaches were used to create predicted maps for landslides in Pithoragarh, Uttarakhand, India. To fulfil this objective, the landslide inventory map was delineated based on the past landslides and field survey. Out of the total 8810 landslide events, 70% (6501) of the landslide events were used as training events and 30% (2309) of the landslide events were used as validating events. Feasibility of LSZ models based on machine learning technique using five landslide causative factors has also been processed in current study, and the same has been compared with AHP. The validation of these three LSZ models was done using AUC and LDI. AUC shows that LR model has the highest prediction rate of 87.73%. The LDI was increasing from very low to very high class thus confirming the validity of the models. The results of LSZ can be used for future development in Pithoragarh, Uttarakhand, India. However, the area lying under high and very high susceptibility zone should be avoided, if in any case it cannot be avoided then proper mitigation measures should be taken under consideration.
Footnotes
Acknowledgements
The authors are thankful to the Public Works Department (PWD), Uttarakhand for providing the information on landslides in the state. Also, the authors are thankful to the people of Pithoragarh, Uttarakhand for giving information regarding landslide areas in the district.
Disclosure statement
No potential conflict of interest was reported by the author(s).