
Abstract
Lattice structures are a type of lightweight structure that is more commonly being applied to engineering systems as a way to reduce mass and enhance mechanical properties. The cantilever beam case is one of the primary modes of loading in many engineering applications, where light-weighting is also crucial. However, lightweight lattice structured cantilever beams have not been investigated considerably due to design and manufacturing limitations. Therefore, the aim of this study was to investigate the response of four different lattice structured cantilever beams comprising of unit cells made from Schwarz-P, Schwarz-D, Gyroid, and Octet-truss structures fabricated using Multi Jet Fusion additive manufacturing technology. An investigation into the cross-sections of these structures leads to a conclusion that the beams made from such structures are non-prismatic in nature as a result of variation in cross-sections. This led to the development of equations for the moment of inertia of these structures, which helped in calculating symmetric and un-symmetric bending. These beams were subjected to cantilever loading until failure, which provided insights into flexural properties such as flexural stress, stiffness, and strain energy. Experimental results indicate that the surface-based structures, due to better surface-area-to-volume ratio, have better ability in transferring loads and hence perform better than the beam-based Octet-truss beam. The Schwarz-D beam had performed the best among all the beams, which is further supported in literature due to its stretch-dominated topology that results in higher values of modulus. The finite element analysis (FEA) findings also validate these findings in which the distribution of stresses can be seen to be better transmitted than the other structures. The FEA validation shows that the distribution of Von-Mises stress and their position in experimental tests and failure of these structures is also very close, which provides validation to the experimental setup and the testing of beams.
Introduction
The advent of additive manufacturing (AM) has opened new horizons in the field of manufacturing and has paved the way for design considered impossible to manufacture through conventional methods. 1 Due to the layer-by-layer addition of material in AM processes, complex designs such as those obtained through topological optimization (TO) can be made with relative ease. In a recent study, Robbins et al. 2 performed a homogenization method of topology optimization for the creation of optimized cellular structures, which can be made using AM process.
Further, they presented a novel stereolithography (stl) file generation method that can even create cellular structures of excellent geometric features. Xia et al. 3 and Alzahrani et al. 4 used to shape and topology optimization techniques to design truss-based lattice structures. A more recent study by Leary et al. 5 has compared many support structure designs such as cantilever beam and revealed that AM technology can fabricate complex and optimal structural designs using topology optimization methods; however, several challenges are being faced. Even though the structures obtained through topology optimization are lightweight and optimized, they have certain issues as mentioned by Brackett et al. 6
Moreover, TO even becomes unfeasible in AM processes that require support during three-dimensional (3D) printing, because 40–70% of AM product cost is spent on removal of support structures. 7 In some cases, the complexity of the shape may lead to damage of the part during support removal. Further, TO may lead to optimization in a manner that there are enclosed cavities within the design through which powder removal becomes impossible. 8
Therefore, in view of these challenges, cellular structures have become one of the most prominent areas of research whose response could be tailored through varying parameters such as porosity, type of unit cell, and the lattice structure arrangement. 9 These customizable characteristics, and excellent mechanical properties derived from their high strength-to-weight ratios, have been used in many industries; for example, in the aerospace sector, they have been used in drone wings. 10 Similarly, such structures have been used to optimize electric drive housing. 11
Moreover, in the bio-medical field, due to customization, patient-specific implants 12 can be manufactured that can be used in knee implants and hip stem, 13 acetabular cup,14,15 etc. Due to the possibility, AM is providing the mechanical characterization of lattice structures that have been carried out extensively. Many mechanical tests such as tension, 16 compression,16,17 and 3-point bending 16 are being carried out comparing different types of lattice structures.
To study the flexural behavior of lattices, some papers can be found in the literature comparing the flexural strength,17–19 keeping constant the unit-cell dimensions and testing according to the general American Society for Testing and Materials (ASTM) standard of D-790 for 3-point bending D-638 for tensile testing and D-1621 for compression testing. Bending tests are typically performed using 3-point bending, which uses different testing parameters to test different unit cell morphologies. Pelanconi and Ortona 20 made a novel structure by connecting Gyroid with carbon fiber-reinforced polymers inserts and reported flexure properties.
In contrast, others have studied the effect of bending on lattice sandwich structures16,21 and reported failure mechanisms. Cantilever beam, on the other hand, is used as a benchmark test for the validating model made through optimization algorithms 22 that minimize compliance, hence achieving maximum stiffness design. Panesar et al. 23 have worked on studying various design strategies for three triply periodic minimal surface (TPMS) structures in the domain of a cantilever beam and has concluded that the graded lattice structure outperforms all the others based on strain energy values.
Cheng et al. 24 proposed a new method of cellular structure optimization named the homogenization-based topology optimization method in which both uniform density and variable density cellular structures can be designed optimally. In addition, they performed finite element analysis (FEA) on the 3-point bending beam for the validation of the aforementioned method and concluded that the designs constructed by employing cellular structures can overcome several issues faced by topology optimized design counterparts. In addition, lightweight designs can be constructed using cellular structures.
The cantilever beam supported from one end has been extensively used in the several industries, specifically in overhanging projections, cranes, bridges, structured roofs, and furniture. Consequently, many attempts have been made to design cantilever beams optimally using topology optimization methods. These beams are lightweight but challenging to manufacture, even using AM, as mentioned earlier. A few researchers have studied cantilever beams designed using cellular structures; however, most of the aspects of these lightweight cantilever beams are absent from their investigations.
Therefore, the objective of the present work is to investigate the flexural response of non-prismatic beams made as a result of different lattice unit cell morphologies. For this study, three surface-based TPMS25,26 structures, namely Schwarz-D, Schwarz-P, and Gyroid, and one beam-based Octet-truss lattice structure are investigated. The reason for choosing these structures is that they are stretch-dominated and have high modulus and initial yield strength, making them favorable for lightweight structural application. 27
Experimental tests were carried out followed by FEA to validate results in terms of the load-bearing capacity of each structured beam, and the failure behavior of all structures analyzed in the present study. A new method of calculating the moment of inertia (MOI) of structured lattice beams was also developed and employed to determine MOI of the structured beams analyzed in the present study. Determining the MOI is essential to calculate other mechanical properties of structured beams.
Materials and Methods
Designing of cantilever beam incorporated with lattice structures
The design freedom provided by AM has led to customization and personalization to a level that many commercially available computer-aided design (CAD) software cannot fulfill. The features and functions they provide are well suited for design for traditional manufacturing but fall short of the level of sophistication that AM can provide. 28 Therefore, a recently developed software named nTopology (New York, NY) was used 29 to design lattice structures that are very difficult to design otherwise.
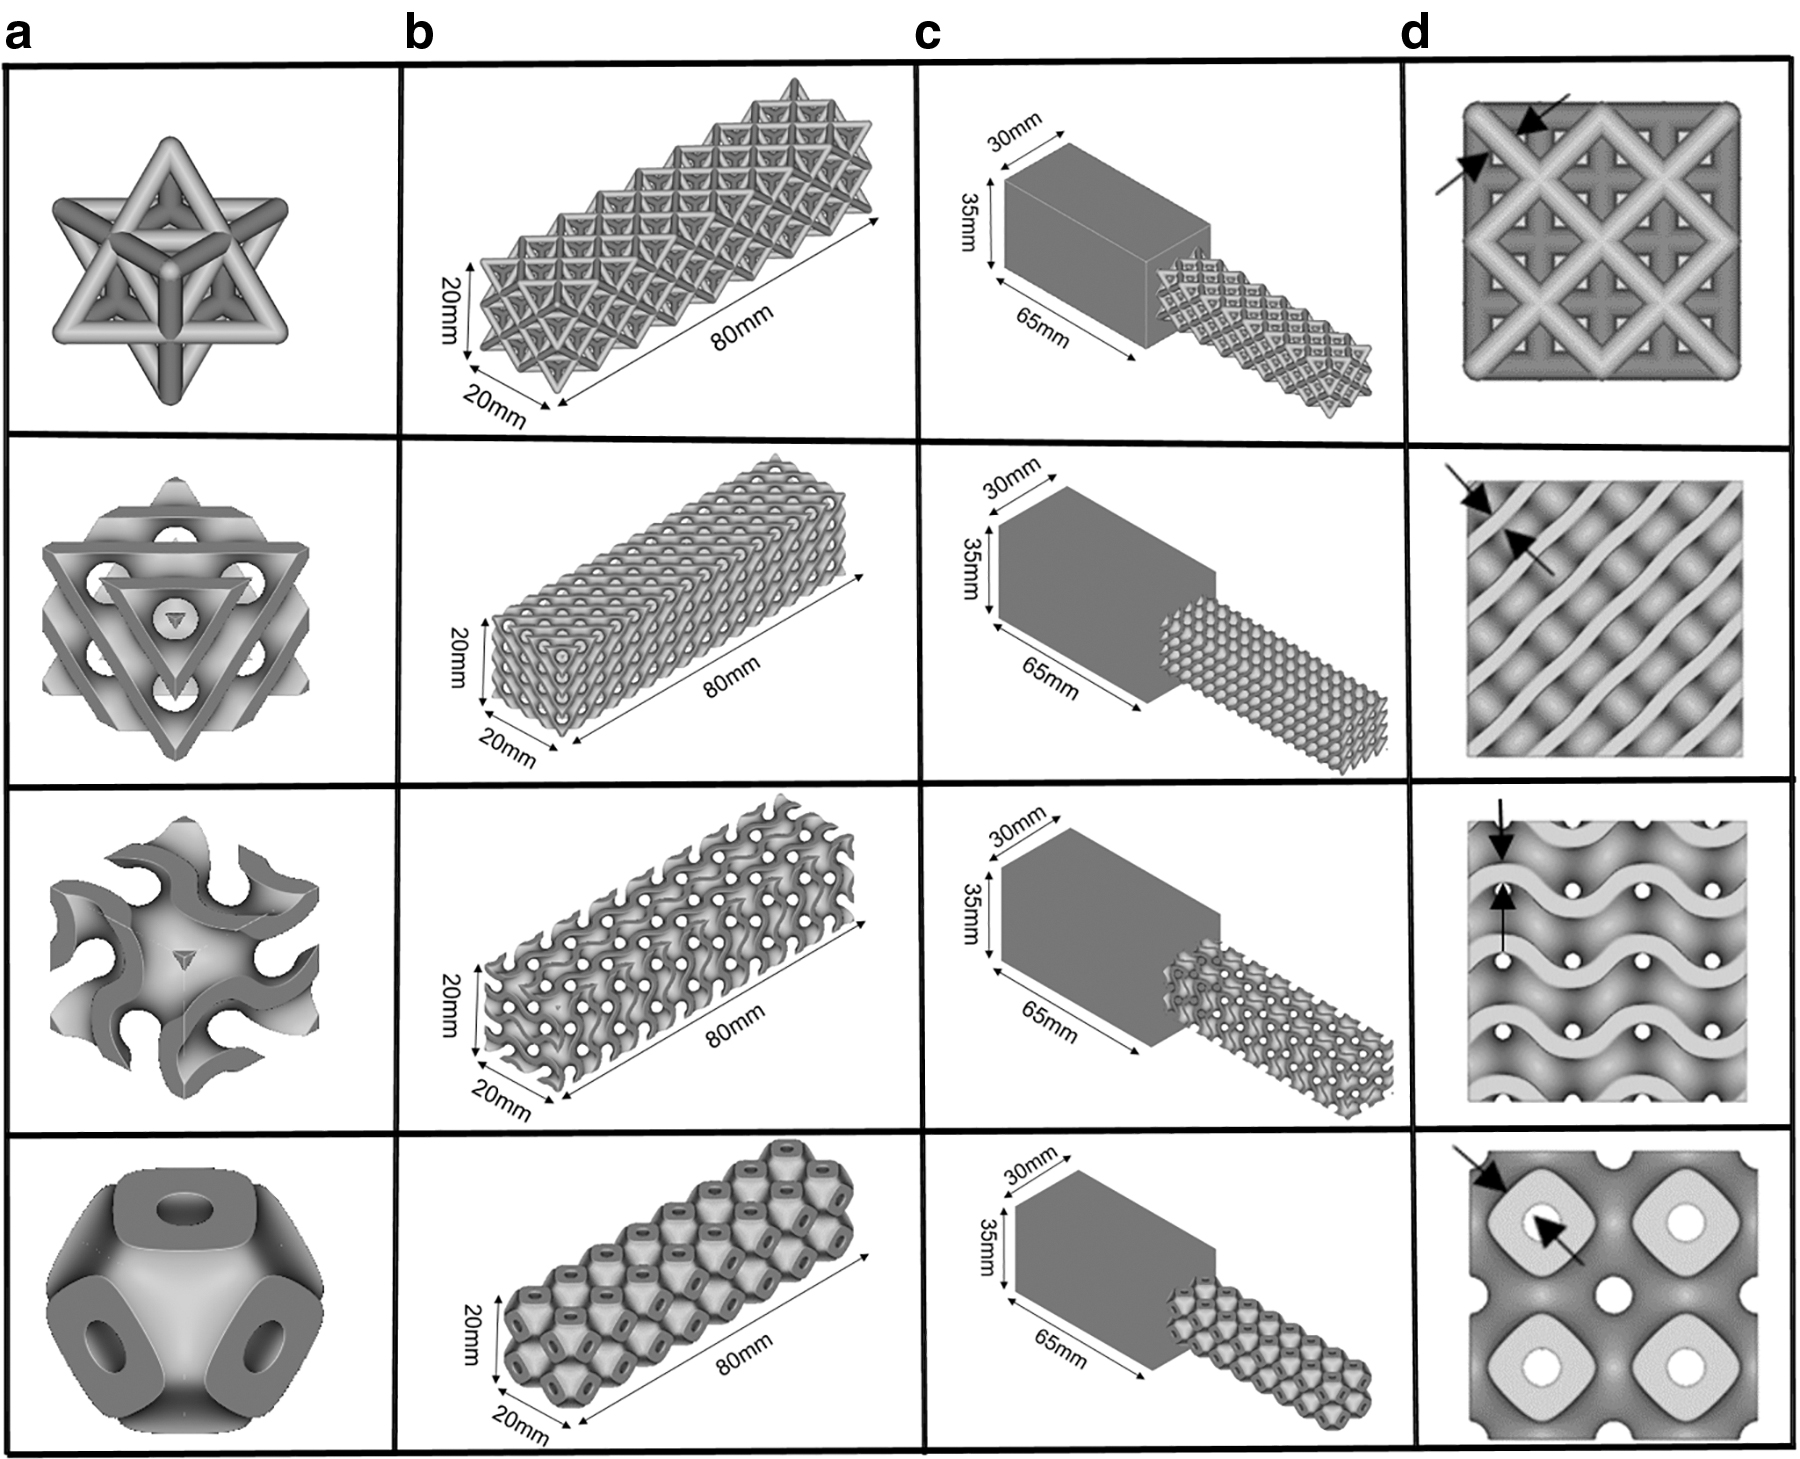
It uses implicit modeling techniques to create structures that allow very rapid creation and less space than software that utilizes explicit modeling techniques. In nTopology software, lattice structure can be created both surface-based and beam-based in Cartesian, cylindrical, and spherical configurations. For this study, three surface-based TPMS structures, namely Gyroid, Schwarz-D, Schwarz-P, and a beam-based structure Octet-truss were created inside a fixed design space of 20 × 20 × 80 mm with a unit cell size of 10 mm. The goal was to keep the mass constant by varying the thickness of the lattices. The mass was kept constant at 13 g and the corresponding thickness of the lattice came out to be 2.06, 1.73, 1.17, and 1.98 mm, respectively.
The surface-based lattices are created by defining the unit cell dimensions, thickness, and type of structure in a predefined design space. Structures such as Gyroid and diamond structures have an unconnected region associated with them. Boolean functions were used, which uses an implicit body scaled and placed in the area where deletion has to be made. On the other hand, for a beam-based structure such as Octet-truss the lattice generated in a predefined space has no thickness; therefore, it is thickened using the thicken lattice command.
Lastly, after creating the lattice structure bodies, a solid box of 65 × 30 × 35 mm is attached at the back of lattice bodies (Fig. 1) using Boolean union function to counter the effects of strains that are generated during clamping. This solid box was used to clamp/fixed boundary condition of the samples while performing experimental/simulation of designed samples. Figure 1 highlights the overall dimensions associated with the design process.
Flow chart of lattice structures unit cell design followed by structure design
Fabrication of experimental samples
The designed samples were 3D printed using polyamide (PA 12) powder, which due to its excellent properties has found use in many industries such as aerospace and automotive industries. The properties of the material are taken from the author's previous study, resulting in true stress and strain graphs for six type IV dog bone specimens made as per ASTM D638-14 are obtained. 30 The linear and non-linear data for material properties were used to conduct simulation in ANSYS Workbench 19.2 and are mentioned in Tables 1 and 2.
PA 12 Material Linear Properties
From Ali et al. 29
PA-12 Nonlinear Material Properties
From Ali et al. 29
In this study, three specimens of each designed morphology were printed using HP Multi Jet Fusion (MJF) 4200 3D printer (HP, Palo Alto, CA). 31 The printer consists of three dual agent print heads, each containing 31,680 thermo bubble nozzles that deposit 10 μm drops of fusing and detailing agent on the build platform with a printing speed of up to 4115 cm3/h. All the samples were printed in the same batch and placed near the centre of the build unit in the same orientation at a distance of 10 mm on top of each other to minimize the effects of printing parameters.
Moreover, a balanced print mode is used for printing to ensure balance between dimensional accuracy and mechanical properties. 32 The specimens' physical dimensions and mass were recorded and compared with the designed CAD models, which show the reasonably good similarity of being within 2 g and 0.4 mm. The difference found in the printed and designed samples can be due to problems that include the thermal variation between successive layers, misprinting of samples, and minimal damage done during post-processing, which could arise due to the geometric complexity of the structures under study.33,34
Experimental procedure
For experimentation of fabricated samples of lattice structured cantilever beams, a fixture was designed with the aim of using it on the ultimate testing machine. As shown in Figure 2, the fixture comprises screws, wing nuts, top plate, and threaded rods used to clamp the beams in position. The fixture body has four holes on the side from which four screws are used for aligning the beam, thus ensuring its alignment while applying the load.
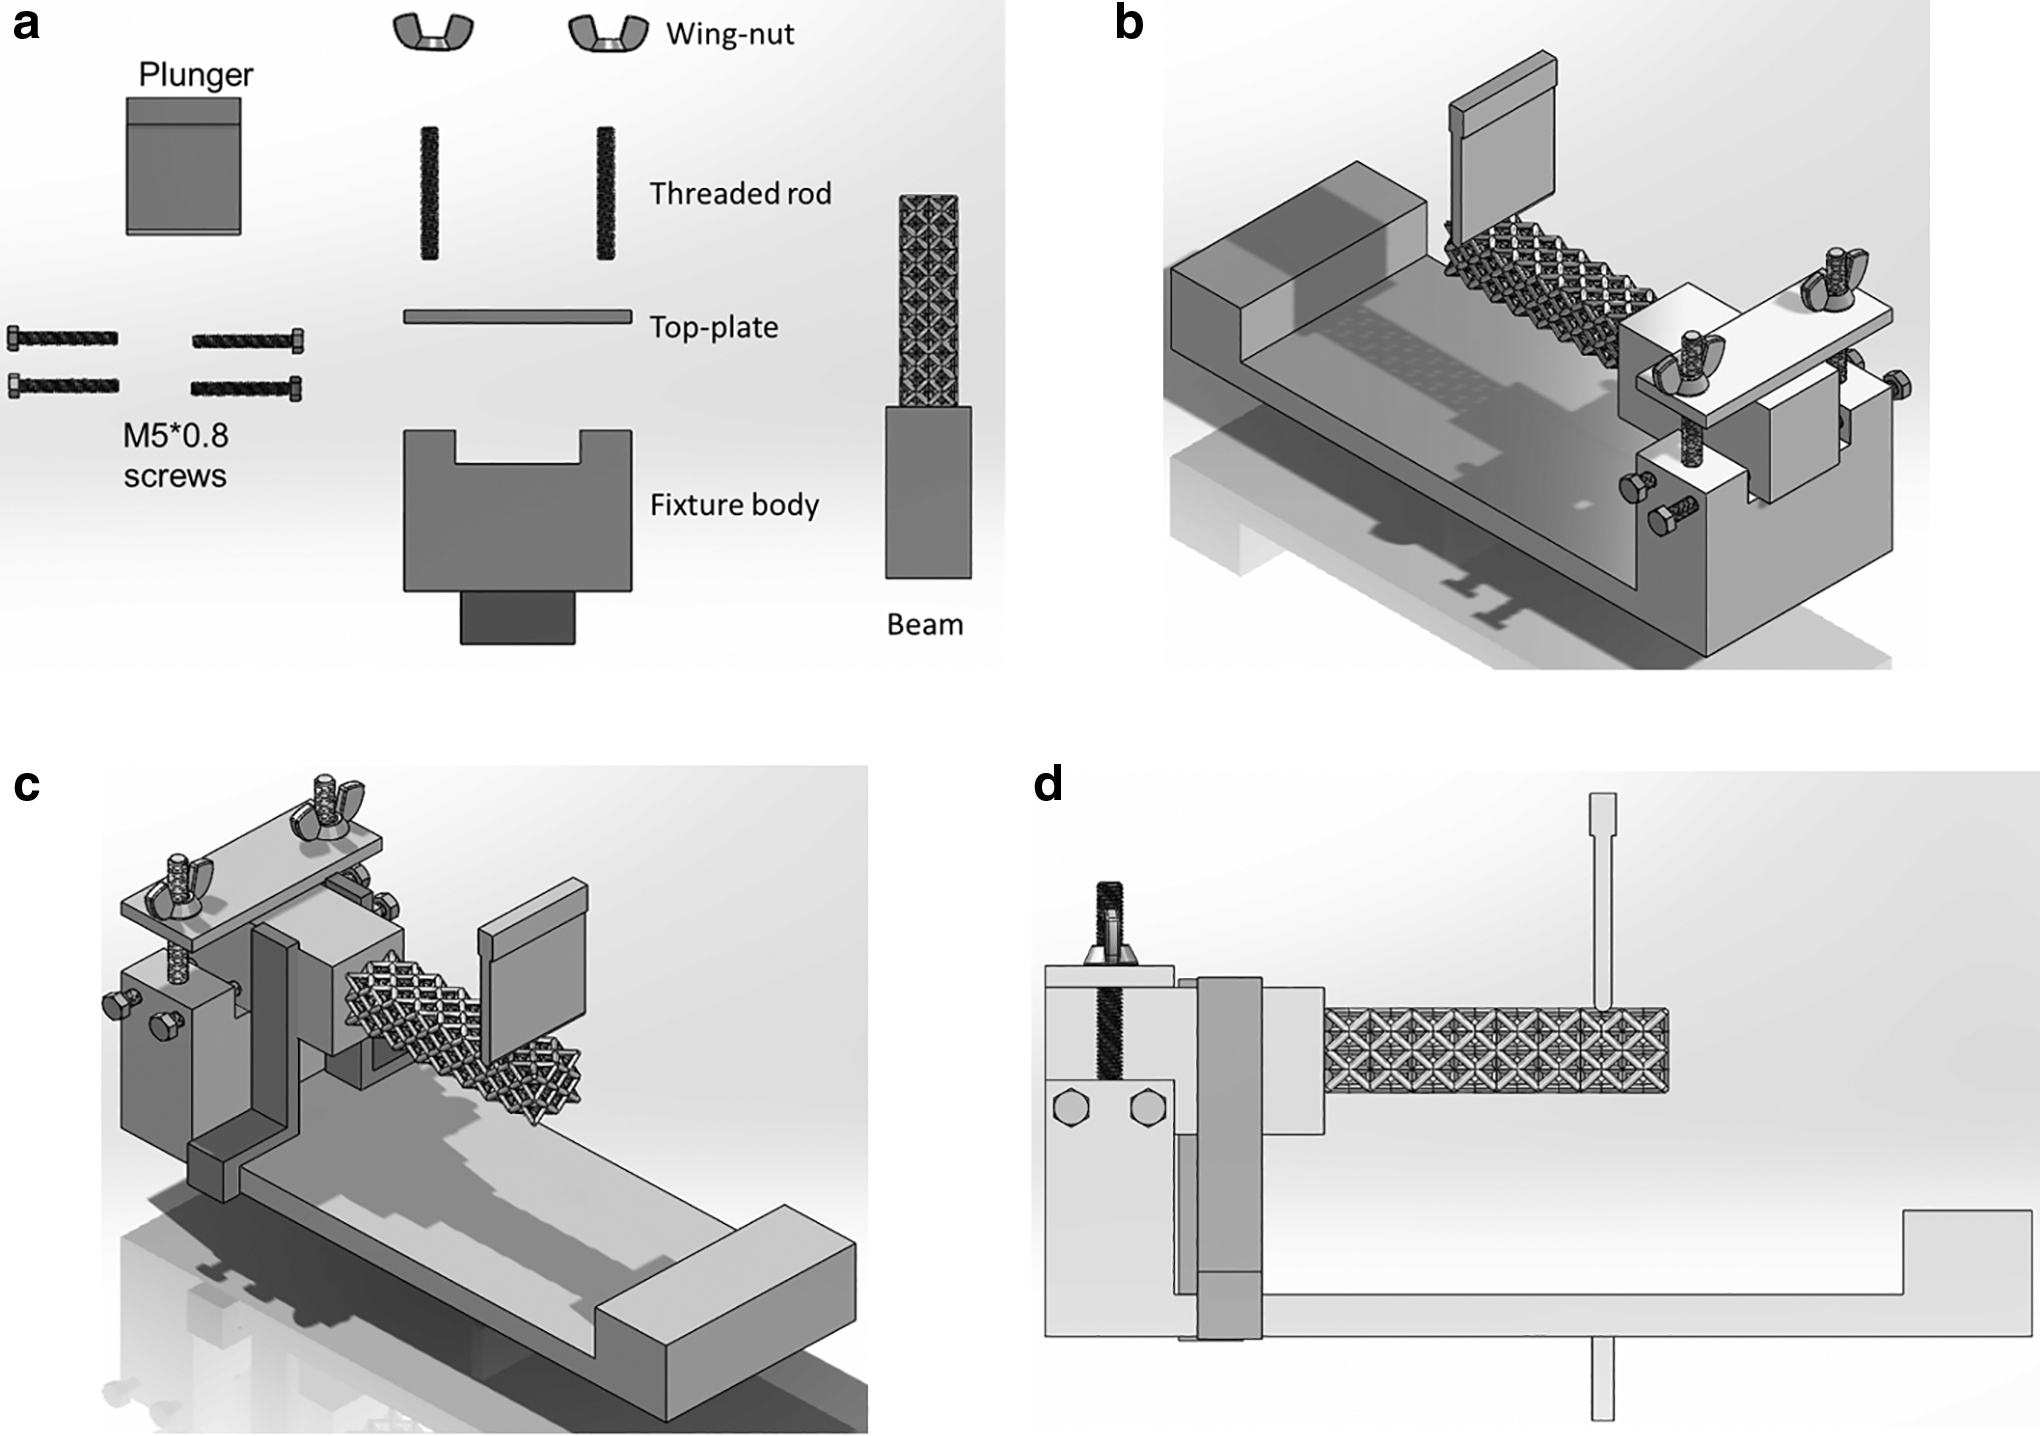
Showing all components and assembly of fixture designed for experimental tests performed on lattice structured cantilever beams.
The two holes on the top are for the threaded rods on which a 5 cm thick top plate is tightened in position with the help of the wing nuts. The extrusion at the bottom of the fixture body bed allows the entire fixture to be clamped by the jaws of the machine. Alongside the main fixture, a few support structures are also used, which help adjust and ensure the beam's alignment inside the fixture body. The cantilever fixture assembly with the support structures is as shown in Figure 2.
To use the fixture, the threaded rods are inserted in the threads on the top and afterward the beam is placed inside the cavity of the fixture body. Using two external supports printed as side supports the beam is adjusted at the center, tightening side screws thereafter (Fig. 2a). The top plate is lowered, allowing clamping from the top. In the case of perfect level, the threads on the threaded rods are the same in both threads and the wing nuts require the same amount of turns.
The side screws are loosened again to allow adjustment of the length using the side supports to avoid any displacement at the sides. Once all dimensions are verified using Vernier caliper, the top plate is tightened using wing nuts along with the side screws. After assembling the beam, the fixture body is inserted in the lower jaws of the MTS Instron testing machine used for experimentation.
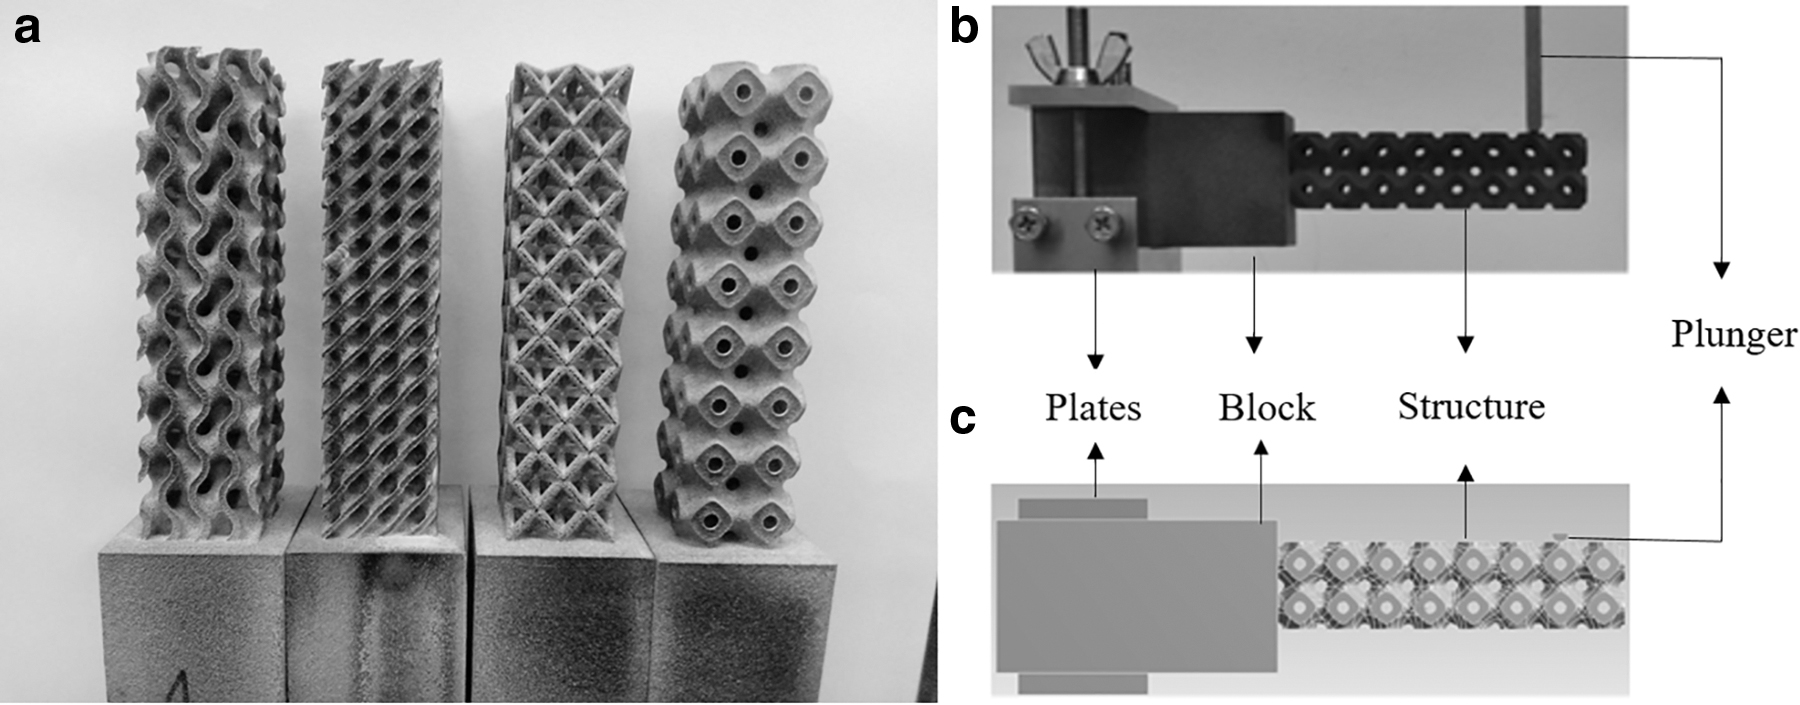
Three specimens for each design configuration were 3D printed for conducting experimental tests. The manufacturability of printed samples can be visualized in Figure 3a. The testing was performed on a lattice structured beam at a 5 mm/min crosshead speed until failure. The complete experimental setup is shown in Figure 3b.
Simulation framework
A static structural FEA module with non-linear simulation was performed using ANSYS 19.2 (ANSYS Inc., Canonsburg, PA) 35 to study the response of the lattice structures and predict the failure mechanism of the structures of present work. The lattice structured cantilever beams were imported into ANSYS workbench as solid bodies, and the assembly of the simulation model was done in ANSYS Design modeler. The beams were meshed with non-linear second-order tetrahedral elements due to the complexity of the structures.
The boundary conditions were applied similar to those in the experimental analysis as shown in Figure 3c with non-linear material and geometric properties for the structures defined as listed in Tables 1 and 2. The properties for the fixture plates and the plunger were similar to those of stainless steel, consistent with the experimental setup. The solid block attached with the structures was fixed between the two plates at the top and the bottom to imitate clamping conditions, restraining motion in all six degrees of motion as shown in Figure 3c.
On the other hand, the plunger was restrained in five degrees of motion (translation and rotation in x- and y-axis, and rotation in z-axis), allowing displacement only in the z-axis to apply force. Slipping between the plunger and the structure was restrained by defining the frictional contacts with a friction-value coefficient of 0.2. 36 The properties of stainless-steel material for fixture plates and plunger were taken from the ANSYS materials library, imitating the actual experimental configuration properties.
Results and Discussions
Flexural properties of lattice structured cantilever beams in terms of flexural deformation, flexural stiffness, flexural stress, and flexural modulus were analyzed and discussed. The values for area MOI for the structures are also discussed, and a comparison is given between the values obtained using area MOI values of these structures and by using the value as that of the bounding box found in the literature. 15 Further, the failure mechanism of these structures is discussed by comparing the experimental observations with the simulation validations.
Area MOI
Due to the unique distribution of the material in the form of lattice structures, the cross-section area of lattice structured cantilever beams varies along the longitudinal axis (Fig. 4); consequently, the corresponding MOI along the direction also varies (as illustrated in Fig. 5) in the form of a sinusoidal wave. Therefore, it is crucial to calculate the lattice structures' varying MOI to determine the aforementioned flexural properties.
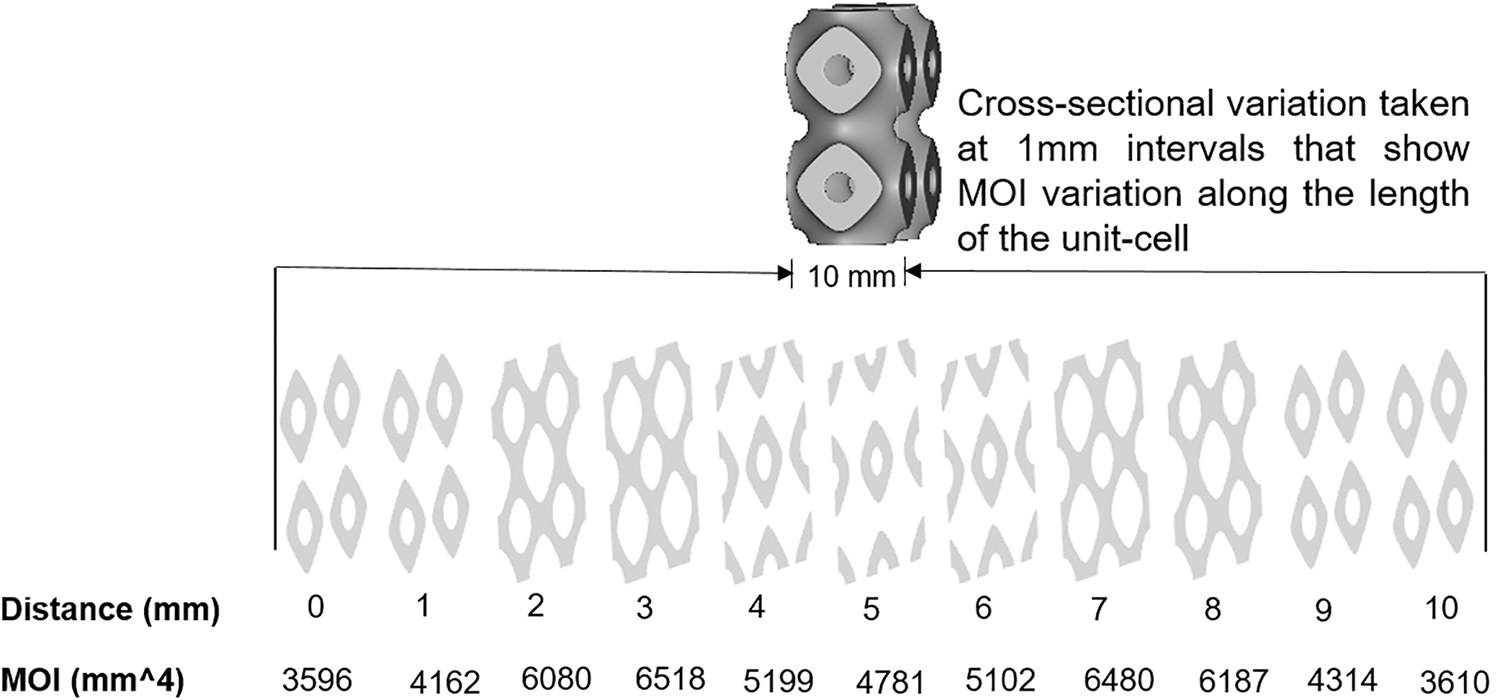
Illustration of slicing a unit cell along the length to determine the variation of cross-section area and corresponding MOI. The same procedure was used for other structures analyzed in the present study. MOI, moment of inertia.
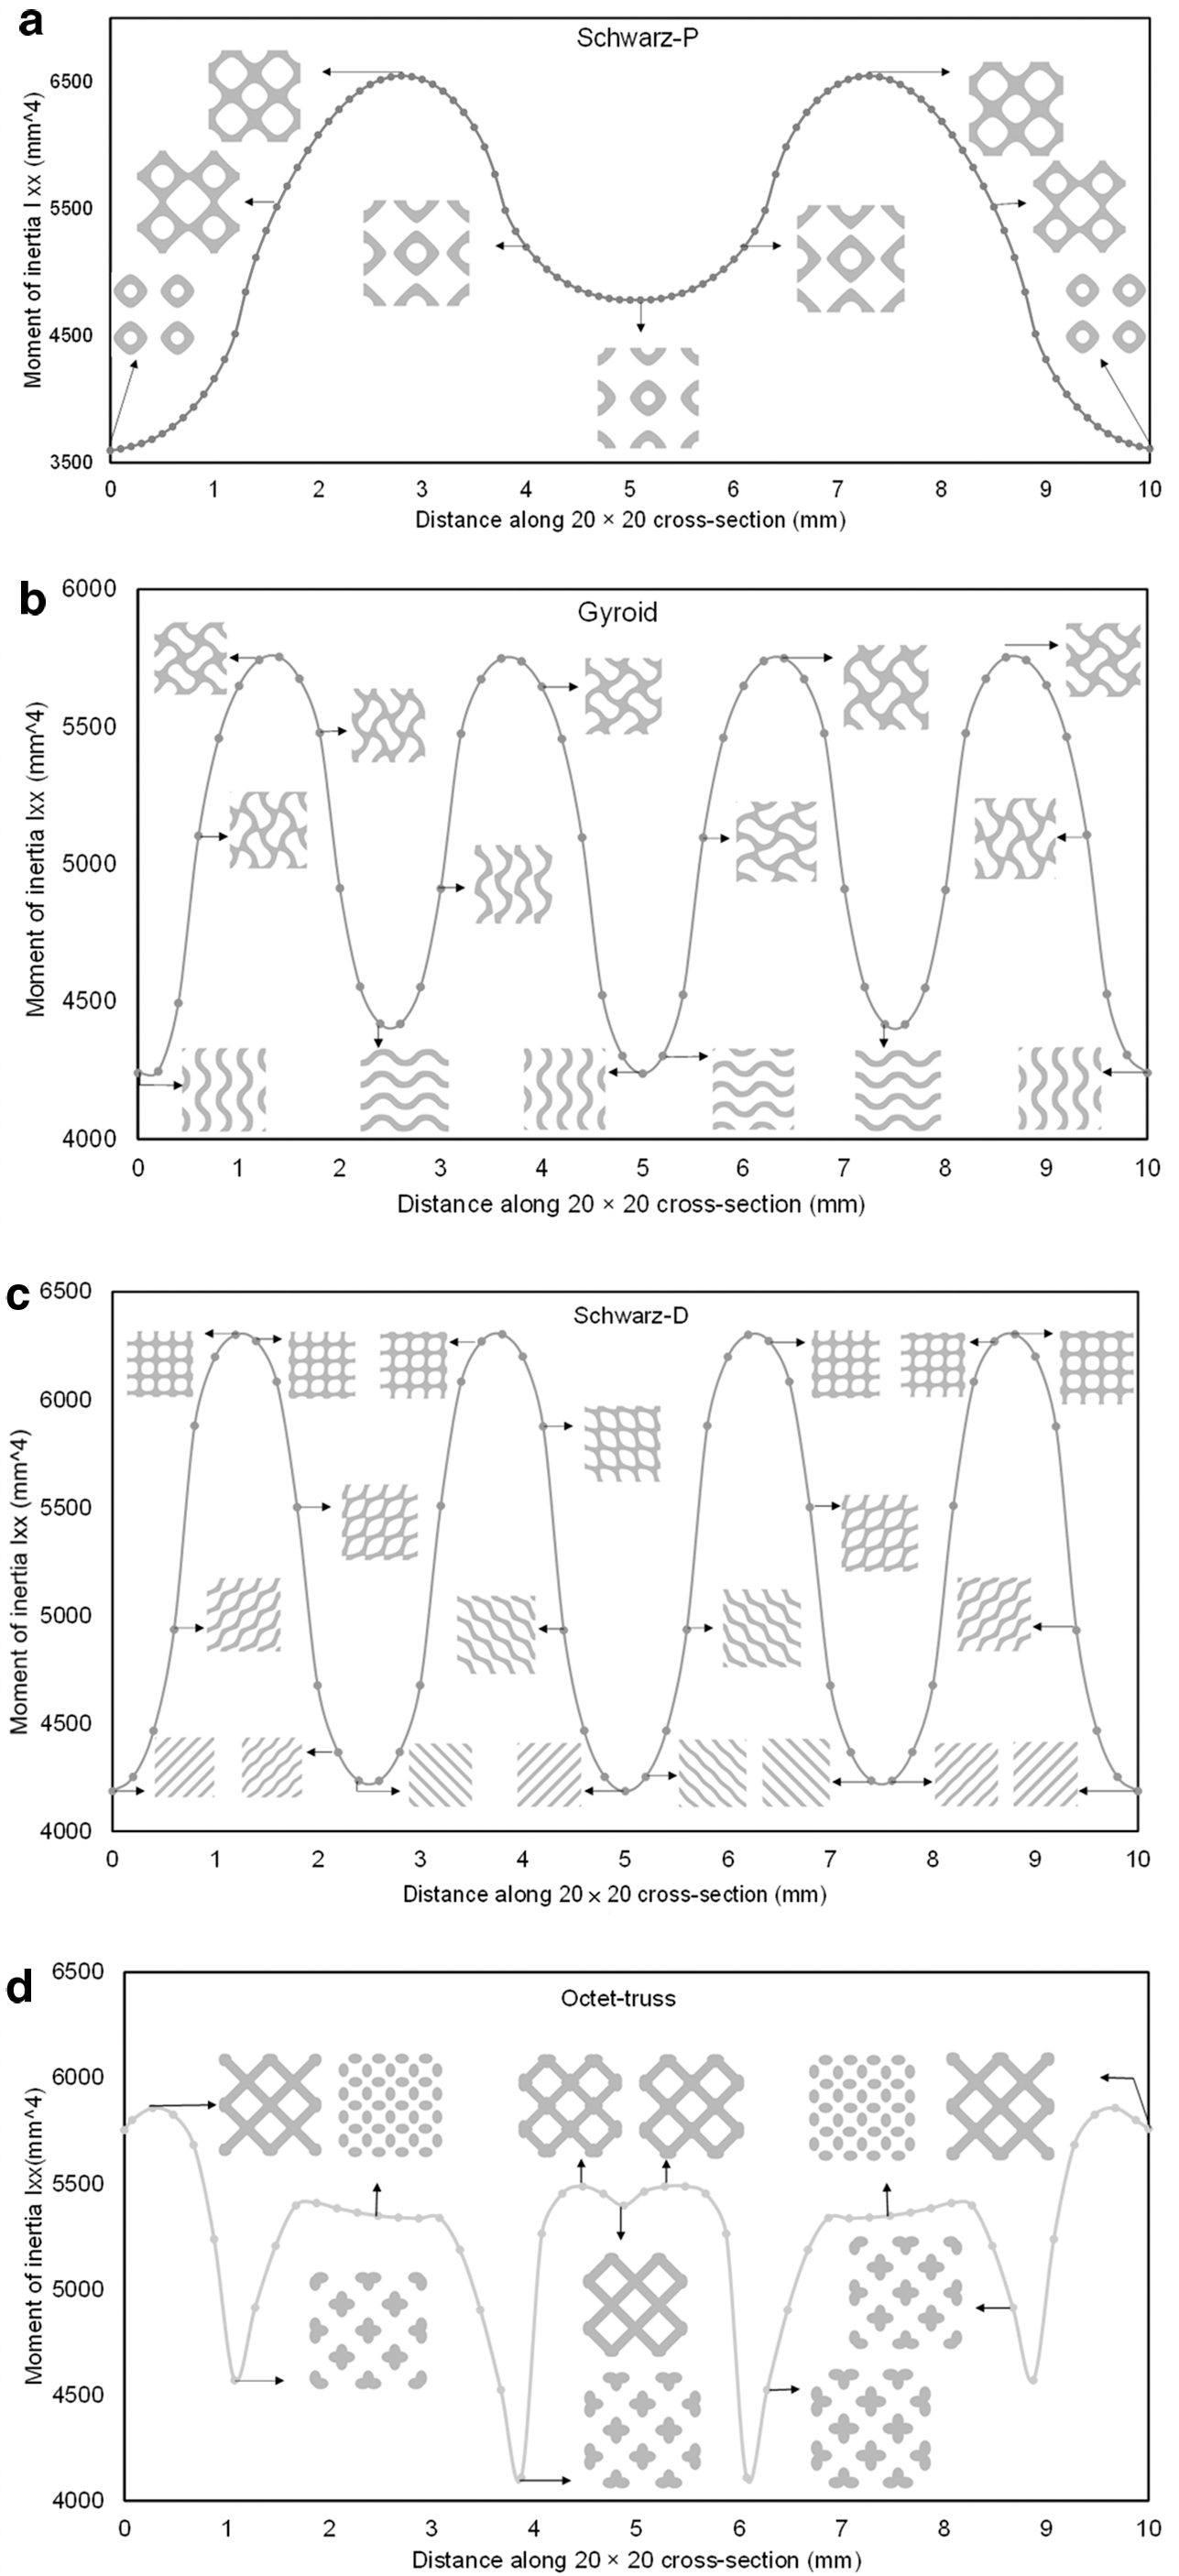
Effect of cross-section on the value of MOI across the length of designed and investigated unit cells
The lattice structured beams are imported into Solidworks software, 37 and their cross-sections are analyzed at 0.2 mm to determine the value of the MOI of the cross-sections. In the Schwarz-P structured beam with a cross-section of 20 mm by 20 mm, the value of MOI starts from 3590 mm4, the lowest along the length of the unit cell. The value continuously increases, peaking at about 6539 mm4 at 2.8 mm. The values start to decrease due to changes in cross-section, bringing it to a low point of 5780 mm4 at the mid-point of the unit cell.
The values then start to increase similar to the trend seen before the mid-point of the unit cell. This increase is due to following the same trend but with a 180-degree shift in the orientation of the cross-section. The values increase to 6539 mm4 at 7.8 mm, after which the values fall back to 3590 mm4, which marks the end of the unit cell. The variation of cross-section area and the corresponding MOI value across the length of the unit cell is depicted in Figure 5a.
In case of the Gyroid structure, the lowest point of MOI was on the start of the unit cell at 4241 mm4, the lowest among the TPMS structures followed by peaks at 1.4 mm to 5753 mm4, after which it starts to drop bringing a low point at 2.5 mm with the value of 4410 mm4 with a rotation of 90 degrees in the clockwise direction that could be seen in Figure 5b. The MOI then increases along with rotation in the cross-section, peaking at 3.6mm and then falling to 4241 mm4 at the mid-point of the unit cell with the cross-section rotated 180 degrees.
The trend continues with rises and falls, following a similar trend but with rotated cross-sections. Within the unit cell, the MOI rises to a peak of 5753 mm4 four times with two intermediate low points at 2.5 mm and 7.5 mm and three lowest points occurring at the start, middle, and end of the unit cell. The variation of the MOI in the Diamond structured beam also follows the same trend as that of the Gyroid beam but with higher peak values and lower trough values as shown in Figure 5c.
Unlike TPMS structures, the octet-truss shows three distinctive regions with sharp drops and near constant peak regions. The changes in structural topology cause sharp drops occurring at near 1 and 4 mm with a sudden increase in the value right after. The unit cell repeats after the mid-point, and the same trend could be seen afterward (Fig. 5d). The maximum value of 5857.33 mm4 can be seen in Figure 5d, along with a value of 4109.57 mm4 as minimum.
To understand the variation of MOI across the length of the lattice structured beam, a polynomial regression is run on the values up till the end of the unit cell to formulate an equation that defines the trend and an average value from the values as mentioned in Table 3 is used in the following section to find the flexural properties.
Equations Representing the Principal Moment of Inertia Variation of Each Lattice Structure Investigated in the Present Study
Flexural deformation
The deformation behavior under the influence of force exerted by the plunger on the different lattice structured beams held inside the fixture is discussed here. The behavior exhibited by these structures is shown in the form of load versus deformation graphs for all the structures, as shown in Figure 6. At the same relative density, the Schwarz-D structure exhibits the highest load-bearing capacity followed by Schwarz-P, Gyroid, and then the Octet-truss structure.
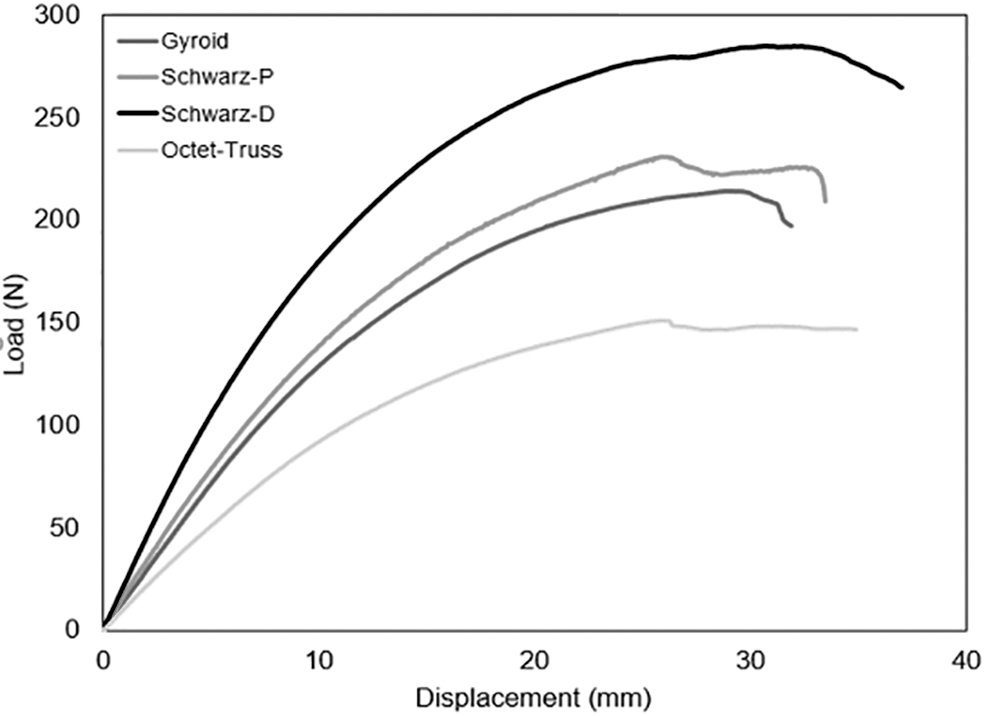
Experimental load versus displacement curves of lattice structured beams.
The better performance of TPMS structures is due to the increased surface-area-to-volume ratio, which aids in better transmission of loads than the beam-based octet-truss structure where only beams carry load to the nodes from where the load is passed to the entire structure. Figure 6 illustrates the ductile behavior of all the structures through transitioning from linear to non-linear region depicted by the flattening of the curve at higher displacement values. At higher deformations, the value of force drops for the TPMS structures, but the deformation occurs, which indicates cracks that weaken the structure, forcing a drop in the value of force before failing.
Similarly, for the Octet-truss structure, the structure also fails with a drop-in load, resulting from buckling that causes beams to snap off the middle instead of the joint. The maximum load and displacement incurred by the structures is summarized in Table 4.
Maximum Load and Displacement of Lattice Structures Investigated in the Present Study
Flexural stress
Lattice structures are porous structures defined within a fixed volume. Due to porosity and unique structural topology, each cross-section differs, leading to different values of MOI. The cross-sectional changes and their orientation with respect to the loading also determine the type of bending occurring in a cross-section, symmetric or un-symmetric bending. The values of MOI taken in literature correspond to that of the bounding box, which accounts for a value far greater than the lattice structure MOI at that particular cross-section.
Therefore, the flexural stress is calculated for each lattice structured beam using the area MOI value found by taking an average of values taken at 0.2 mm cross-sections. The cross-sections of Schwarz-D and Gyroid structures are un-symmetric and so they have a product of inertia term in them. Therefore, to calculate flexural stress, the MOI values in both Ixx and Iyy are evaluated, whereas the cross-sections for Schwarz-P and Octet-Truss show minimal values of the product of inertia term, which might be present due to conversion from one software to the other and so are considered to have symmetric cross-sections. The cross-section from each structure is taken, showing how the symmetry of each structure is relative to the loading direction in Figure 7.
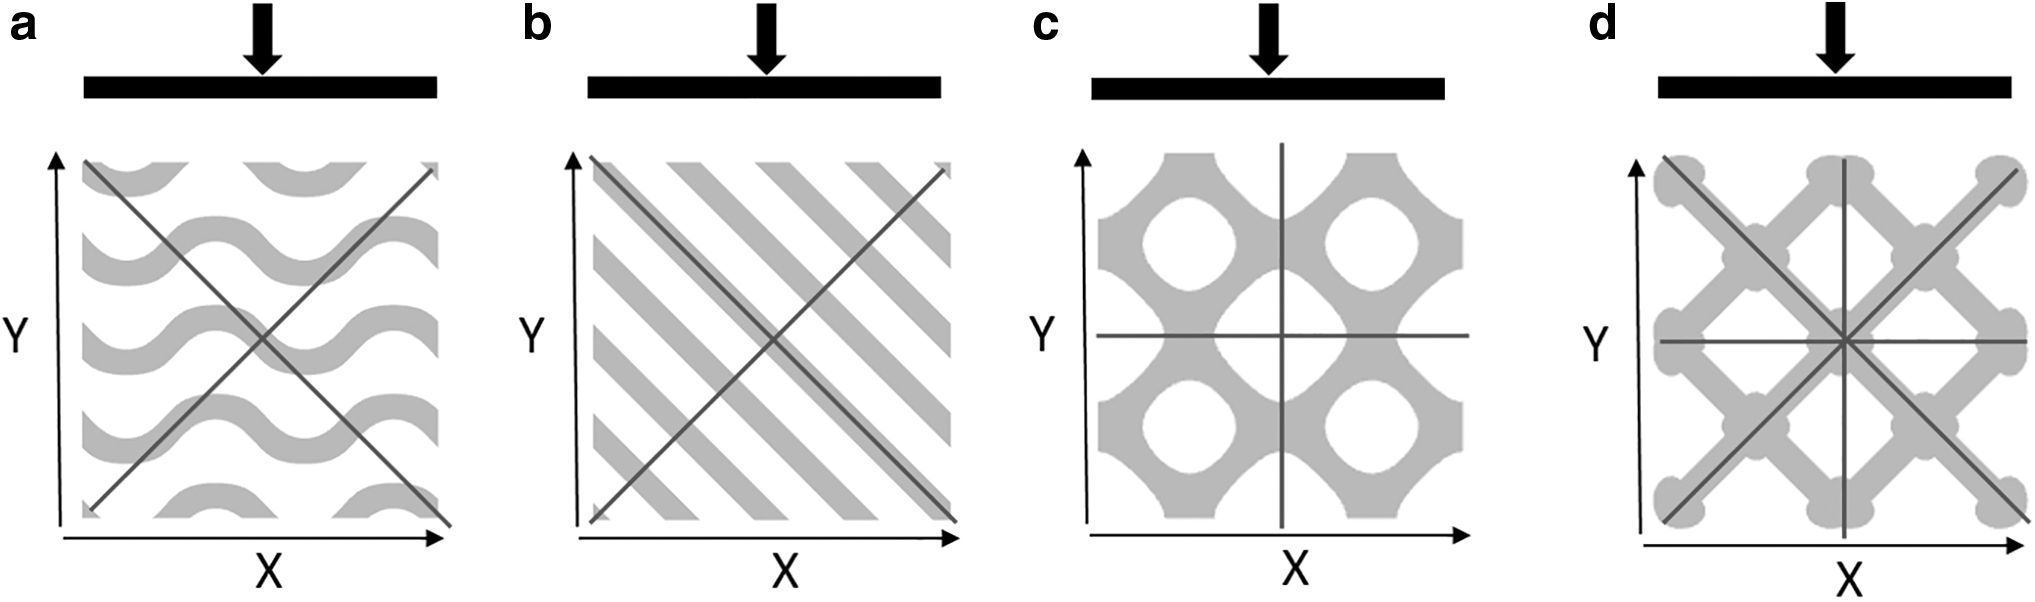
Cross-sectional symmetry under loading
The values of MOI for all the structures are taken to be principle MOI due to the case of unsymmetrical loading, which arises due to a mismatch of symmetry in the loading direction. Equations 2 and 3 are used to convert the MOI of the cross-section to principle MOI, which is then used to calculate flexural stress using Equation 1 for Schwarz-P and Octet-truss structured beam due to the symmetric cross-section. For Schwarz-D and Gyroid, Equation 4 is used due to an unsymmetrical cross-section in the direction of loading.
The cross-sections calculate the bending stress; the MOI values are converted into principle MOI due to un-symmetric cross-sections along the principle axis for the Schwarz-D and Gyroid structured beams. The value obtained from this is then compared with the value that comes by using the value of the bounding box, as shown in Figure 8.
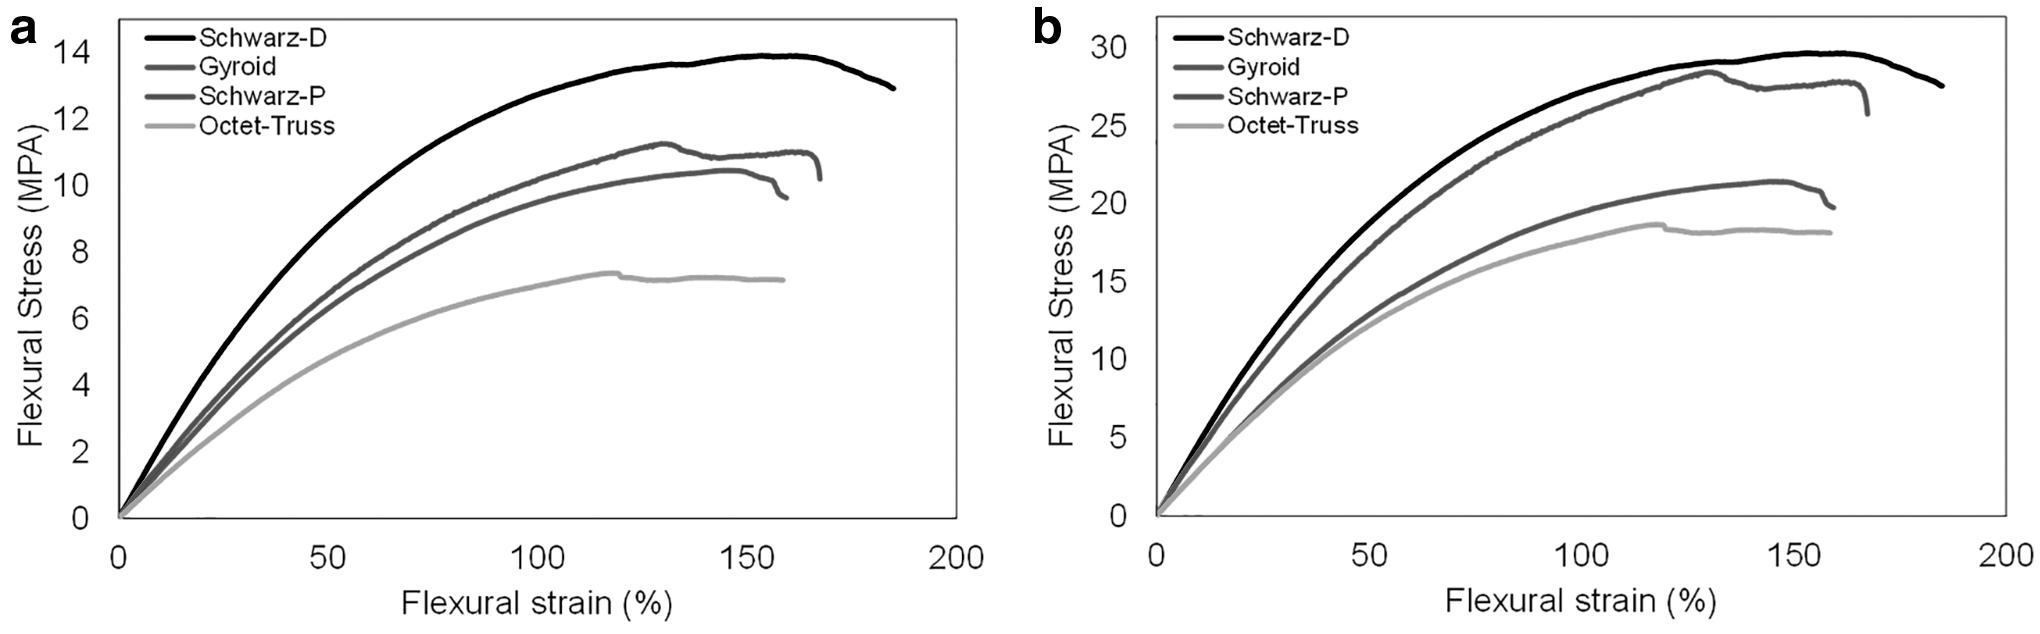
Flexural stress versus flexural strain
Symmetric bending
Un-symmetric bending
All of the beams exceed more than 100% strain during testing, and the failure occurs between 140% and 180% starting with the Gyroid structured beam and ending on the diamond structured beam. It can be seen that using the value of MOI of the bounding box results in a value far lesser than that used if an averaged-out value is taken for the structures. The graphs show a difference of more than 2.5 times the value calculated using the MOI of the bounding box.
The maximum flexural stress was bore by the diamond structured beam of 35.1 MPa using calculated values of MOI against 14 MPa found if using MOI of the bounding box. On the other hand, the least stress was found out to be in the Octet-truss beam of 17.4 and 7.6 MPa.
Energy absorption of structures
The area under the stress-strain graph shows the energy absorbed per unit volume of a material. Integration of the area until the yield point results in the material's resilience, whereas integrating till the point of fracture gives the modulus of toughness. The diamond structured beam has the highest modulus of resilience and toughness as it stores the maximum amount of energy of 41.52 J/mm3, whereas the octet-truss structured beam stores the minimum amount of 21.65 J/mm3 before failing. Moreover, the flexural modulus of the structure measures the structure's tendency to resist bending, which also shows that the structure with the highest amount of stored energy shows the highest amount of flexural modulus.
The values for both energy absorption and flexural modulus of structures are calculated using both the averaged-out MOI values for the structures, and the value obtained from the bounding box is summarized in Table 5.
Toughness and Flexural Modulus of Lattice Structured Cantilever Beams Determined Using
Method (a): Averaged MOI of the lattice structure.
Method (b): MOI of the bounding box.
MOI, moment of inertia.
Finite element analysis
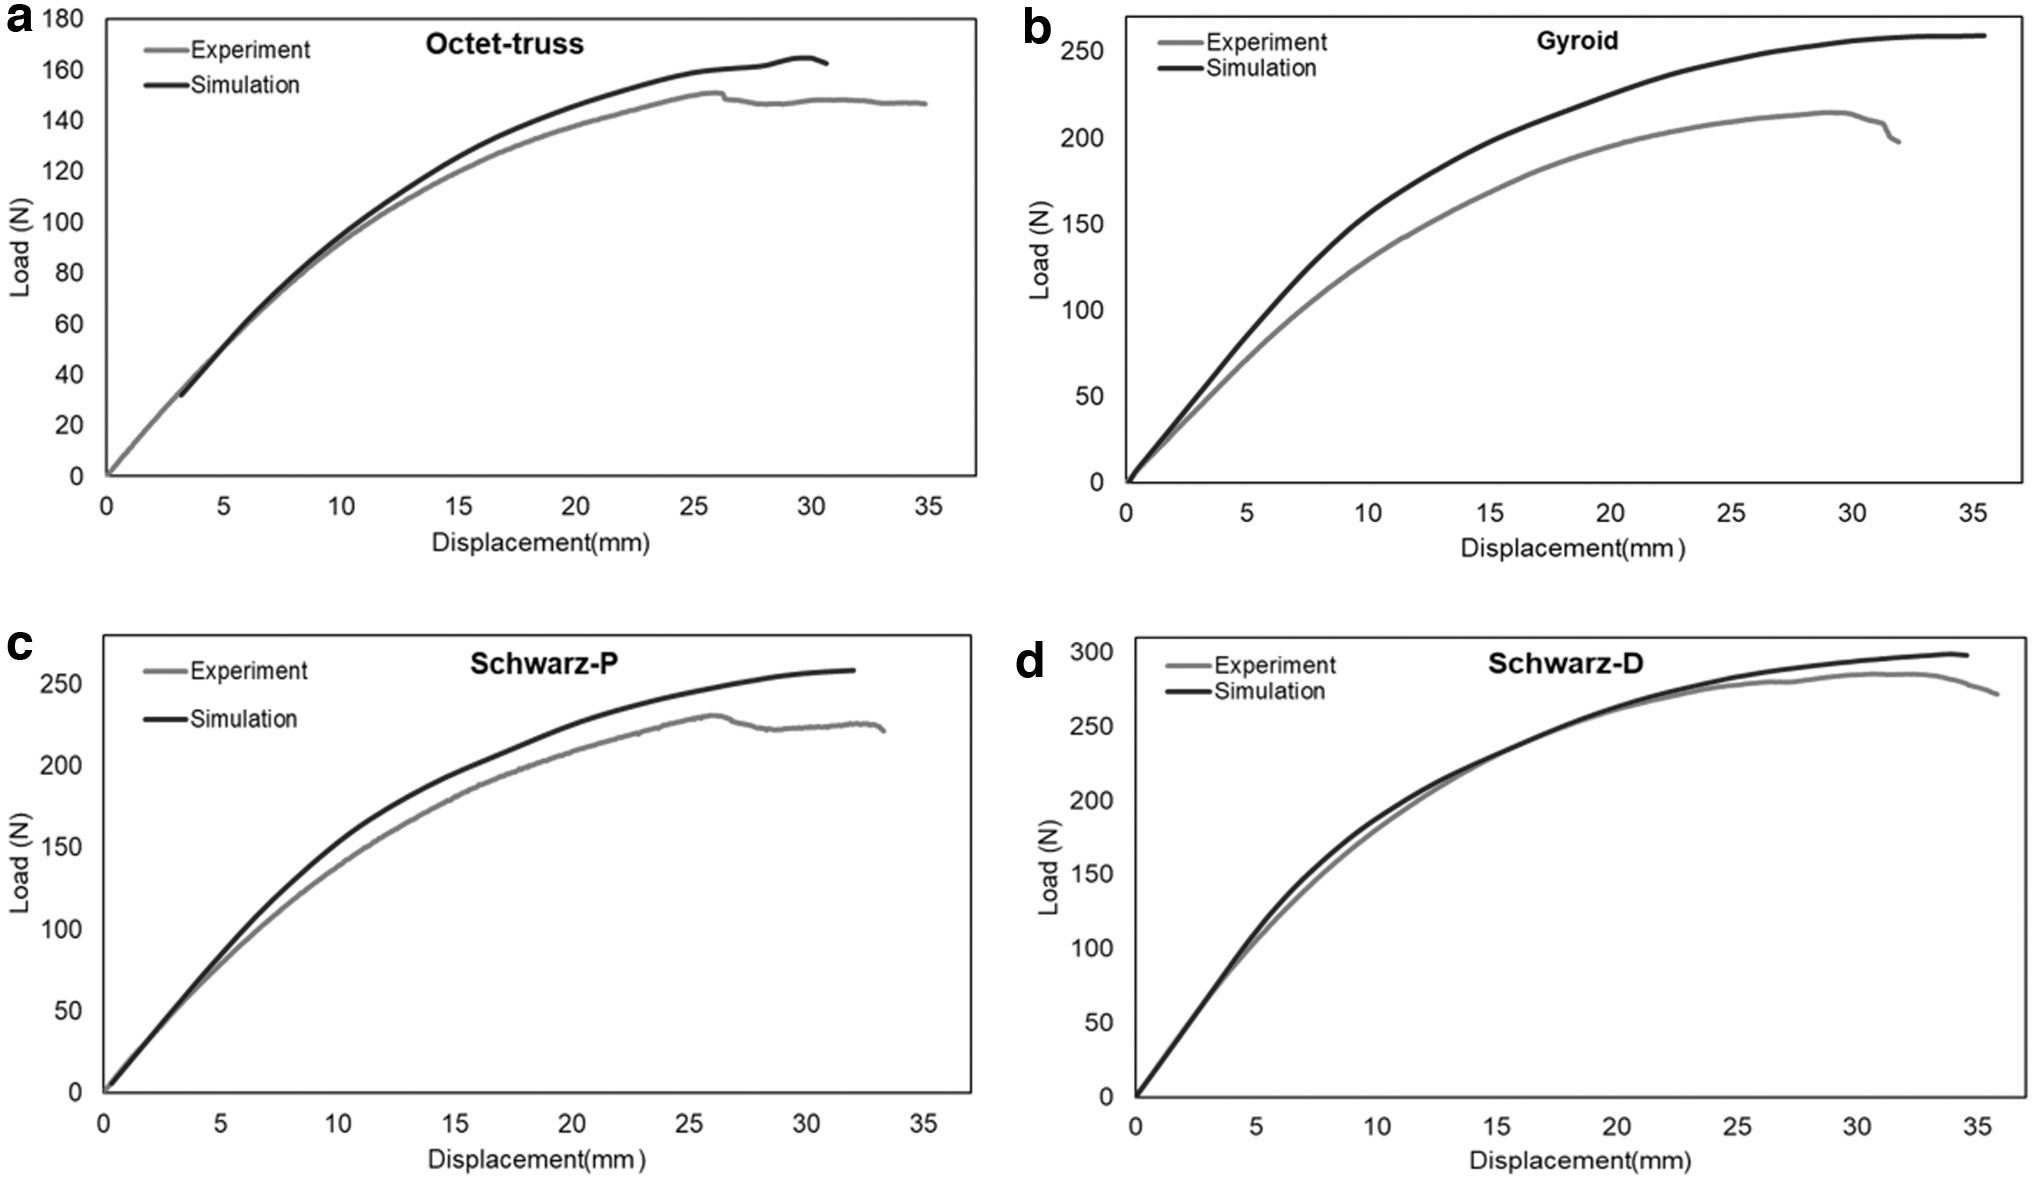
As shown in Figures 9 and 10, the figures and plots show a good match between FEA and experimentation as both follow a similar trend when subjected to loading. The load versus deformation graphs for all the structures in the linear region are nearly identical, with deviation being found as the structure starts to transition to elastic-plastic state and then plastic state. The simulation results slightly over-predicted the experimental results.
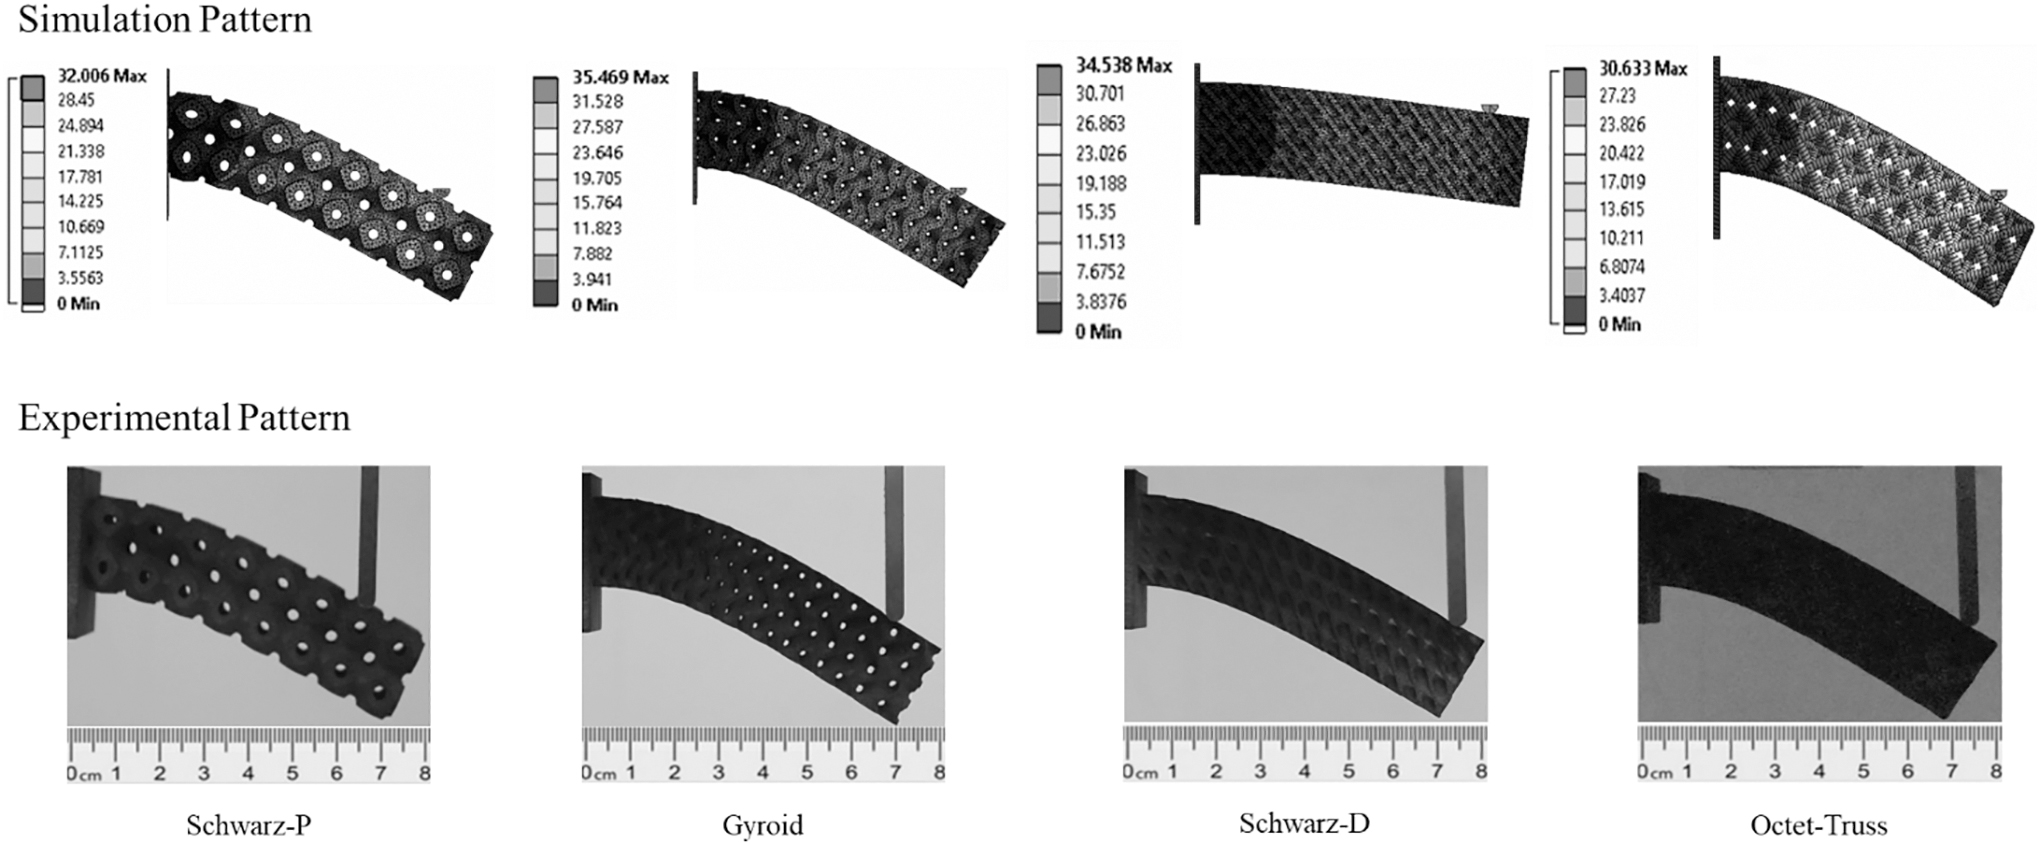
Comparison of experimental and FEA of deformation of structures.
Comparison of experimental and simulation results showing close agreement
Even though the results matched in the linear region, some deviation could be seen in Figure 9 in the non-linear region where the deviation in the peak load for Gyroid and Schwarz-P structured beams was the highest amounting to 16.2% 12.7%, respectively. The difference in the results may be due to the effect of boundary conditions, variability in samples due to printing, and incomplete powder removal issues due to complex topology of the structures.
The Von-Mises stress distribution of each structure highlights that the stress in each structured beam depends on the topology of the structure, which determines the material distribution. Hence, the flow of stress determines which region fails when the material yielding point in the structure is exceeded.
Failure of structures
The load exerted by the plunger on the lattice structured beam causes tension on the upper unit cells and compression on the lower unit cells with a neutral axis forming between them. All of the samples were observed to develop cracks in the top unit cells, which indicates that the tensile yield strength of the material was exceeded. For the Schwarz-P structured beam, stress can be seen to flow across the unit cells with stresses higher at the interface of the two-unit cell.
Moreover, maximum Von-Mises stress can be seen to develop between the block and the unit cells next to it as these are the regions where maximum plastic strain develops. With regards to the failure of the structure, the first crack develops between the block and the first unit cell in the top unit cells, which cause a drop in load-carrying capacity as seen in Figure 11a until final failure. The cracks that start from the top terminate in the lower unit cells, where there is maximum Von-Mises stress being developed due to compression. These experimental observations and FEA simulation co-relation can be seen in Figure 11a.
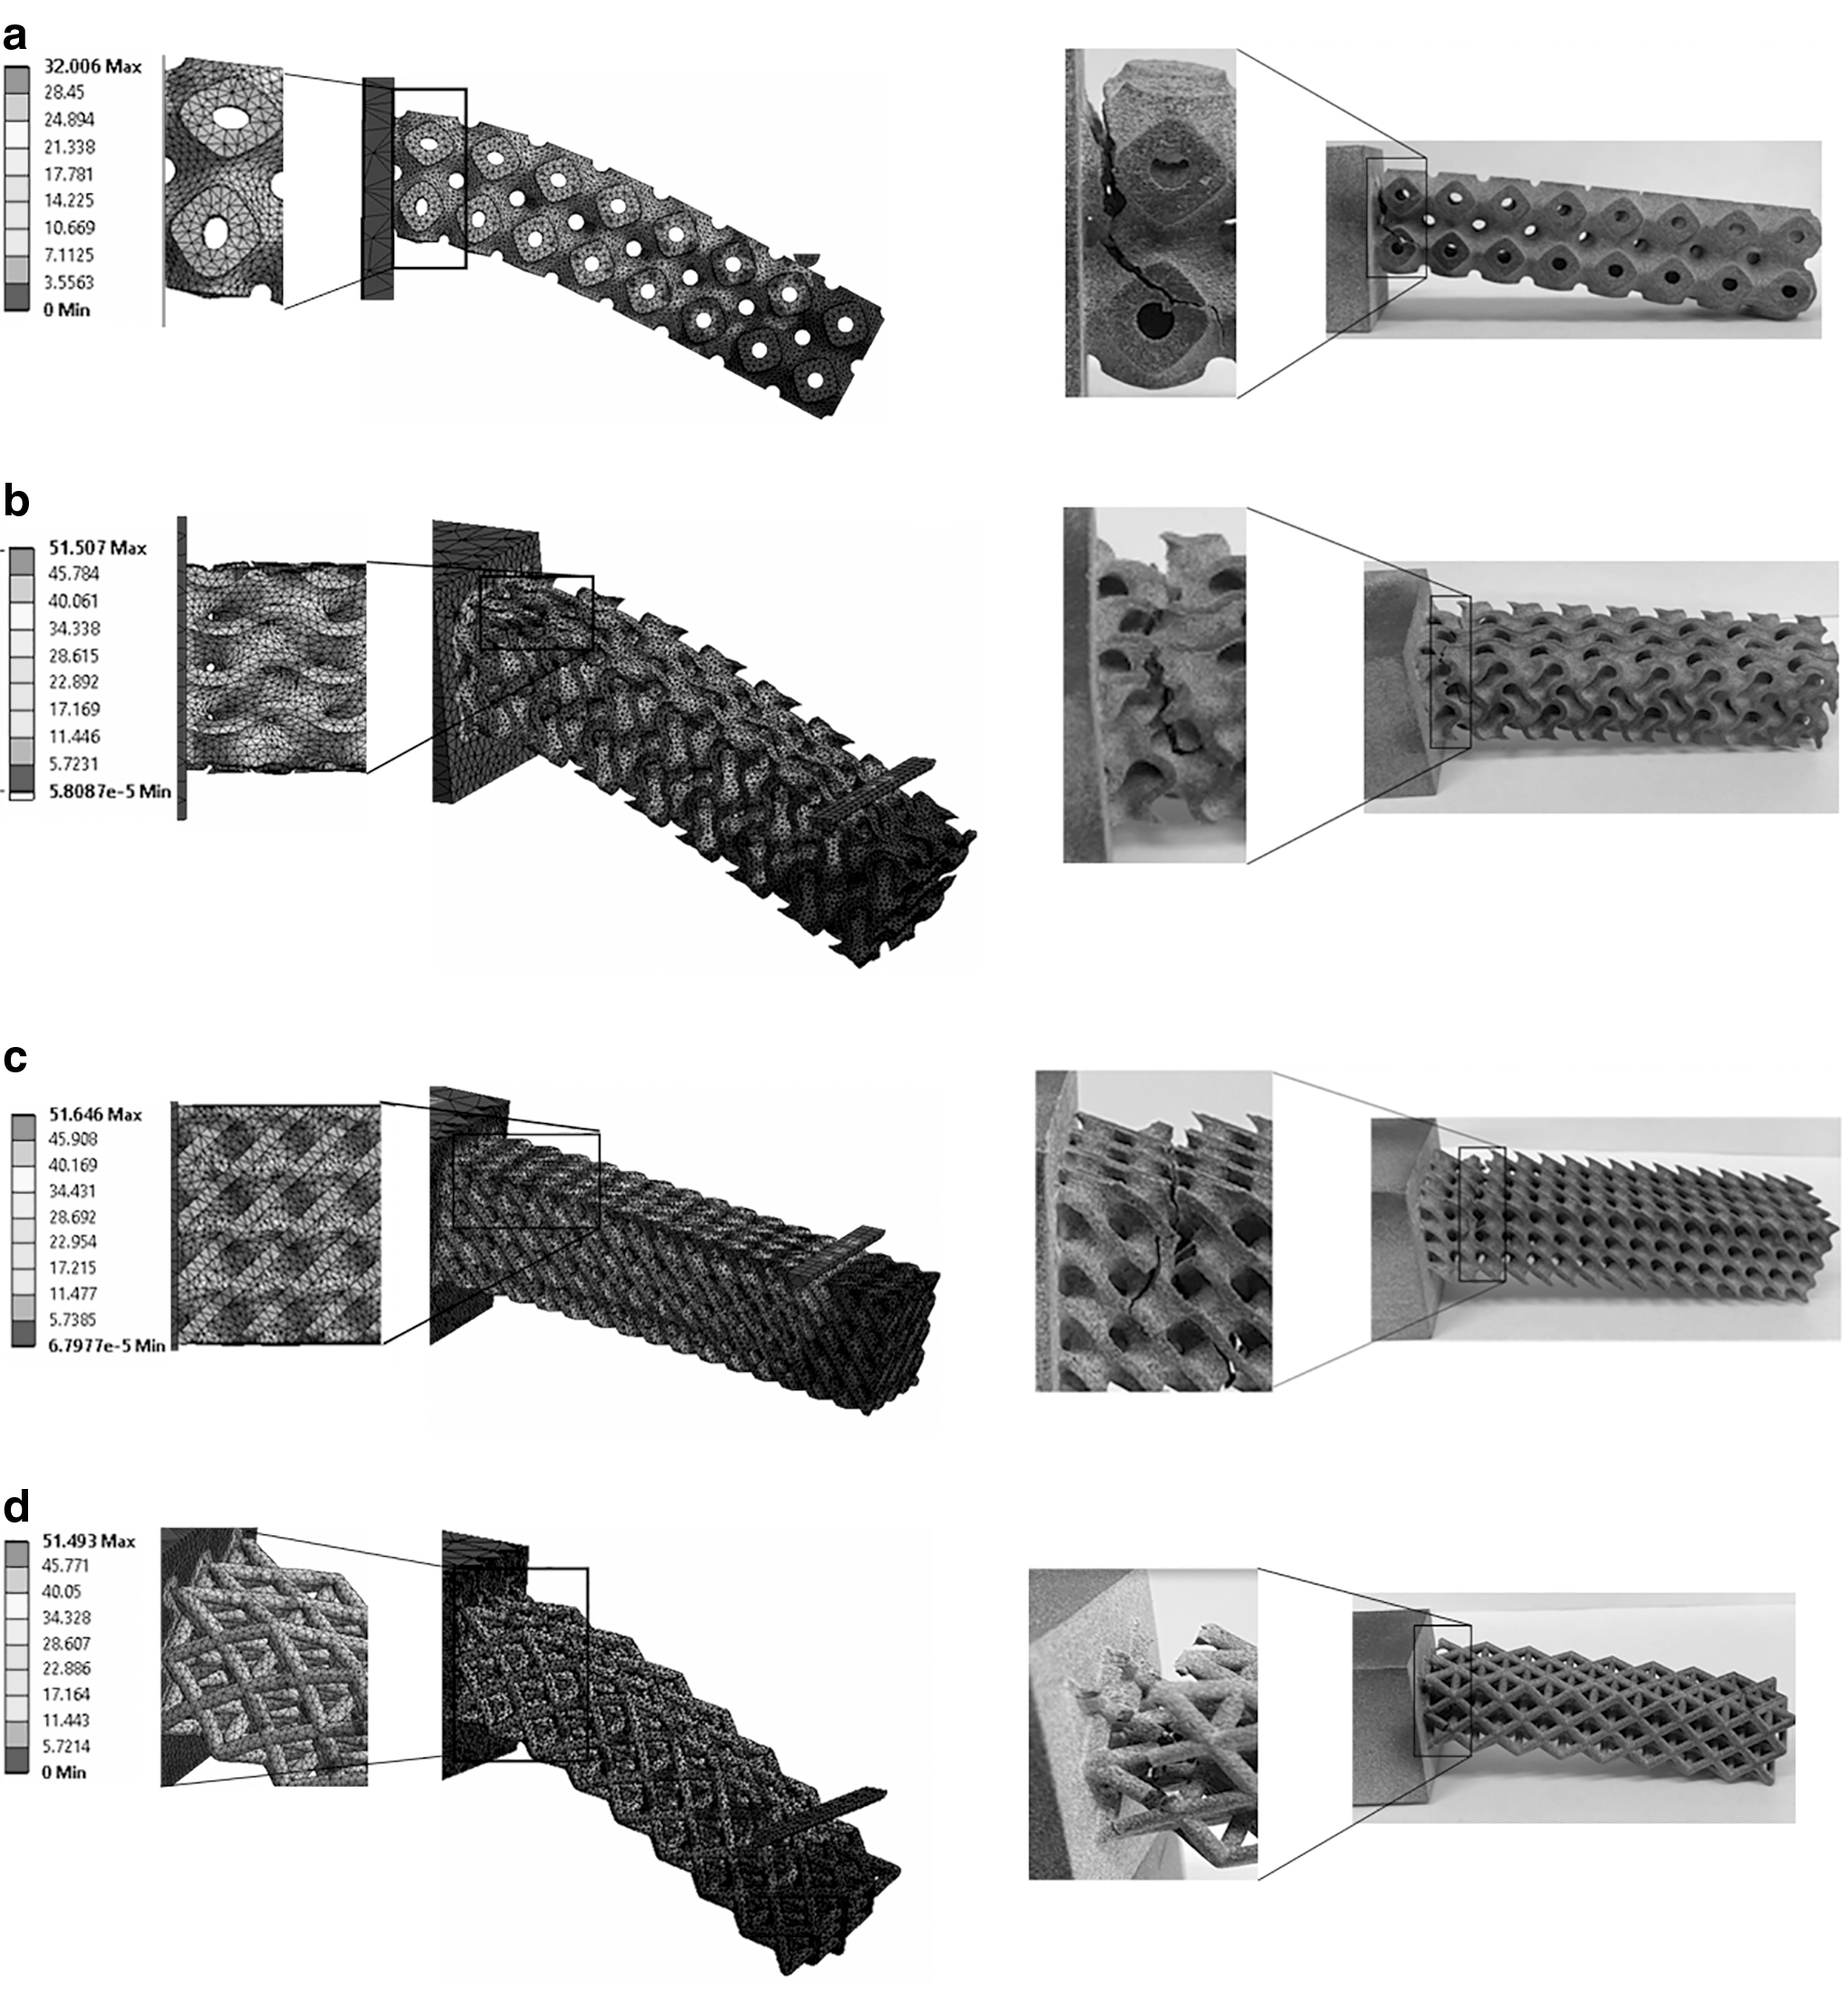
Regions of high Von Mises stress in relation with the failure observed experimentally comparison of experimental and simulation results showing close agreement
The stress distribution for the Gyroid structured and Schwarz-D structured beam shows stresses to alternate between the surfaces, with minimum stresses being at the sides and in the centre of the structure. However, in the case of the Schwarz-D, the flow of stresses is more uniform in alternation than the Gyroid structure with higher stresses near the fixed end of the structure. For both the structures, as cracks start to form drops in load can be seen in Figure 11b, c but unlike Schwarz-P structure these lattice structured beams fail rapidly.
In the Octet-truss beam under load from plunger, there is tension in the beams at the top of the structure and compression at the bottom struts with little forces being transmitted in the beams in between. The beam first shows an elastic behavior showing constant tension-compression ratio at the top and bottom. As the beam deflects from elastic region out to plastic region, the tension-compression ratio changes and buckling becomes a dominating factor at the compressive end.
During experimentation, the effects of buckling could be seen at the compressive end of the beam with failure occurring in between the struts instead of the joints. On the other hand, the top half of the beam facing the tensile force failure of the beam could be seen to occur at the top-most struts as can be seen in Figure 11d.
Conclusion
This study has provided a new insight into testing and evaluating lattice structures to study bending and flexural properties. The response of different unit cell morphologies incorporated in cantilever beams at constant relative density is investigated using experimental tests followed by validation using FEA.
The following essential conclusions can be drawn from the present research:
It can be concluded that the lattice structures when arranged to act as a cantilever beam form a non-prismatic beam for which theories related to non-prismatic beams should be applied. The variation in MOI due to a change in cross-sections in some structural configuration is symmetric whereas for the others it is non-symmetric. It is concluded that Schwarz-D structure performs the best, as it has the highest load-bearing capacity and flexural properties whereas the Schwarz-P and Gyroid structure have a relatively similar response and the Octet-truss structure performs the worst. It can also be concluded that surface-based lattice structures have superior flexural properties when compared with their beam-based counterparts. All the structures investigated in the present study have a sinusoidal MOI response due to variation in cross-section area. The difference in using average MOI values and value from bounding box for the structures leads to a difference of 2- to 2.5-fold while computing for flexural stress values. The failure of structures is dependent on how the stress flows through them inside the structure. For Schwarz-P structure, the stress is maximum on the inner and outer sides of the curved faces whereas for the Schwarz-D and Gyroid structured beams the stress alternates between the surfaces, which causes failure in them. For the beam-based Octet-truss structure, the load is carried by the beams to nodes and therefore, maximum stress is formed near the joints but due to buckling the beams are found to fail at the centers and not at the joints.
The top region of the structured cantilever beam is in tension, whereas the bottom region is in compression; therefore, it is crucial to design a hybrid structure cantilever beam by incorporating appropriate structures at specific regions based on the types and amount of loading.
Footnotes
Author Disclosure Statement
No competing financial interests exist.
Funding Information
This work was financially supported by the High-Speed 3D Printing Research Center (Grant No. 108P012) from the Featured Areas Research Center Program within the framework of the Higher Education Sprout Project by the Minister of Education (MOE) Taiwan.