
Abstract
Successful employment of 3D printing for delivery of therapeutic biomolecules requires protection of their bioactivity on exposure to potentially inactivating conditions. Although intermediary encapsulation of the biomolecules in polymeric particulate delivery vehicles is a promising strategy for this objective, the inclusion of such particles in 3D printing formulations may critically impact the accuracy or precision of 3D printed scaffolds relative to their intended designed architectures, as well as the degradation behavior of both the scaffolds and the included particles. The present work aimed to elucidate the effect of poly(
Introduction
Inclusion of therapeutic biomolecules in 3D printed constructs can enable biological activity of otherwise inactive biomaterial systems; however, these components are often vulnerable to common conditions employed for 3D printing. 1 One promising strategy for protecting the bioactivity of therapeutic biomolecules during 3D printing is intermediary encapsulation of the biomolecules in polymeric particulate delivery vehicles.
Controlled loading of these particles in the bulk material phase, and controlled degradation of the polymeric particles, would influence the controlled release of incorporated therapeutic biomolecules.2,3 Meanwhile, the inclusion of these particles in 3D printing formulations may impact the accuracy or precision of 3D printed scaffolds relative to their intended designed architectures, as well as the degradation behavior of both the scaffolds and the included particles.4–7
The accuracy of 3D printed constructs is a subject of increasing study, and further specific investigation of the effects of additives is warranted for widespread applicability.8–11 Developmental progress in novel 3D printing approaches must also be iteratively evaluated with respect to fundamental application requirements, such as scaffold degradation for usage in regenerative medicine.12–15
Therefore, in this study, we aimed to investigate the effects of poly(
To this end, we applied an established image analysis-based definition of material accuracy and machine precision 16 to the resulting constructs, followed by subjecting them to up to 28 days of aqueous degradation conditions. Post-degradation characterization was performed with micro-computed tomography (microCT) and advanced polymer chromatography (APC) to investigate the changes in scaffold porosity and composite molecular weight, respectively, over time.
Moreover, to elucidate the degradation behavior of the printed constructs, we investigated how the mass ratios of PLGA to PCL, and PLGA particle size, would impact the rate of degradation (changes in construct porosity and composite molecular weight).
Materials and Methods
Experimental design
A one-quarter Resolution III fractional design of defining relation 2III5–2 was constructed for eight combinations of five compositional or printing parameters,17,18 with low and high levels for each parameter defined in Table 1. This work did not involve use of human/animal subjects, and Institutional Review Board approval was therefore waived.
Fractional Factorial Design of Two-Level Factors for Five Experimental Parameters
Group name refers to particle loading (“5” or “10” for 5 or 10% w/w, respectively, of PLGA particles in PCL bulk), particle size (“S” or “L” for small or large PLGA MPs, respectively), and printing temperature (“↓” or “↑” for low or high printing temperature, respectively).
MP, microparticle; PCL, poly(ɛ-caprolactone); PLGA, poly(
Fabrication of PLGA MPs with varied diameter
Small-sized PLGA MPs were prepared as previously described, with further details available in Supplementary Methods. 19 For the large-sized particles, the same procedure was performed with the following adaptation to enable an increase of average particle size: after conducting probe ultrasonication for 1 min, the first water-in-oil emulsion was further emulsified with the external aqueous phase by 2 min of vortexing at 3200 rpm. To quantify average particle size, synthesized particles were sputter-coated with 10 nm of gold and imaged with scanning electron microscopy (SEM; Phenom XL Desktop SEM, Nanoscience Instruments). Resulting images were subjected to particle size analysis in ImageJ, as previously described. 19
3D printing of PLGA MP-loaded PCL scaffolds
PCL of Mw of 30.0 kDa and Mn 18.5 kDa (measured by APC with reference to polystyrene standards) was purchased from Sigma-Aldrich, and it was ground and sieved to a powder of <500 μm. The specified amounts of each particle size and PCL powder were then weighed, mixed, and transferred into a metallic printing cartridge. Subsequently, the cartridge was positioned in a high-temperature printing head of a 3D-Bioplotter (EnvisionTEC) to achieve the specified temperature conditions (65 or 75°C).
After equilibrating the mixture to its selected printing temperature for at least 30 min, each experimental run was performed at the determined extrusion pressure and print head translation speed. Ten-layer scaffolds with square cross-sections of 10 × 10 mm dimensions and programmed fiber spacing of 1.71 mm were fabricated by extrusion-based 3D printing through a 22 G (0.413 mm inner diameter) needle tip. The Visual Machines software was programmed to automatically capture an image of each printed layer.
To account for potential clogging of the extrusion needle by particles and/or their aggregates, printing was paused periodically between layers and a long 27G needle was inserted through the printing nozzle followed by purging of the material.
SEM characterization of MP-loaded PCL scaffolds
To evaluate MP morphology within the fibers after printing, three individual fibers were isolated randomly from one representative scaffold of each group, by using a razor blade at the junctions between printed fibers. These fibers were then fractured along the short axis of the fiber (perpendicular to the direction of extrusion) with a metallic spatula. After sputter-coating the resulting cross-sections with a 5 nm-thick gold layer, the internal fiber morphology was imaged by SEM (Phenom XL Desktop SEM; Nanoscience Instruments) using a backscattered electron detector.
Small and large MPs were visualized at 2000 × and 500 × magnification, respectively. After initial observation, to substantiate the observations in the high-temperature groups, three printed fibers were further isolated from two additional scaffolds per group (a total of three scaffolds per group for high-temperature groups), followed by the same sputter-coating and imaging procedure.
Quantification of material accuracy and machine precision
Material accuracy and machine precision for each experimental combination were determined as defined by Trachtenberg et al. 16
Material accuracy, defined in Equation (1), is assessed by comparing the average diameter of fibers printed in the fourth layer of the scaffold with the diameter of a single extruded model fiber. Each were quantified from images captured by the camera accessory of the 3D-Bioplotter with measurement of fiber diameter in ImageJ. The values for mean experimental diameter were consistently determined by cropping the image to isolate the scaffold, using a macro function to draw a central line through the images (Supplementary File S1), and measuring the distance between pixels on the edges of the four central fibers intersecting with the centerline, as illustrated in Supplementary Figure S1a.
The model fiber was fabricated using the manual parameter tuning function of the Visual Machines software to extrude a composite fiber at the designated printing temperature, pressure, and speed. After obtaining an image, ImageJ was used to overlay 1.2 × 1.2 mm gridlines along the length of the fiber, and three measurements were taken along the central region of each model fiber to determine the averaged model diameter (Supplementary Fig. S1b).
Machine precision, defined in Equation (2), is represented by the correlatability of actual pore size to that which was specified in the printing software (center-to-center distance between adjacent fibers). Namely, experimental fiber spacing is the sum of average fiber diameter and average pore size (the distance between the pixels on the edges of the fibers with the intersection of the overlayed centerline) as shown in Supplementary Figure S1a.
Main effects analysis of accuracy and precision
First, the mean, minimum, and maximum percentage errors of accuracy and precision were compared by t-tests. R statistical software (version 4.0.0; R Foundation) was then employed to perform a main effects analysis to determine the potential influence of each parameter investigated in the fractional factorial analysis on the material accuracy and machine precision of the resulting printed composite scaffolds. 20 A linear model of each output measure (accuracy or precision) relative to the five dependent variables (temperature, mass ratio, particle diameter, printing speed, and printing pressure) was calculated, with subsequent analysis of variance (ANOVA) to determine the significance of each regression coefficient. Reduced linear models comprising the dependent variable (accuracy or precision) with respect to a single independent variable/factor (each parameter) were also computed.
Scaffold degradation under aqueous conditions
Scaffolds (n = 3) of up to 10 layers were prepared by extrusion-based 3D printing as described earlier for each of the groups in Table 1, and they were subsequently subjected to degradation conditions as detailed in Supplementary Methods. Percentage mass loss was calculated as the difference between pre- and post-degradation mass loss normalized by pre-degradation mass and analyzed by two-way ANOVA. For the 28-day incubation duration, each supernatants' pH was also measured and analyzed by mixed-effects analysis with repeated measures.
MicroCT analysis
MicroCT scanning and reconstruction were performed as described in Supplementary Methods. CTAn (version 1.20.8; Bruker) was then employed to specify the volume of interest (VOI) for the quantification of pores, as described in Supplementary Methods and illustrated in Supplementary Figure S2. The closed (intra-fiber) micropores in the scaffold (percentage closed porosity) represented the void space present within the PCL fibers either initially or that resulting from the degradation of PLGA MPs.
Specifically, the software identifies a closed pore as contiguous black voxels surrounded fully by white voxels subsequent to binary thresholding. 21 Meanwhile, the percentage open porosity (referring to the scaffold macro-pores or contiguous black voxels interfacing with the boundaries of the VOI) and the percentage total porosity were also noted. These porosity percentages were quantified with the 3D analysis function of the CTAn software based on the 3D reconstructions, using the task lists in Supplementary Files S2 and S3. Two-way mixed-effects model comparisons were performed with respect to experimental group and degradation timepoint for n = 2–3 distinct scaffolds, with posthoc Tukey analysis for multiple comparisons. 22
APC analysis
Subsequent to non-destructive microCT scanning, the scaffolds were dissolved in tetrahydrofuran and subjected to APC. Analysis of molecular weight changes upon degradation was performed by comparing weight-average molecular weight (Mw), number-average molecular weight (Mn), and polydispersity index (PDI) values in composite scaffolds subjected to degradation for 7, 14, or 28 days to those fabricated yet not immersed in aqueous medium.
The delta change (difference) in the mean of these quantities relative to the pre-degradation (Day 0) timepoint was also calculated. Two-way mixed-effects model comparisons were performed with respect to experimental group and degradation timepoint for n = 2–3 distinct scaffolds, with posthoc Tukey analysis for multiple comparisons. 22
Main effects analysis of molecular weight changes and porosities
The statsmodel package of Python computational software (version 3.6; Python Foundation) was employed to perform a main effects analysis of PLGA MP size and loading concentration on the changes in Mn and Mw at the various degradation timepoints, as well as the closed, open, and total porosity at these timepoints. Then, the summaries of linear models for each output relative to the two dependent MP variables were generated based on ordinary least-squares regression, followed by ANOVA to determine the significance of each regression coefficient. 23 Specifically, the size of each main effect is designated by the regression coefficient of a linear model comprising the dependent variable (MP size or loading concentration) and selected independent variables/factors (change in molecular weight or porosity at each degradation timepoint).
Statistical analysis
Statistical analyses were performed using Prism (version 8.0.2; GraphPad), with approaches to each dataset as specified in its respective Materials and Methods section. Data are presented as mean ± standard deviation for n = 3 replicates unless stated otherwise, with a statistical significance threshold of p < 0.05.
Results
Fabrication and SEM characterization of PLGA MPs of varied diameter and 3D printed PLGA MP-loaded PCL scaffolds
The PLGA particles of 1.0 ± 0.1 or 82.5 ± 33.8 μm average diameter were synthesized using ultrasonication or vortexing for the second emulsion, respectively (Fig. 1). Extrusion-based 3D printing of up to 10-layer scaffolds was performed at each designated parameter combination. For 5-L-↑ scaffolds, the deposition of these largest fibers (at high temperature, low speed, and high pressure) resulted in instability of scaffold structure on the printing platform, resulting in only four to eight stable scaffold layers. In addition, compositions with small MPs at both high and low concentrations were observed to require unclogging of the needle between layers more frequently, suggesting an aggregation tendency for these small particles.
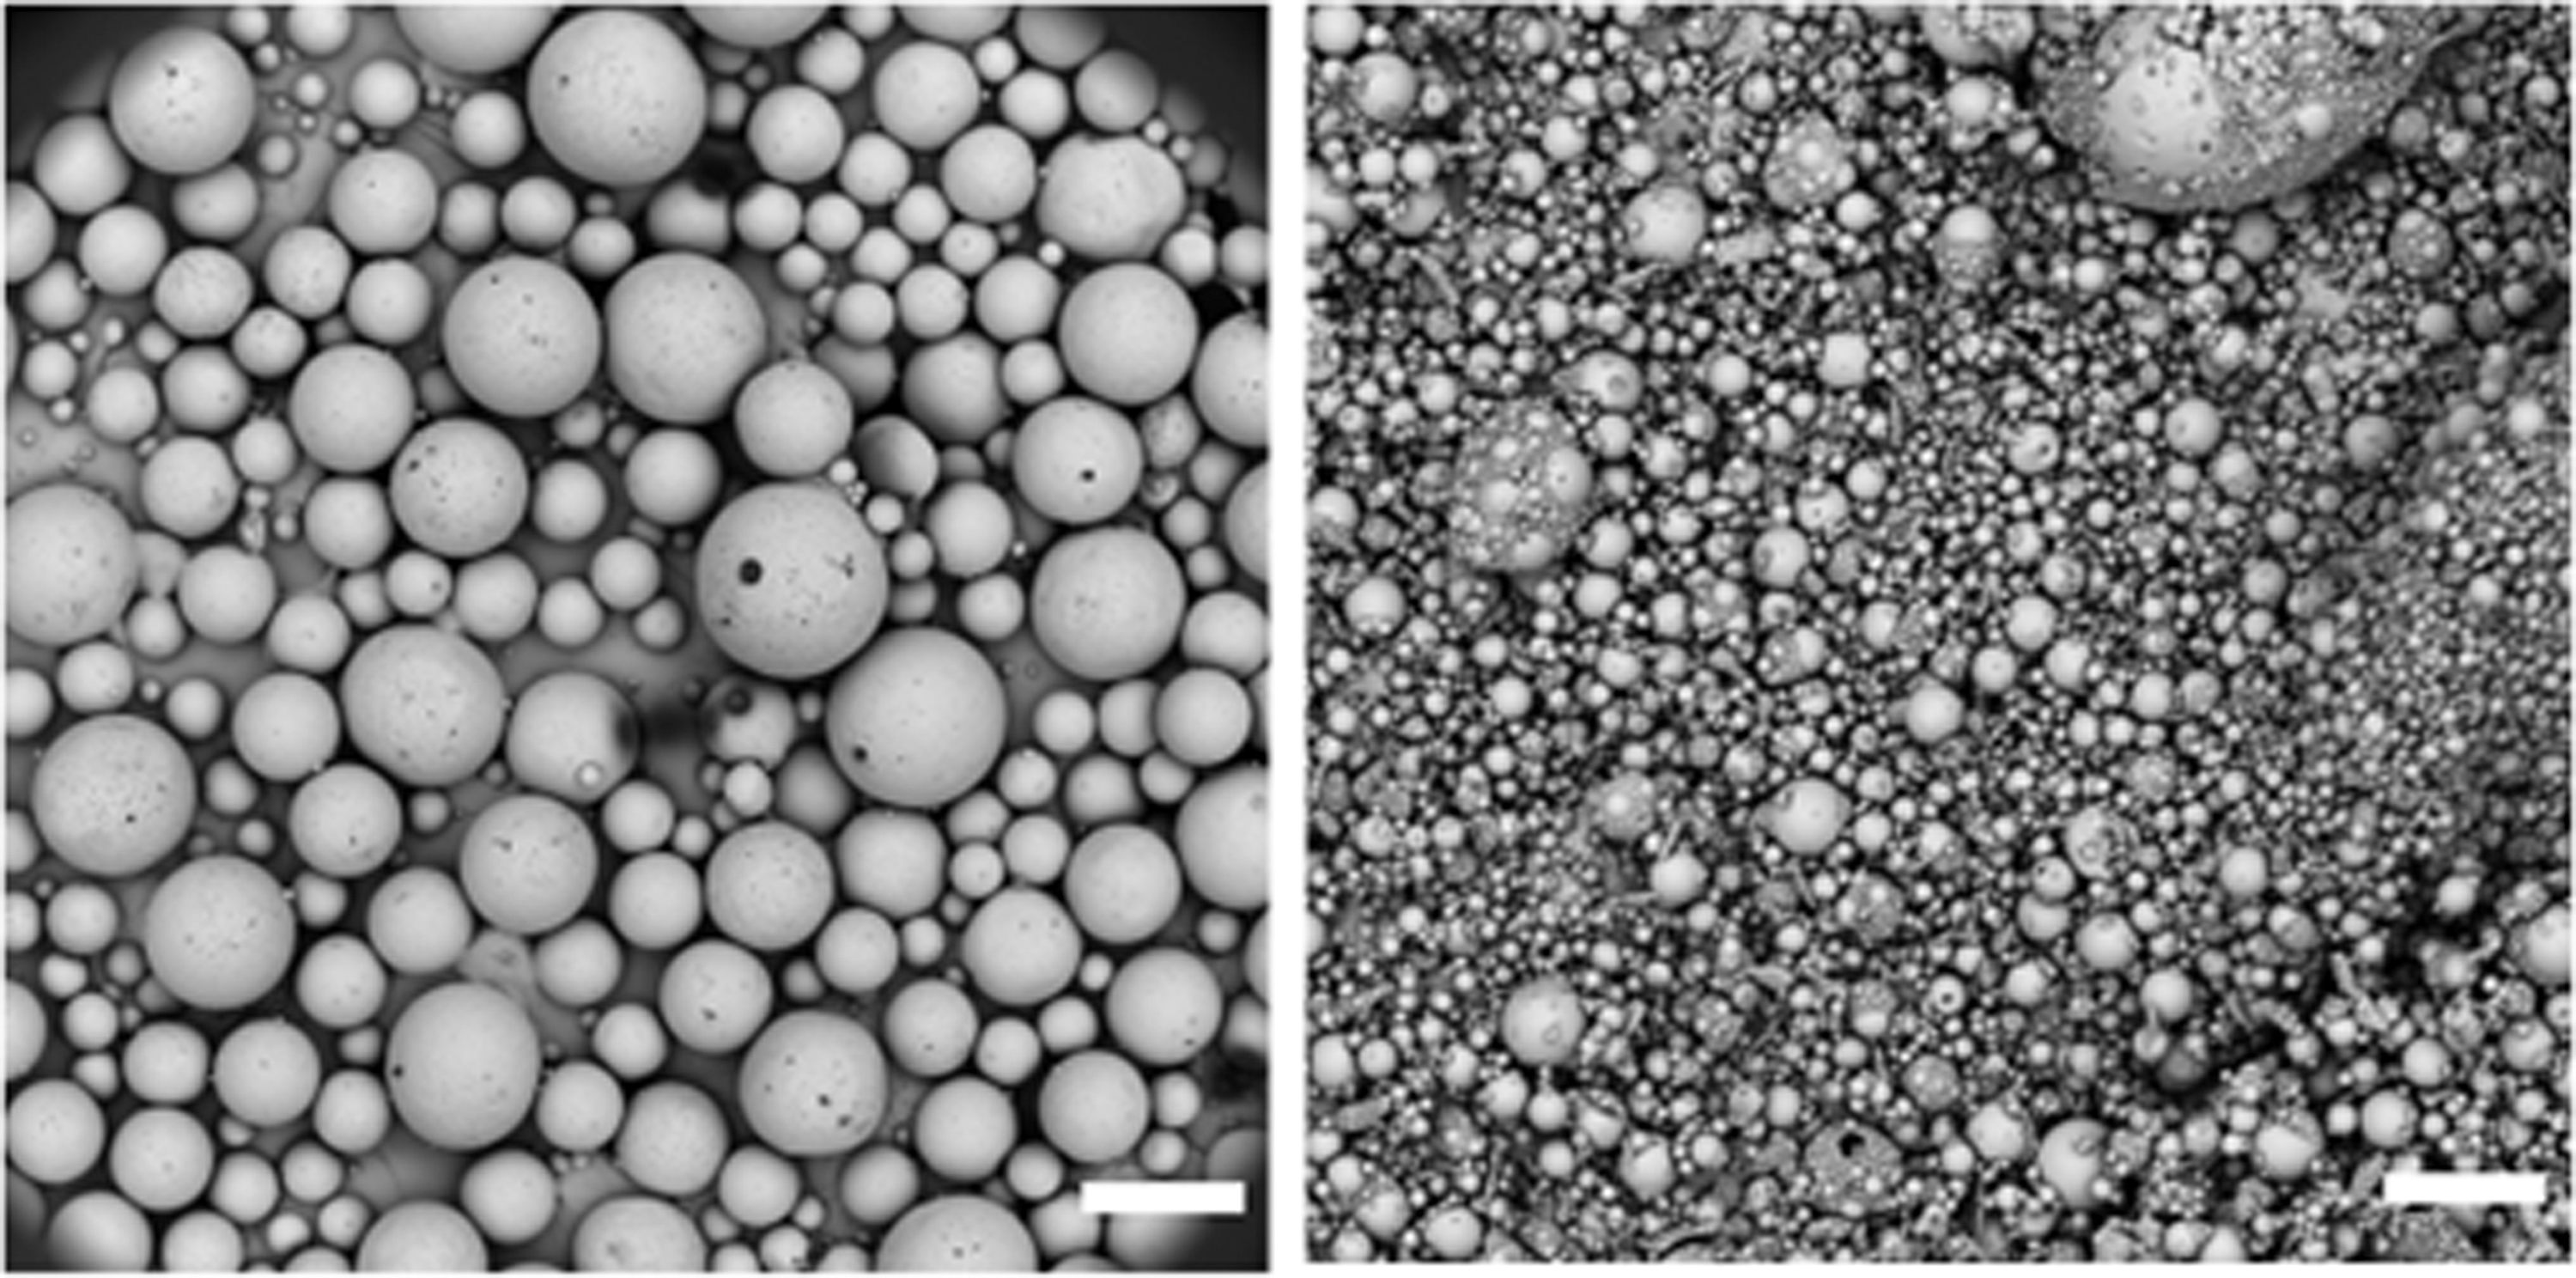
Large and small PLGA MPs. Scale bar = 150 μm (left), 15 μm (right). MPs, microparticles; PLGA, poly(
The SEM investigation of MP morphologies after printing revealed that both small and large MPs maintained their spherical morphology within the bulk printed matrix at the low (65°C) temperature (Supplementary Fig. S3). However, large MPs maintained their spherical morphology and were distinct from the PCL matrix at both printing temperatures, whereas small MPs were not observed to be visually distinguishable from the PCL matrix at the high (75°C) temperature (n = 9 fibers, three fibers isolated randomly from each of three distinct scaffolds).
Material accuracy and machine precision of 3D printed PLGA MP-loaded PCL scaffolds
Table 2 displays the mean fiber diameter and tuning model measurement for material accuracy, and the experimental versus programmed fiber spacing for machine precision. The average % error of accuracy, 15.7% ± 9.7%, was greater than the average % error of precision, 2.2% ± 0.4% (p < 0.05). The formulations with the highest and lowest accuracy, 5-S-↑ and 10-S-↑, respectively (which were significantly different, p < 0.05) shared the same MP size and printing temperature, yet they differed in MP loading concentration and in the printing parameters of speed and pressure. Though not statistically significant, the formulations with the highest and lowest precision, 10-L-↑ and 10-L-↓, respectively, also shared the same MP compositions yet differed in all of their printing parameters of temperature, speed, and pressure.
Measurements Of Fiber Diameter and Spacing for Calculation of Material Accuracy and Machine Precision
Accuracy and precision calculated using Equations (1) and (2), respectively; see Tables 1 and 2 for definitions of groups.
Dexp, mean experimental fiber diameter; Dmodel, model fiber diameter; Sexp, mean experimental fiber spacing; Sprog, programmed fiber spacing.
Main effects of compositional and printing parameters on accuracy and precision
Table 3 lists the main effects sizes for the five examined parameters. No statistical significance was observed for the studied effects, as represented by the bidirectional error bars in Figure 2. However, in a reduced linear model of accuracy or precision with respect to each parameter, speed was found to have a statistically significant influence on material accuracy, whereas this factor did not have a significant isolated influence on machine precision.
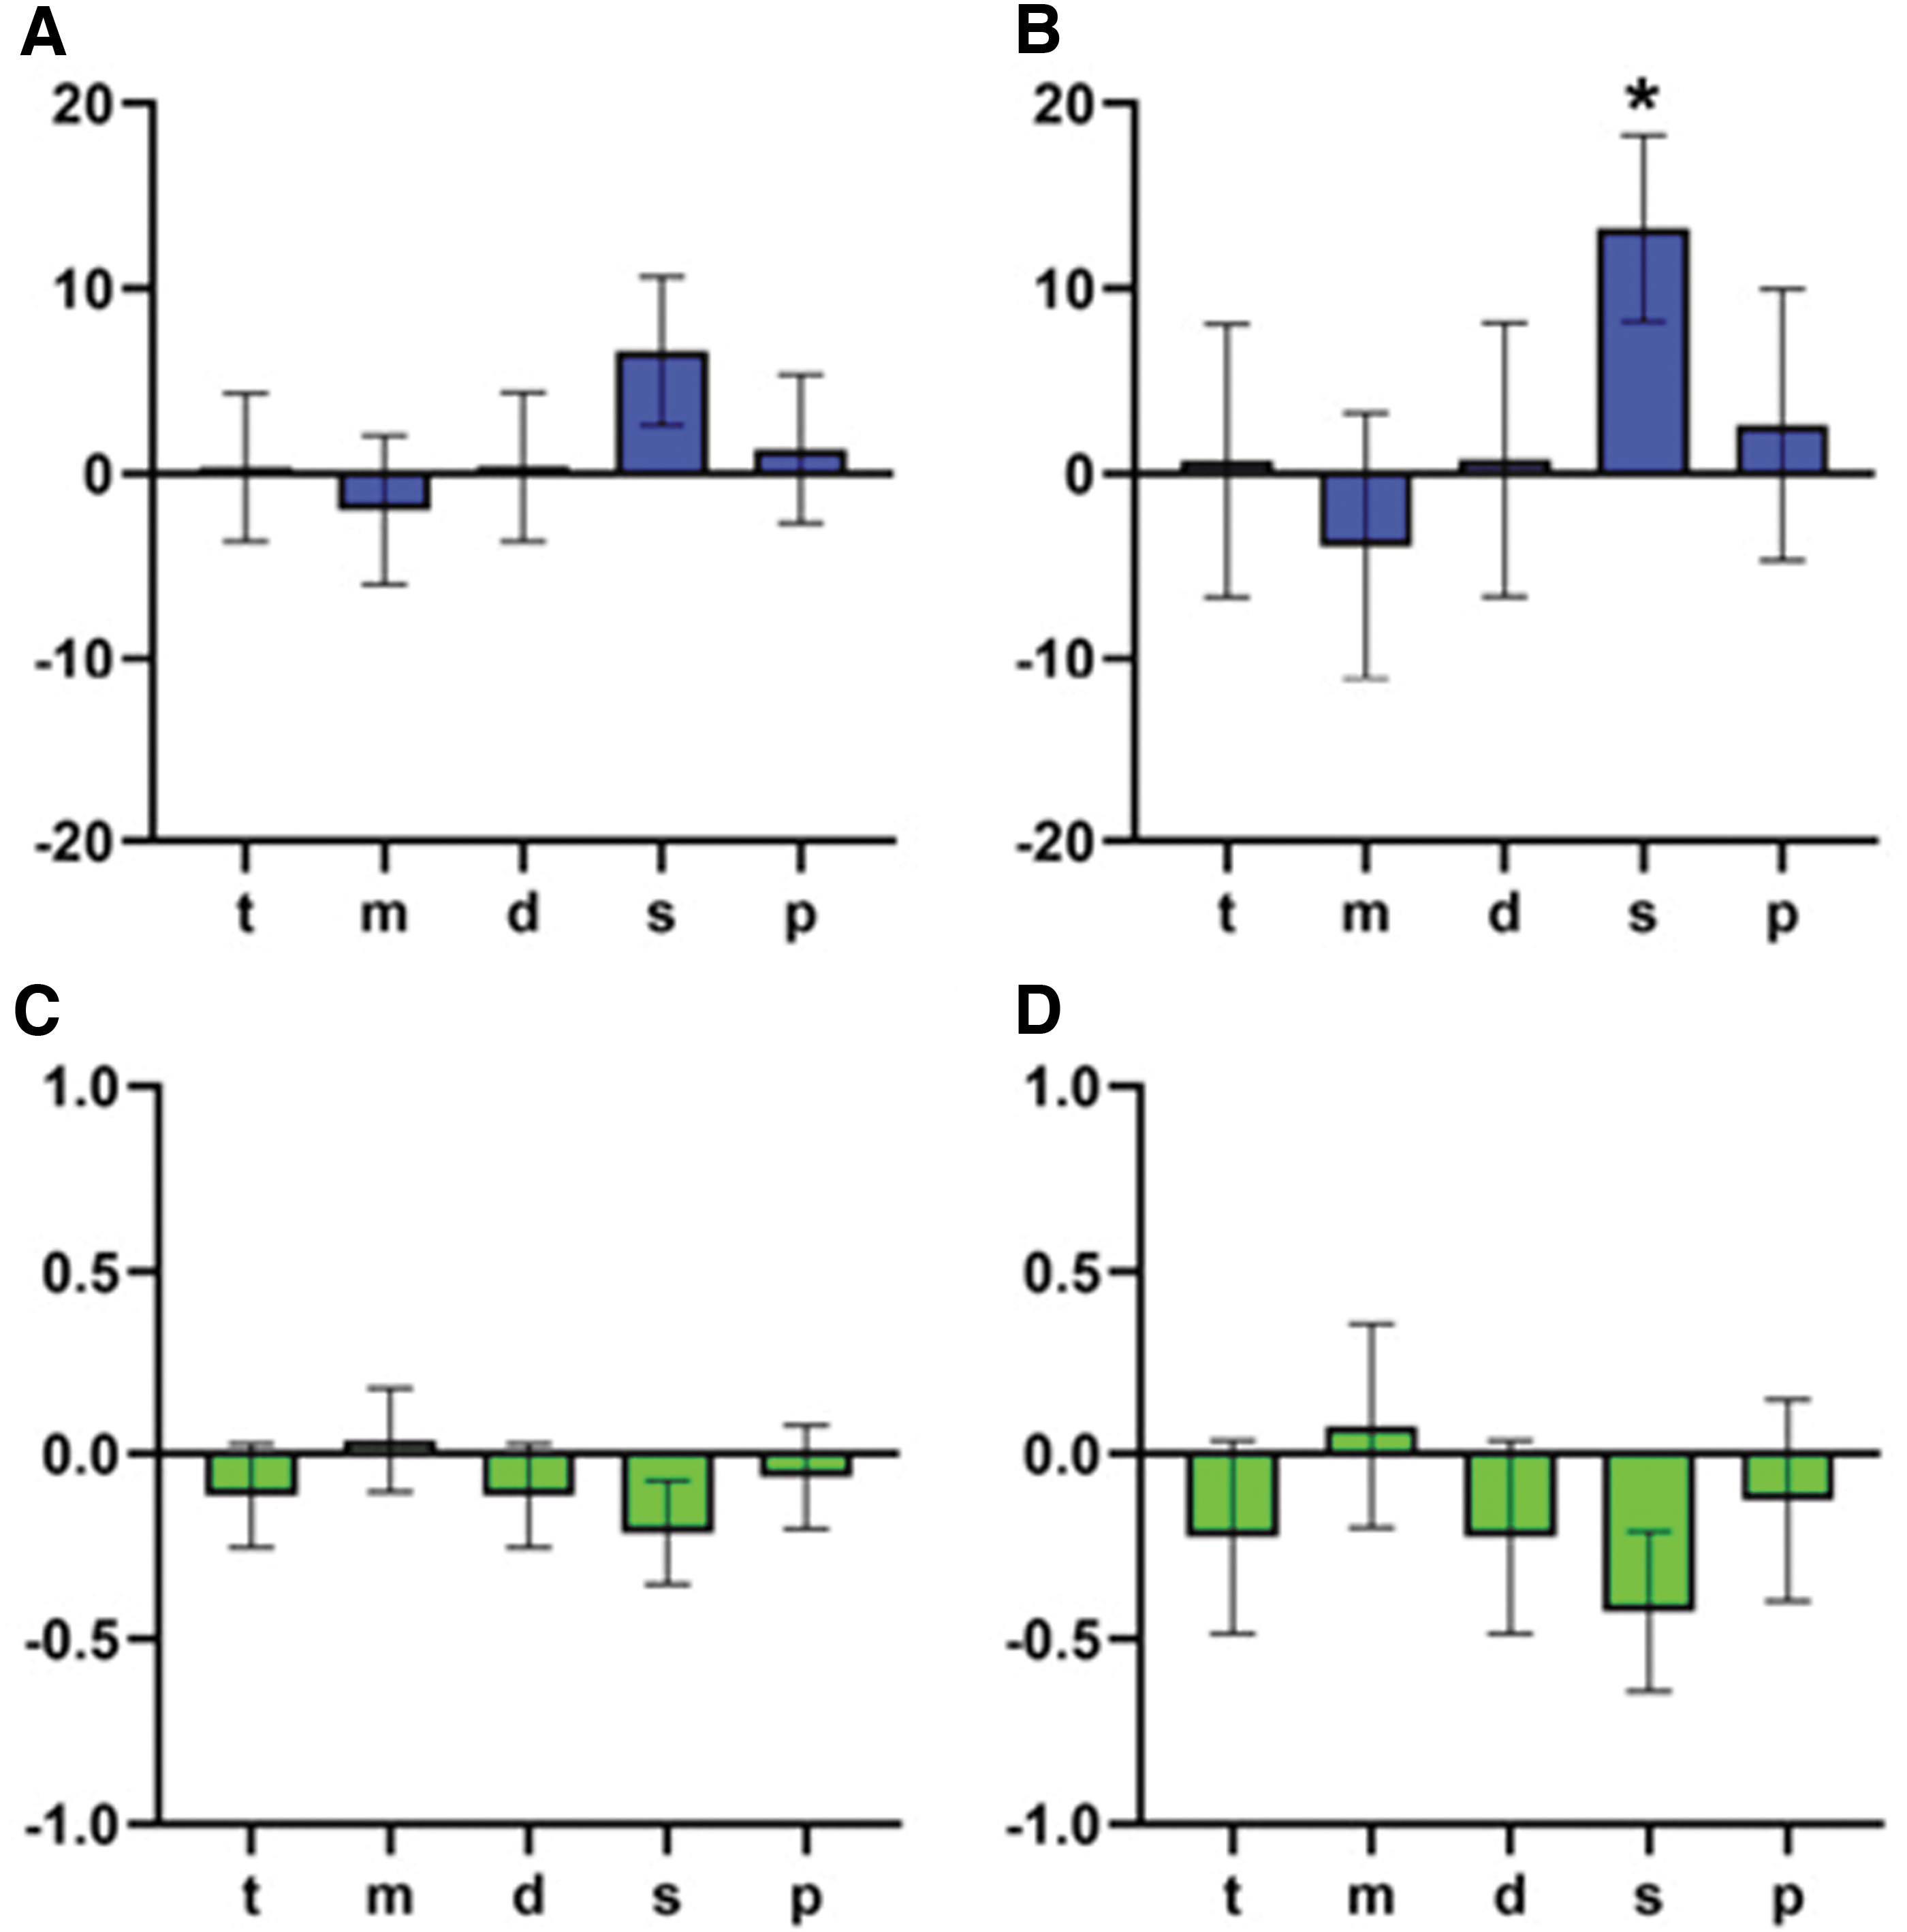
Plots of main effects of investigated parameters on percent errors of material accuracy and machine precision.
Main effects of the Levels (High or Low) of Experimental Variables on Material Accuracy and Machine Precision
Degradation of 3D printed PLGA MP-loaded PCL scaffolds
The 3D printed scaffolds exhibited minimal (<6%) average percentage mass loss for any group at all timepoints throughout the aqueous incubation (Fig. 3A). The supernatant pH at the final timepoint was also not found to significantly differ among the groups, whereas the average of the pH values measured among all groups at Day 28 was 7.1 (Fig. 3B and Supplementary Table S1a).
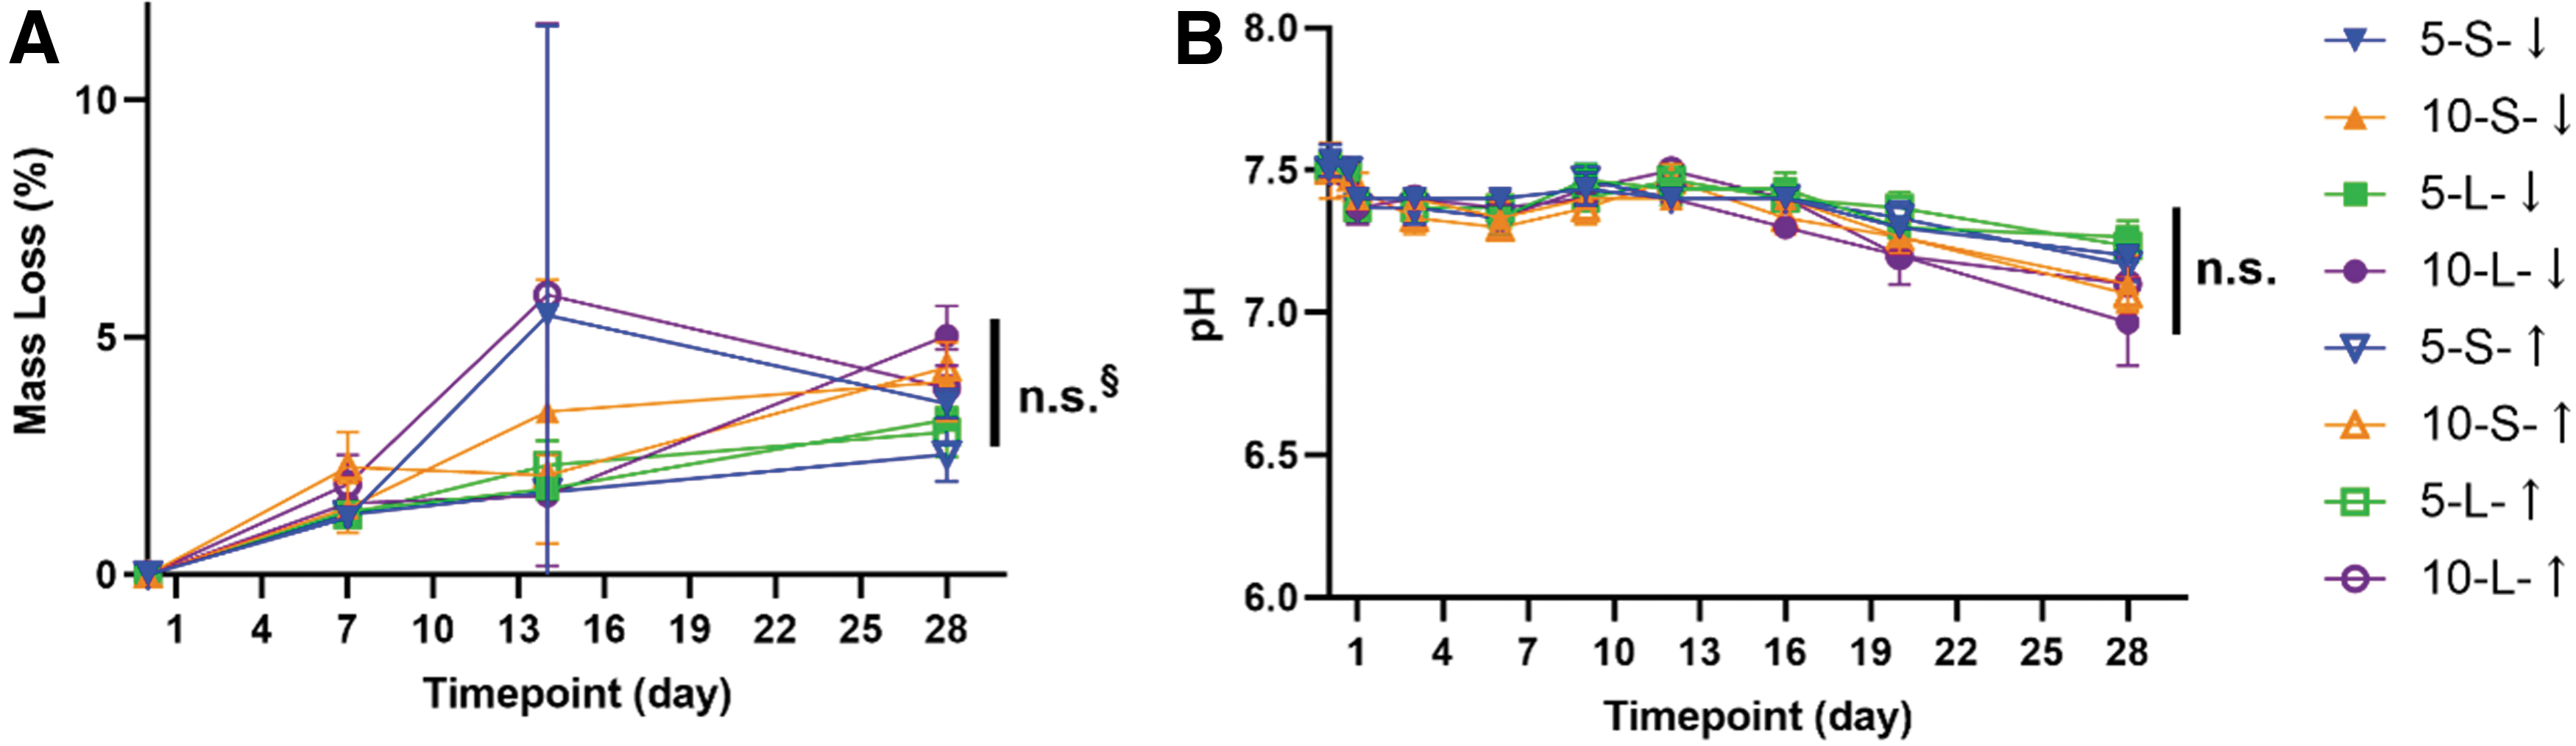
Degradation-induced mass loss and changes in supernatant pH.
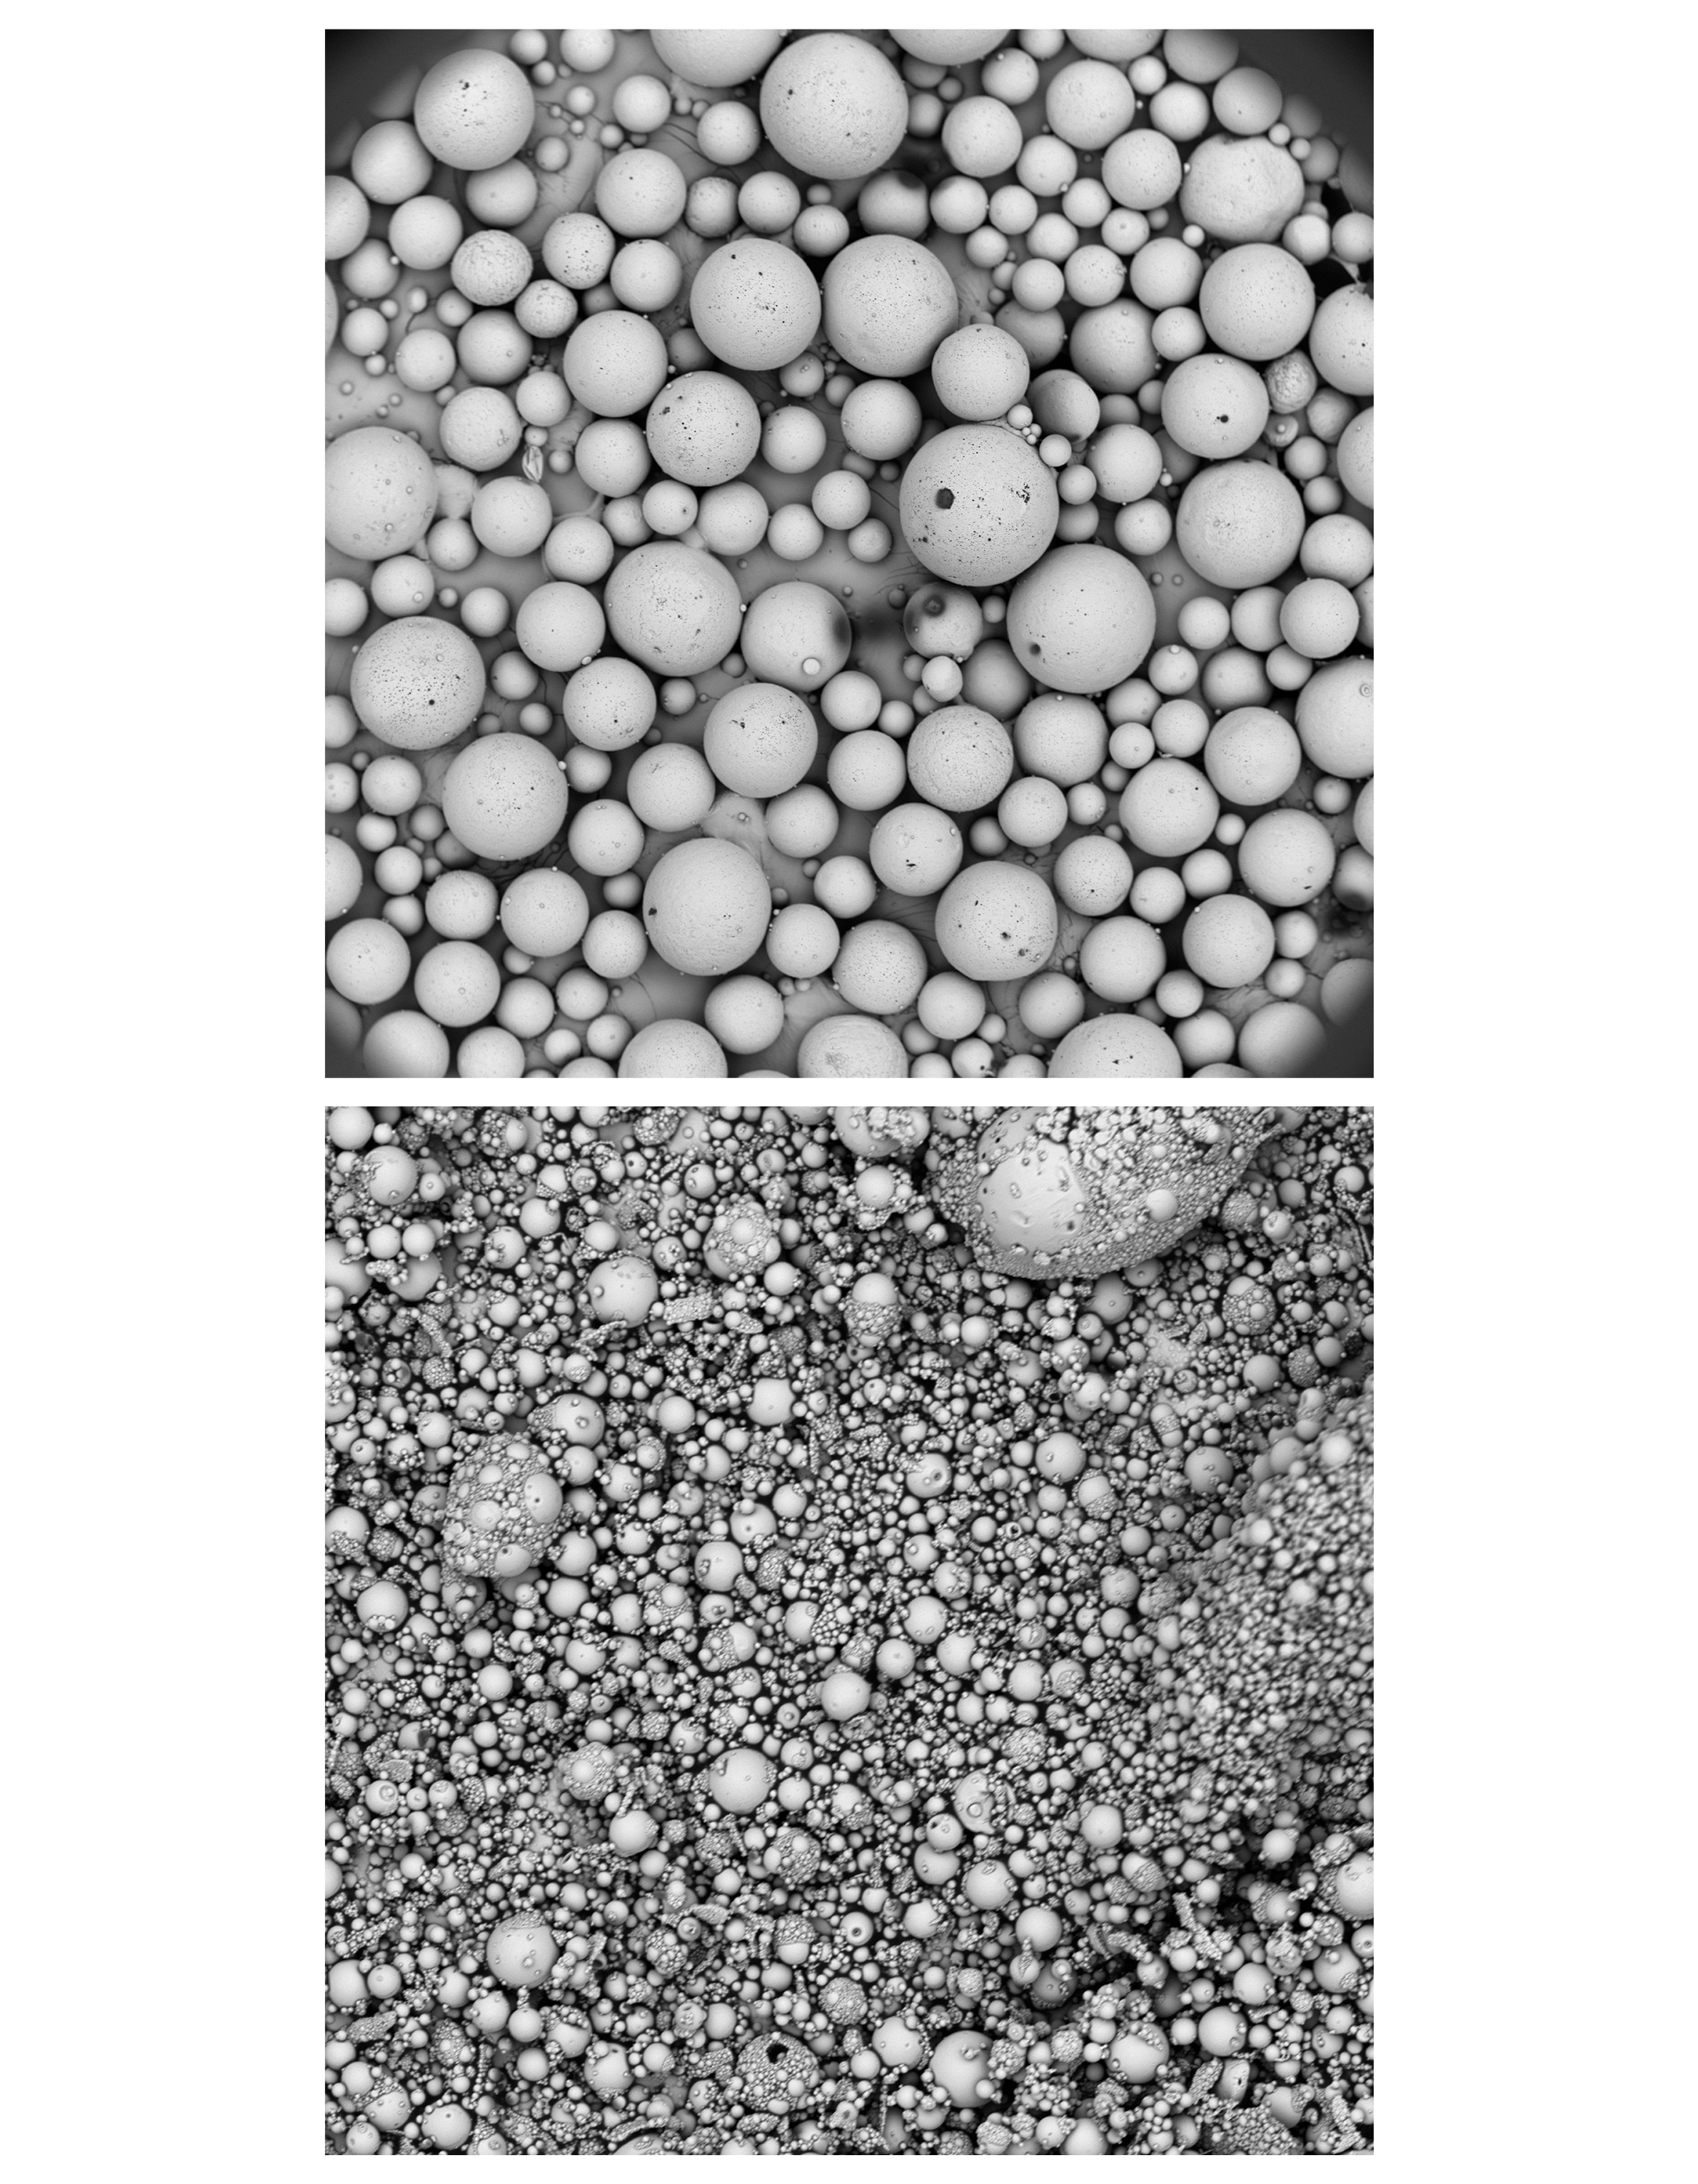
Qualitatively, the two types of pores—intra- and inter-fiber pores—can be noted as radiolucent void space within 2D images of scaffold cross-sections from 3D reconstructions (Fig. 4). The inter-fiber pore spaces appear consistent in size throughout the time course of degradation, independently of MP loading concentration or diameter. Meanwhile, PLGA MPs are visible as higher-radiopacity inclusions both pre-degradation (Day 0) and at earlier timepoints such as Day 7 (Fig. 5).
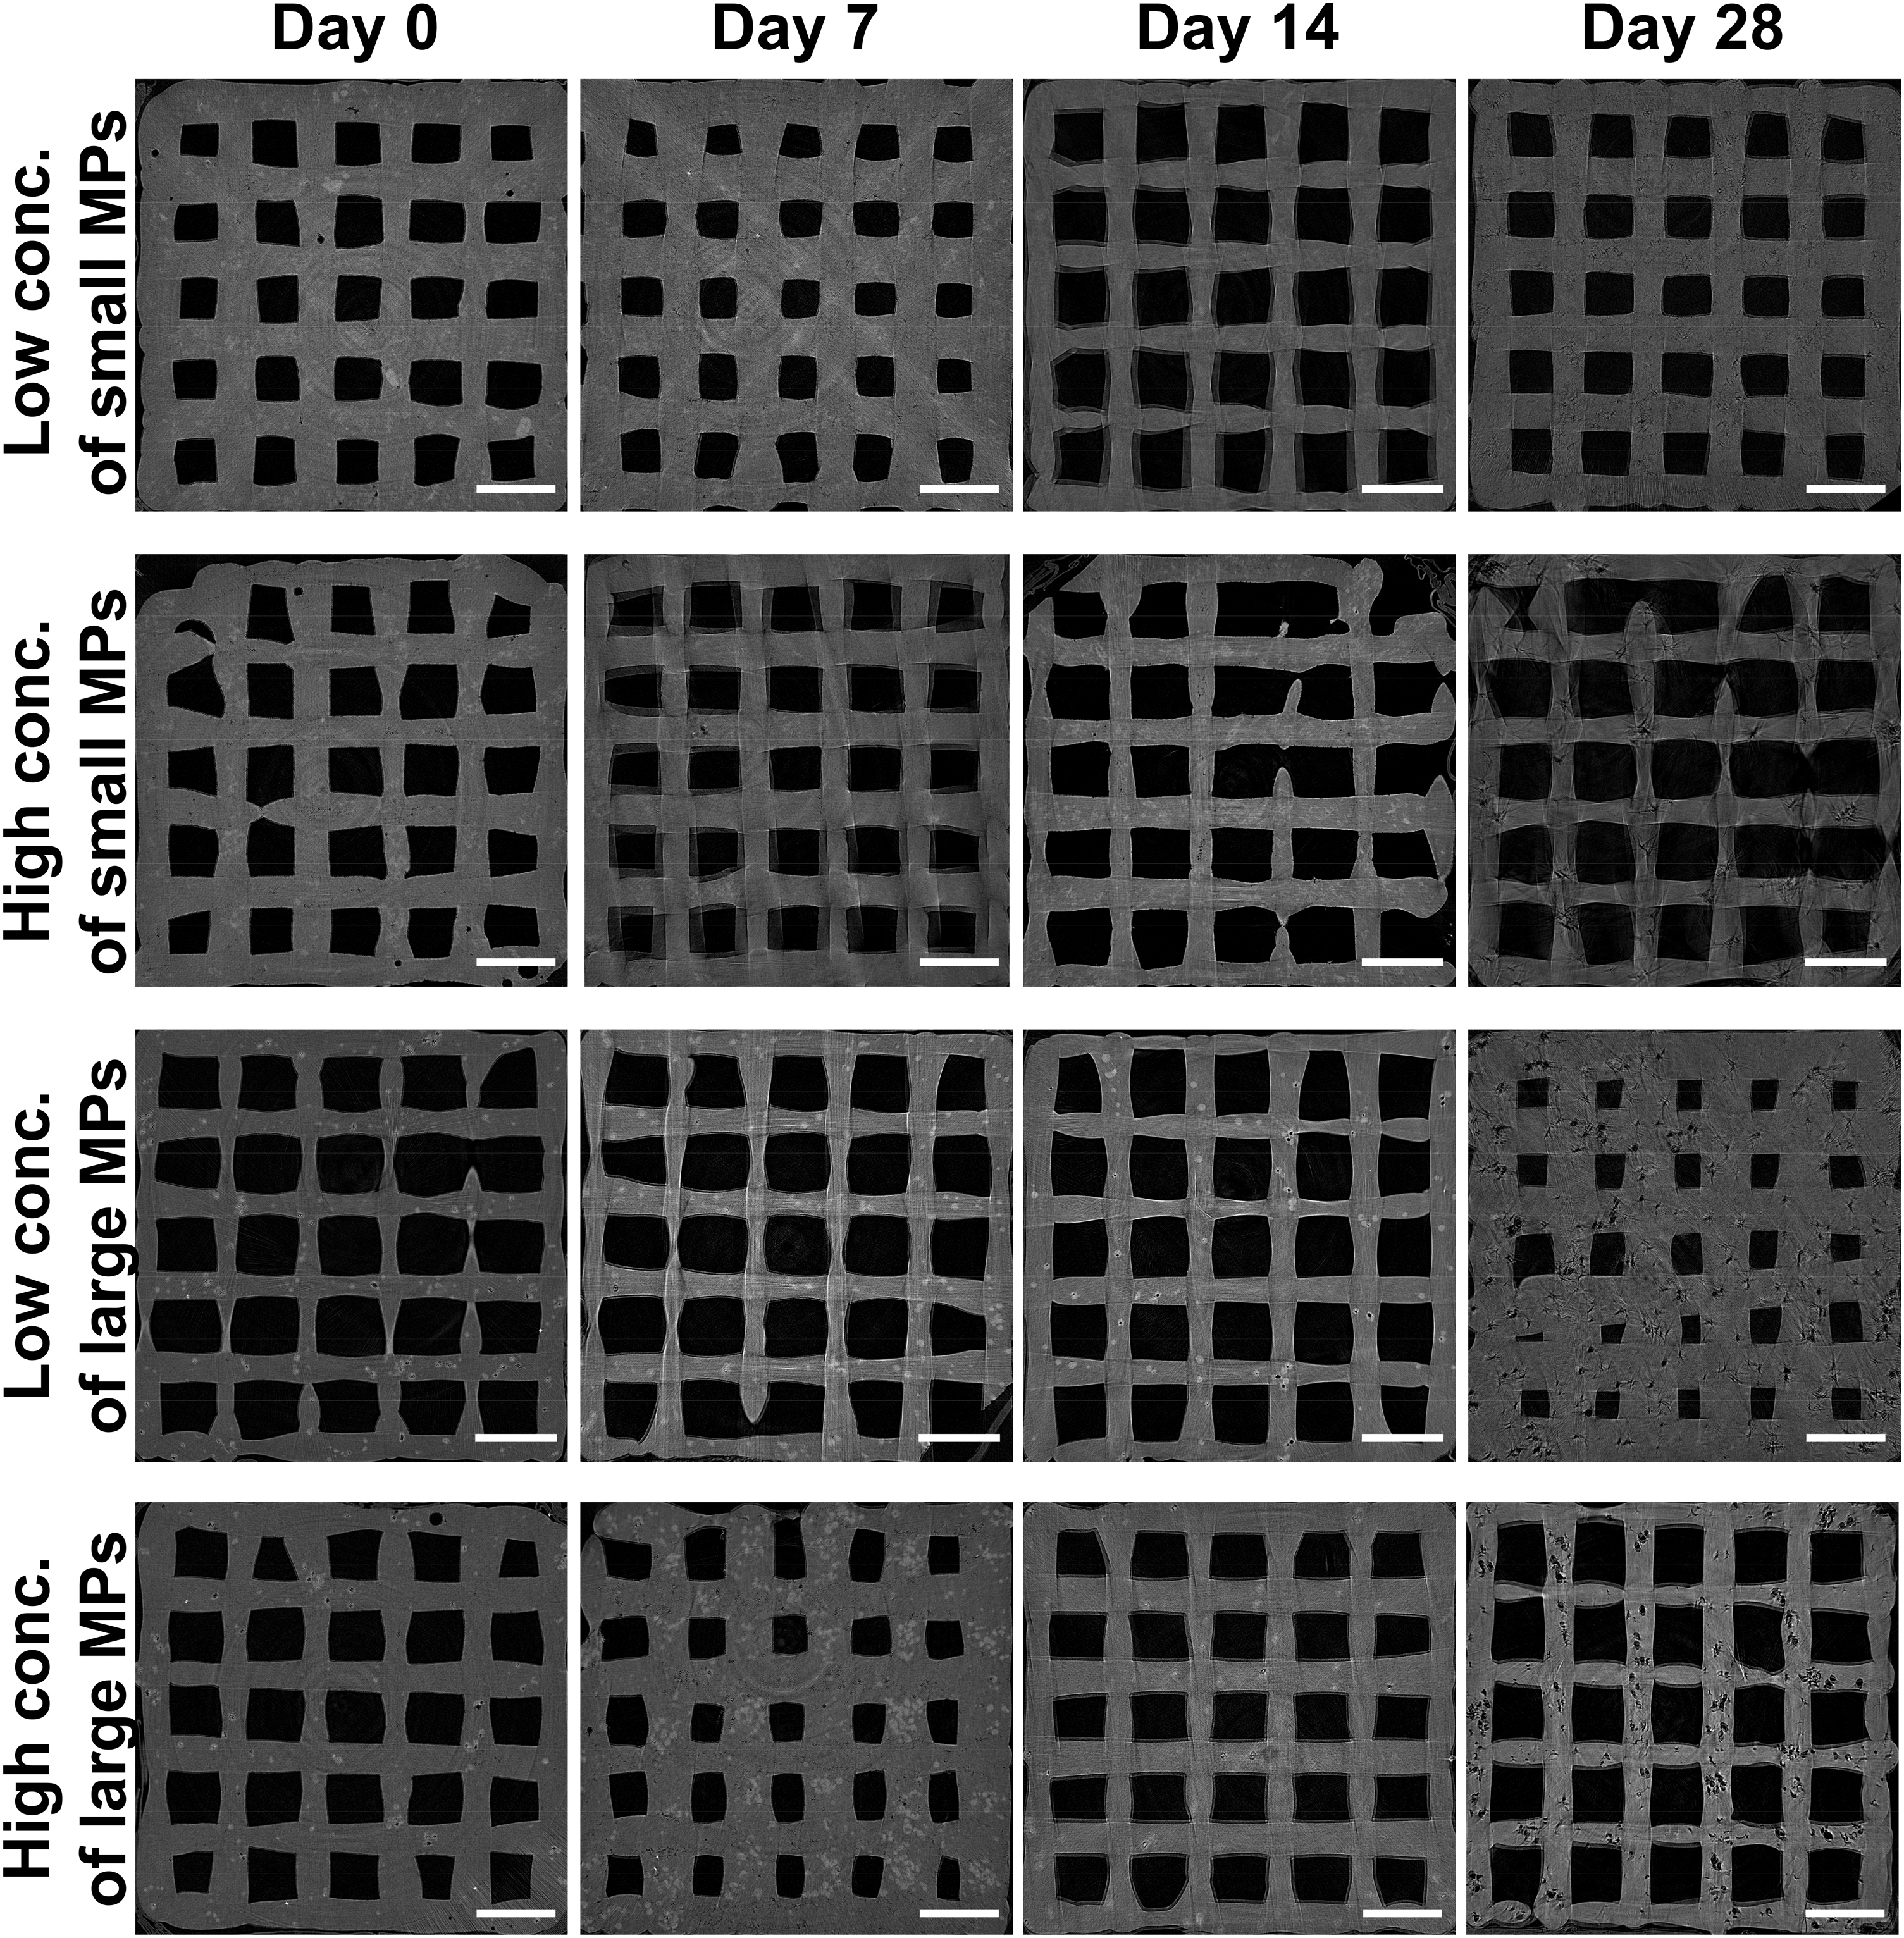
Degradation-induced changes in porosity on microCT imaging. Representative 2D images of 3D scaffold cross-sections from (first row) 5-S-↓ and 5-S-↑; (second row) 10-S-↓ and 10-S-↑; (third row) 5-L-↓ and 5-L-↑; and (fourth row) 10-L-↓ and 10-L-↑. PLGA MPs appear as white inclusions within a less radiopaque bulk structure, whereas both (intra-fiber) micro- and (inter-fiber) macropores are visible as radiolucent (black) void space. Scale bar = 2 mm. microCT, micro-computed tomography; MP, microparticle; PLGA, poly(
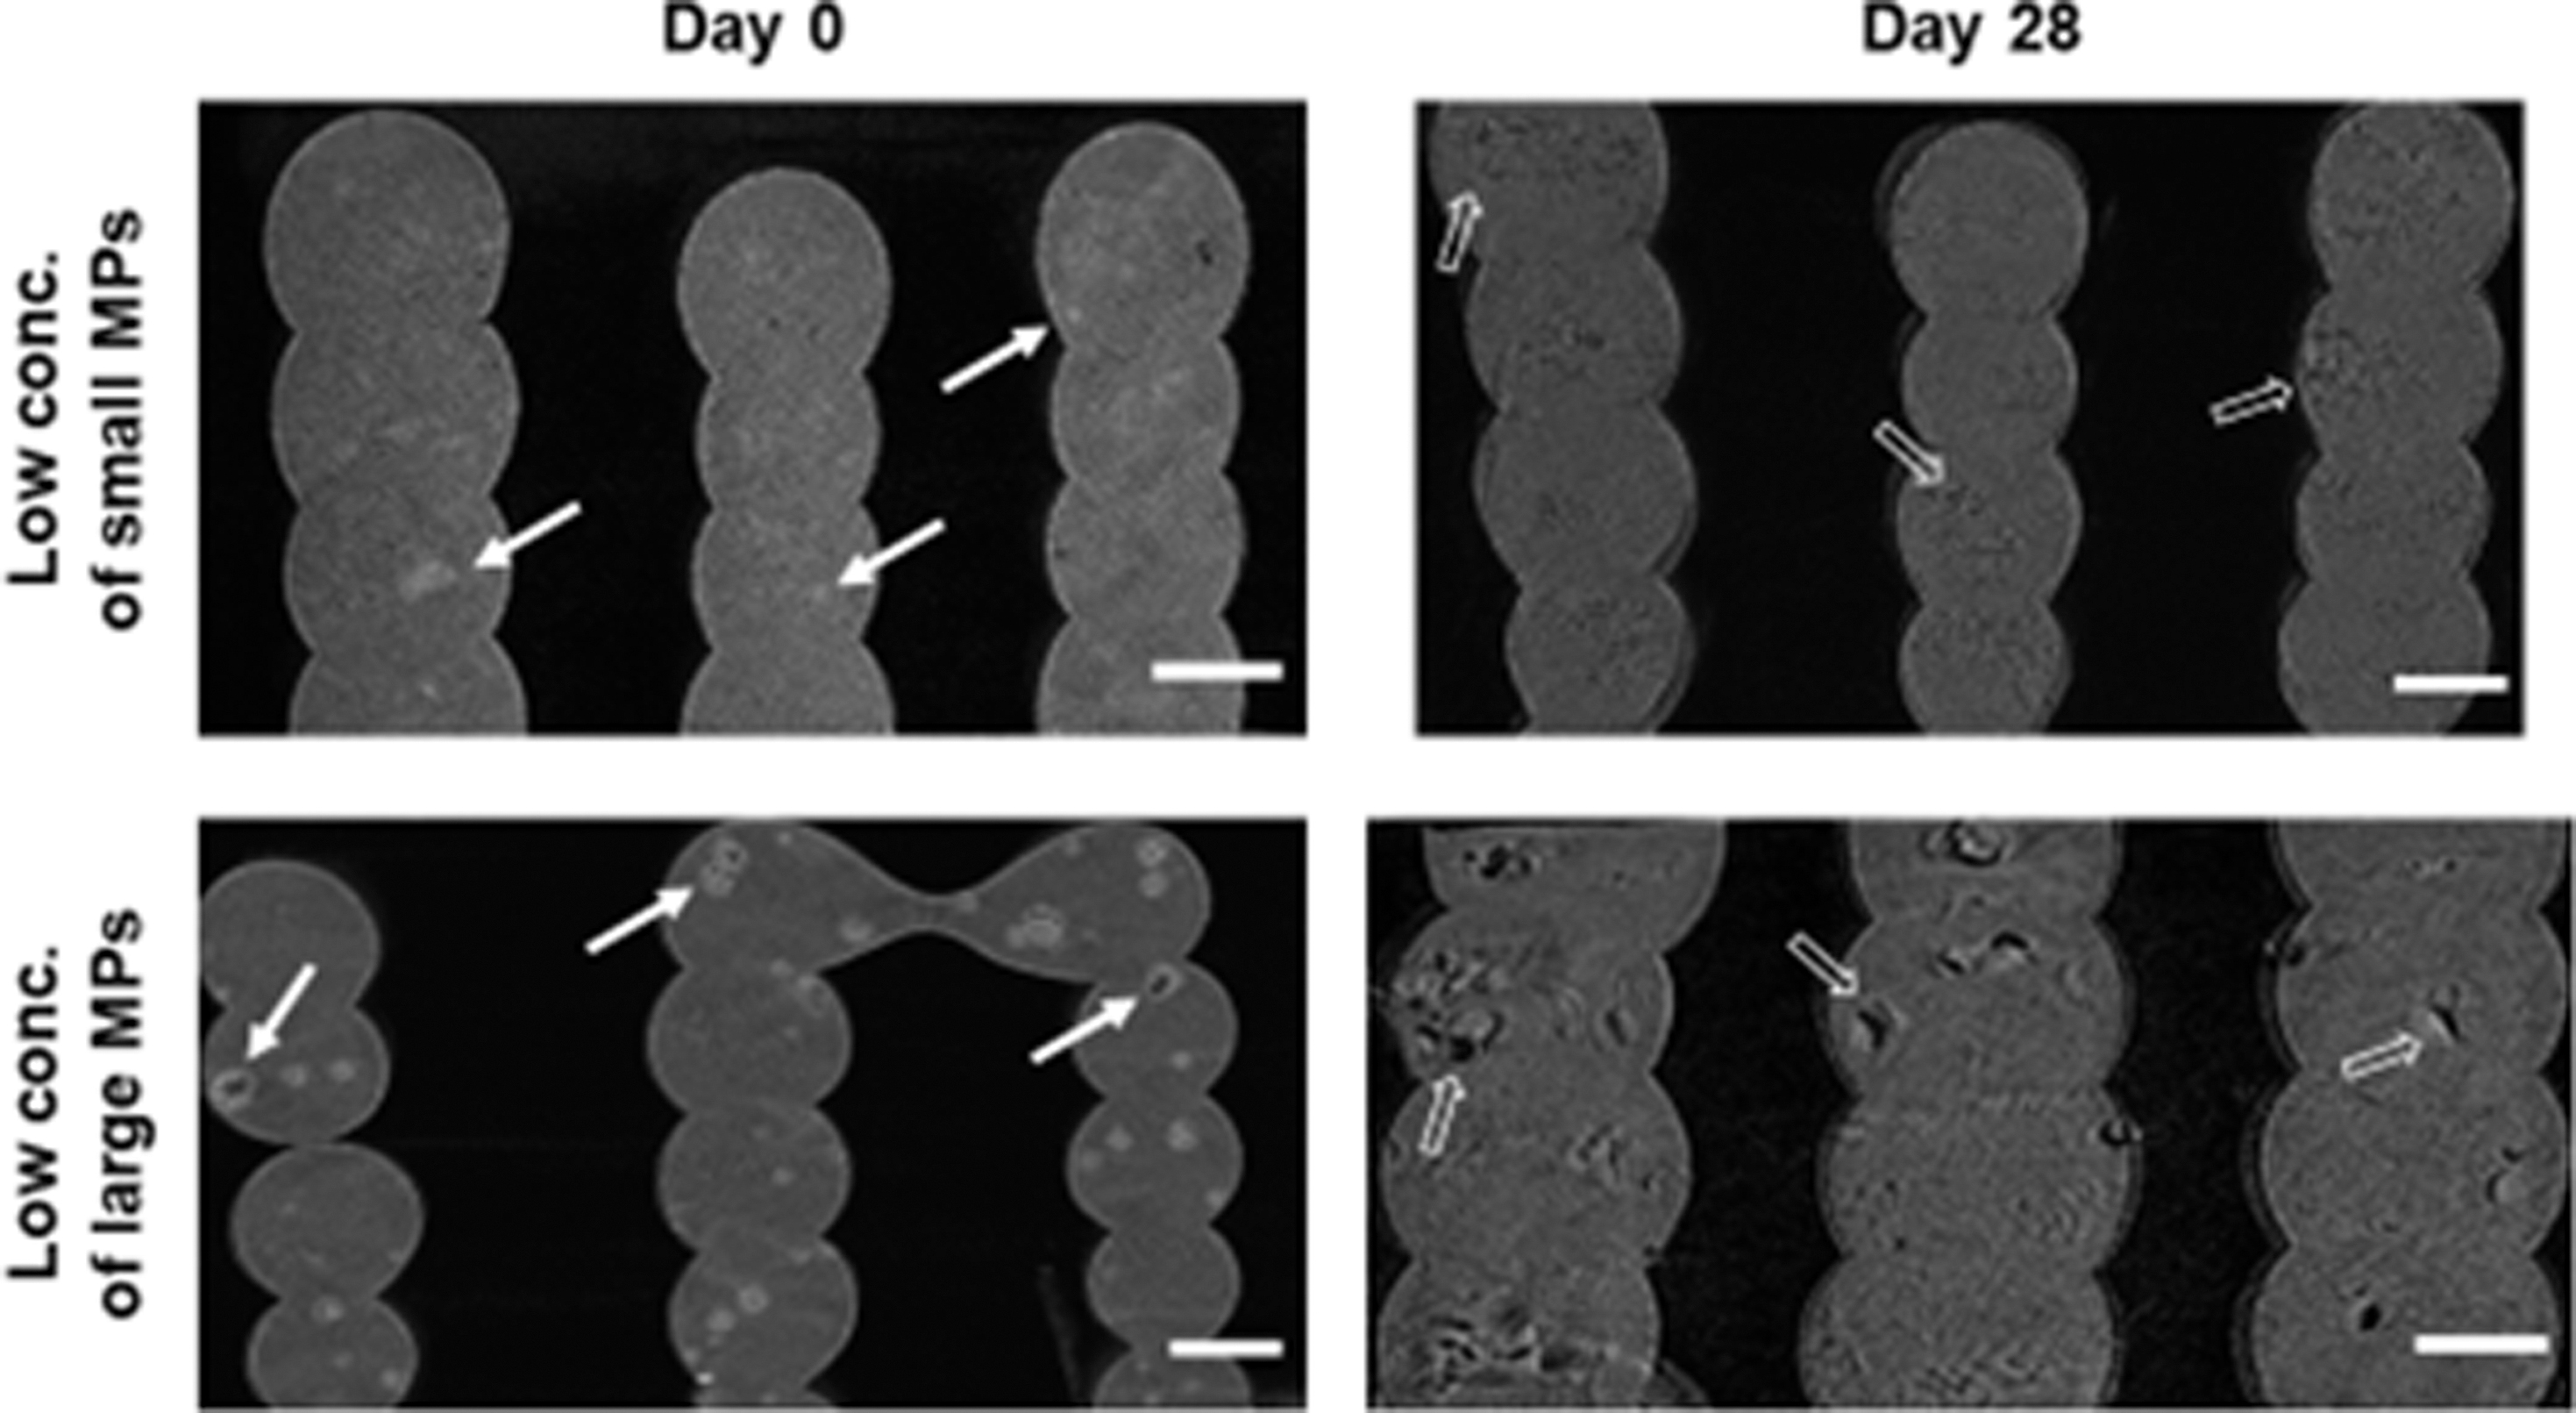
Particles and void spaces before and after degradation. Representative sagittal views from 3D reconstructions displaying radiopaque MPs (solid white arrows) and radiolucent intra-fiber void spaces (outlined white arrows) within PCL fibers (gray) before and after degradation. Scale bar = 500 μm. MP, microparticle; PCL, poly(ɛ-caprolactone).
As the duration of degradation progressed to Day 28, an increasing presence of radiolucent void space is noted. At this terminal timepoint, groups with large MPs display clustering of large intra-fiber void spaces, whereas the intra-fiber pores for groups containing small MPs appear as small void streaks. For the experimental groups containing large MPs, simultaneous observation of void space within the particle matrices can be noted at both pre-degradation (Day 0) and intermediate degradation timepoints (such as Day 14).
Next, quantification of the changes in percentage porosity of closed pores, open pores, and total pores was performed. For the groups involving both low and high loading of small particles (5-S-↓, 10-S-↓, 5-S-↑, and 10-S-↑), the percentage porosity of closed pores significantly differed from that of 10-L-↓, 5-L-↑, and 10-L-↑—containing large particles—at Day 28 (Fig. 6A). Also, for these three large-MP groups (10-L-↓, 5-L-↑, and 10-L-↑), the percentage closed porosity at Day 28 significantly differed from that at Day 7 and 14.

Degradation-induced changes in closed, open, and total porosity.
For both percentage open and total porosities, the two groups with the largest fiber diameters (high-temperature groups of 5-L-↑ and 10-L-↑) significantly differed from all of the low-temperature groups (5-S-↓, 10-S-↓, 5-L-↓, and 10-L-↓) and from 10-S-↑ (Fig. 6B, C). Only 5-S-↓ exhibited a change in open porosity with time, whereas 10-L-↓ additionally demonstrated a significant alteration in total porosity from Day 7 to 28.
In addition, Mw values of composite scaffolds underwent a statistically significant decrease from Day 0 to 28 for all low-temperature printing conditions (p < 0.05; Fig. 7A). Meanwhile, for three of the four high-temperature groups (all except 5-L-↑), the composite Mw increased from Day 0 to 28. Furthermore, multiple groups involving low printing temperature exhibited lesser Mw values than the high-temperature groups at each timepoint, including the Day 0 timepoint (Supplementary Table S1b).
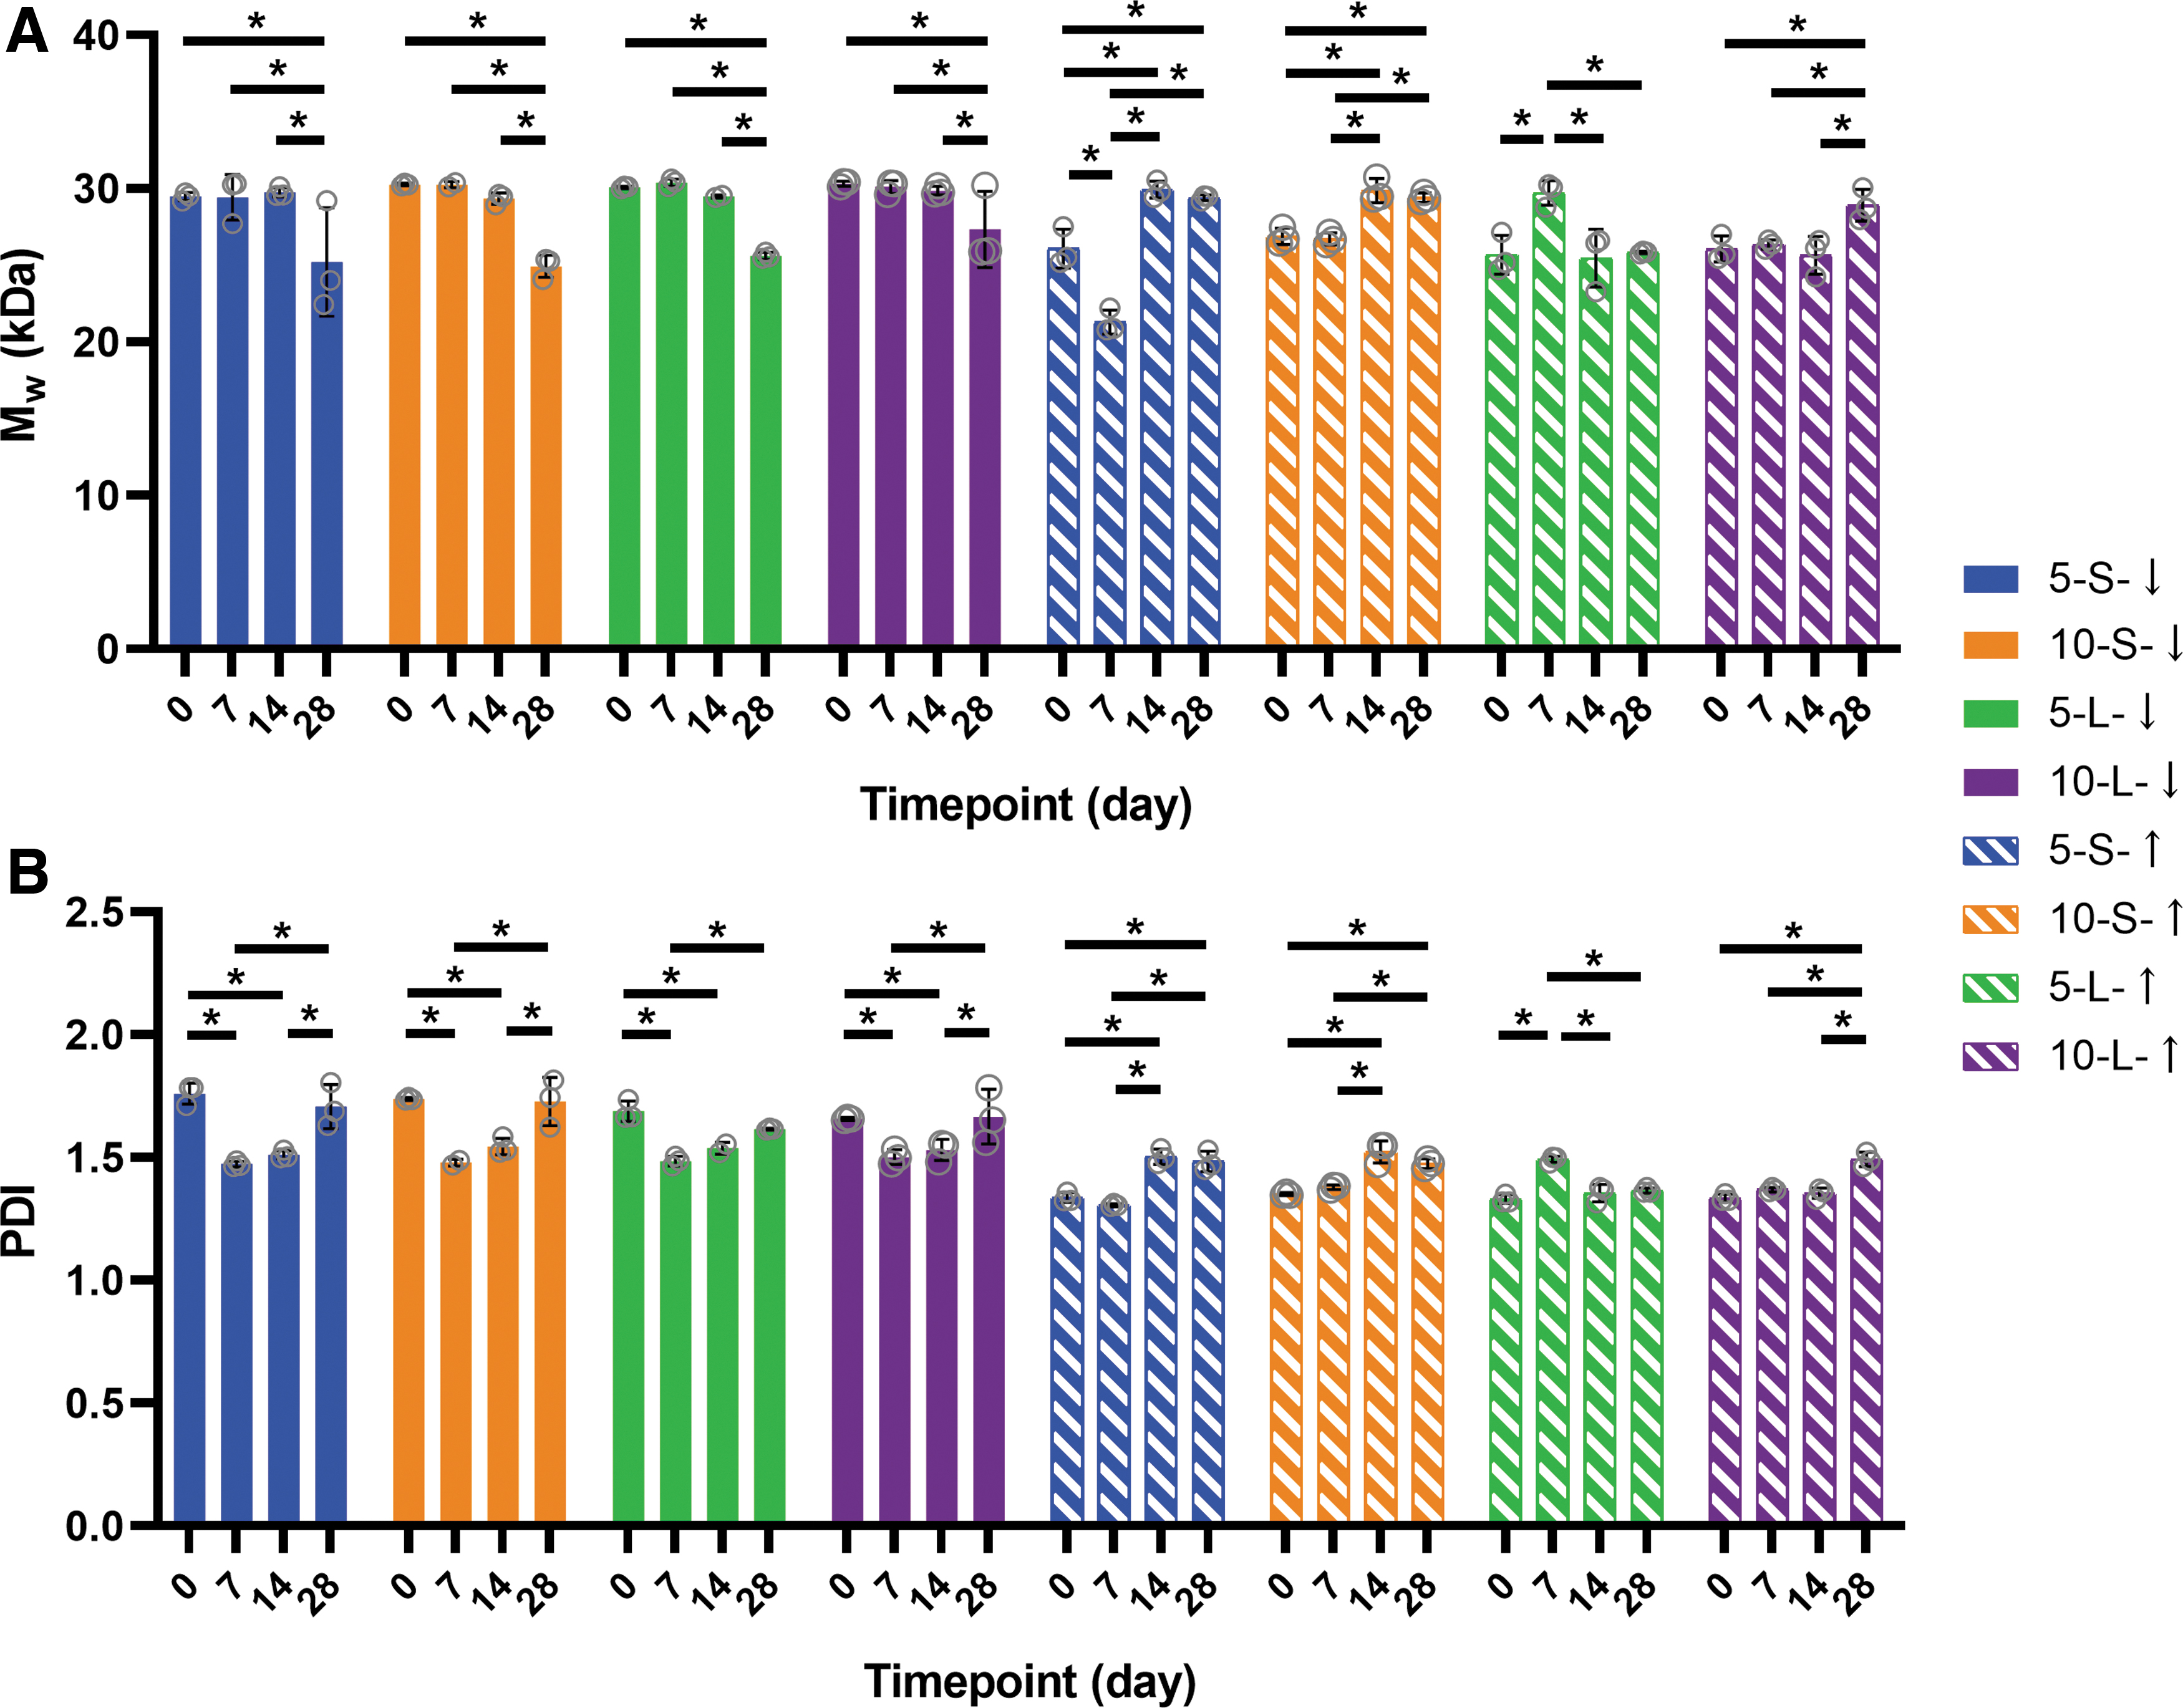
Degradation-induced changes in molecular weight and PDI.
For PDI values illustrated in Figure 7B, all low-temperature groups demonstrated significant reductions between Day 0 and 7, with a subsequent increase in PDI between Day 7 and 28, yet without an overall significant difference between Day 0 and 28. In contrast, three of the four high-temperature groups (again with the exception of 5-L-↑) exhibited an increase in PDI from Day 0 to 28 without significant differences during the initial degradation period (Day 0–7). The PDI measurements were also greater for low-temperature groups than high-temperature groups at both Day 0 and 28 (Supplementary Table S1c).
Reduction was also demonstrated for Mn values of all low-printing temperature groups between Day 7 and 28, whereas transient Mn elevations were evident at Day 7 for the two high-temperature groups with high MP loading concentration, 10-S-↑ and 10-L-↑ (Supplementary Fig. S4). Mn of the low-temperature groups was also lesser than for that of the high-temperature groups at the terminal Day 28 timepoint (Supplementary Table S1d).
Main effects analysis of molecular weight changes and porosities
Results of the main effects analyses for MP loading concentration and diameter on changes in molecular weights or porosities during degradation are shown in Tables 4 and 5 and Figure 8. At early timepoints (Days 7 and 14), MP concentration exhibited a significant reduction effect on Mn. This parameter also resulted in a significant effect on change in Mw between pre-degradation values and the terminal Day 28 timepoint. None of these effect sizes were found to be significant for closed microporosity, open macroporosity, or total porosity.

Plots of main effects of MP-related parameters on molecular weight changes and porosities during degradation.
Main Effects of Microparticle Loading Concentration Level (High or Low) on Changes in Molecular Weight and Porosities During Time Course of Degradation
Main Effects of Microparticle Diameter Level (High or Low) on Changes in Molecular Weight and Porosities During Time Course of Degradation
Discussion
To successfully harness the potential of 3D printing for biomolecule delivery applications, it must be ensured that the approach of using particulate carriers preserves the advantages of 3D printing. Namely, this methodology offers a capacity for fabricating constructs with high accuracy and precision, while also favorably facilitating the degradation of scaffold material and thereby the release of the biomolecule. Specifically, it must be determined how the characteristics of the biomolecule-loaded particles, such as their size and loading concentration, influence these various structural properties and dynamic behaviors.
Therefore, we employed a fractional factorial experimental design with two particle-related variables (loading mass ratio within PCL, MP diameter) and three printing-related variables (temperature, speed, pressure). We then characterized the degradation phenomena of 3D printed PLGA particle-loaded PCL scaffolds of these differing compositions and fabrication parameters.
We aimed to elucidate whether constructs with smaller MPs and lower loading concentrations would exhibit higher accuracy and precision, as well as a lower degradation rate (as illustrated by decreasing molecular weight and increasing porosity as a function of aqueous incubation time). Our main effects analyses established that although printing speed had an isolated effect on printing accuracy, the other parameters did not have significant effects on material accuracy and machine precision, neither individually nor in concert.
Furthermore, MP loading concentration was evidenced to exhibit significant effects on composite molecular weight throughout the degradation study, whereas no significant effects of MP loading concentration nor diameter on intra- nor inter-fiber porosities were identified.
To elaborate, the main effects analysis of 3D printing accuracy and precision with all five parameters included in the model did not yield statistical significance, and the study was not sufficiently powered for evaluation of interaction effects among multiple parameters. These findings indicate that particles of the investigated size and loading concentration can be included in 3D printed scaffolds without compromising the accuracy and precision of the construct design.
However, choosing more differentiated values of particle loading and printing parameters for the high and low levels of each factor may have otherwise yielded detectably sized effects. For instance, printing temperature and pressure are known to be especially influential on the geometric properties of resulting scaffolds.24,25 Furthermore, additional factors such as the thickness and orientation of printing layers may also play major roles in 3D printing accuracy. 26
Our lab previously performed a full factorial study regarding material accuracy and machine precision using a different synthetic polymer, poly(propylene fumarate). 16 Rather than particulate inclusions, a monomer was added to the printing mixture at various loading concentrations. In that work, lower printing speeds and higher printing pressures were found to favorably minimize the percentage errors for material accuracy, at the expense of machine precision.
In contrast, the present study found that increasing printing speed had an isolated negative effect (increasing percentage error) on material accuracy, whereas the influence of printing pressure was not determined to be significant. The observations are likely due to the differing flow properties of the polymeric melts.27–29 Other studies have shown differences in printed fiber morphology based on the loading percentage of additives. 30
The design of the present study was also intended to establish a framework for systematic investigation of the inclusion of additives in 3D printing material compositions. For example, although this study employed materials requiring printing temperatures above physiologic temperature, this paradigm could also potentially be applied in future studies to elucidate the effects on 3D printing accuracy and precision from the inclusion of hydrogel MPs that are appealing for heat-sensitive biomolecule loading and delivery.31–33
A notable advantage of the present work was its demonstration of the tunability of particulate delivery vehicle features. The MPs of two distinct size ranges were synthesized using facile modification of the fabrication methodology, by employing vortexing rather than sonication for one of the emulsion steps.34,35 Although the variations of these aspects have been extensively explored for a variety of cargo biomolecules, unloaded particles were included in this present work centered on 3D printing-related encapsulation effects. 36
This modification of particle size was performed to permit extrusion through the 22G (413 μm inner diameter) printing needle. Nevertheless, it was empirically noted that the small particles, even at the lower loading concentration, resulted in clogging of the needle during extrusion, requiring frequent manual clearance between printing of layers to avoid disruption of the scaffold structure.37–41 This aggregation phenomenon may also complicate the delivery of encapsulated biomolecules, as well as the accumulation or clearance of acidic degradation products.42,43 Future work can thus consider favoring the use of larger sized particles, as the present study demonstrated the preservation of material accuracy and machine precision with such an approach.
For the degradation studies, the macroscopic impression of whether PLGA particle degradation could occur when embedded in the bulk of slower-degrading PCL was indicated by minimal scaffold mass loss over 28 days. Although the phenomenon of mass loss during degradation is theoretically monotone increasing, the selected experimental design of measuring separate samples at each timepoint coupled with experimental variability resulted in deviance from a monotone increasing trend for some groups, particularly at the Day 14 timepoint.
Meanwhile, the microCT data indicated that the changes in closed microporosity (fiber-enclosed void volume resulting from MP degradation) indeed occurred for three of the four groups containing large MPs. As the appearance of radiopaque inclusions decreased while the enclosed void volume appeared to increase over time, it can be concluded that the PLGA MPs are able to degrade within the bulk PCL fibers. This capacity is further evidenced by the void space present within large MPs at intermediate timepoints. 44
To further study the degradation behavior of scaffolds at the molecular level, we then performed APC investigations of scaffolds subjected to degradation for up to 28 days. In comparing the reduction of composite molecular weights and changes in polydispersity among groups with differing concentrations of variably sized particles, no statistically significant differences were found.
When comparing behavior from low- versus high-temperature printing groups, the low-temperature groups displayed a general trend of Mw reduction during the degradation timecourse, whereas most of the high-temperature groups exhibited a trend of composite Mw increase. In addition, at the Day 0 timepoint (after exposure to printing conditions, before exposure to supernatant), the composite molecular weight of each low-temperature group was greater than that of high-temperature groups.
Therefore, the transient exposure of the printing materials to the elevated printing temperature can be proposed to modify the morphology of the bulk PCL material sufficiently to enable a greater degree of release of PLGA particle degradation products from the scaffolds over time.45,46 Without this temperature-based modulation, the remnants of more quickly degrading PLGA inclusions remain trapped within the minimally degrading PCL bulk, resulting in lower composite Mw, along with possible contribution of an auto-catalytic effect.47,48
Consequently, the observed degradation trends can be attributed to a complex interplay between transient thermal exposure and progressive hydrolytic degradation, as the morphology of scaffold fibers and physicochemical properties of the PCL matrix impact the release profile of MP degradation products.49,50
In addition, alteration of the small MPs' spherical morphology was observed for the small MPs embedded in printed fibers at the high temperature, whereas distinguishability from the PCL bulk matrix was maintained for the other particle size–printing temperature combinations. Both of the investigated printing temperatures (65 or 75°C) exceeded the manufacturer-reported glass transition temperature of the employed PLGA formulation (44–48°C).
Indeed, the more pronounced disruption of structural morphology for small MPs may be related to differential heat transfer from the PCL matrix to and across the smaller MP surface area and diameter, respectively.51–53 Furthermore, printing at elevated temperatures may influence the release profile and bioactivity of MP-encapsulated biomolecules, as discussed in our previous work. 19
Meanwhile, a decrease in PDI—indicating more monodispersity of polymer molecules within the scaffold—occurs through either the release of the lowest and/or highest molecular weight molecules, or through degradation of higher molecular weight chains (PLGA of Mw 39.5 kDa) to become more comparable in length to the other molecules in the composition (PCL of 30.0 kDa). 54 The latter was evidenced to occur during transient exposure to elevated printing temperatures, as the PDI measurements for high-temperature groups were less than that for low-temperature groups at both the beginning (Day 0, before exposure to supernatant) and the end (Day 28) of the degradation timecourse. 2
Within the degradation sequence, the lower-temperature groups exhibited a capacity to decrease in PDI within the first seven days, whereas the high-temperature groups did not, potentially due to the substantial morphological alterations that the high-temperature groups had already undergone during printing.55,56
In contrast, PDI increases when degradation of polymeric molecules of near-median molecular weight occurs, indeed for molecules that are not released from the bulk matrix and removed in the supernatant. 57 Such an increase in PDI was noted to take place for the overall degradation timecourse, as a recovery from the initial reduction during the first week occurred sufficiently to become statistically equivalent to the pre-degradation (Day 0) timepoint.58–60
This bitonic trend is evidence of competing degradation and possible release mechanisms occurring during the studied timeframe.2,61 Meanwhile, PDI monotonically increased for most of the high-temperature groups, indicating that after their transient thermal degradation, either a more singular phenomenon—namely, hydrolytic degradation—predominated, or that concomitant release mechanisms contributed complementary effects to the changes in composite scaffold composition. 62
However, a main effects analysis revealed that loading concentration, indeed, exhibited significant effects on changes in Mn at Days 7 and 14 and on Mw at Day 28. The conclusions from these findings must take into account the relatively small difference in the molecular weights of pure PLGA and PCL (Mw = 39.5 and 30.0 kDa, respectively), especially relative to the statistical errors of the measurements. The possible detectability of composite molecular weight differences in the case of PLGA degrading more quickly than PCL is also influenced by the relatively low content (≤10%) of MPs in the constructs. Indeed, Mn reduction is known to occur due to degradation during printing, and its degree increases with increasing time in a printing cartridge, potentially exacerbated by higher extrusion pressures (pneumatic thermal-oxidative degradation). 63
Nevertheless, the present study's illustration of changes in composite molecular weight is limited by the measurement of constructs remaining after degradation. Namely, the degradation products (such as lower molecular-weight polymer chains) that are able to be released through the bulk scaffold matrix into the supernatant are removed and excluded from APC measurement. Degraded polymer chains trapped within the bulk matrix by its inherent diffusion barrier, however, remain available for contribution to the composite molecular weight measurement. 64
The prospect of subdividing the composite molecular weight measurements into individual contributions from each polymer was further hindered by certain limitations. Specifically, one would need to assume a lack of PCL degradation during the 28 day period (which may in fact occur in the acidic environment facilitated by the PLGA degradation products65,66), as well as a sequestration of PLGA degradation products within the bulk material rather than leaching of these compounds into the periodically exchanged buffer medium.
Other works have investigated the effects of PLGA inclusion within PCL fibers on degradation, by modifying the lactic-to-glycolic acid ratio of incorporated PLGA. 67 Degradation products from PLGA formulations with slower degradation rates were found to remain for longer durations, affecting the hydrolysis of the surrounding PCL matrix, as defined by changes in Mn.
Ultimately, the known rates of degradation for these polymers are less than 3 months for the PLGA formulation and at least 2 years for PCL.68,69 Therefore, the penetration of water molecules carrying out hydrolytic degradation is evidently able to reach the MPs, with total PLGA degradation within 28 days enabled by its auto-catalytic degradation behavior.70–72 Meanwhile, the percentage open and total porosities remained consistent throughout the degradation timeframe for almost all groups, further supporting the interpretation that the PLGA MPs are able to degrade without being preceded by the bulk degradation of the PCL construct.72,73
The main effects analysis was found to be consistent with these findings, in that the MP-related parameters of loading concentration and particle diameter were not found to have significant effect sizes on closed microporosity, open macroporosity, or total porosity.
Conclusion
The sizes and loading concentrations of particle delivery vehicles investigated were found to have neither a beneficial nor disadvantageous influence on metrics of printing quality such as material accuracy and machine precision. This analysis suggests that the strategy of delivering bioactive molecules using protective particle delivery vehicles can be implemented in a manner that is compatible with the fundamental advantages of tissue engineering scaffold fabrication by 3D printing of thermoplastic polymers—the capacity to design the inner porous architecture and outer dimensions of scaffolds to optimize interactions with surrounding tissue.
3D printing can, thus, enable controlled loading of intermediary delivery vehicles within the bulk polymeric phase of the construct and subsequent controlled release of bioactive components through degradation of the bulk material and/or delivery vehicle.
For such degradation phenomena, the particle loading concentration was determined to accelerate degradation (as represented by change in composite number-average molecular weight) at early (Day 7) and intermediate (Day 14) timepoints, whereas particle size influenced the change in composite weight-average molecular weight during the full degradation time course (28 days). However, these two particle-related parameters were found not to exhibit significant effects on intra-fiber and inter-fiber porosity.
Therefore, optimizing the size and loading of particulate carriers within 3D printing formulations can independently enable tuning of the desired dosage and release behavior of delivered biomolecules, without disadvantageous disruption of the printed construct's structure.
Footnotes
Acknowledgments
The authors gratefully acknowledge Ian Spradlin and Seth Hogg of Microphotonics for their extensive guidance on microCT data acquisition and analysis, as well as Paul Engel for his input on characterization of polymer degradation.
Authors' Contributions
G.L.K., conceptualization, methodology, investigation, formal analysis, validation, visualization, writing—original draft, writing—review and editing; P.D.K., investigation; L.D.-G., methodology, writing—review and editing; S.Z.E., methodology, software, formal analysis; D.W.S., formal analysis, validation; M.D., conceptualization, methodology, visualization, writing—review and editing; A.G.M., conceptualization, methodology, validation, writing—review and editing, supervision, funding acquisition.
Author Disclosure Statement
No competing financial interests exist.
Funding Information
This work was supported by the National Institutes of Health (Grant P41 EB023833). G.L.K. was supported by the Robert and Janice McNair Foundation MD/PhD Student Scholar Program. S.Z.E. was supported by NIH F31 1F31HL147483-01. M.D. was supported by a Rubicon Postdoctoral Fellowship from the Dutch Research Council (NWO; Project No. 019.182EN.004).
References
Supplementary Material
Please find the following supplemental material available below.
For Open Access articles published under a Creative Commons License, all supplemental material carries the same license as the article it is associated with.
For non-Open Access articles published, all supplemental material carries a non-exclusive license, and permission requests for re-use of supplemental material or any part of supplemental material shall be sent directly to the copyright owner as specified in the copyright notice associated with the article.