
Abstract
Fluorescence assay technologies are commonly used in high-throughput screening because of their sensitivity and ease of use. Different technologies have their characteristics and the rationale for choosing one over the other can differ between projects because of factors such as availability of reagents, assay performance, and cost. Another important factor to consider is the assay susceptibility to artifacts, which is almost as important as the ability of the assay to pick up active compounds. Spending time and money on false positives or missing the opportunity to build chemistry around false negatives is something that every drug project tries to avoid. We used a BET family Bromodomain, BRD4(1), to explore the outcome of a screening campaign using three fluorescent assay technologies as primary assays. A diverse 7,038 compound set was screened in fluorescence lifetime, fluorescence polarization, and homogeneous time-resolved fluorescence to look at primary hit rates, compound overlap, and hit confirmation rates. The results show a difference between the fluorescence assay technologies with three separate hit lists and some overlap. The confirmed hits from each assay were further evaluated for translation into cells (NanoBRET™). Most of the actives confirmed in cells originated from compounds that overlapped between the assays. In addition, a well-annotated set of compounds with undesirable mechanism of inhibition was screened against BRD4(1) to compare the ability to discriminate true hits from artifact compounds. The results indicate a difference between the assays in their ability to generate false positives and negatives.
Introduction
Drug discovery requires reliable and consistent compound profiling processes to ensure high-quality data throughout hit identification and lead optimization. 1 The key requirements for any in vitro assay focus on robustness, reliability, cost-effectiveness, and low frequency of compound interference. Fluorescence-based screening technologies have become a dominant feature in high-throughput screening (HTS) and play an important role in drug discovery. Although these methods are well established, they are hampered by a number of issues such as inner filter effect (light absorption), quenching, autofluorescence, and light scattering from compound or assay reagents. 2 These interferences may give rise to false positives and negatives.
In this study, we used a BET (bromodomain and extra-terminal) family Bromodomain, BRD4, to compare three different fluorescence assay technologies in medium throughput screening. Bromodomains (BRDs) are protein modules that specifically recognize and bind to acetylated lysine residues on histone tails and are also referred to as epigenetic readers. Epigenetics is a growing area of interest in terms of targeting many disease states within, for example, oncology, central nervous system, and inflammatory and cardiovascular diseases. 3 BRD4 contains two bromodomains (BD1 and BD2) and an extra-terminal domain. Bromodomains have a highly conserved secondary structure consisting of ∼110 amino acids, forming 4α-helices linked by two variable loop regions (ZA and BC loop). 4,5 Both loops shape a largely hydrophobic cavity providing the binding pocket for ɛ-N-acetyl-lysine residues (Kac) in histones and many other proteins. 4
A number of BRDs have been shown to be druggable with small molecules as they have a conserved, deep, largely hydrophobic pocket and this makes them attractive drug targets. Several publications have described potent and selective inhibitors targeting the BET family that have been studied in different disease models. 6 –8 The inhibiting effect of the molecule JQ1 has been proven in nuclear protein of the testis (NUT) midline carcinoma through inducing differentiation, antiproliferation, growth arrest, 7 and inflammatory response. 9 One of the most advanced BET bromodomain inhibitors, I-BET762 or GSK525762, is now in clinical trial for NUT midline carcinoma and other cancers. 10
Fluorescence lifetime (FLT)-based technologies have been used for more than a decade but have not been accepted as an HTS technology. FLT is considered a robust readout parameter and the technology should be less prone to compound interference compared with conventional readouts because of the long lifetime fluorophores used in both binding and activity assays. 11 The FLT of a fluorophore is the average time it spends in the excited state before returning to the ground state. This occurs within 100 ns and is captured using real-time decay curve analysis that records a complete and accurate fluorescence decay curve for every laser pulse. 12 The readout is an average of 2,000 pulses.
Fluorescence polarization (FP) is a well-established assay technology that is dependent on the change in polarization upon binding of a small fluorescent molecule (probe) to a macromolecule. FP has been used widely as an HTS technology across a broad range of target classes. 13 The assay technology is relatively insensitive to inner filter effects, but can suffer from autofluorescence and light scattering of compound precipitation and aggregation. 13 The readout is ratiomeric that compensates for instrument-associated noise. The interaction between the probe and the protein cannot be too strong or too weak, where the former will increase the variation and increase the risk of compounds masking the fluorescence. A weak interaction requires higher concentration of protein, which apart from the cost also affects the tight-binding limit and increases the risk of probe aggregation. 14,15
Homogeneous time-resolved fluorescence (HTRF®) has been extensively used in HTS and is known to be a robust assay technology. HTRF is a combination of FRET (fluorescence resonance energy transfer) with time-gated measurement that makes it less prone to compound autofluorescence. FRET is based on a donor and acceptor fluorophore coming into close proximity that enables an energy transfer followed by an emitted signal after excitation. The readout is ratiometric that corrects for dispensing errors or reader background noise, and the donor channel can be used to remove compounds interfering with the assay signal. 15
Two different compound libraries were screened to understand primary hit rates, compound overlap, hit confirmation, and the ability to discriminate true hits from artifact compounds. For translation into cells a NanoBRET™ assay from Promega (Madison, WI) was used that allows for detection of bromodomain/histone interactions in live cells in the context of natural chromatin using full-length proteins or domains. 16 In addition to this, differential scanning fluorimetry (DSF) was used to gain further insight about target engagement of the active compounds. 17 Finally, we generated initial selectivity data within and between different bromodomain families by testing the confirmed actives against BRD2 (BET family) and BRD9 (type IV family) in DSF (Fig. 1).
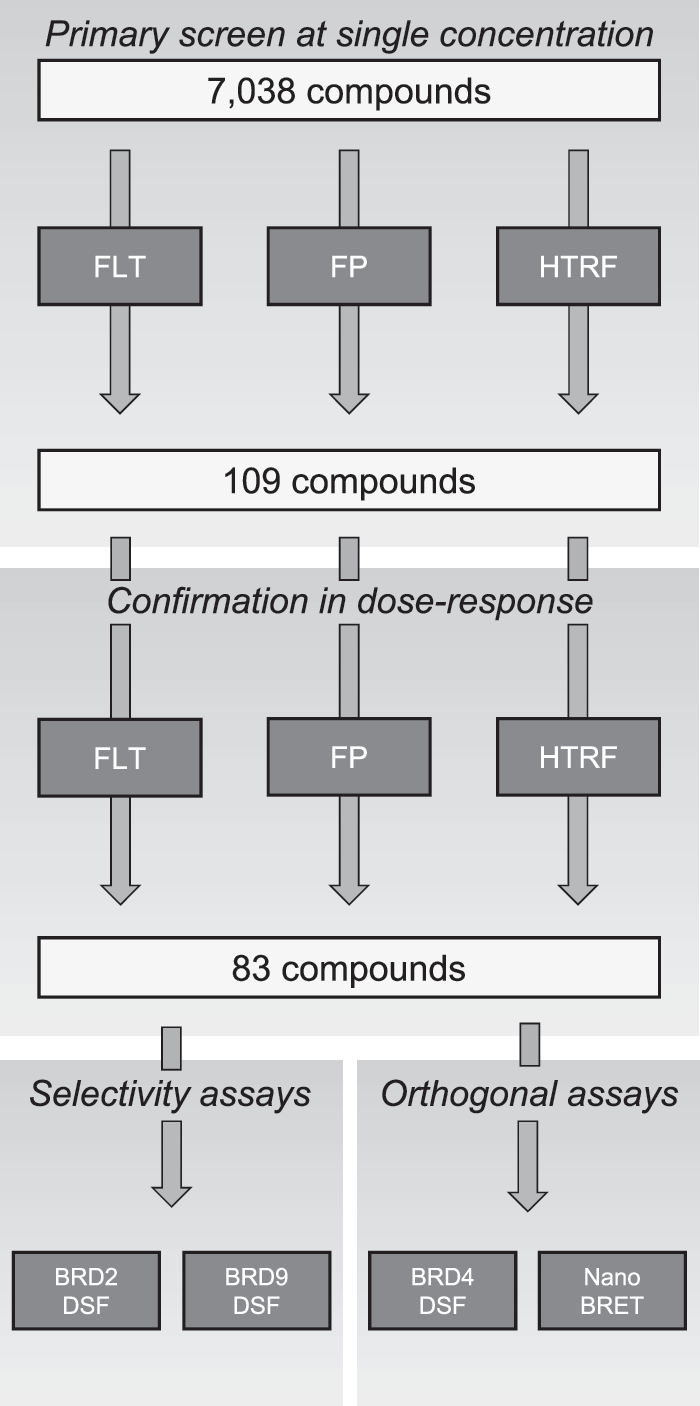
Screening cascade for the 7K compound set and the number of compounds tested in the different assays.
Materials and Methods
Expression and Purification of BRD2, BRD4, and BRD9 Proteins
Expression constructs encoding human recombinant N-terminal His6-tagged bromodomains BRD2(1) (84–168), BRD4(1) (42–169) (BlueSky Bioservices, Worecester, MA) and BRD9 (136–239) (Life Technologies, Carlsbad, CA) were transformed into competent Escherichia coli BL21 Gold (DE3) or Star™ (DE3) (BRD9). Bacteria were grown overnight in precultures of 20 mL LB medium or 50 mL TB medium (BRD9) with 50 μg/mL Kanamycin at 37°C with shaking 140 or 200 revolutions per minute (RPM) (BRD9). The preculture was diluted 1:100 into TB medium containing 50 μg/mL kanamycin and cells were grown at 37°C with shaking 200–250 RPM to an OD600 between 0.3 and 0.5 before the temperature was shifted to 18°C. At OD600 ∼1 protein expression was induced over night by addition of 1 or 0.5 mM (BRD9) IPTG (isopropyl-β-
FLT Assay
The BRD4(1) FLEXYTE® FLT assay from Almac (Edinburgh, United Kingdom) is a competition binding assay measuring compound displacement of a diacetylated peptide. The bromodomain is site-specifically labeled with the long lifetime fluorophore, FLEX17™, which lifetime is reduced through binding of a histone H4 acetylated peptide (GRGKacGGKacGLGKG-NH2) labeled with Almac's Delta™ lifetime small molecule modulator. In the presence of an inhibitor that binds to BRD4(1) the formation of a protein–acetylated peptide complex is prevented, causing an increase in the lifetime signal by eliminating the dynamic quenching mechanism.
The FLT assay was run in black, low-volume, medium-binding, 384-well plates (Greiner Bio-One, Monroe, NC) in a total volume of 12 μL with an assay buffer that contained 20 mM sodium phosphate pH 7.0, 150 mM NaCl, 0.1% CHAPS (3-[(3-cholamidopropyl)dimethylammonio]-1-propanesulfonate) (w/v), and 1 mM dithiothreitol (DTT). Assay-ready plates were prepared by adding 40 nL compound or dimethyl sulfoxide (DMSO) with an Echo 555 acoustic dispenser (Labcyte, Sunnyvale, CA). This was followed by addition of 10 μM H4 diacetylated peptide (AFL-ER-111; Almac) and 100 nM BRD4(1), giving a final concentration of 0.3% (v/v) DMSO. The inhibitor control in the assay was JQ1 at a final assay concentration of 33 μM. Plates were centrifuged (5 s at 800 RPM) and incubated at room temperature for at least 1 h before readout. Data were collected by reading the plates on the Ameon® plate reader (TTP Labtech, United Kingdom). FLT measurements were performed using the default instrument settings. The decay curve data were fitted by a monoexponential model using the Ameon data analysis software. The final assay readout was FLT, tau, with the additional parameters intensity and amplitude.
FP Assay
The FP assay measures the displacement of a fluorescently labeled small molecule (Alexafluor 647-JQ1-like probe) from the recombinant protein. The change in polarization value in the presence of a test compound is used to determine the relative affinity of the compound for BRD4(1). FP assay buffer was prepared on the day of the assay by addition of 0.1% Tween-20 (v/v) and 1 mM DTT to phosphate-buffered saline (PBS)/A (2.7 mM KCl, 1.8 mM KH2PO4, 137 mM NaCl, 10 mM Na2HPO4•2H2O). The assay was run in 384-well, black, low-volume medium-binding plates (Greiner Bio-One) containing 40 nL compound or DMSO (predispensed with Echo 555 acoustic dispenser; Labcyte). To the assay-ready plates 10 nM fluorescent probe was added followed by 100 nM BRD4(1). The inhibitor control in the assay was JQ1 at a concentration of 33 μM. Final concentration of DMSO in the 12 μL assay volume was 0.3% (v/v). Plates were centrifuged (5 s at 800 RPM), incubated for at least 1 h at room temperature before reading on a PHERAstar plate reader (BMG LABTECH GmbH, Ortenberg, Germany) using an FP optic module (excitation at 590-50, emission at 675-50/675-50).
HTRF Assay
The HTRF assay is a binding assay measuring the interaction of a custom-made tetra-acetylated peptide and BRD4(1). A donor (anti-His6 antibody) binds to the his-tagged protein and a streptavidin-acceptor fanconi anemia complementation group C (FAC) antibody to the peptide resulting in a time-resolved FRET signal when in close proximity. The interaction can be disrupted by a small molecule and results in a lower signal. The HTRF assay was run in black, low-volume, medium-binding, 384-well plates (Greiner Bio-One) with a total assay volume of 12 μL. Assay buffer was prepared on the day of the assay by addition of 0.1% Tween-20 (v/v) and 1 mM DTT to PBS/A (2.7 mM KCl, 1.8 mM KH2PO4, 137 mM NaCl, 10 mM Na2HPO4•2H2O). To the assay-ready plate containing 40 nL compound or DMSO (predispensed with Echo 555 acoustic dispenser; Labcyte), 100 nM BRD4(1) was added followed by 0.5 μM peptide [SGRG - K(Ac) - GG - K(Ac) - GLG - K(Ac) - GGA - K(Ac) - RHRKVGG - K(Biotin)] (Anaspec, Europe), 1 nM donor (anti-His6 antibody) and 100 nM streptavidin-acceptor (FAC) antibody. The final DMSO concentration was 0.3% (v/v) DMSO. The inhibitor control in the assay was JQ1 at a final assay concentration of 33 μM. Plates were centrifuged (5 s at 800 RPM) and incubated at room temperature for at least 1 h before reading on a PHERAstar plate reader (BMG LABTECH GmbH) using an HTRF optic module (excitation at 337 nm and emission at 620 and 665 nm).
Surface Plasmon Resonance
Surface plasmon resonance (SPR) experiments were conducted on a Biacore 3000 instrument (GE Healthcare). Running buffer was 10 mM HEPES, pH 7.4, 150 mM NaCl, 0.005% Tween-20, and 1 mM TCEP. A NTA chip (NID500l; Xantec Bioanalytics, GmbH) was docked to the instrument and surfaces were washed with 50 mM NaOH, 1 M NaCl for 3 × 60 s, and 500 mM EDTA, pH 8.0 for 120 s before loading the chip with Nickel ions by injecting 300 μM NiCl for 300 s. Surfaces were then activated using NHS/EDC for 420 s and BRD4(1) (diluted to 0.35 μM in running buffer) was captured for 180 s. Inactivation of surfaces were achieved using 100 mM Tris pH 8.0 for 420 s. All experiments were carried out at 20°C.
Samples were diluted from either 10 mM DMSO stock solutions or water stock solutions. Final DMSO concentrations in all samples were 1%. Samples were tested at seven different concentrations in duplicates. The resulting sensograms were reference-subtracted and blank-subtracted. Max response values for each concentration were fitted using a Langmuir binding isotherm (GraphPad Prism) to obtain Kd values.
NanoBRET Assay
The BRD4 NanoBRET (Promega) assay measures the functional interaction between the Histone H3.3 and full-length BRD4 in HCT116 cells (human colorectal carcinoma cell line, Cat No. CCL-1573; American Type Tissue Culture Collection, Manassas, VA). The cells were cultured in McCoy's 5A medium containing 2 mM glutamine and 10% fetal calf serum. A transient cotransfection with Histone H3.3-Halotag (NM_002107) and NanoLuc-BRD4 full-length (aa1-1362–060885; Promega) were carried out using MaxCyte® STX™ and cells were frozen down immediately after transfection. Cryopreserved cells were thawed and resuspended in OptiMEM (Life Technologies, Carlsbad, CA) supplemented with 4% fetal calf serum at a density of 4 × 10⁵ cells/mL in the presence of 100 nM NanoBRET 618 fluorescent ligand (Promega). Cells were then seeded, 20 μL/well, into 384-well white, flat-bottom tissue culture-treated plates with compounds or vehicle (predispensed with Echo 555 acoustic dispenser; Labcyte). The inhibitor control in the assay was JQ1 at a final assay concentration of 33 μM and the final DMSO concentration was 1% (v/v). Plates were incubated for 28 h at 37°C in the presence of 5% CO2. NanoBRET furimazine substrate (Promega) was added at a final concentration of 10 μM. Plates were read within 10 min on a PHERAstar FS plate reader (BMG LABTECH GmbH) using a LUM optical module (450-80 nm bandpass and 610 nm longpass).
DSF Assays
DSF directly records protein interaction of compounds. The DSF assays were performed in 4titude FrameStar 384 well plates (4titude, Surrey, United Kingdom) in assay buffer prepared by addition of 1 mM DTT to PBS/A (2.7 mM KCl, 1.8 mM KH2PO4, 137 mM NaCl, 10 mM Na2HPO4•2H2O). A 10 μL reaction was conducted by addition of 5 μL of protein and 5 μL of 10 × SYPRO® orange (Sigma-Aldrich, St. Louis, MO) to 30 nL compound or DMSO already present in the plate (predispensed with Echo 555 acoustic dispenser; Labcyte). Final concentrations were 5 × SYPRO orange and 4 μM of either BRD4(1) or BRD9 or 3 μM of BRD2(1). The inhibitor control in the assays were JQ1 for BRD4(1) and BRD2(1) and an in-house compound for BRD9. Control compounds had a final assay concentration of 30 μM and the DMSO concentration was 0.4%. The LightCycler® (Roche, Basel, Switzerland) was programmed to increase temperature from 20°C to 85°C at a rate of 0.6°C/s, 10 acquisitions per degree celsius. Tm was calculated using midpoint (Geometric) and first derivative methods. The midpoint method defines arithmetic midpoint between upper and lower plateaus as Tm, whereas first derivative method calculates the first derivative of the melting curve and defines max value as Tm. Melting temperature from both methods should agree with each other and differences can be used to identify irregular curves. For a compound to be considered as an active hit the ΔTm (shift in Tm between compound and DMSO control) should be greater than 0.9°C or 3 × standard deviation (SD) of the DMSO control.
Compound Library and Data Handling
The library screened in FLT, FP, and HTRF assays consisted of 7,038 compounds in a diversity set (7K) that represents the AstraZeneca compound library. In addition to this an uMOI (undesirable mechanism of inhibition) set of 1,010 compounds was tested to evaluate the susceptibility of the assays to uMOI such as aggregators, metal-containing and redox-active compounds. Both compound libraries were tested at single concentration (6.7 μM final assay concentration) and the hits from the 7K set were followed up in hit confirmation using a 10-point dose–response ranging from 33 μM to 1 nM. All hits that were available in our compound store at that time were also tested in NanoBRET and DSF (Fig. 1). The confirmation criteria in dose-response was set by the activity threshold of the assay. A compound was considered active if the highest concentration data point had a %effect above the threshold.
In all assays except DSF data were normalized against a neutral (DMSO) and an inhibitor control and %effect was calculated. Controls were included on every plate with a total of 24 wells or more. In hit confirmation, the half maximal inhibitory concentration (IC50) was calculated using a 4-parameter Hill equation:
where Y is percent inhibition; S 0, the activity level at zero concentration of test compounds; and SInf , the activity level at infinite concentration. IC50 is the concentration at which activity reaches 50% of maximum level; n, the slope at IC50; and c, the concentration in logarithmic units corresponding to the values on the x-axis of the dose–response curve plot.
In DSF the ΔTm between tested compound and DMSO was calculated using the midpoint and first derivative methods described under the DSF assay method previously. Both results should be above the activity threshold (0.9°C or 3 × SD of neutral control) for the compound to be considered active. All data handling was performed using Screener 12 or 13 (Genedata AG, Basel, Switzerland). The activity cutoff in single-concentration testing was defined using a combination of 3 × SD of neutral control and the frequency distribution from the diversity set (7K). For dose–response testing the activity cutoff was determined based on 3 × SD of neutral control or 30% effect at the highest tested concentration.
The FLT data analysis workflow contained a postanalysis qualification step. This used additional information from the decay curves and the fit results to flag interferences. The maximum signal amplitude limit was set to 900 and intensity to 37,000. All compounds with signal above one or both of those limits were flagged as irregular and nonactive. The model used for decay curve fitting was as follows:
where I(t) is intensity at time t, A is amplitude, t is time (ns), τ is lifetime tau (ns), and bg accounts for any instrument background. The values of these parameters are obtained by nonlinear curve fitting. The total intensity is the area under the curve (AUC), that is, the integral of I(t) for all times t.
The assay quality control of every experimental run was performed by calculation of Z′-factor and coefficient of variation (CV). The statistic value Z′-factor is widely used as a measure of assay quality, showing the separation between the distributions of the inhibitor and neutral controls. The Z′-factor describes how well separated the inhibitor and neutral controls are and indicates likelihood of false positives or negatives. Values between 0.5 and 1 are excellent, values between 0 and 0.5 may be acceptable, and values <0 indicate the assay is unlikely to be usable in a high-throughput context.
The Z′-factor was calculated using the following formula:
where σn
and σi
are the SDs of the neutral (DMSO) and inhibitor controls, respectively, and μn
and μi
are the mean values of the neutral and inhibitor controls. There were 24 or more control wells on every plate and the results are presented as an average of all experiments. The CV was calculated from the SD and mean of the neutral control with the following formula:
To validate the assays before screening we tested 24 compounds or more on three separate occasions and the reproducibility is given in terms of confidence interval ratio (CIR) and minimum discriminatory ratio (MDR). The CIR value defines a 95% confidence interval for the (geometric) mean of IC50. More specifically, the observed average IC50 is multiplied by CIR to produce the upper limit and divided by CIR to produce the lower limit of the confidence interval. The CIR value depends on the number (N) of occasions a compound has been tested according to the formula:
The MDR value shows the fold change in IC50 value required to claim (with 95% certainty) that the IC50 of two compounds differ. It is calculated from CIR, and thus also depends on the number of occasions the compounds have been tested.
A false-negative compound is inactive in the primary assay in single concentration but later confirmed in dose–response in the same assay, that is, it originated from one or two of the other assays. A false-positive compound refers to the specificity of an assay, that is, if the compound is active through some unspecific mechanism. This type of compound interference can be reproducible or not. In this study we use the term false positive for compounds picked up in the primary assay in single concentration but later not confirmed in dose–response in the same assay.
Results
Assay Conditions and Quality
All three fluorescence technologies used the same protein concentration of BRD4(1), 100 nM, and the probe concentration in each assay was titrated for optimal assay window. In FP, 10 nM of the Alexafluor 647-labeled small molecule JQ1 was sufficient for a good signal window and almost identical to the Kd of 12 nM of JQ1 measured in SPR (results not given). The peptide used as probe in FLT was diacetylated with a good signal window at 10 μM, which is four times below the Kd of the unlabeled peptide, 39 μM in SPR. In HTRF a biotinylated tetra-acetylated peptide was used at a concentration of 0.5 μM, three times below Kd of the unbiotinylated tetra-acetylated peptide (SPR data not given). The probe concentrations in FLT and HTRF was a balance between concentration needed to achieve a good signal window and cost of reagents. Assay development resulted in identical buffer composition for FP and HTRF to gain optimal assay signal. For FLT a different detergent, CHAPS was used, because Tween-20 interferes with the technology readout.
The assay quality for both FP and FLT was high with Z′-factors 18 of 0.9 and 0.8, respectively, and very low variation indicated by control well CV values of 1%–2%. For HTRF the Z′-factor was lower (0.4) mainly because of the small signal to background (∼2) and a CV of 10%. The Z′-factor for the NanoBRET was 0.5 and the CV 4%. CIR was calculated to 1.12 for both the FLT and FP assays with MDR of 1.17 (FLT) and 1.18 (FP) for compounds tested on three different occasions. The CIR for the HTRF assay was 1.91 and MDR 2.49, whereas NanoBRET had a CIR of 2.30 and an MDR of 3.24. All assays met our in-house quality control criteria (CIR <3, MDR <4) for compound screening. With the lower assay quality of the HTRF assay the 7K compound set was screened twice to assure the robustness of the data produced and because the correlation between the two assay runs was good, we present results from only one replicate.
The activity cutoff in single-concentration screening was set to 20% in FP and 30% in FLT and HTRF. This was above 3 × SD of neutral control for each of the three assays and considered to be an appropriate cutoff when looking at the activity distribution profiles. In the FP assay a low cutoff was set because of the low variance within this assay combined with the higher affinity of the JQ1-like probe compared with peptides used in FLT and HTRF. In dose–response testing the cutoff was 30% for all assays.
Assay Comparison of Reference Compounds
A minimum of 24 compounds, both literature and in-house, with an activity range spanning from nano- to micromolar IC50 were tested in dose–response in the three biochemical assays and in the cell-based NanoBRET. For a small set of literature compounds the results were compared with published data (Table 1). Overall the apparent potency in the biochemical assays correlate well with the same ranking of compounds but with higher potency in FLT compared with HTRF and FP. In NanoBRET the potency of all compounds were in line with the data from FLT except PFI-1 that showed a five-fold increase in IC50. The reference compound JQ1 show a two-fold difference in IC50 between FLT/NanoBRET and HTRF/FP (Fig. 2). The selective bromodomain 2 inhibitor RVX208 showed high IC50 values in all assays. In DSF JQ1 showed a 9.7°C shift, which is very similar to earlier reported results from Filippakopoulos et al. 7

Dose–response curves of JQ1 tested in FP (black circle), FLT (black square), HTRF® (white triangle), and NanoBRET™ (white circle). The data presented are mean ± SD of triplicate wells (n = 3). FLT, fluorescence lifetime; FP, fluorescence polarization; HTRF, homogeneous time-resolved fluorescence; SD, standard deviation.
Literature Compounds Tested in All BRD4 Assays
DSF, differential scanning fluorimetry; FLT, fluorescence lifetime; FP, fluorescence polarization; FRET, fluorescence resonance energy transfer; HTRF, homogeneous time-resolved fluorescence; IC50, half maximal inhibitory concentration.
The literature compounds were also tested against BRD2(1) and BRD9 in DSF, showing similar results for BRD2(1) as for BRD4(1), whereas none of the compounds showed target engagement against BRD9 (results not given).
Hit Finding and Confirmation
From the single-concentration screening of the 7,038-compound diversity set the hit rate was low in the FP assay and almost double in FLT and HTRF assays. There were 58 (0.82%) putative actives from the FLT assay compared with 32 (0.45%) in the FP and 66 (0.93%) in HTRF assays (Table 2). A total of 113 compounds became classified as hits and from the correlation analysis, there was an overlap of 17 compounds between the three assays. The confirmation rate going from single point to dose–response was 72% in FP, 66% in HTRF, and 100% in FLT (Table 2). Of the hits from all three assays (113 compounds) only 17% were universally identified. FLT and HTRF picked up 33 and 43 unique actives, respectively, whereas FP detected 11 unique hits (Fig. 3).
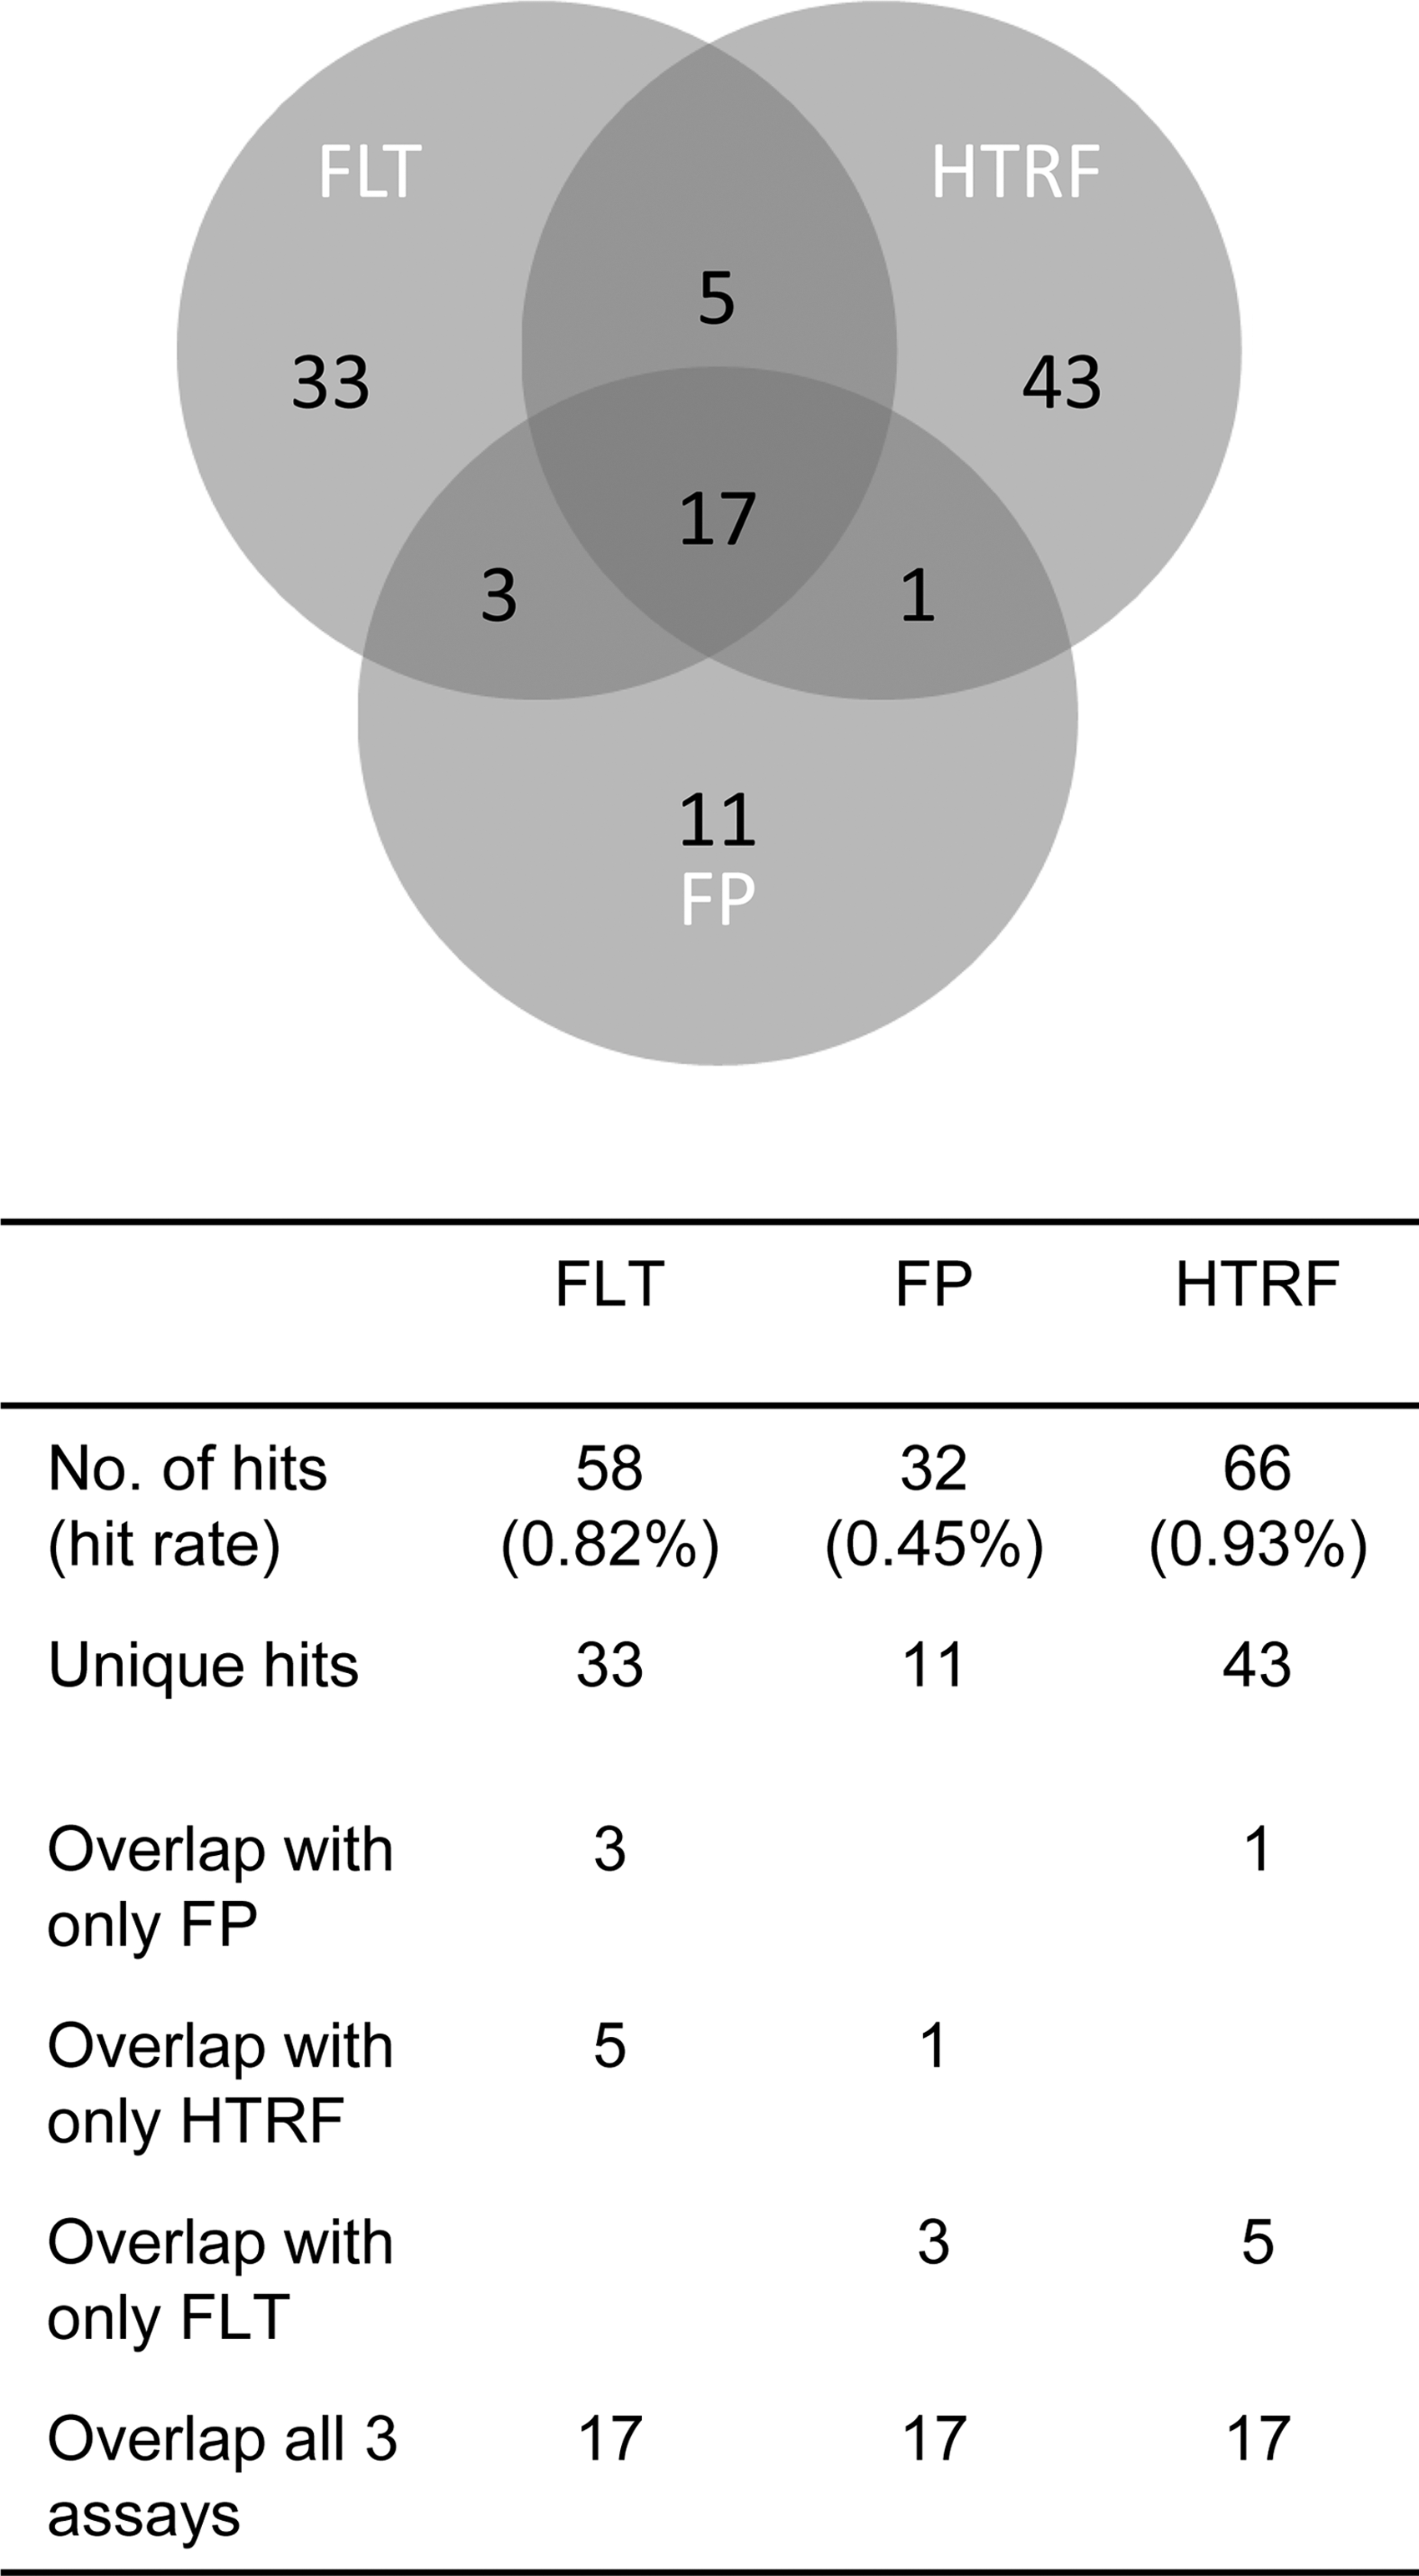
Actives from single-concentration screening in the three assays.
Hit and Confirmation Rates in the Three Assays
Subsequently we took forward a combined total of 109 compounds available in the compound store into hit confirmation by testing them in a 10-point dose–response format in the same three fluorescence assays. Of those 109 compounds, 39 were identified in all three assays and 44 were active in one or two assay technologies. All 3 assays picked up 50–60% of the 109 tested compounds, whereas the unique confirmed hits were similar in numbers for FLT (14) and HTRF (13), and with a lower number in FP (3) (Table 3). Of the 39 confirmed compounds in all three assays, 11 were uniquely identified by FLT in the previous single-concentration screening.
Confirmation in Dose–Response of the Hits from the Single-Concentration Screening
Going from 6.7 μM in single concentration to 33 μM in dose–response will allow for a higher number of active compounds in each assay. Using an activity threshold of 10 μM in dose–response, which is close to the concentration used in the single-concentration screening, resulted in four compounds for FP and five for HTRF that can be classified as false negatives, that is, should have been identified in single-concentration screening. One compound can be identified using the same criteria for FLT. The IC50 values for the 39 overlapping compounds correlates, within threefold difference, and shows decrease in potency going from FLT to HTRF and FP (results not given).
Selectivity
To investigate the selectivity of the confirmed hits from the single-concentration screening the compounds were tested in DSF against BRD4(1), BRD2(1), and BRD9. BRD2 belongs to the same family as BRD4, the BET family, whereas BRD9 belongs to the type IV bromodomains. From the total 83 actives in dose–response in one or more of the fluorescence assays, 80 were available for testing in DSF. Of those 80 tested compounds, 58 were confirmed active in BRD4(1) and 28 showed target engagement of only BRD4(1) and thus were considered BRD4(1) selective. The BRD4(1) selective compounds were identified in single-concentration screening to 78% by FLT, 21% by FP, and to 36% by HTRF. The overlap of DSF actives within the BET family was 19 [BRD2(1) and BRD4(1) active] compared with four between BRD4(1) and BRD9 (Fig. 4).
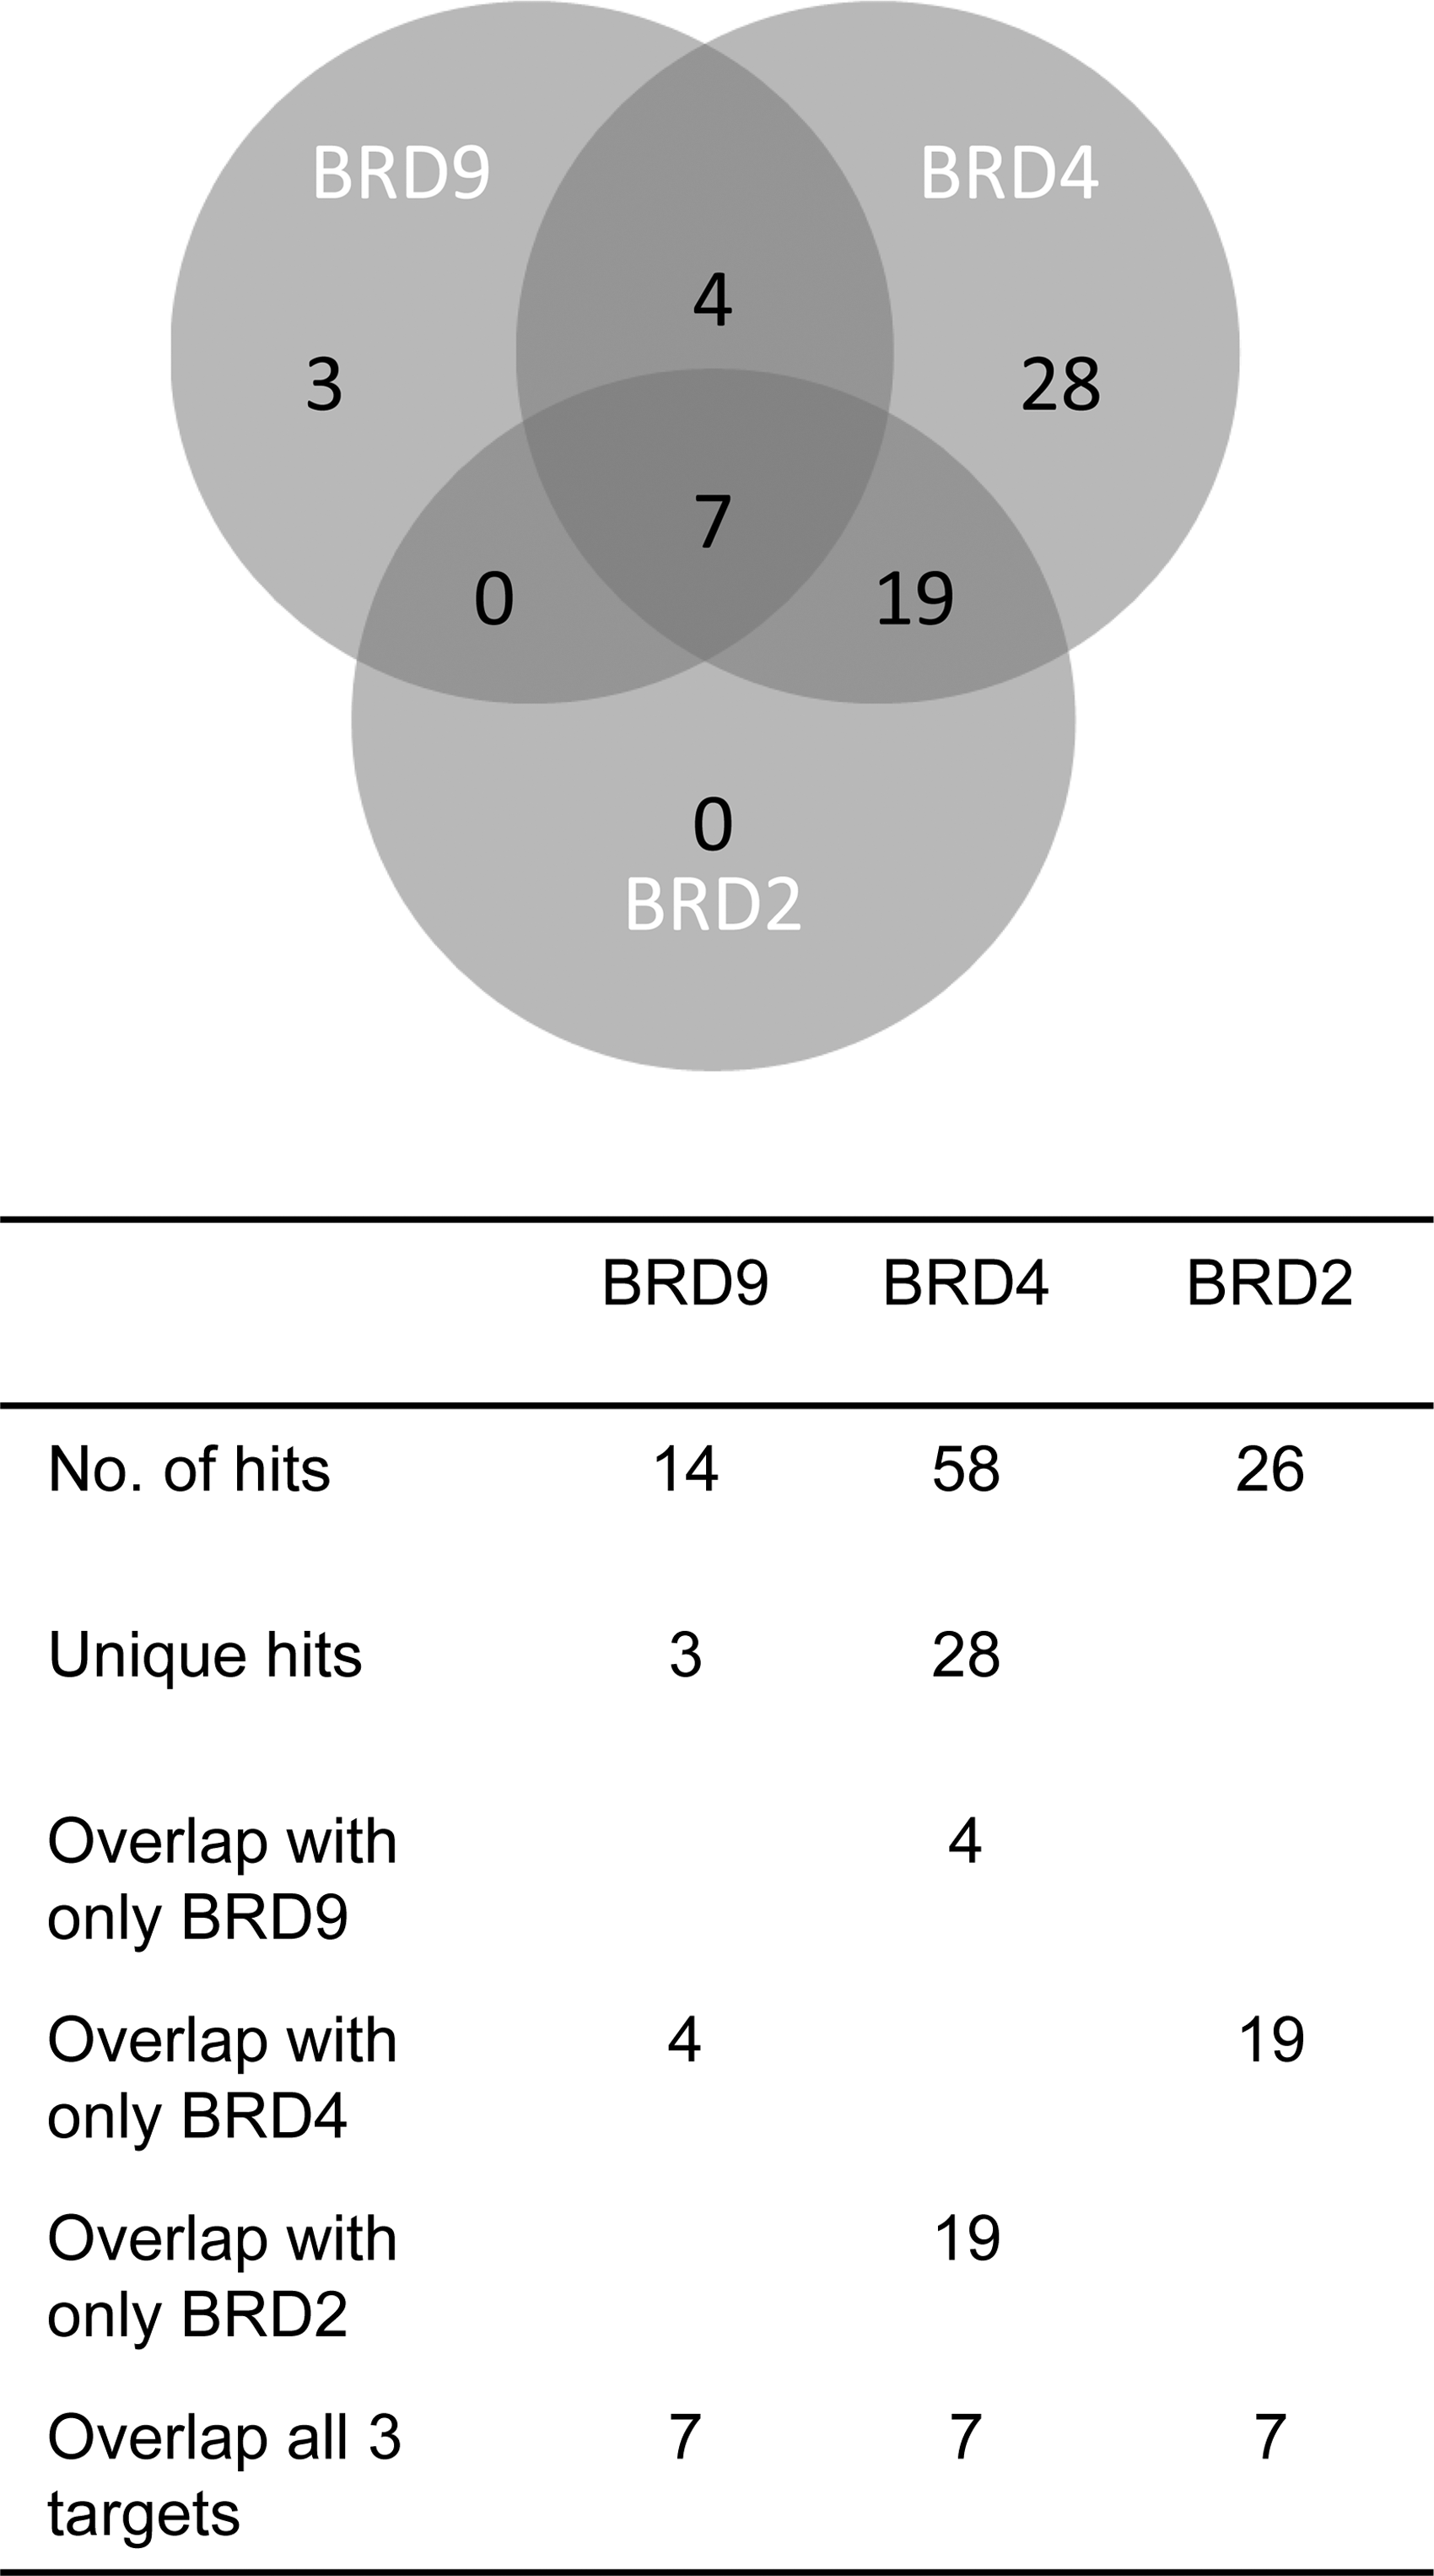
Selectivity between bromodomain families of confirmed hits in DSF. DSF, differential scanning fluorimetry.
Confirmation in NanoBRET
From the dose–response confirmed actives, 80 compounds were tested in NanoBRET and 19 (24%) were found active. This was as expected because there were few sub-micromolar compounds among the hits from the three technologies. Confirmation rate in NanoBRET for each technology was ∼30% and all compounds with a potency <1 μM could be confirmed in NanoBRET. For the less potent compounds in the range of 1–10 μM, 8 of 40 were confirmed in NanoBRET from FLT, 3 of 6 from FP, and 6 of 18 from HTRF (Table 4). A couple of the original false negatives in each of the technologies were confirmed active in NanoBRET. Four compounds that originated from FLT, out of which two were unique FLT hits, were active in the cell assay and in DSF. The other two compounds were shared hits between FLT and FP. HTRF, with a similar number of unique hits as FLT, generated one unique hit that were active in both cell and DSF. Of the 19 actives from NanoBRET, 17 were also confirmed in BRD4(1) DSF and 4 were selective for BRD4(1) in DSF. The overlap of actives within the BET family was eight [BRD2(1) and BRD4(1) active] compared with only one between BRD4(1) and BRD9 (results not given).
Active Compounds in Dose–Response Grouped in Different IC50 Ranges
uMOI Results
The uMOI compound set generated a hit rate of 0.7% in FLT and almost 10 times higher in FP and HTRF (Table 5). Compounds containing metal ions or showing redox reactivity were two classes that stood out in FP and HTRF from this set. The hit rate in FP and HTRF for the metal class were 11% and 9%, respectively, with a 50% overlap between the assays, compared with 1% in FLT. From the redox class, there were no actives in FLT, whereas FP and HTRF showed hit rates of 10% and 14%, with the majority of compounds overlapping between the two technologies.
Results from Screening of the Undesirable Mechanisms of Inhibition Compound Set
Discussion
In this study three different fluorescence assay technologies were compared in medium throughput screening. All three assays were developed independently to reflect a real HTS situation, where conditions are optimized for the particular assay rather than standardizing between different assays. The evaluation of FLT, FP, and HTRF was carried out using a relevant in vitro screening cascade in addition to compound sets suitable for the identification of hits and interference compounds. Although the assays utilize different methods of competition binding (small molecule vs. peptide interaction), pharmacology of known BRD4 compounds produced similar results and the same potency ranking. It has been shown in earlier studies that different fluorescent readouts show a good correlation in IC50 values 19 but give rise to separate sets of false positives and false negatives. 20,21 The data presented in this study are in line with those results, with three distinct hit lists generated in single-concentration screening but with overlapping compounds showing comparable IC50 values.
Throughout this evaluation all assays generated reproducible data and the variation, both within and between runs, was very low. The quality of the FP and FLT assays exceeded our in-house criteria, whereas HTRF and NanoBRET showed smaller assay window and lower Z′-factor, but were still robust enough for compound screening. We demonstrated a good correlation between pharmacology in all assays for known reference compounds apart from the five-fold shift in potency of PFI-1 in NanoBRET. It is not unusual that a compound or class of compounds shows this drop off in potency when going from a biochemical assay to a more complex environment of a cell. Similar findings have previously been reported with PFI-1 studying inhibition of interleukin-6 production in lipopolysaccharide-stimulated peripheral blood mononuclear cell. 22
By using two different screening libraries, one that is representative of the AstraZeneca compound collection and the other representing uMOI, we could show how the assays performed in finding relevant hits in addition to discriminating true hits from artifact compounds. The 7K screen hit rate in the FP assay was considerably lower compared with FLT and HTRF and this can partly be explained by the higher affinity of the JQ1-like probe compared with the peptides used in the FLT and HTRF assays. This was compensated, to some extent, by a lower activity cutoff (20% instead of 30%) in the FP assay and resulted in 32 hits instead of 21.
In addition, there was an observed decrease in potency (IC50 values) going from FLT to HTRF and FP. All assays measure displacement but there is an increase in Kd going from JQ1 to the di- or tetra-acetylated peptides used in FLT and HTRF, which also has been shown in previous studies. 3,23 This can explain the drop in sensitivity for FP but not the decrease in potency going from FLT to HTRF. The confirmation rate in dose–response was 72% and 66%, respectively, in FP and HTRF. In our experience, this is as expected regarding the performance of an HTS assay. The remarkably high confirmation rate in FLT (100%) is very unusual and demonstrates the robustness of the assay technology previously reported. 24 A combination of the low sensitivity to compound interference and the high accuracy in generation of FLT data results in a low number of false positives.
An assay with the ability to identify broad chemical diversity in combination with a low rate of false positives and negatives is the optimal choice for an HTS campaign. The confirmation rate alone is not a good parameter of success. 25 Apart from the lower confirmation rate in FP and HTRF, there was also a high number (30%) of false negatives in these assays, that is, hits from the FLT assay later confirmed as active in FP and HTRF dose–response. This could in part be explained by the four times increase in compound concentration going from single concentration to dose–response screening; however, a handful of compounds were simply false negatives that should have been picked up by the two technologies in single-concentration screening. The false negatives are a concern because those compounds will be lost during the initial step and never have the potential of becoming a chemical starting point.
More than 70% of the overlapping hits in single-concentration screening were confirmed in the orthogonal assays NanoBRET and DSF, showing that the majority of the hits that translate to a functional response lies within the overlap of the assays. There were a low number of unique hits from FLT and HTRF in single-concentration screening later confirmed in NanoBRET, whereas none of the unique hits from FP were active in the cell-based assay.
When looking at the false negatives in the downstream assays, NanoBRET and DSF, there were four compounds that originated from FLT, of which two were unique FLT hits. This was twice or four times the number of any of the other two technologies. We recognize the very low number of compounds to base our conclusions on, but the results suggest that the FLT assay is a better option for finding hits for BRD4. False positives are another problem in screening and although they can be filtered out, the cost in time and money spent on follow-up assays should be avoided.
The high confirmation rate in FLT compared with the other two technologies suggests that FLT is less susceptible to false positives. This is supported by the results from the uMOI set, where FLT showed a considerable lower hit rate compared with both FP and HTRF. The uMOI compound set generated a hit rate of 0.7% in FLT and almost 10-fold higher in FP and HTRF. Compounds containing metal ions or showing redox reactivity were two classes that stood out in FP and HTRF. Literature show that detergents have an effect on false positives related to aggregators and not redox-cycling compounds, which can be affected by the choice of reducing agent. 26 –30 With this in mind, the differences in detergents between the assays should not have affected the number of false positives and because DTT was used in all assays, the different results of the redox reactive compounds cannot be traced back to the reducing agent.
Metal contaminants have been shown to have an effect on the target but could potentially also affect the readout system. 31 The target proteins in this study were the same apart from the FLT protein being labeled with the long lifetime fluorophore. The similarity between the proteins makes us believe that the issue with metal classes in FP and HTRF has something to do with the difference in assay technology or readout. It should also be mentioned that one advantage with FLT over other fluorescence assay technologies is the simultaneous generation of various independent readouts. The FLT of the probe is only affected by the assay-specific dynamic quenching, and is thus a more robust signal compared with other HTS technologies. 2 Two other parameters, the height of the decay curve and the total intensity (AUC) can be used to flag potential compound interference, thus helping to identify false positives.
Because of the high structural conservation of bromodomains, it is challenging to find selective inhibitors against BRD4. 32,33 BRD9 shows a structural difference with larger hydrophobic cavity compared with BRD4 that facilitates selectivity between the two different protein families. In our study, the selectivity of the confirmed hits was investigated against BRD2(1), a protein within the BET family, in addition to BRD9, a type IV family bromodomain 3 in DSF. Our data show, as expected, a bigger overlap between the two BET proteins compared with BRD9. The three assays generated different number of BRD4(1) selective compounds with the highest number originating from FLT single-concentration screening, with twice or more compared with FP and HTRF. We recognize that the selectivity results from DSF needs to be confirmed in SPR, but the results still give an indication of the probability of finding selective compounds from the results of the 7K screening in the three different assays.
All assay technologies have their limitations that need to be considered when setting up an assay for compound screening. FP and FLT assay development is straightforward, but the labeling can sometimes be challenging and hard to predict regarding, for example, linker length and position. In HTRF the distance between the antibodies is key for a good signal and there is a risk for steric hindrance. 34 In an ideal world at least two assays with different readout technologies should be developed and evaluated before running an HTS, but with regard to the time and cost, this might not be possible for the majority of the HTS campaigns.
In conclusion, all three technologies identified compounds later confirmed in orthogonal assays with a slightly higher confirmation rate for FLT. Our findings indicate that FLT is less prone to pick up false positives. This was seen both in the dose–response confirmation of the 7K and the screen of the uMOI compound set. False negatives are more of a concern in HTS than false positives and the results from this study show that some compounds were missed in FP and HTRF in single-concentration screening, which suggests FLT as a better assay option in this case. We recognize that this study was run on a limited compound set and to fully confirm our findings, generation of a larger data set would be required.
Footnotes
Acknowledgments
The authors thank Annika Brosig and Sarah Scholze for protein generation, AstraZeneca Compound Management for compound supply, and Paul Wan and Jianming Liu for support and advice in completing the article. The authors received no financial support for the research, authorship, and/or publication of this article.
Disclosure Statement
No competing financial interests exist.