
Abstract
Due to poor bioavailability and chemical instability, the effectiveness of curcumin is negligible in the treatment of numerous diseases. Solid lipid nanoparticles (SLNs) increase the bioavailability of lipophilic compounds and protect the drug from gastrointestinal degradation. The objective of our study is the utilization of SLNs to improve the pharmacokinetics and pharmacodynamics of curcumin in the management of diabetes mellitus. Central composite design was used to prepare curcumin-loaded SLNs (Cur-SLN). The analysis of independent variables like drug concentration, lipid concentration, and surfactant concentration was carried out using analysis of variance (ANOVA) to obtain the optimized batch (optimized Cur-SLN) having the desired values of dependent variables particle size and entrapment efficiency. In vitro release, differential scanning calorimeter (DSC), transmission electron microscopy (TEM), and Fourier Transform Infra-Red (FTIR) studies of optimized Cur-SLN were carried out and then its pharmacokinetic and pharmacodynamic studies were performed. The model was found to be significant for particle size and entrapment efficiency based on F-value and p-value. The optimized batch's predicted values were in close agreement with the actual values of particle size and entrapment efficiency. TEM results confirm mono-dispersion and spherical shape of particles in the formulation. The DSC results confirmed the changing of drug from crystalline to amorphous form. Burst release followed by the sustained release was obtained in the in vitro release studies. The pharmacokinetic study shows enhanced bioavailability of optimized Cur-SLN compared with a plain drug suspension. The optimized Cur-SLN achieved higher antidiabetic activity in streptozotocin-induced diabetes mellitus rats than the plain drug suspension. SLNs can be used as a promising technique for delivering curcumin in the management of diabetes mellitus.
Introduction
A highly hydrophobic polyphenolic compound curcumin is obtained from the turmeric plant of Curcuma species. 1 Turmeric is historically mentioned in Ayurveda as a medicine for the treatment of several diseases. It is used as a dietary spice to add color and flavor to food. The chemical name of curcumin is diferuloylmethane, and its structure contains two aryl rings with ortho methoxy group linked in beta diketone moiety. 2 It is known for centuries for its effectiveness in the treatment of cancer, 3 Alzheimer's, 4 diabetes, 5 depression, 6 brain hypoxic–ischemic damage, 7 and aging-associated diseases such as arthritis, neurodegenerative diseases, osteoporosis, and cardiovascular diseases. 8 The effectiveness of curcumin is owing to its antioxidant, anti-inflammatory, and antimicrobial properties. Type 2 diabetes mellitus is a preventable disease, and recently plant products are gaining more attention for the prevention and treatment of diabetes mellitus. Among these medical plants, curcumin affects almost all the characteristics of diabetes mellitus, such as increased blood glucose level, insulin resistance, necrosis, increasing lipid level, and β-cell dysfunctioning. 9 A clinical trial report proved that curcumin intake (475 mg) for 10 days lowers the blood glucose and lipid level in patients with type 2 diabetes mellitus. 10 But after oral administration, its therapeutic effectiveness is negligible. This may be owing to its low water solubility, low systemic availability, and chemical instability in the gastrointestinal tract. 11 Recent studies show that several nanocarriers are used to deliver curcumin, which overcomes the problems associated with curcumin and achieved the targeted delivery, higher bioavailability, low toxicity, and increased efficacy. 12 Solid lipid nanoparticles (SLNs) with numerous advantages over other nanocarriers can easily be made on a lab-scale using biodegradable lipids. The SLNs are spherical lipid nanoparticles containing solid lipid core stabilized by the surfactant, having the particle size ranges from 10 to 1,000 nm. 13 Their properties like biologically safe and storage for an extended period attract researchers for the oral, nasal, skin, and other delivery of phyto-bioactive compounds such as curcumin. 14 Different bio-distribution patterns in body organs and prolonged circulation of curcumin SLNs were observed after intravenous administration by Chirio et al. 15 SLNs increase the bioavailability of lipophilic compounds through lymphatic uptake, protect the drug by gastrointestinal degradation, and prepare without using the organic solvent. 16 These properties of SLNs overcome the drawbacks of curcumin and make them suitable for the oral delivery of curcumin. Various studies reported improved pharmacokinetics and pharmacodynamic activities of curcumin SLN in treating several diseases. 1,17 –19 A review stated that antidiabetic activities of the curcumin with another molecule like piperine are reported, but studies on pure curcumin are still lacking. 20 The objective of our study was to develop the SLNs of curcumin and check its pharmacokinetics and pharmacodynamics in diabetes mellitus. The formulations were prepared using three independent variables (concentration of drug, concentration of lipid, and surfactant concentration). Their interaction was studied to check their effect on the dependent variables (particle size and entrapment efficiency). The statistical analysis of experimental data was carried out using analysis of variance (ANOVA) to get the optimized formulation.
Materials and Methods
Chemicals
Curcumin was a kind gift from Sanat Pharmaceuticals (New Delhi). Glyceryl monostearate (GMS) and sodium lauryl sulfate were purchased from Central Drug House, (P) Ltd (New Delhi, India). Methanol AR was purchased from Qualikems Fine Chemicals (Mumbai, India). Poloxamer 407 was purchased from Anshul Life Sciences Pvt. Ltd (Mumbai, India). Tween-80 was purchased from HICON (New Delhi, India). Dialysis membrane of the molecular weight cut off: 12–14 kDa (Himedia, Mumbai, India) was used for the in vitro study. Streptozotocin (STZ) was procured from Sigma Aldrich (Germany).
Instruments
The analysis of in vitro studies was carried out using double beam UV-visible spectrophotometer (UV-1800; Shimadzu). Reverse phase-high performance liquid chromatography (RP-HPLC) instrument equipped with Photodiode Array (PDA) detector (SPD-M20A; Shimadzu, Japan), an autosampler, Phenomenex, C18 (4.6 × 250 mm i.d., 5 μm particle size), and an LC solution software were used for the analysis of in vivo studies. Differential scanning calorimeter (DSC Q20 V24.11 Build 124) was used for the thermal analysis of pure drug and prepared SLN. Particle size was determined using the zeta sizer (Malvern Zetasizer; Ver. 7.11, serial no.: MAL1085352). Transmission electron microscope (H-7500; Hitachi Ltd, Japan) was used for the morphological studies of SLNs.
Preliminary Screening
Selection of lipid
Lipid was selected based on solubility studies. The solubility of the drug in lipids was carried out to screen the components for formulation development. About 100 mg of each lipid was taken in a different culture tube, placed in a water bath shaker at 80°C, and kept shaking until they melt. An excess amount of the drug was added and was shaken for 2 h at 75°C. After standing for 1 h, the mixture was removed from the water bath and allowed to solidify. The upper layer of the lipid-containing solubilized drug was scrapped off and remelted. 21 Then 5 mL methanol was added to the samples and analyzed using UV-visible spectrophotometer at λ max 421 nm.
Selection of surfactant
Tween 80 was selected as a surfactant based on the literature review. It is reported in the literature that Hydrophilic Lipophilic Balance (HLB) value optimum combination of high and low HLB balance produced stable formulation. HLB of Tween 80 is 15, which made a stable formulation with finer particle size. 22 In a study, smaller particle size was observed with Tween 80 than tego care, and the authors correlated the results with its HLB value. 23 It was observed that Tween 80 in SLNs increases the entrapment and decreases the formulations' particle size. In a study, particle size and polydispersity index (PDI) of formulations prepared with pluronic F68 was found bigger than Tween 80, because of the higher HLB value of pluronic F68 (24) than Tween 80. 24 Even curcumin has good solubility in Tween 80. 25
Selection of stabilizer
According to a study, the combination of surfactants provides more stability to SLNs than only one surfactant. The second surfactant acts as a stabilizer by reducing the surface and interfacial tension, decreasing the particle size and PDI. The stabilizer along with the main surfactant increase the surface activity and cover all the drug containing lipid droplets, thus helps to increase the entrapment efficiency of SLNs. 26 Our study used poloxamer 407 as a stabilizer. It helps the lipid to form an intact and rigid layer structure to increase the entrapment efficiency, decrease the particle size, and prolong drug release. 27 To determine the stabilizer's effect on formulations, we prepared two formulations, one with the stabilizer and other without a stabilizer, and their particle size and entrapment efficiency were determined. SLNs were prepared using 5% of lipid, 0.5% drug, 1% surfactant, and 1% stabilizer.
Selection of sonication time and amplitude
The probe sonication was preferred owing to its higher repeatability ratio and localized intensity. The particle size decreases by increasing the ultrasonic power and time for sonication. 28 But on increasing the amplitude and time beyond a limit, particle size increases owing to particle aggregation. 29 Experiments were conducted to get the optimized amplitude and time for the sonication process. SLNs were prepared using 5% of lipid, 0.5% drug, 1% surfactant, and stabilizer. Formulations were subjected to sonicate at 20, 40, and 50% amplitude for 5 and 8 min and tested for entrapment efficiency and particle size.
Selection of drug, lipid, and surfactant concentration
The maximum amount of lipid, surfactant, and drug used for the trial batches was 10%, 3%, and 2%, respectively. SLNs were prepared using 8% and 10% of lipid with the maximum surfactant amount, that is, 3% to select the maximum lipid concentration. After selection of maximum lipid and surfactant concentration, drug-loaded SLNs were prepared using 8% lipid and 2.5% surfactant with 1% and 2% of the drug to select the maximum level of drug. The concentration of cosurfactant was kept same (1%) in all the formulations.
Preparation of Curcumin-Loaded SLNs
Various techniques like high shear homogenization, ultrasonication, microemulsion, emulsification followed by sonication, and solvent evaporation were tried to prepare SLNs. The SLN was prepared by slightly modifying the emulsification, followed by the sonication method. 30 The technique was selected based on finer size, good PDI, and higher entrapment efficiency obtained. In this technique, the lipid phase consisted of GMS and curcumin, whereas the aqueous phase consisting of nonionic surfactant Tween 80 was heated separately at 70°C. The aqueous phase was poured slowly in the lipid phase using a high-speed mechanical stirrer while maintaining the temperature of 75°C. The stirring was continued for 30 min at 75°C. The droplet size of the formed emulsion was reduced by sonication using probe sonicator at 40% amplitude for 8 min (75°C). The time modification was performed because maximum energy was utilized to breakdown the globules at high temperatures for a longer time. The formed SLNs were stored at 4°C immediately after sonication.
Optimization of Formulation Variables
The central composite design (CCD) was selected for the optimization of formulation variables. Based on experiments conducted and review of literature, the concentration of the drug, lipid, and surfactant were selected as formulation independent variable at three levels (+1, 0, and −1) as given in Table 1, and experiments were conducted to obtain the finer particle size and maximum entrapment efficiency. The sonication frequency and stabilizer concentration (1%) were kept fixed. The trial version of design Expert 12 software was used for statistical analysis by ANOVA.
Factors Used in Experimental Design
Design of experiment
All the experiments were conducted using a CCD for the optimization of curcumin SLN. Uncontrolled variables were minimized by performing the 18 experimental runs, including four center points (Table 2).
Various Experimental Runs Conducted Using Central Composite Design and Values Obtained for Characterization Parameters
PDI, polydispersity index.
Statistical analysis
ANOVA was used to analyze the effect of formulation variables and their interaction on the responses. The best-fit model was provided by the Design of experiment software based on sequential p-value, lack of fit p-value, adjusted R 2, and predicted R 2. A value of p < 0.05 and F-value >0.05 shows the significant contribution of each factor. 29 3D surface plots and constructing counterplots obtained using design expert software indicate the relationship among the independent variables and responses. 31 The positive sign of the coefficient's magnitude in the polynomial equation indicates synergism, whereas the negative sign indicates antagonism effect on responses.
Selection of optimized formulation
The criterion to select the optimized formulation (optimized curcumin-loaded SLN [Cur-SLN]) was the high entrapment efficiency and small particle size. The optimization was performed using a numerical technique based on the desirability function ranges from 0 to 1, and the overlay plot was obtained using the graphical method. The predicted values having the highest desirability function were used to prepare SLNs to get the actual values. Responses obtained by conducting experiments were compared with responses of predicted values. 32
Characterization of Prepared SLNs
Particle size, PDI, and zeta potential
Particle size, polydispersity index, and zeta potential of all the formulations were determined using the Malvern zeta sizer (Malvern, United Kingdom) after diluting the samples with distilled water.
Drug content
Drug content was determined by diluting 0.1 mL of SLN with 10 mL of methanol. The mixture was sonicated for 2 min and filtered using a syringe filter (0.45 μm).
33
The solution was analyzed spectrophotometrically at 421 nm. Drug content was calculated using the formula:
Entrapment efficiency and drug loading
One milliliter of prepared SLNs was taken in a centrifuge tube and centrifuged using a cooling centrifuge at 4°C for 45 min at 21773 g.
34
The supernatant was collected and analyzed using a UV-visible spectrophotometer for the measurement of the unentrapped drug. The percent entrapment efficiency was calculated using the formula:
Characterization of Optimized Formulation
In vitro release study
A UV-visible spectrophotometer method was developed for the estimation of curcumin, the solubility studies of curcumin was conducted in simulated gastric fluid pH 1.2, simulated intestinal fluid (SIF) pH 6.8, and SIF 7.4. Maximum solubility of curcumin was obtained in SIF pH 7.4 to achieve the sink condition during in vitro studies. Tween 80 in 1% concentration was used with SIF phosphate buffer 7.4 and the method was validated according to guidelines of International conference on harmonization. The in vitro drug release studies were carried out using diffusion technique through dialysis membrane. 35 Ten milligrams of the drug suspension and optimized Cur-SLN equivalent to 10 mg of the drug were filled in the dialysis membrane (molecular weight cutoff: 12–14 kDa), which was soaked before the experiment in distilled water. After filling, the dialysis membrane tube was tied from both ends. The dialysis tube was kept in a conical flask containing SIF phosphate buffer 7.4% +1% Tween 80. Samples were rotated at 100 rpm in an incubator bath shaker at 37°C ± 1°C. One milliliter of the sample was collected at a predetermined time and analyzed using UV spectrophotometer. The withdrawn volume was replaced immediately with the fresh dissolution medium to maintain the sink condition. The experiment was performed in triplicate.
Drug release kinetics
The mathematical models such as zero-order kinetics, first-order kinetics, Higuchi model, and Korsmeyer–Peppas model were used to investigate drug release kinetics from SLN. The zero-order kinetics explains the drug's slow release without disaggregation of the dosage form. The data are plotted as the cumulative amount of drug released versus time. 36 First-order kinetics explains the concentration-dependent release of the drug, concentration change concerning time, and data obtained are plotted as cumulative log percentage of drug remaining versus time, which would yield a straight line. 37
The mathematical equation to express the drug release from the matrix system, including “mechanism of sustained-action medication” was explained by Higuchi. This amount of drug release is proportional to the square root of time based on the fickian diffusion. The data obtained were plotted as cumulative percentage drug release versus square root of time. 38 The Korsmeyer–Peppas model explains both fickian and non-fickian diffusion behavior; the coefficient's value is applied for the first 60% cumulative drug release. 39 To study the release kinetics, data obtained from in vitro drug release studies were plotted as log cumulative percentage drug release versus log time. 37
Morphological study
The morphology of SLNs was examined using transmission electron microscopy (TEM). After appropriate dilution with the original dispersion medium of the preparation, the samples were stained by a negative stain (1% w/v phosphotungstic acid) for observation.
DSC study
DSC thermogram of the drug, lipid, and optimized SLN were obtained using DSC Q20 V24.11 Build 124, differential scanning calorimeter. The optimized SLNs were freeze-dried to remove the water content. Five to ten milligrams of the dried samples was placed in an aluminum pan and scanned in the temperature range of 50°C–300°C with a heating rate of 10°C/min under nitrogen atmosphere against the reference standard, indium.
In Vivo Studies
Pharmacokinetic study
Albino Wistar rats weighing 175 ± 25 g were collected at random from the Animal House of PBRI (Bhopal, India), and acclimatized before the experiment for 7 days in standard in-house conditions. All animal experiments were approved by the Institutional Animal Ethics Committee (IAEC) of PBRI (Bhopal) (reference no. PBRI/IAEC/08-22/027). Pharmacokinetic profile of drug and formulation was investigated on the 18 overnight-fasted (14–16 h; free access to water) rats, which were kept on open access to water before 14–16 h of the experiment. Rats were divided into two groups (each n = 3) namely, curcumin only (suspension of curcumin in Tween 80 [group I], optimized Cur-SLN [group II]). The suspension formulation of curcumin was prepared by triturating the weighed quantity of curcumin in a dry mortar with tween 80; the required amount of water was added slowly during the preparation of the suspension. The suspension was administered orally by gavage to the group I rats at a single dose of 100 mg/kg and Cur-SLN to group II rats at a single amount equivalent to 100 mg/kg. Each rat's tail was nicked with a scalpel, and serial sampling was performed in which blood was collected from the caudal vein at 0.5, 1, 3, 6, 12, and 24 h postdose and kept in heparinized microcentrifuge tubes. About 0.3 mL of normal saline was administered after every blood sample to compensate for the blood loss. The plasma was obtained by centrifuging the heparinized blood at 6720 g for 10 min and stored at −80°C before analysis. 40,41 Various pharmacokinetic parameters were calculated after HPLC analysis.
HPLC analysis of the pharmacokinetic study
Apparatus
HPLC analysis was conducted using the already developed method by Li et al., with slight modifications. 42 RP-HPLC instrument equipped with PDA detector (SPD-M20A; Shimadzu, Japan), an autosampler, Phenomenex, C18 (4.6 × 250 mm i.d., 5 μm particle size), and an LC solution software was used for the HPLC analysis.
Chromatographic conditions
The mixture of acetonitrile and 5% (v/v) acetic acid (75:25 v/v) was used as the mobile phase at a flow rate of 1.0 mL/min. The column temperature was kept at 25°C, and the injection volume 50 μL was used with pressure gradient elution mode. Detection was carried out at 420 nm using a UV detector. 42
Standard stock solution preparation
For chromatogram of blank, plasma was precipitated by acetonitrile filtered through 0.22 μm Millipore membrane filters and injected in HPLC system. Stock solutions (1 mg/mL) of curcumin RS were prepared in acetonitrile, and the stock solution dilutions were made with acetonitrile to obtain the working solutions. Calibration sample solutions of curcumin in rat plasma were prepared by spiking 10 μL of each working solution in 90 μL of plasma separately. After that, the prepared solution was subjected to ultracentrifugation at 15120 g, 4°C for 15 min to get the clear supernatant solution and filtered through 0.22 μm Millipore membrane filters, and 50 μL of the sample was injected in HPLC system.
Sample preparation
To stored plasma samples of the pharmacokinetic study, a volume of 500 μL of acetonitrile was added and vortexed for 1 min. The mixture was then centrifuged at 15120 g for 15 min at 4°C to get a clear supernatant solution and filtered through 0.22 μm Millipore membrane filters, and 50 μL of the sample was injected in HPLC system.
Pharmacodynamic study
Animals
Albino Wistar rats weighing 175 ± 25 g were procured from the Animal House of PBRI (Bhopal, India). All animal experiments were approved by the IAEC of PBRI (Bhopal, Indi) (reference no. PBRI/IAEC/08-22/027). Animals were housed in a group of four in separate cages under controlled conditions of temperature (22°C ± 2°C). All animals were given a standard diet (Golden Feeds, New Delhi) and water ad libitum. Animals were kept at 12:12, light:dark cycle. 43
Induction of diabetes
Diabetes was induced in rats by intraperitoneal injection of STZ at a dose of 60 mg/kg body weight. STZ was dissolved in ice-cold 0.1 M citrate buffer. The animals were allowed to drink 5% glucose solution overnight to overcome STZ-induced hypoglycemia. The animals were considered diabetic if their blood glucose value was >200 mg/dL on the third day of STZ injection. 5 The treatment was started on the fourth day after the STZ injection, considering it as the first day of treatment, the treatment was continuing till 28 days. Blood glucose level and body weight were observed on 0, 7, 14, 21, and 28 days of post-treatment. 44
Experimentation
All animals were divided randomly with six animals in each group. Group I was kept nondiabetic and groups II, III, IV were made diabetic with STZ. On the fourth day after the STZ injection, group I received blank SLN (5 mL/kg), group II received the blank SLN (5 mL/kg) and served as diabetic control, group III received the pure drug suspension, 100 mg/kg, 44 per day p.o. [per os (by oral route)], group IV received optimized Cur-SLN (100 mg/kg) per day p.o. All dosing of test samples was carried out p.o. throughout the experimentation.
Statistical analysis
All data were analyzed by one-way ANOVA followed by the Bonferroni test. A value of p < 0.05 was considered as the level of significance. All data are presented as mean ± standard deviation.
Stability Studies
The optimized formulation was stored at 25°C ± 2°C/60% ± 5% and 40°C ± 2°C/75% ± 5% temperature/relative humidity for 180 days and checked at regular intervals for particle size, PDI, and entrapment efficiency. 45
Results and Discussion
Preliminary Screening
Selection of lipid
Lipid was selected based on solubility study. As given in Figure 1, the maximum solubility of the drug was observed in the GMS. Its ability to solubilize maximum drug in the lipid fraction may be owing to the presence of mono-, di-, and triglycerides in it. 46
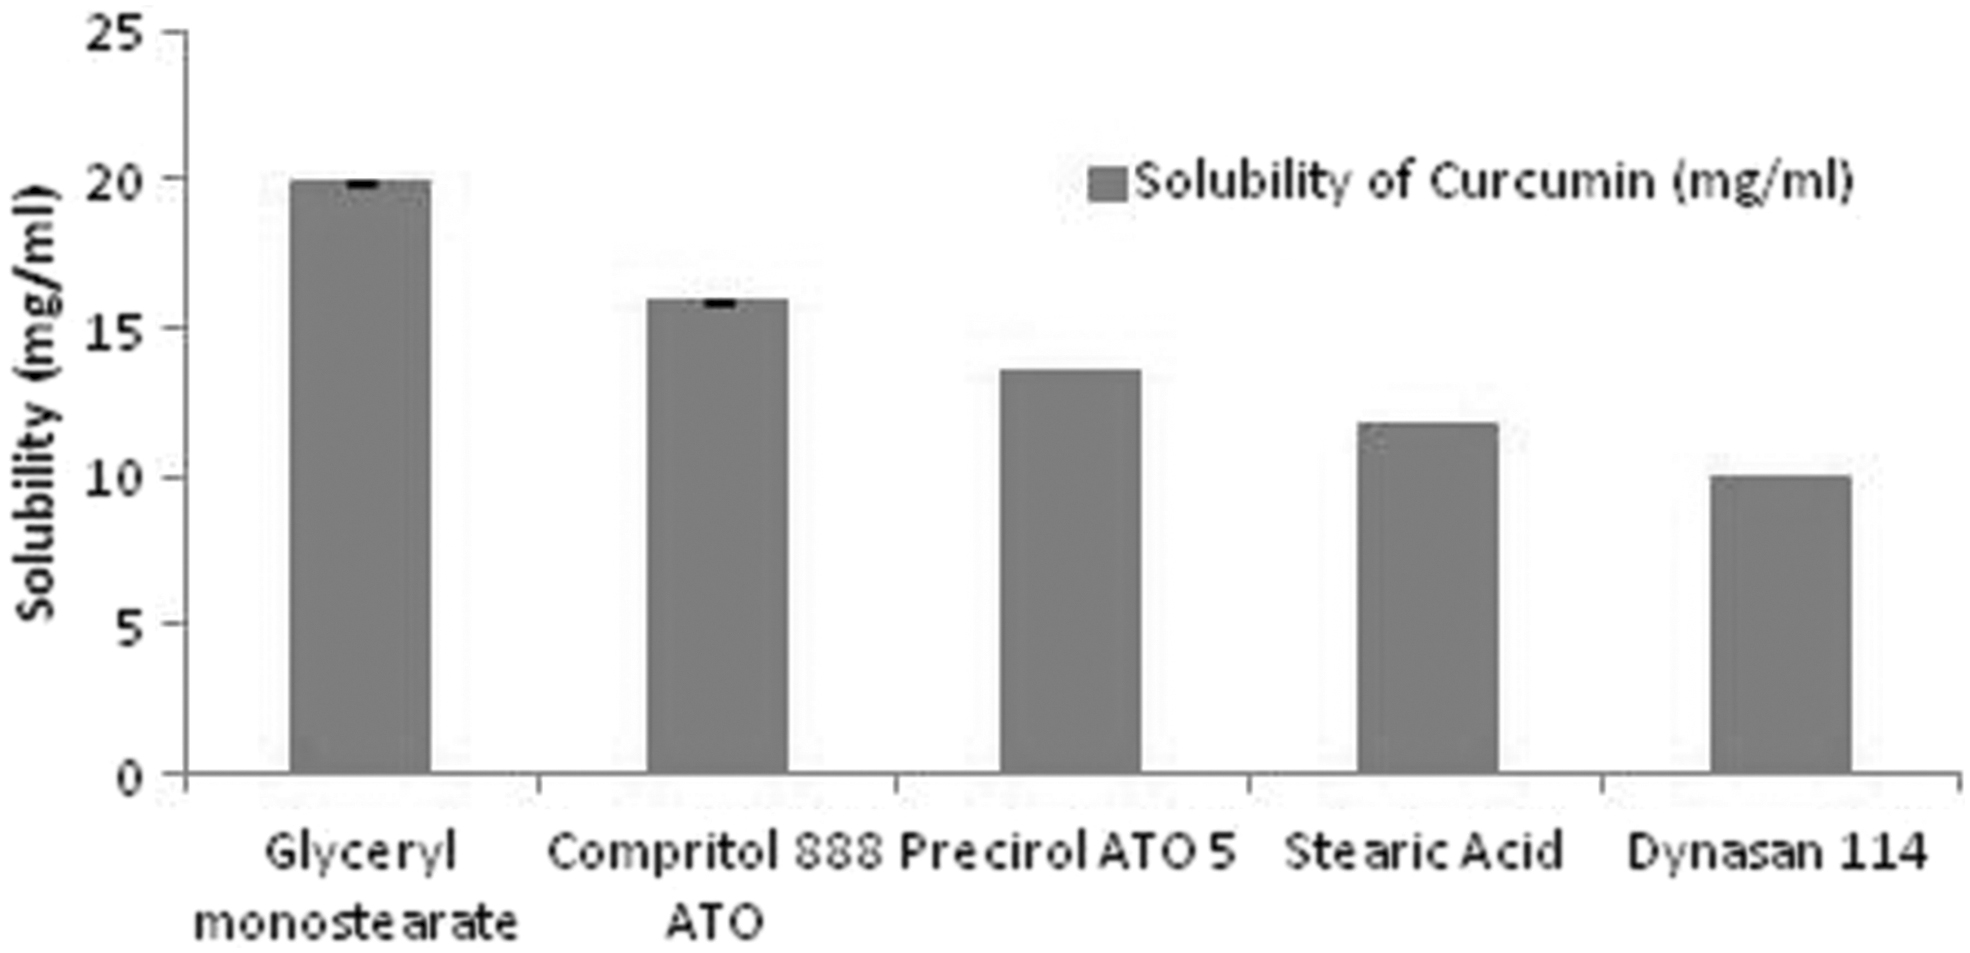
Solubility of the drug in different lipids.
Selection of stabilizer
SLNs were prepared with or without the addition of a stabilizer. Table 3 shows the effect of stabilizers on the preparation of SLN. So all the formulations were prepared by the addition of 1% stabilizer to enhance the quality.
Effect of Stabilizer on the Preparation of Solid Lipid Nanoparticles
Selection of sonication time and amplitude
When sonication was performed for 5 min, the larger particle size was observed at 20% amplitude compared with 40% and 50% amplitude. This may be owing to the insufficient time for sonication and less amplitude. When sonication was performed for 8 min, particle size obtained at 40% amplitude was <200 nm, and larger particle size was observed at 20% and 50% amplitude (Table 4). The accurate amplitude for sonication was found to be 40% when sonication was performed for 8 min, below this amplitude (at 20%) sonication remains incomplete and beyond this level (at 50%) the formulation starts to form aggregates. On the contrary, on increasing the amplitude and sonication time, entrapment efficiency was found to decrease gradually (Table 4). Hence, the suitable amplitude and sonication time for sonication was 40% and 8 min, which is selected for the preparation of SLNs.
Effect of Sonication Time and Amplitude on the Particle Size and Entrapment Efficiency
Selection of concentration
The visible particles with large particle sizes were present in the formulation containing 10% of lipid, and the formulation became thick gelled. The SLNs prepared with 8% of lipid were in acceptable form, whereas no change was observed by decreasing the surfactant concentration from 3% to 2.5%. In drug-loaded SLNs, the undissolved drug particles were settling down in the SLNs having 2% drug load, whereas no undissolved particles were observed in SLNs containing 1% drug. So 1%, 2.5%, and 8%, respectively, were selected as the maximum level drug, surfactant, and lipid concentration for the preparation of SLN.
Statistical Analysis of Experimental Data
The response surface analysis of factors and responses was depicted by constructing counterplots and 3D response surface plots (Fig. 2). Sequential model sum of squares suggested a quadratic model based on the highest-order polynomial for both the responses. The regression coefficient for the quadratic polynomial equation was calculated using experimental data. The statistical analysis of experimental data for both the responses obtained using ANOVA is given in Table 5.
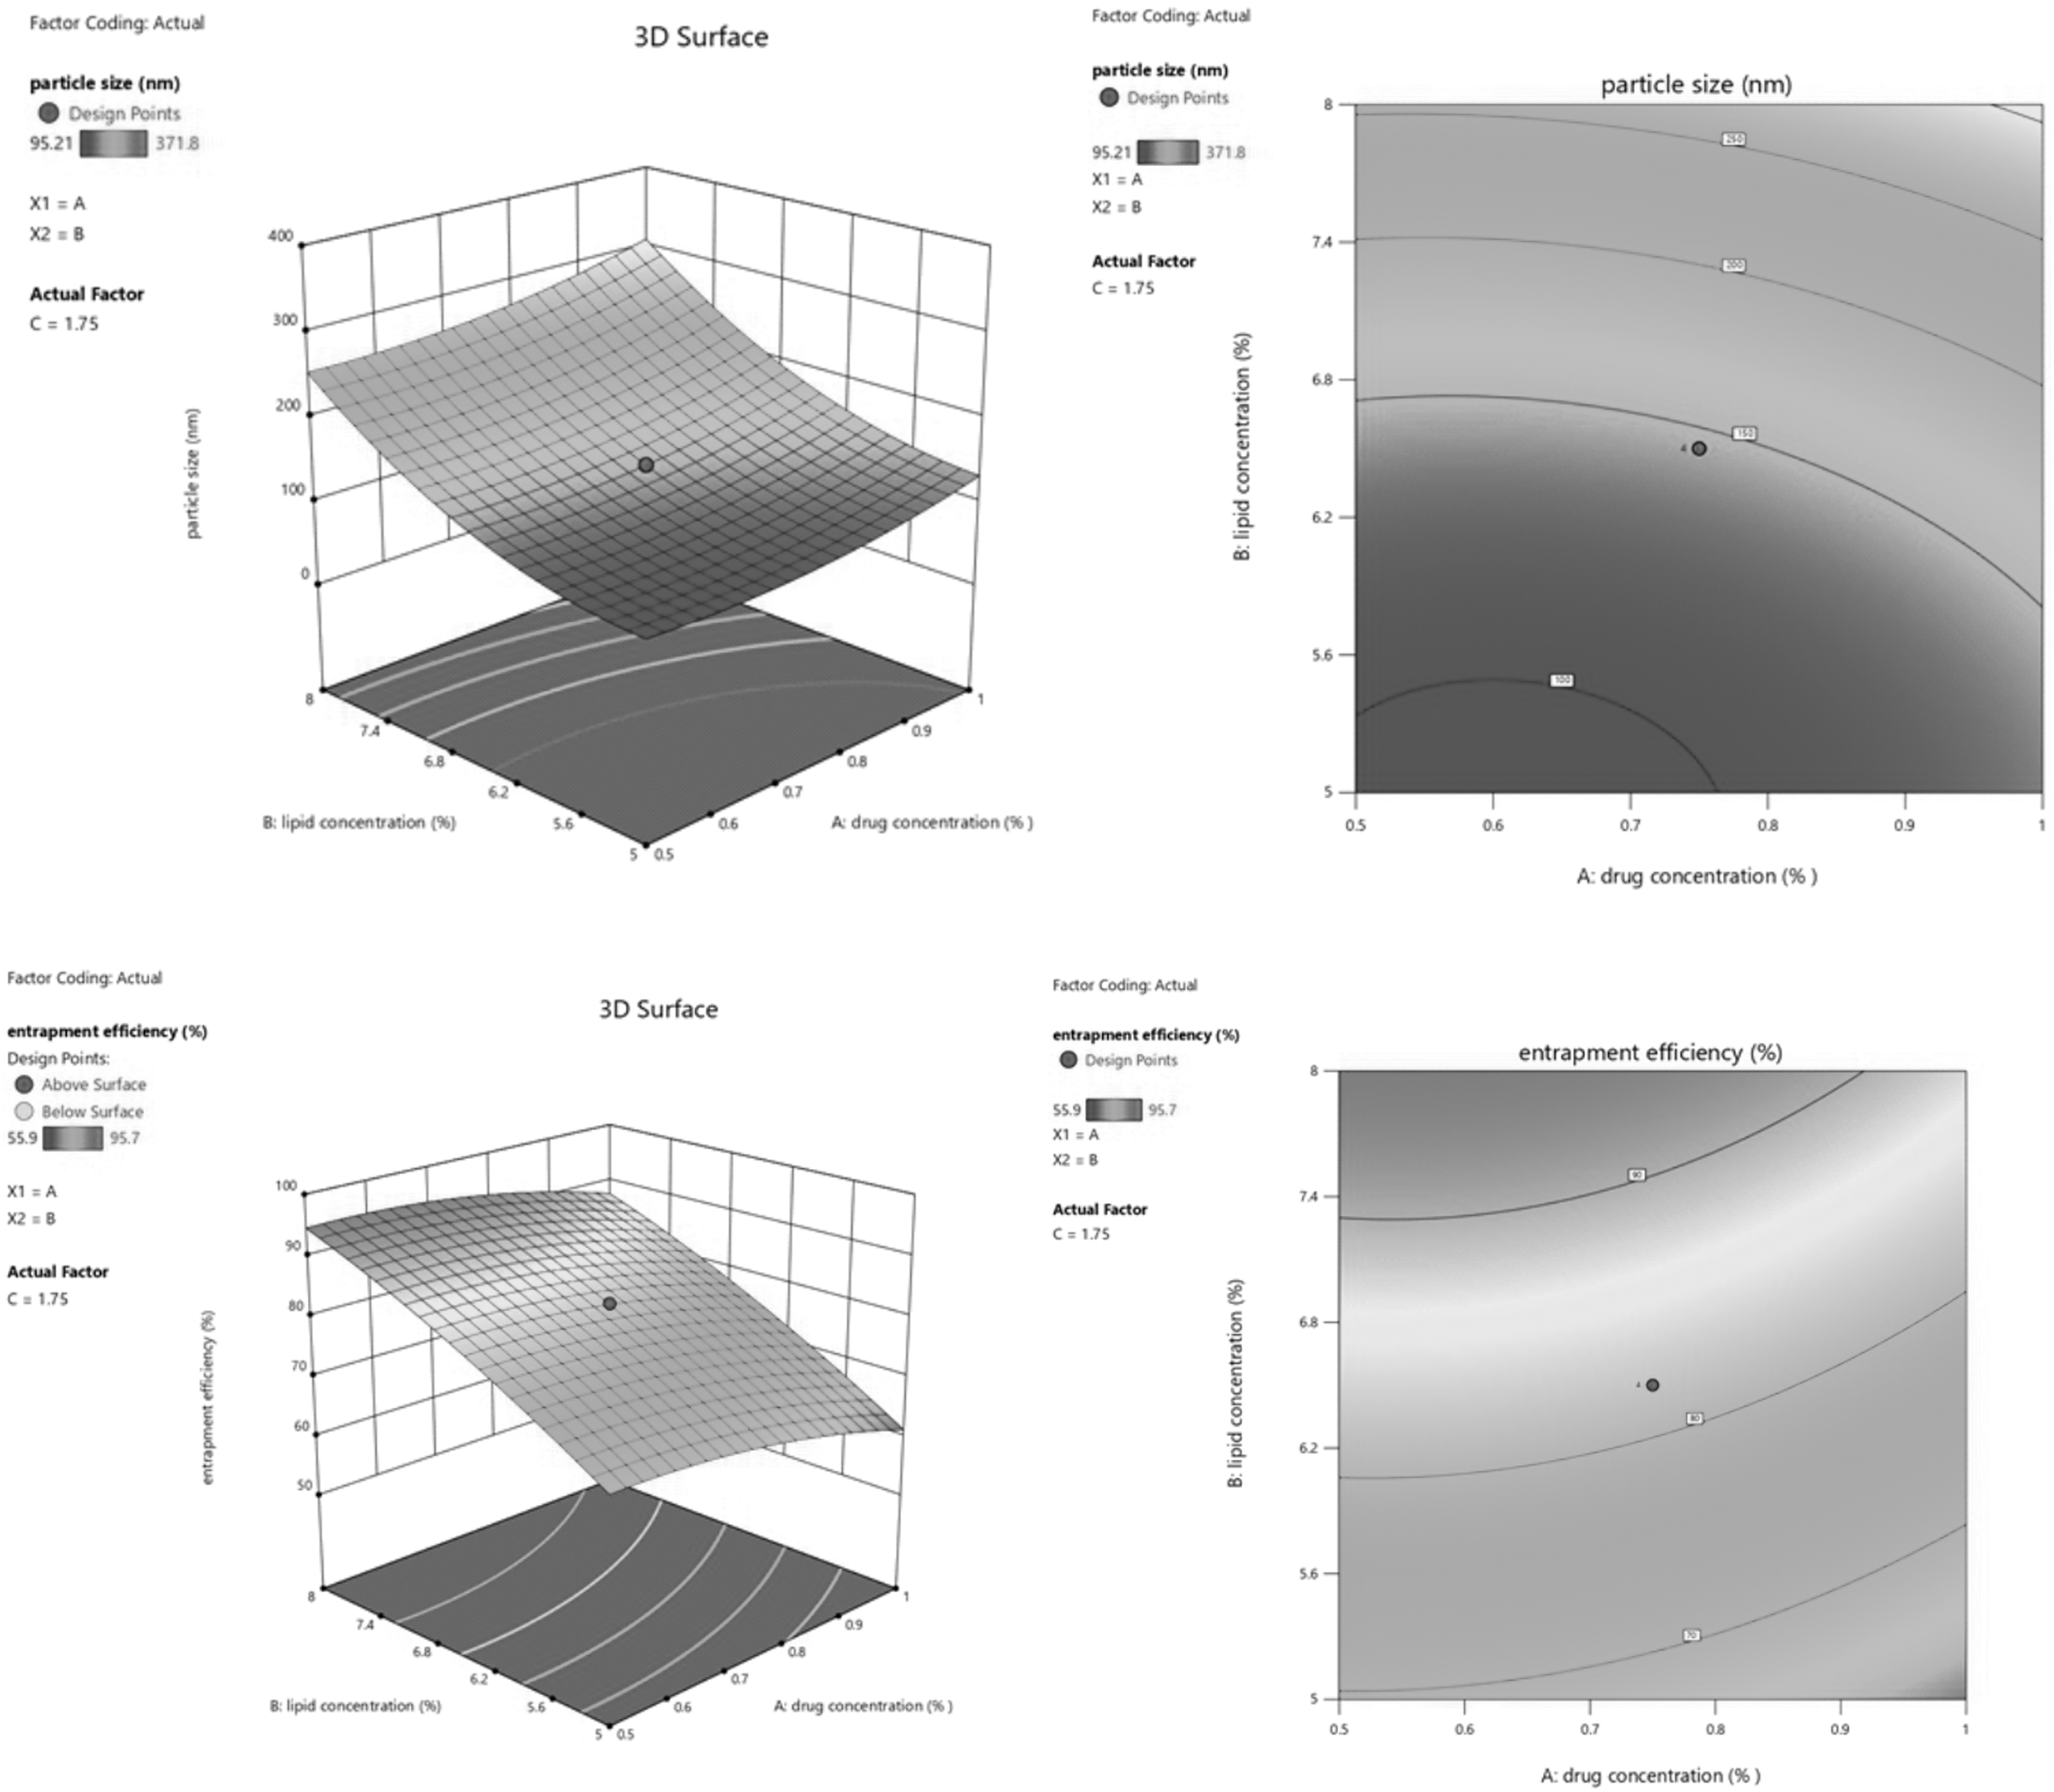
Counter plots and 3D response surface plots of particle size and entrapment efficiency, respectively.
Statistical Analysis Using Analysis of Variance
CV, coefficient of variation.
Analysis of particle size
Y1 = +144.66 + 22.19A + 83.32B − 31.94C − 13.38BC +15.80A 2 + 37.67B 2 + 11.83C 2
The positive and negative coefficient of variable in the coded equation shows the increase and decrease in the response, respectively, upon raising the variable value. 29 The model was significant with a model F-value of 58.56, p < 0.0001. In the analysis of particle size (Y1) A, B, C, BC, A2, B2, and C2 were significant model terms with p < 0.0500. The insignificant model terms were removed to improve the model. The R 2 for Y1 was 0.9850, and the predicted R 2 was in reasonable agreement with the adjusted R 2. The signal-to-noise ratio of Y1, 25.408 (<4), indicates an adeq precision. Lack of fit was marginally insignificant. The particle size was obtained in the range of 95.21–371.8 nm (Table 2). The equation shows that particle size increased with an increase in the concentration of the drug. It was observed that particle size was not found to be much affected by the drug concentration at 0.5% and 0.75% when used with 6.5% lipid. Still, after reaching the concentration of >1%, particle size dramatically increased, which may be owing to the presence of a large amount of unentrapped drug particles. The positive coefficient of factor B showed that lipid affected the particle size more. The increase in lipid concentration may produce coalesce in the SLN and increase its viscosity, contributing to an increase in particle size. In addition, the increasing concentration of lipid decreases the total surface area by providing more space for the drug entrapment results in an increase in particle size. 46 Even sonication does not work efficiently in more viscous solutions, so large particles are produced at high lipid concentration. 24 On the contrary, reduced particle size was observed upon increasing the surfactant concentration depicted by factor in the equation and response surface plot. Because it reduces the surface tension, and surface free energy prevents particles from forming aggregates by breaking down the melted lipid droplets, thus decreasing the particle size and forming a stable dispersion. 47 But the decreasing effect was observed up to a level. A positive value of C2 indicated that an increase in surfactant concentration beyond the limit could exceed the particle size by forming micelles. 48 The equation depicting that interaction of lipid and surfactant (BC) decreases the particle size. This may be owing to the surfactant that surrounds the lipid droplets and helps to decrease its size. The positive coefficient of other significant model terms (A2, B2, C2) indicates that after a level, an increase in surfactant also increases the particle size as drug and lipid concentration does.
Analysis of entrapment efficiency
Y2 = +82.19–3.81A + 12.87B + 3.29C−2.17A2–2.35C2
The entrapment efficiency was found in the range of 95.7–55.9 (Table 2). The Model F-value of 30.82 and p < 0.0500 implies that the model and model terms are significant. A, B, C, A2, and C2 were observed as significant model terms. Values >0.1000 indicate that the model terms are not significant. The model was reduced by removing insignificant model terms. The lack of fit was observed as insignificant, which proves that the model explains the variability of responses. The difference between predicted R 2 (0.7871) is <0.2 with adjusted R 2 of 0.9404, that is, they are in reasonable agreement. The ratio of 19.140 (>4) indicates an adequate signal. This model can be used to navigate the design space. The variable representing drug concentration was found to be slightly negative, which shows that on increasing the drug concentration beyond a level entrapment efficiency decreased, which may be owing to the lipid being unable to load a large amount of drug. The positive coefficient of B indicates that high entrapment efficiency results in an increasing amount of lipid. This may be owing to the additional space provided by a mixture of acylglycerols for drugs to get entrapped. 46 Although with the increase in surfactant concentration, aqueous solubility of the drug increased and entrapment efficiency decreased. But in our study, entrapment efficiency was found to be increased with an increase in surfactant concentration. As discussed earlier, the increasing effect is because of Tween 80. There could also be the effect of stabilizer to achieve higher entrapment efficiency. The maximum drug entrapment was achieved with 9.022% (Maximum α) of lipid with 1.75% of a surfactant having 0.75% of the drug.
Other Characterization Parameters
Drug content
The drug content of all the formulations was found <99%, which assures no degradation of the drug in preparation (data not shown).
Zeta potential and PDI
Zeta potential predicts the formulation's stability by indicating the electrical voltage difference in surface charged particles; its ideal range is higher than ±30 mV. 49 In our study, the zeta potential was observed between −17.3 and −25.2 (Table 2), representing the formulations' stability. The zeta potential of the optimized batch is given in Figure 3. The PDI near 0 is considered suitable for homogeneous distribution of SLNs and considered acceptable up to 0.5 for narrow size distribution. 45 In our study, PDI was found to be decreased by increasing the surfactant concentration (Table 2). The reasons may same as for particle size. The PDI was almost the same as the surfactant concentration of 1.75% and 2.5%. This means PDI decreased with increasing surfactant concentration up to a certain level; after that it may remain the same. While increasing the drug and lipid concentration, PDI was found to be improved. But reduced PDI was observed with the maximum amount of lipid containing 0.5% and 0.75% of the drug than 1% of the drug, which concluded that the presence of free drug increases the PDI.
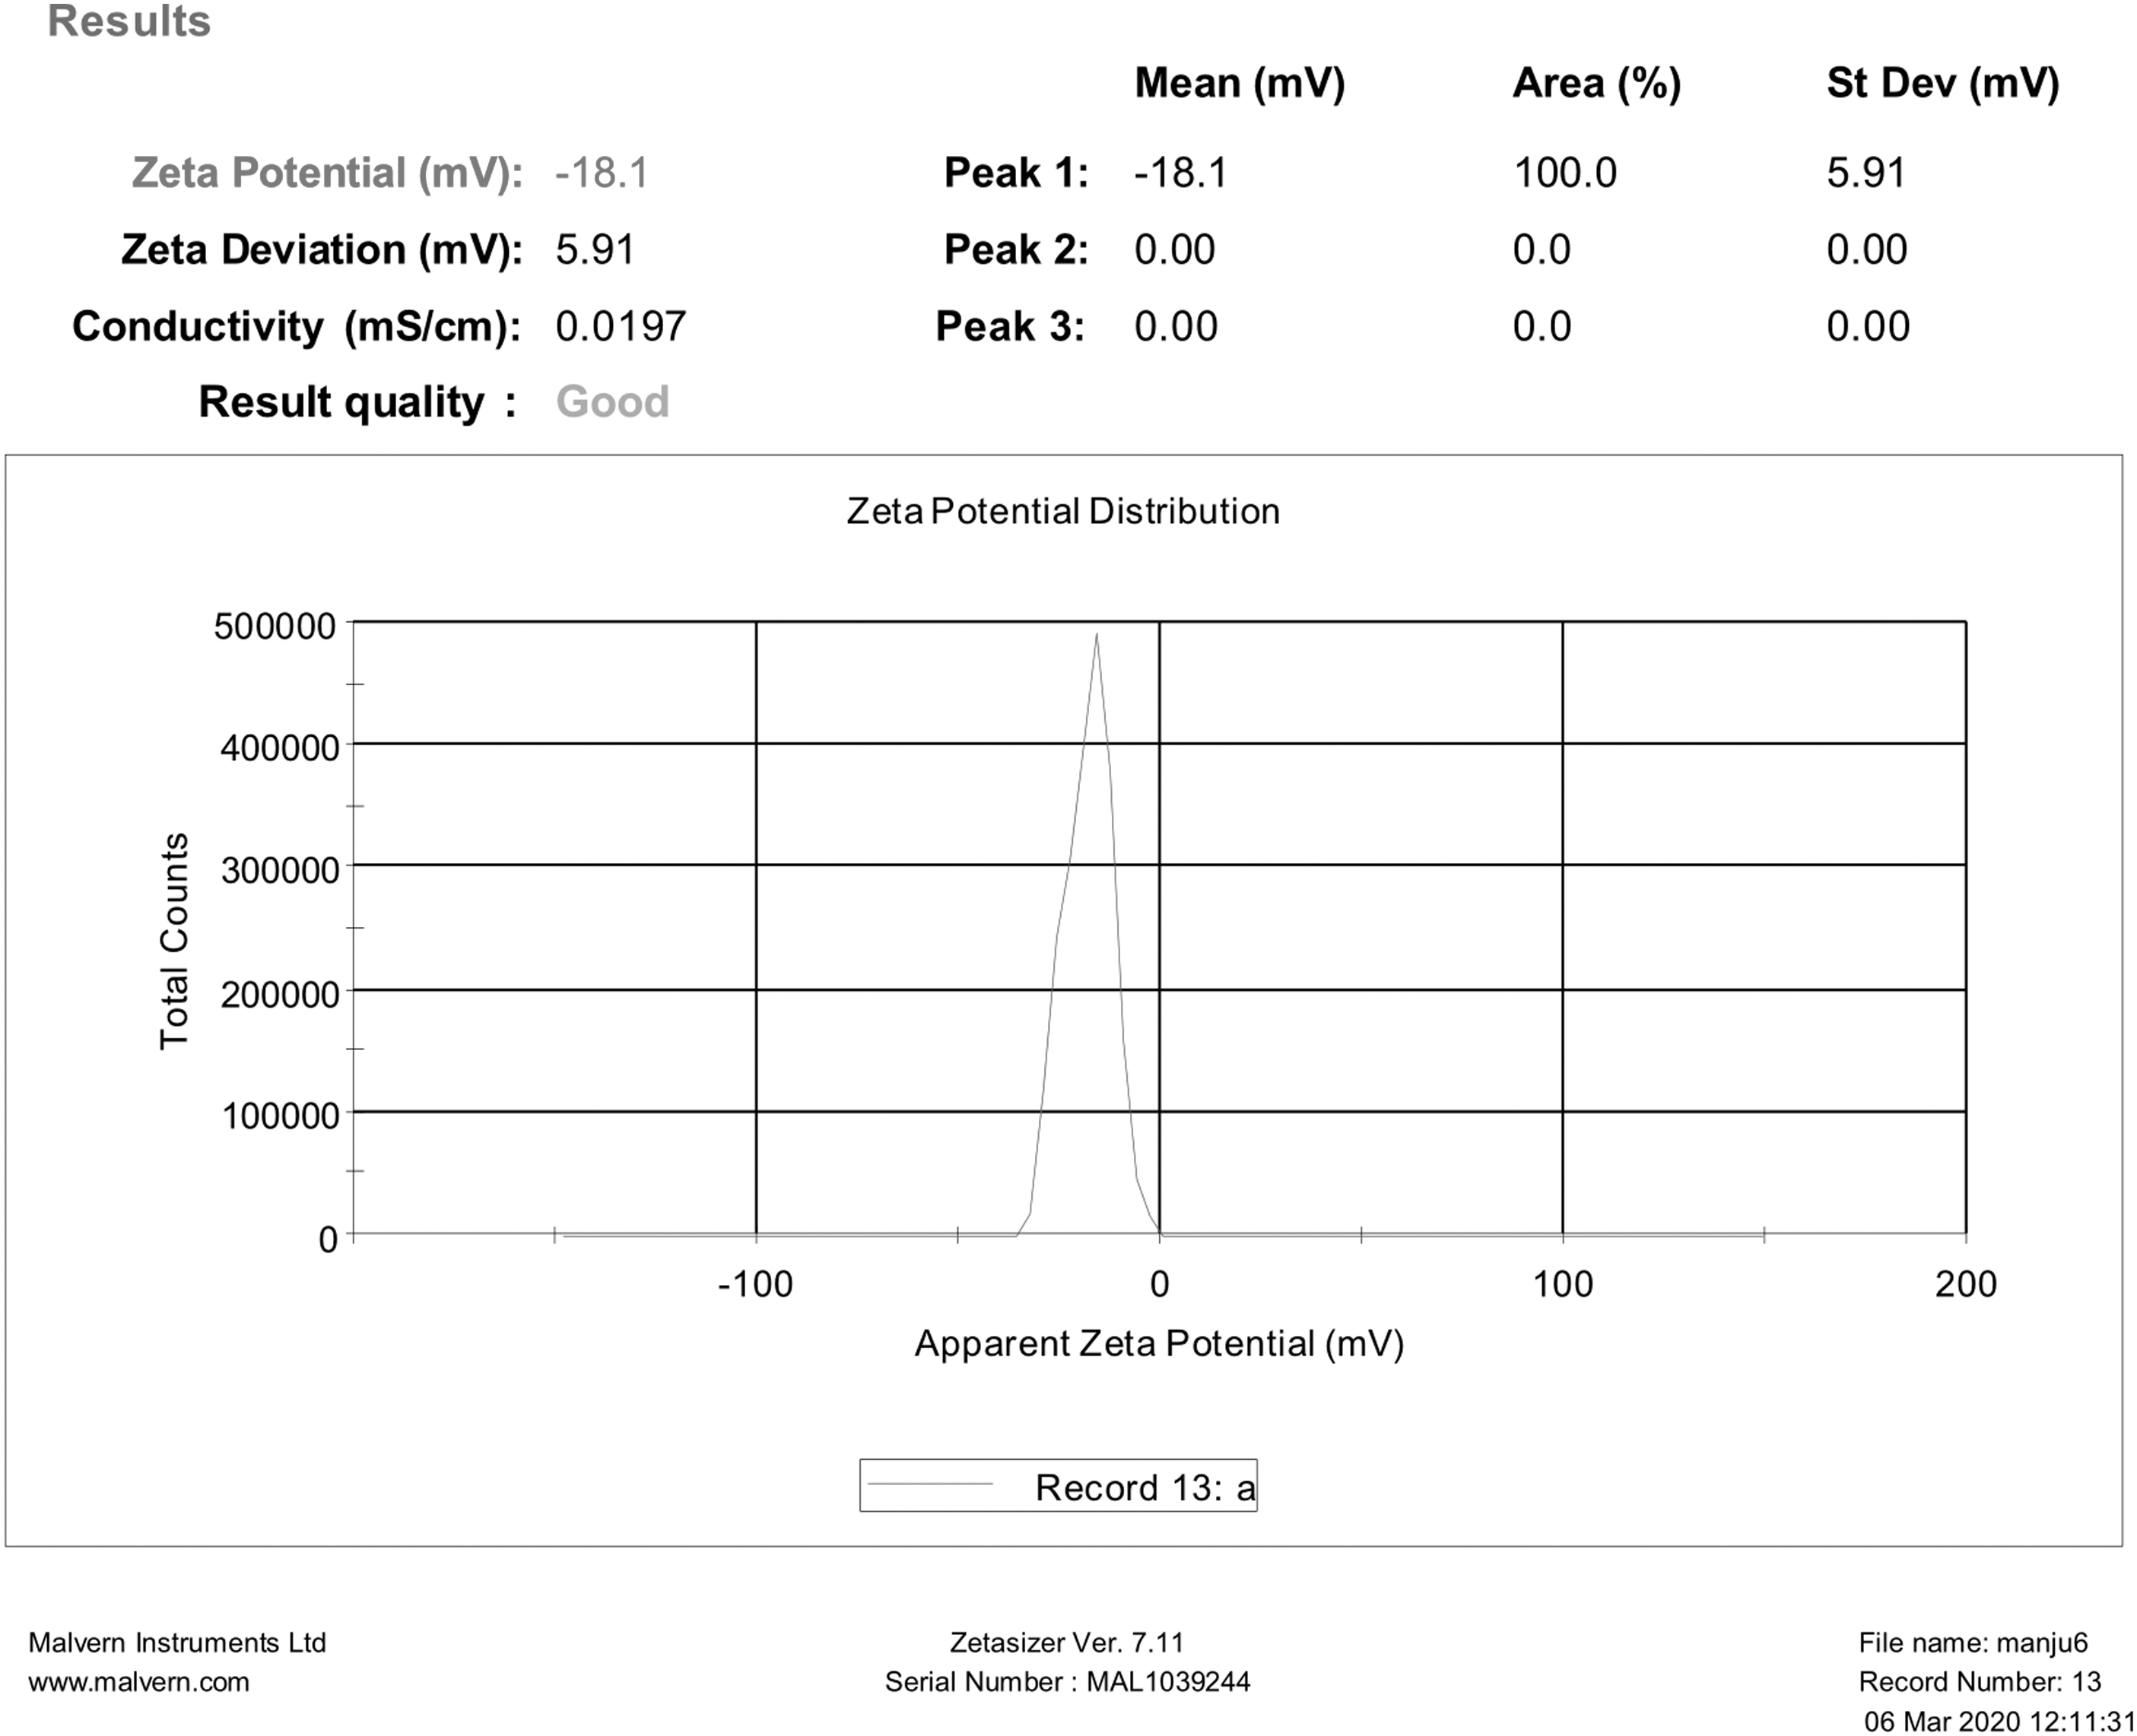
Zeta potential of optimized formulation.
Optimization of the Formulation
Optimization of the prepared formulation was carried out based on small particle size and higher entrapment efficiency. The optimized batch with optimum values obtained using a design expert was shown in the predicted overlay plot as given in Figure 4. The optimized batch was prepared using the values obtained for drug, lipid, and surfactant concentration (0.78%, 6.20%, and 2.23%, respectively) to validate the optimized procedure by achieving the predicted values of responses, that is, 119.965 nm for particle size and 80.1948 for entrapment efficiency. The optimized batch's particle size and entrapment efficiency were found to be 119.7 (Fig. 5) and 81.93 ± 0.974, respectively, which were found in reasonable agreement with the predicted values. The optimized batch was further characterized for in vitro drug release, drug release kinetics, DSC, Fourier Transform Infra-Red (FTIR), and morphological and stability studies.
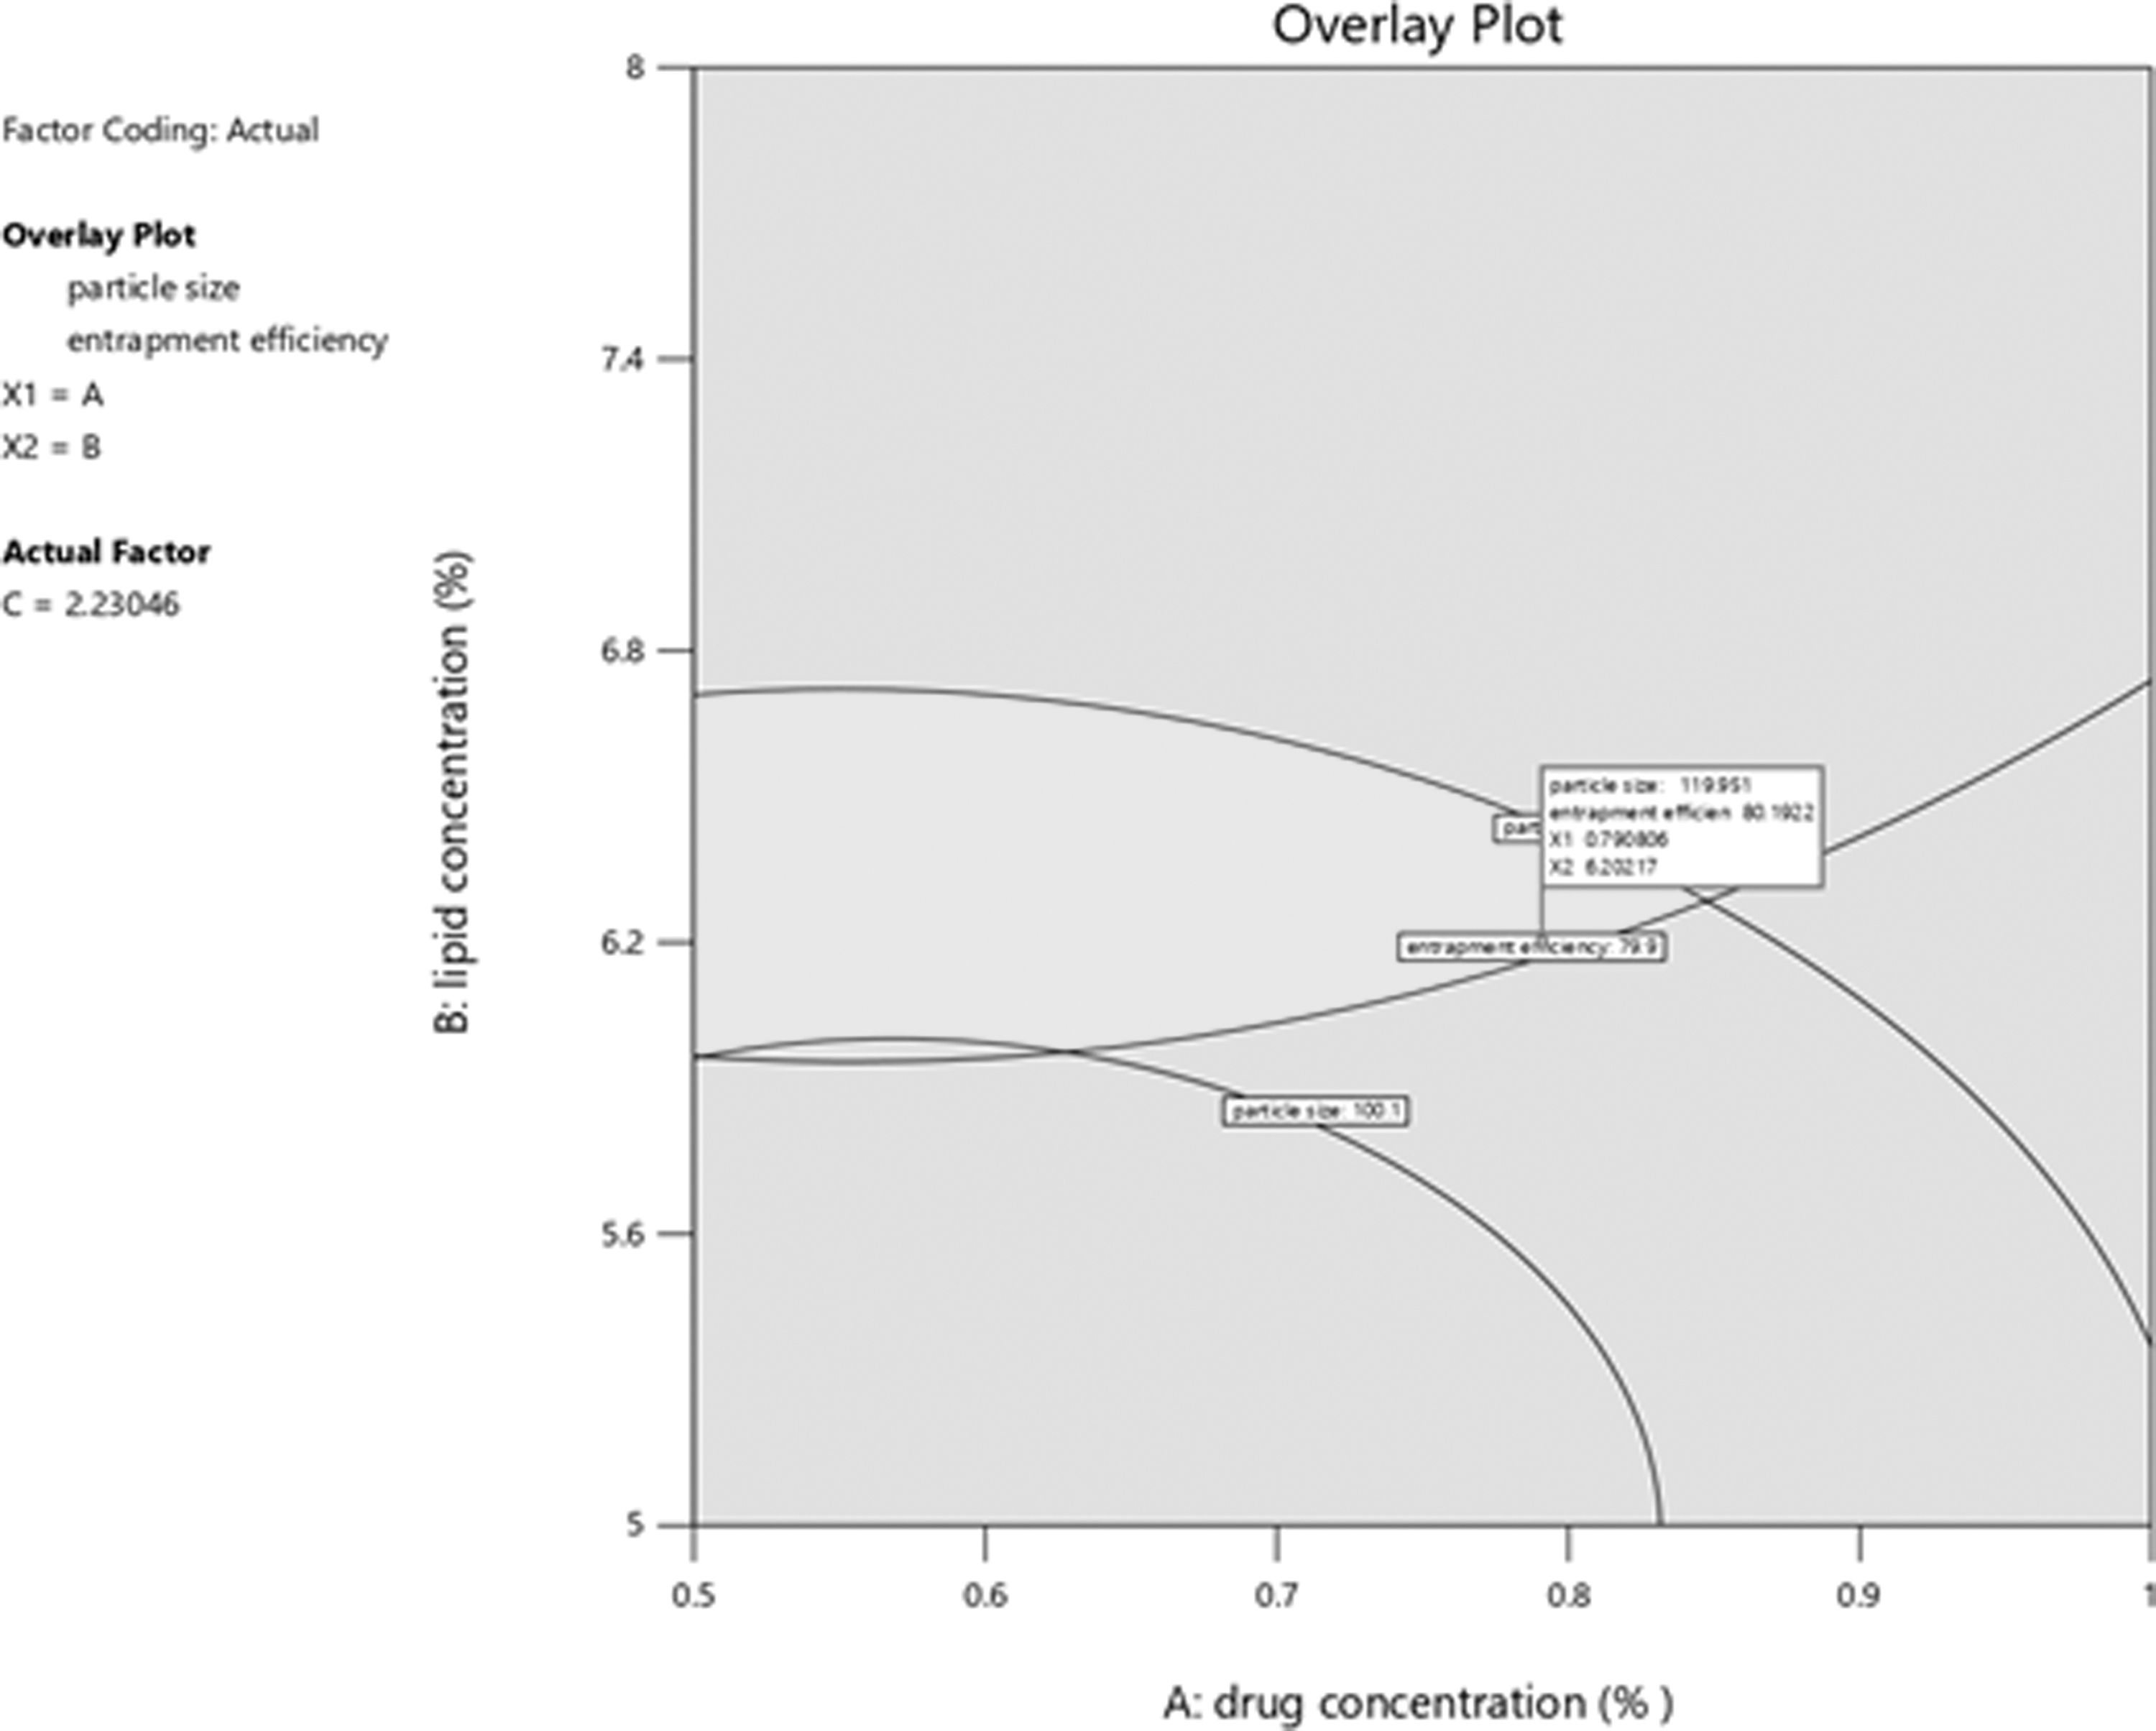
Overlay plot with optimized batch and predicted responses.
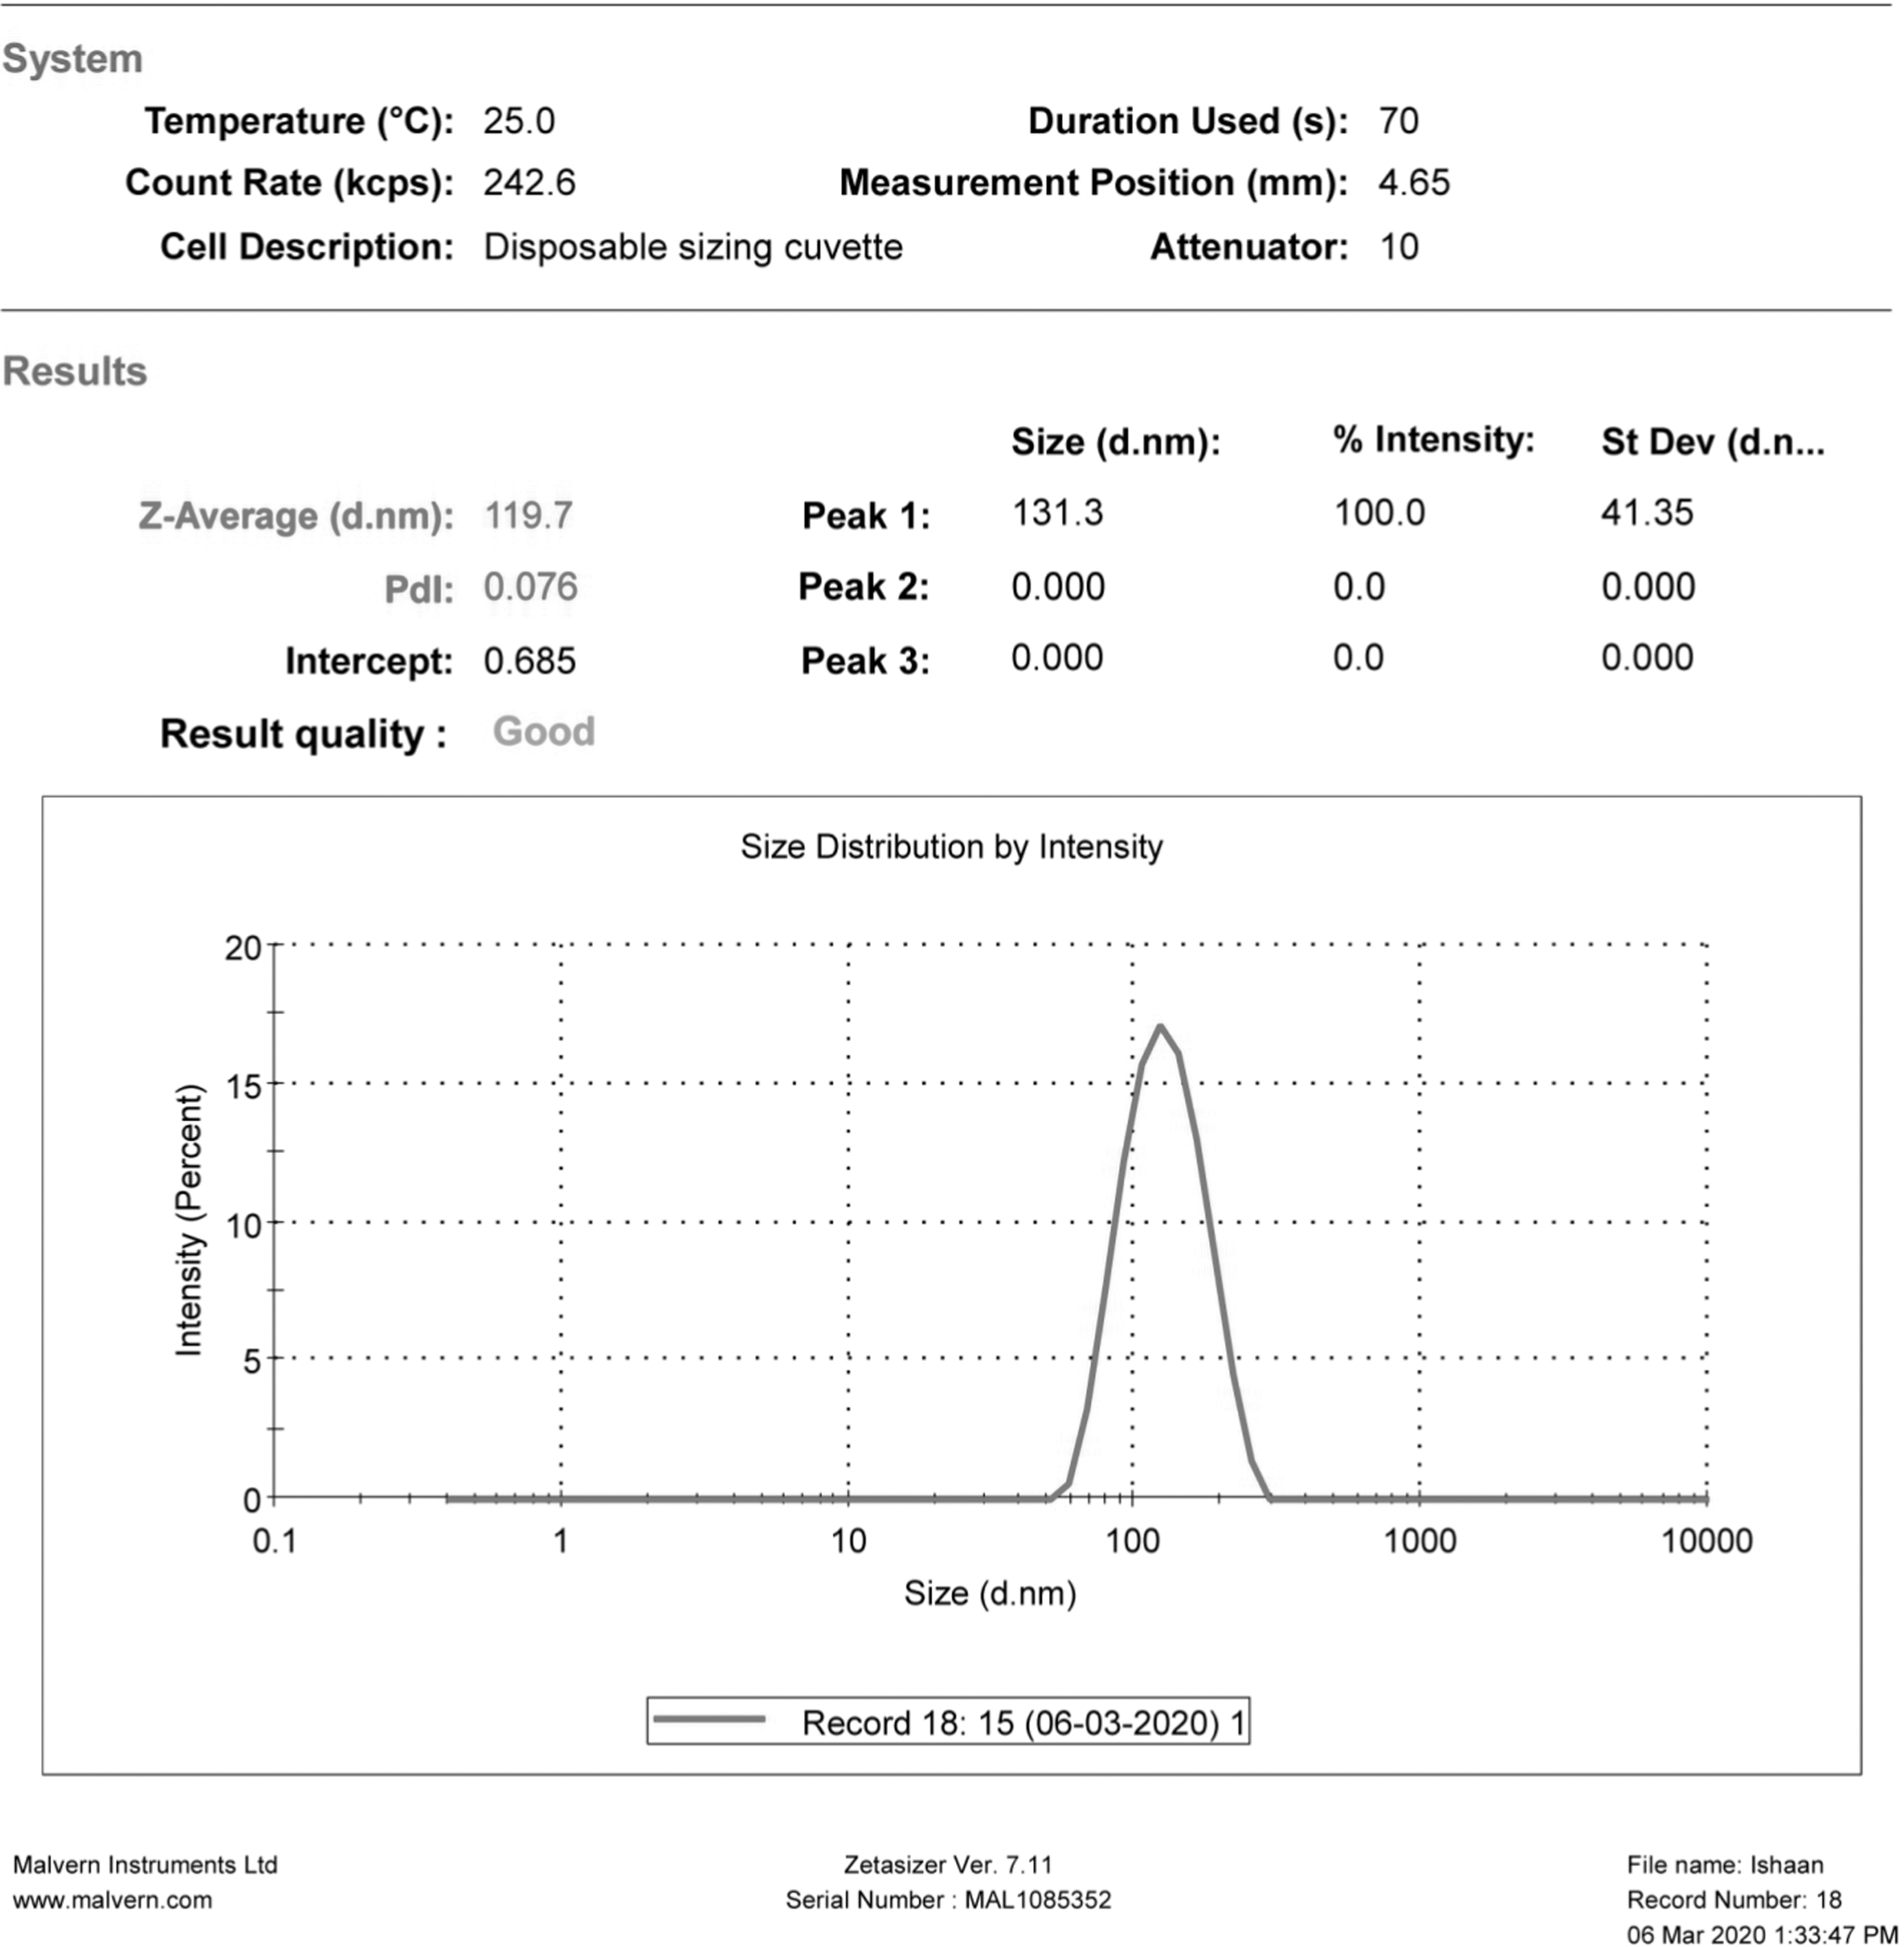
Particle size of optimized formulation.
Characterization of Optimized Formulation
In vitro release study
The drug release study was conducted over 24 h. The plain drug suspension released 79.81% of drug in 24 h, whereas burst release of 20% drug was observed in the first 2 h from the optimized formulation followed by the sustained release up to 65.78% of drug in 24 h (Fig. 6). The earlier effect is owing to the presence of the drug in the outer region and sustains effect may be the result of the slow release of drug from the inner core of SLN. 50
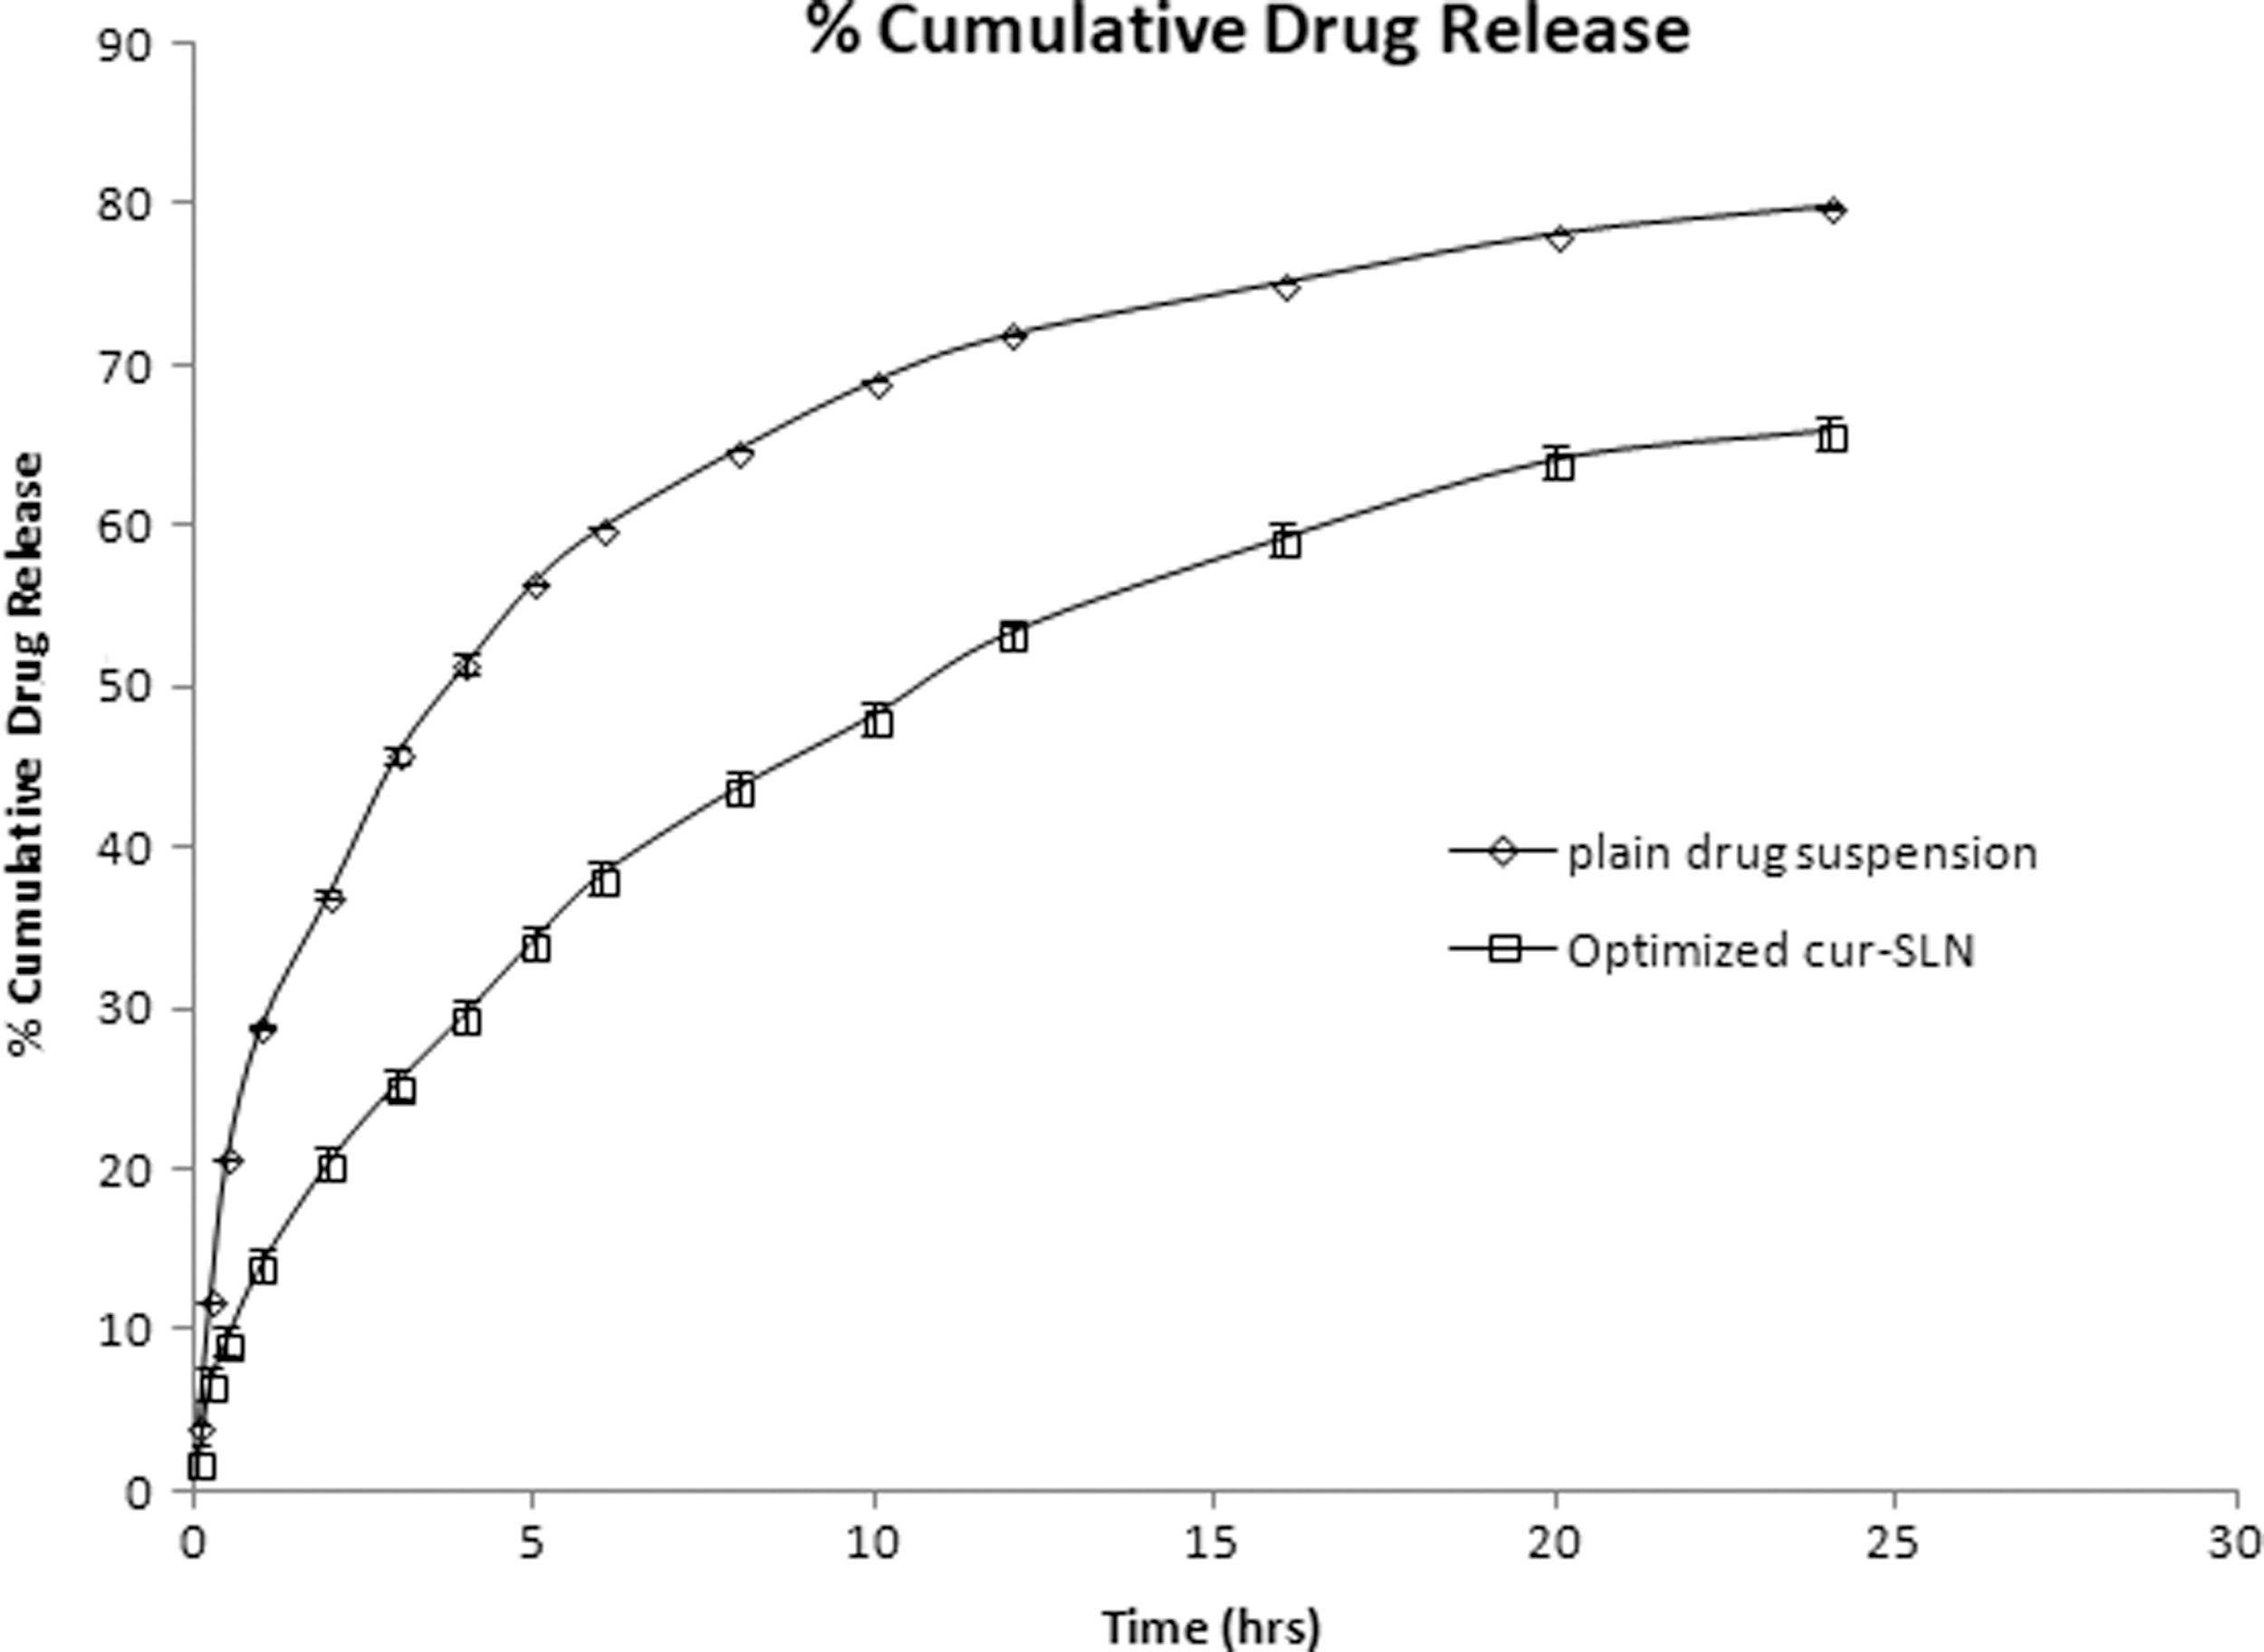
In vitro release of free drug and optimized batch.
Drug release kinetics
In the release kinetics study, the in vitro drug release data were fitted into zero-order, first-order, and Korsmeyer–Peppas model, and Higuchi kinetics. For the optimized batch, the highest value of the correlation coefficient (R 2 = 0.9895) was observed for the Higuchi model, as given in Figure 7. This shows the diffusion controlled release of drug from a matrix system where the sink conditions are perfectly achieved in the release environment. 51
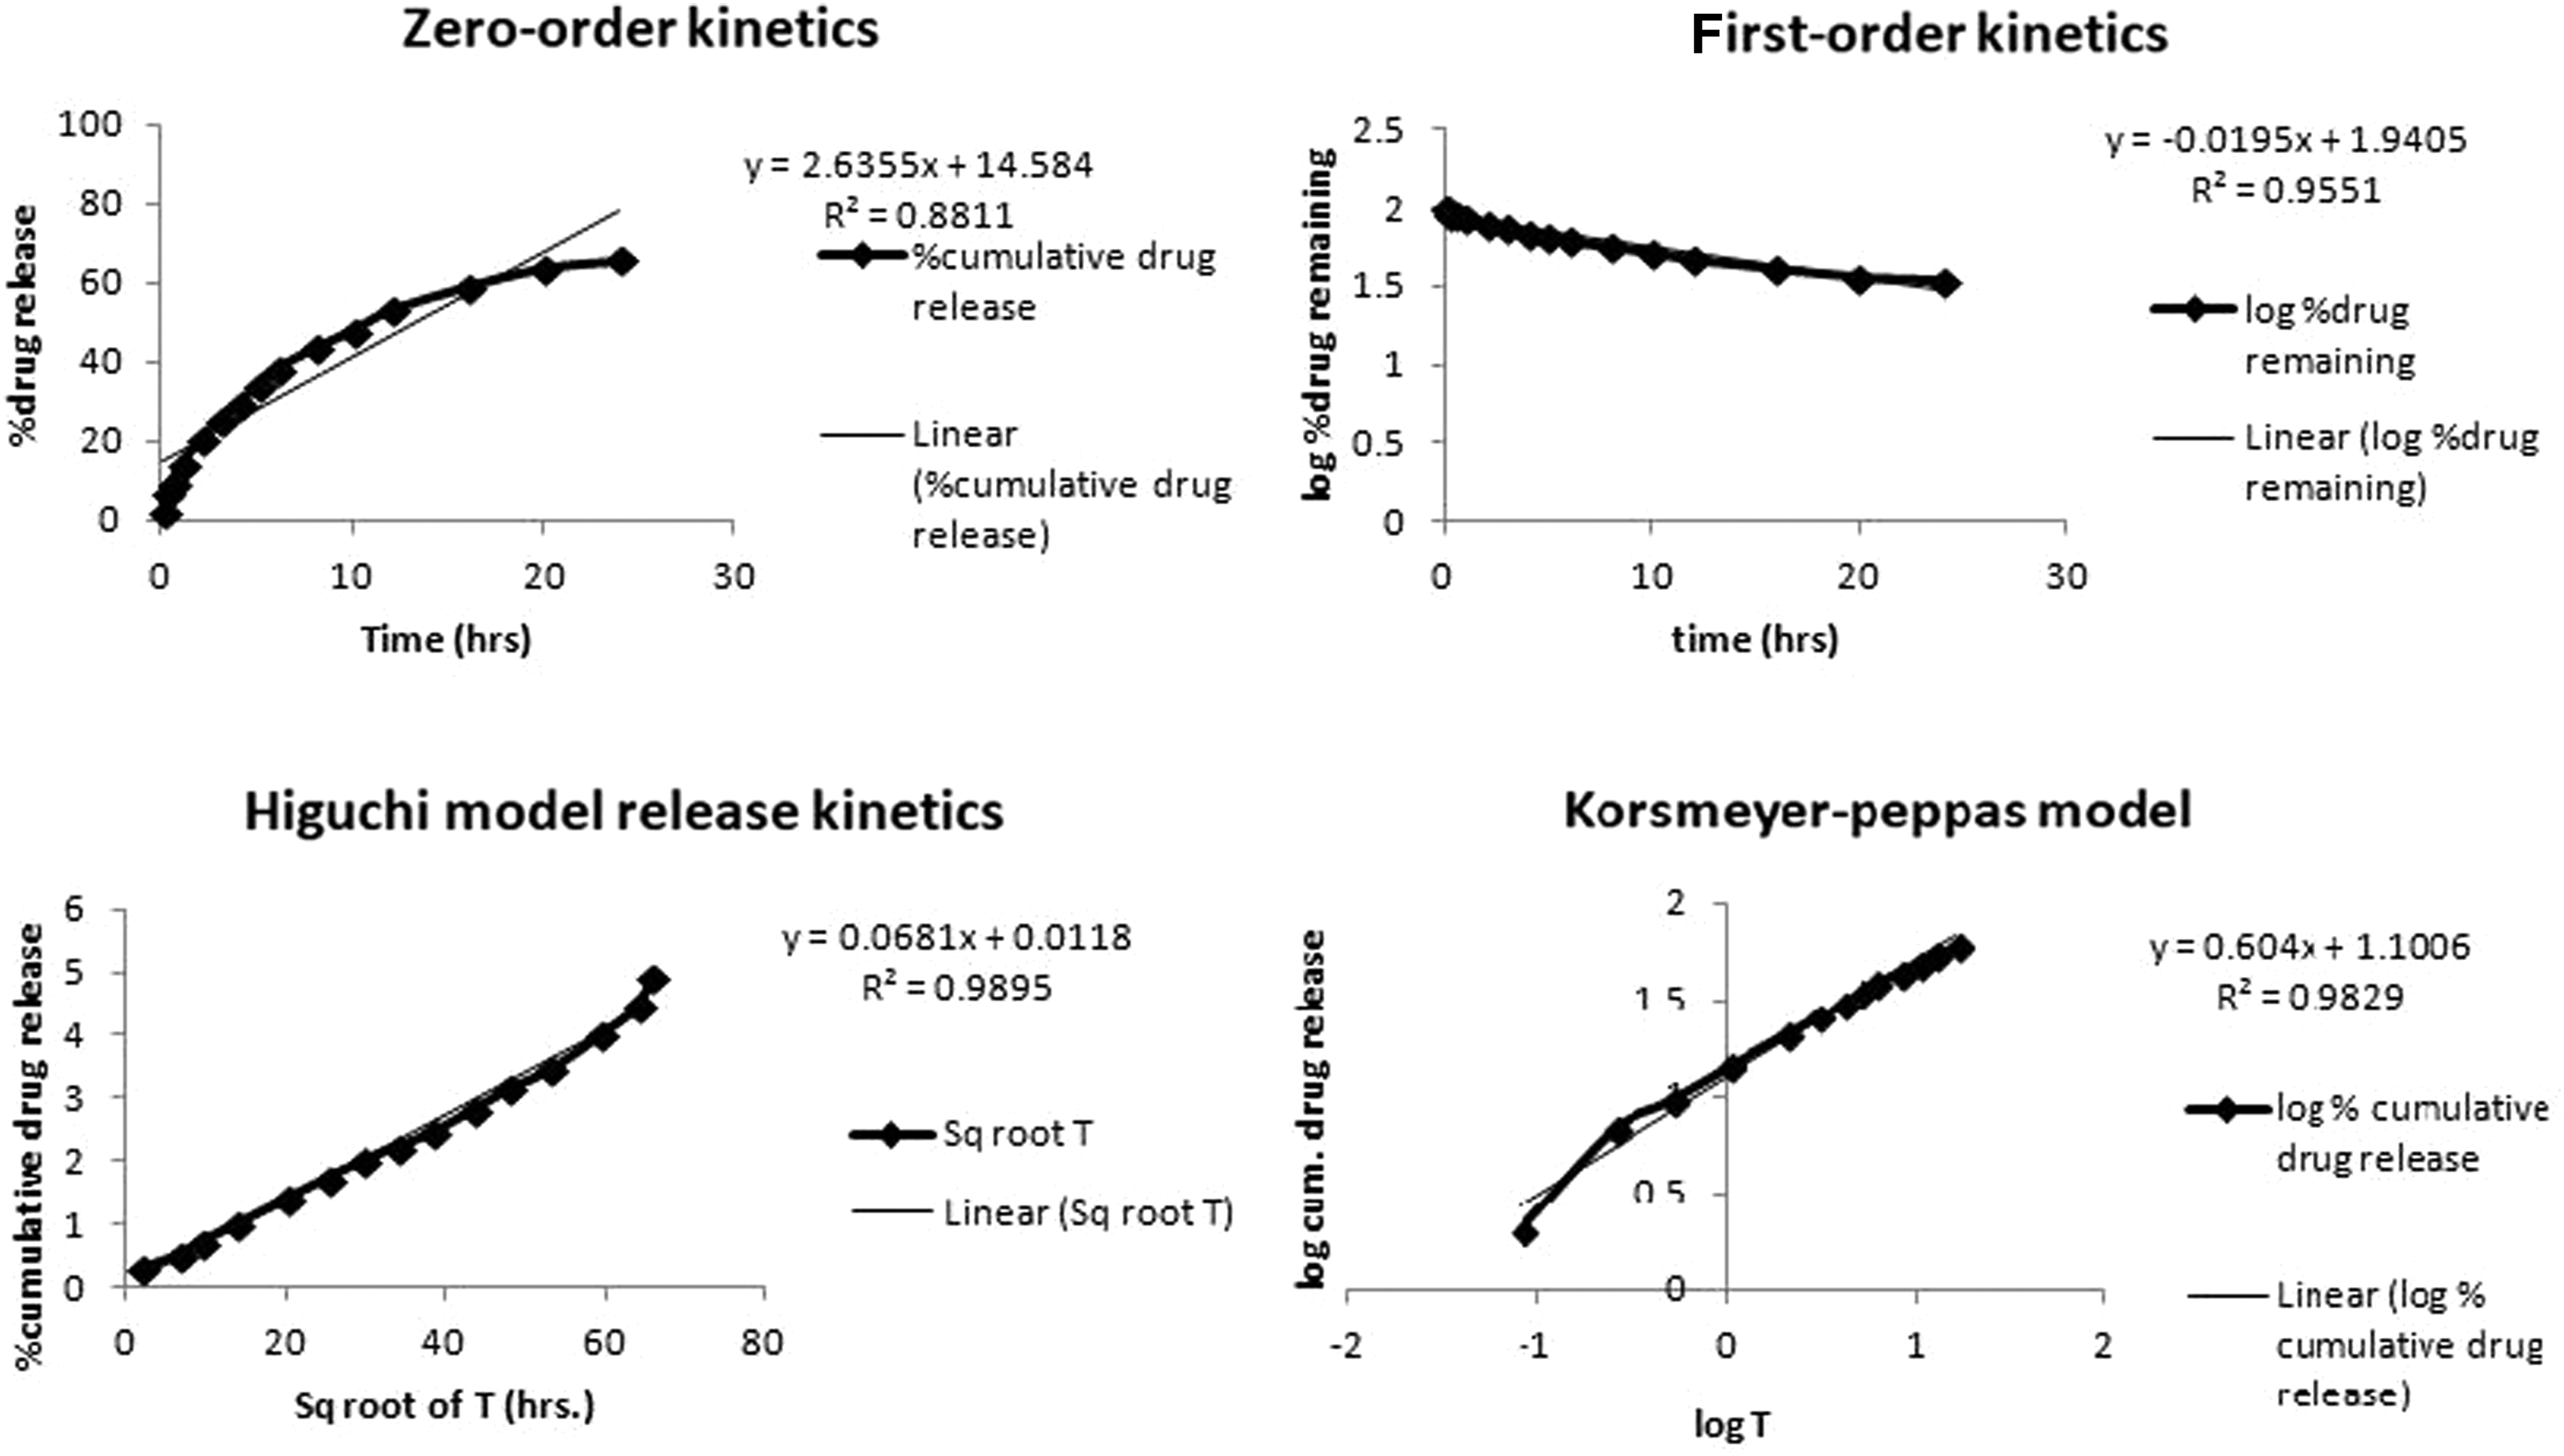
Release kinetics of optimized batch.
Morphological study
The morphological study of optimized Cur-SLN investigated using TEM revealed particles were spherical and monodispersed on the surface containing a dense lipid matrix without aggregation (Fig. 8). The particle size determined by TEM was in good agreement with the results of the zeta sizer.
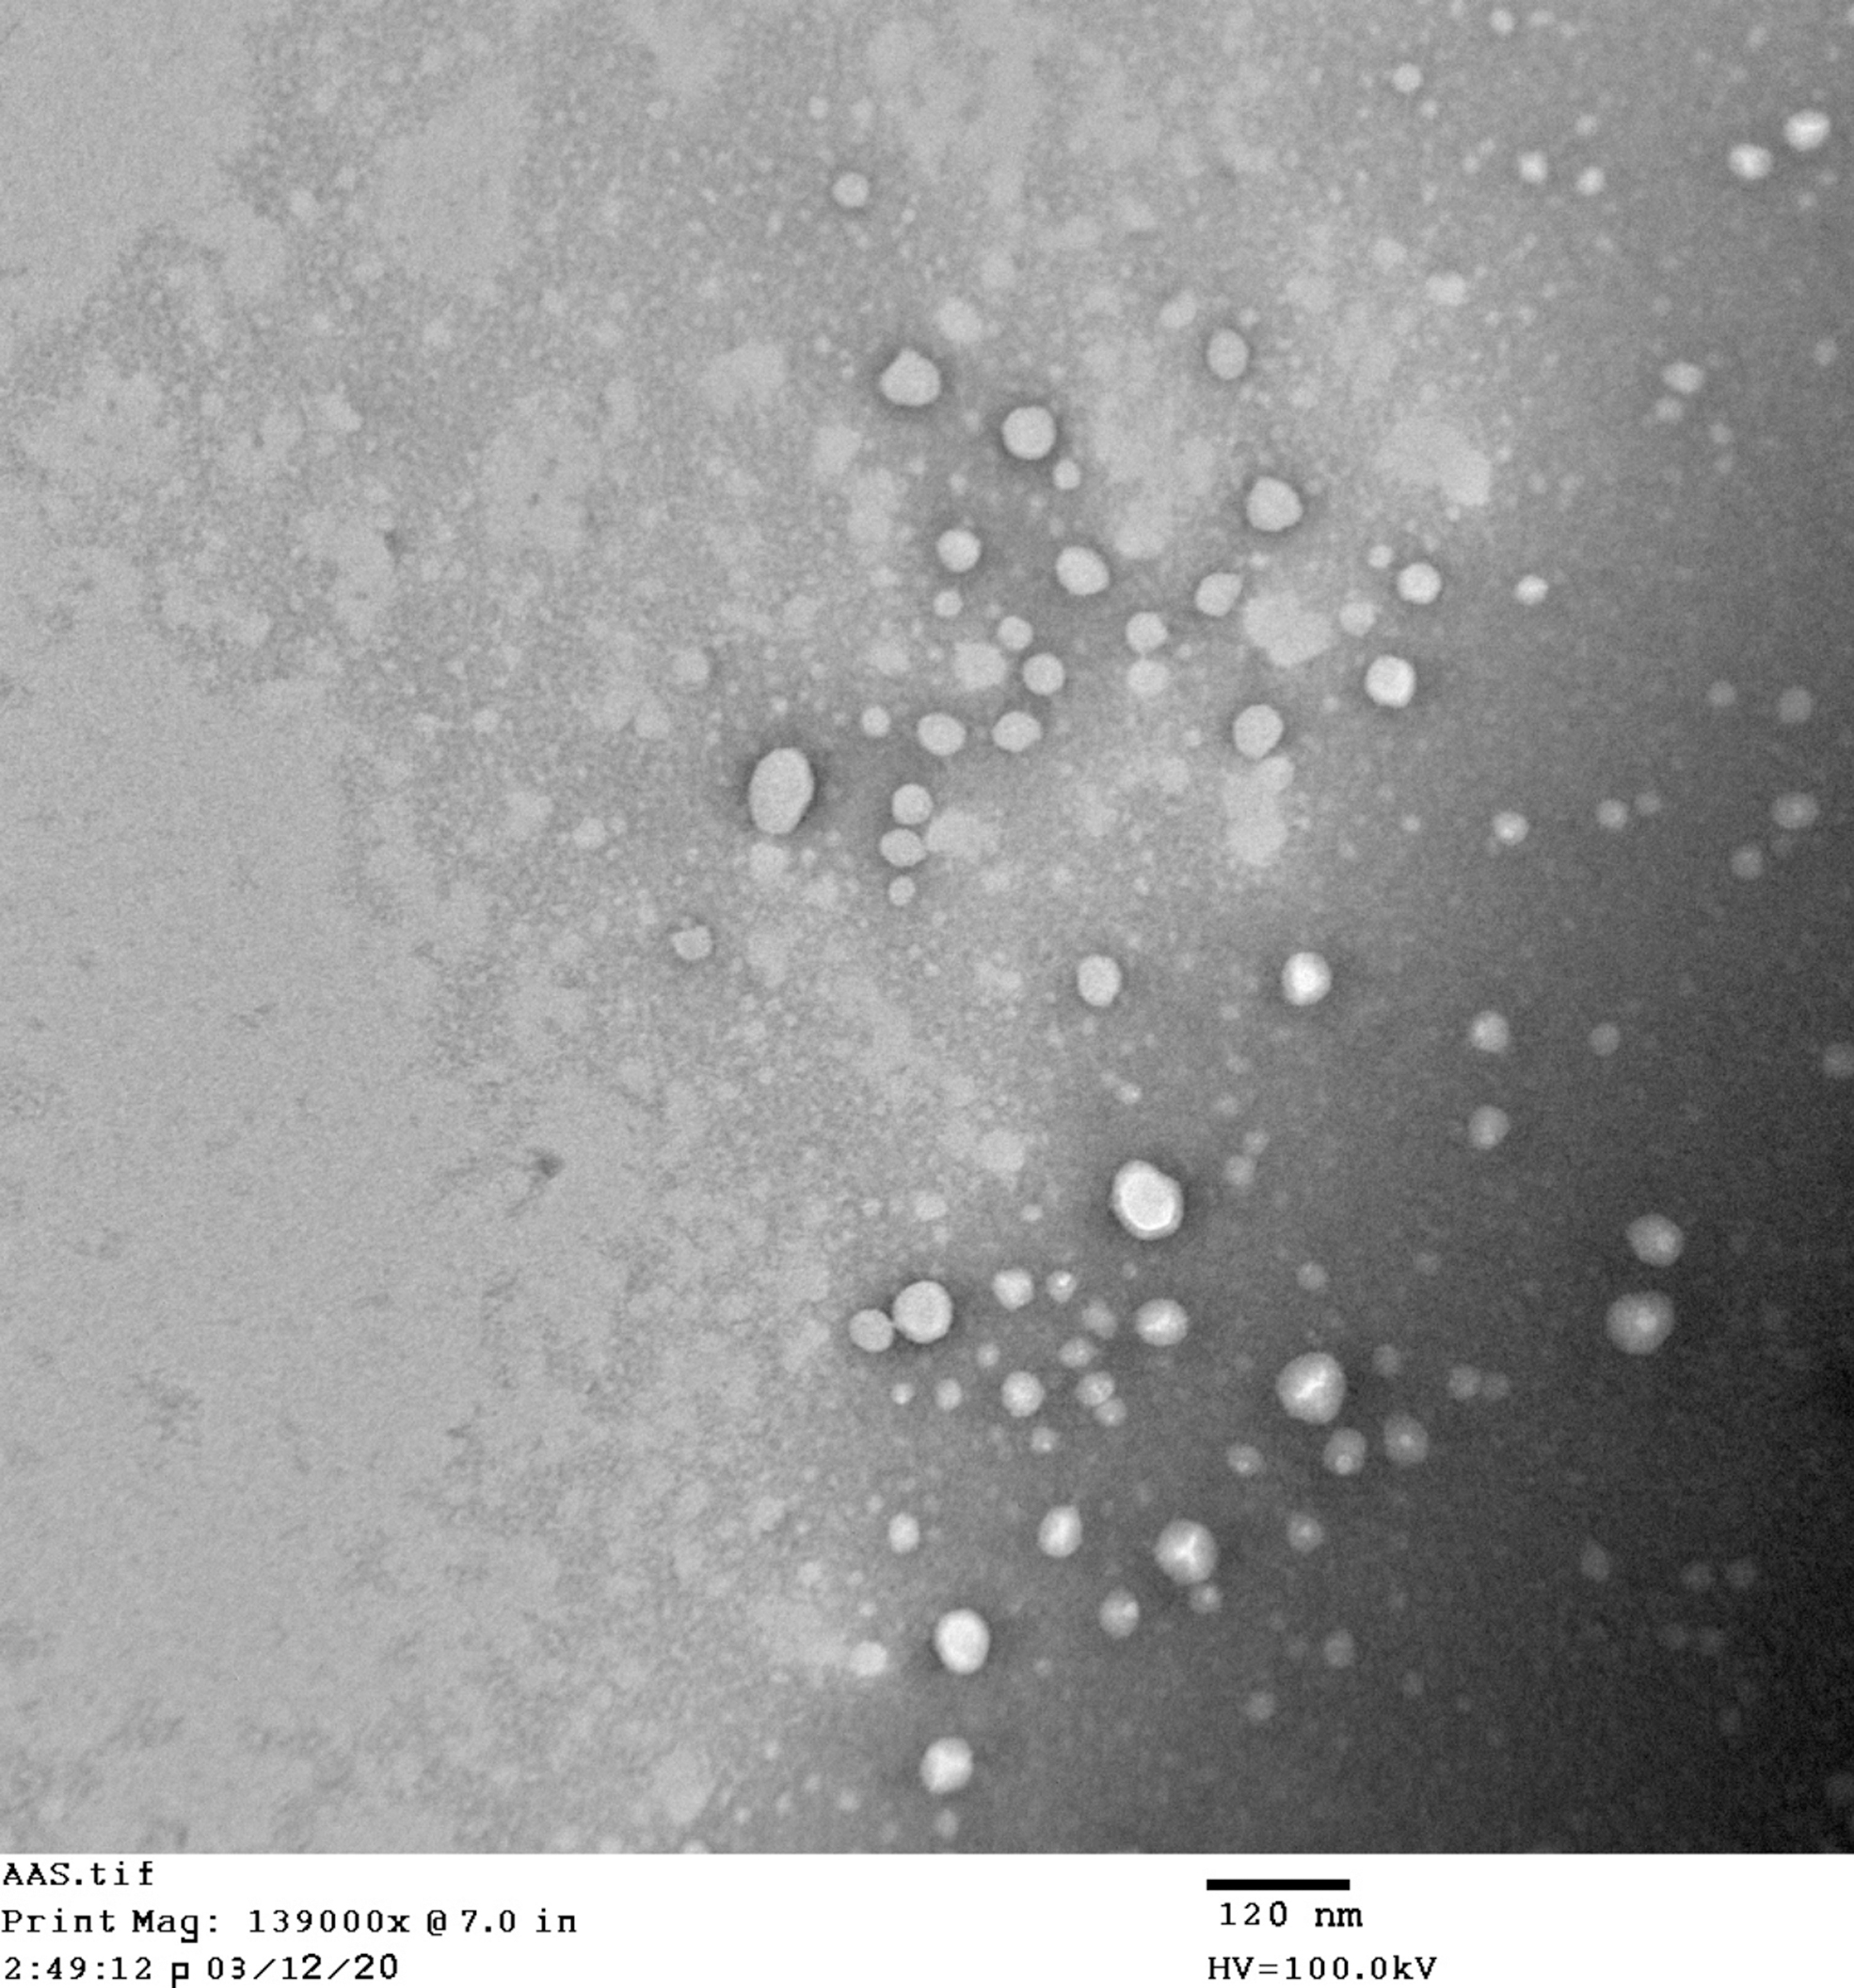
TEM image of optimized Cur-SLN. Cur-SLN, curcumin-loaded solid lipid nanoparticles; TEM, transmission electron microscopy.
DSC studies
The DSC thermograms of free curcumin, GMS, physical mixture, and optimized Cur-SLN are given in Figure 9. In the DSC thermogram of curcumin and GMS, a sharp endothermic peak at 177.57°C with enthalpy energy of 376.4 J/g and at 59.97°C with 395.2 J/g enthalpy energy were observed, respectively, which depicts the crystalline nature of the curcumin and GMS, respectively. Only slight shifting of peaks from 59.97°C to 61.15°C (GMS) and from 177.57°C to 170.07°C (curcumin) in the physical mixture with enthalpy energy 314.6 and 171.3 J/g for GMS and curcumin, respectively, confirms the compatibility of GMS and curcumin for the formulation of SLN. In the case of optimized Cur-SLN, curcumin peak disappeared owing to the conversion of crystalline form to amorphous form and incorporation of the drug in SLN. The broadness of peak and shifting of GMS peak from 61.15°C in the physical mixture to 58.89°C in SLN with the change in enthalpy energy from 314.6 to 137.06 J/g indicated the formation of SLN. 52
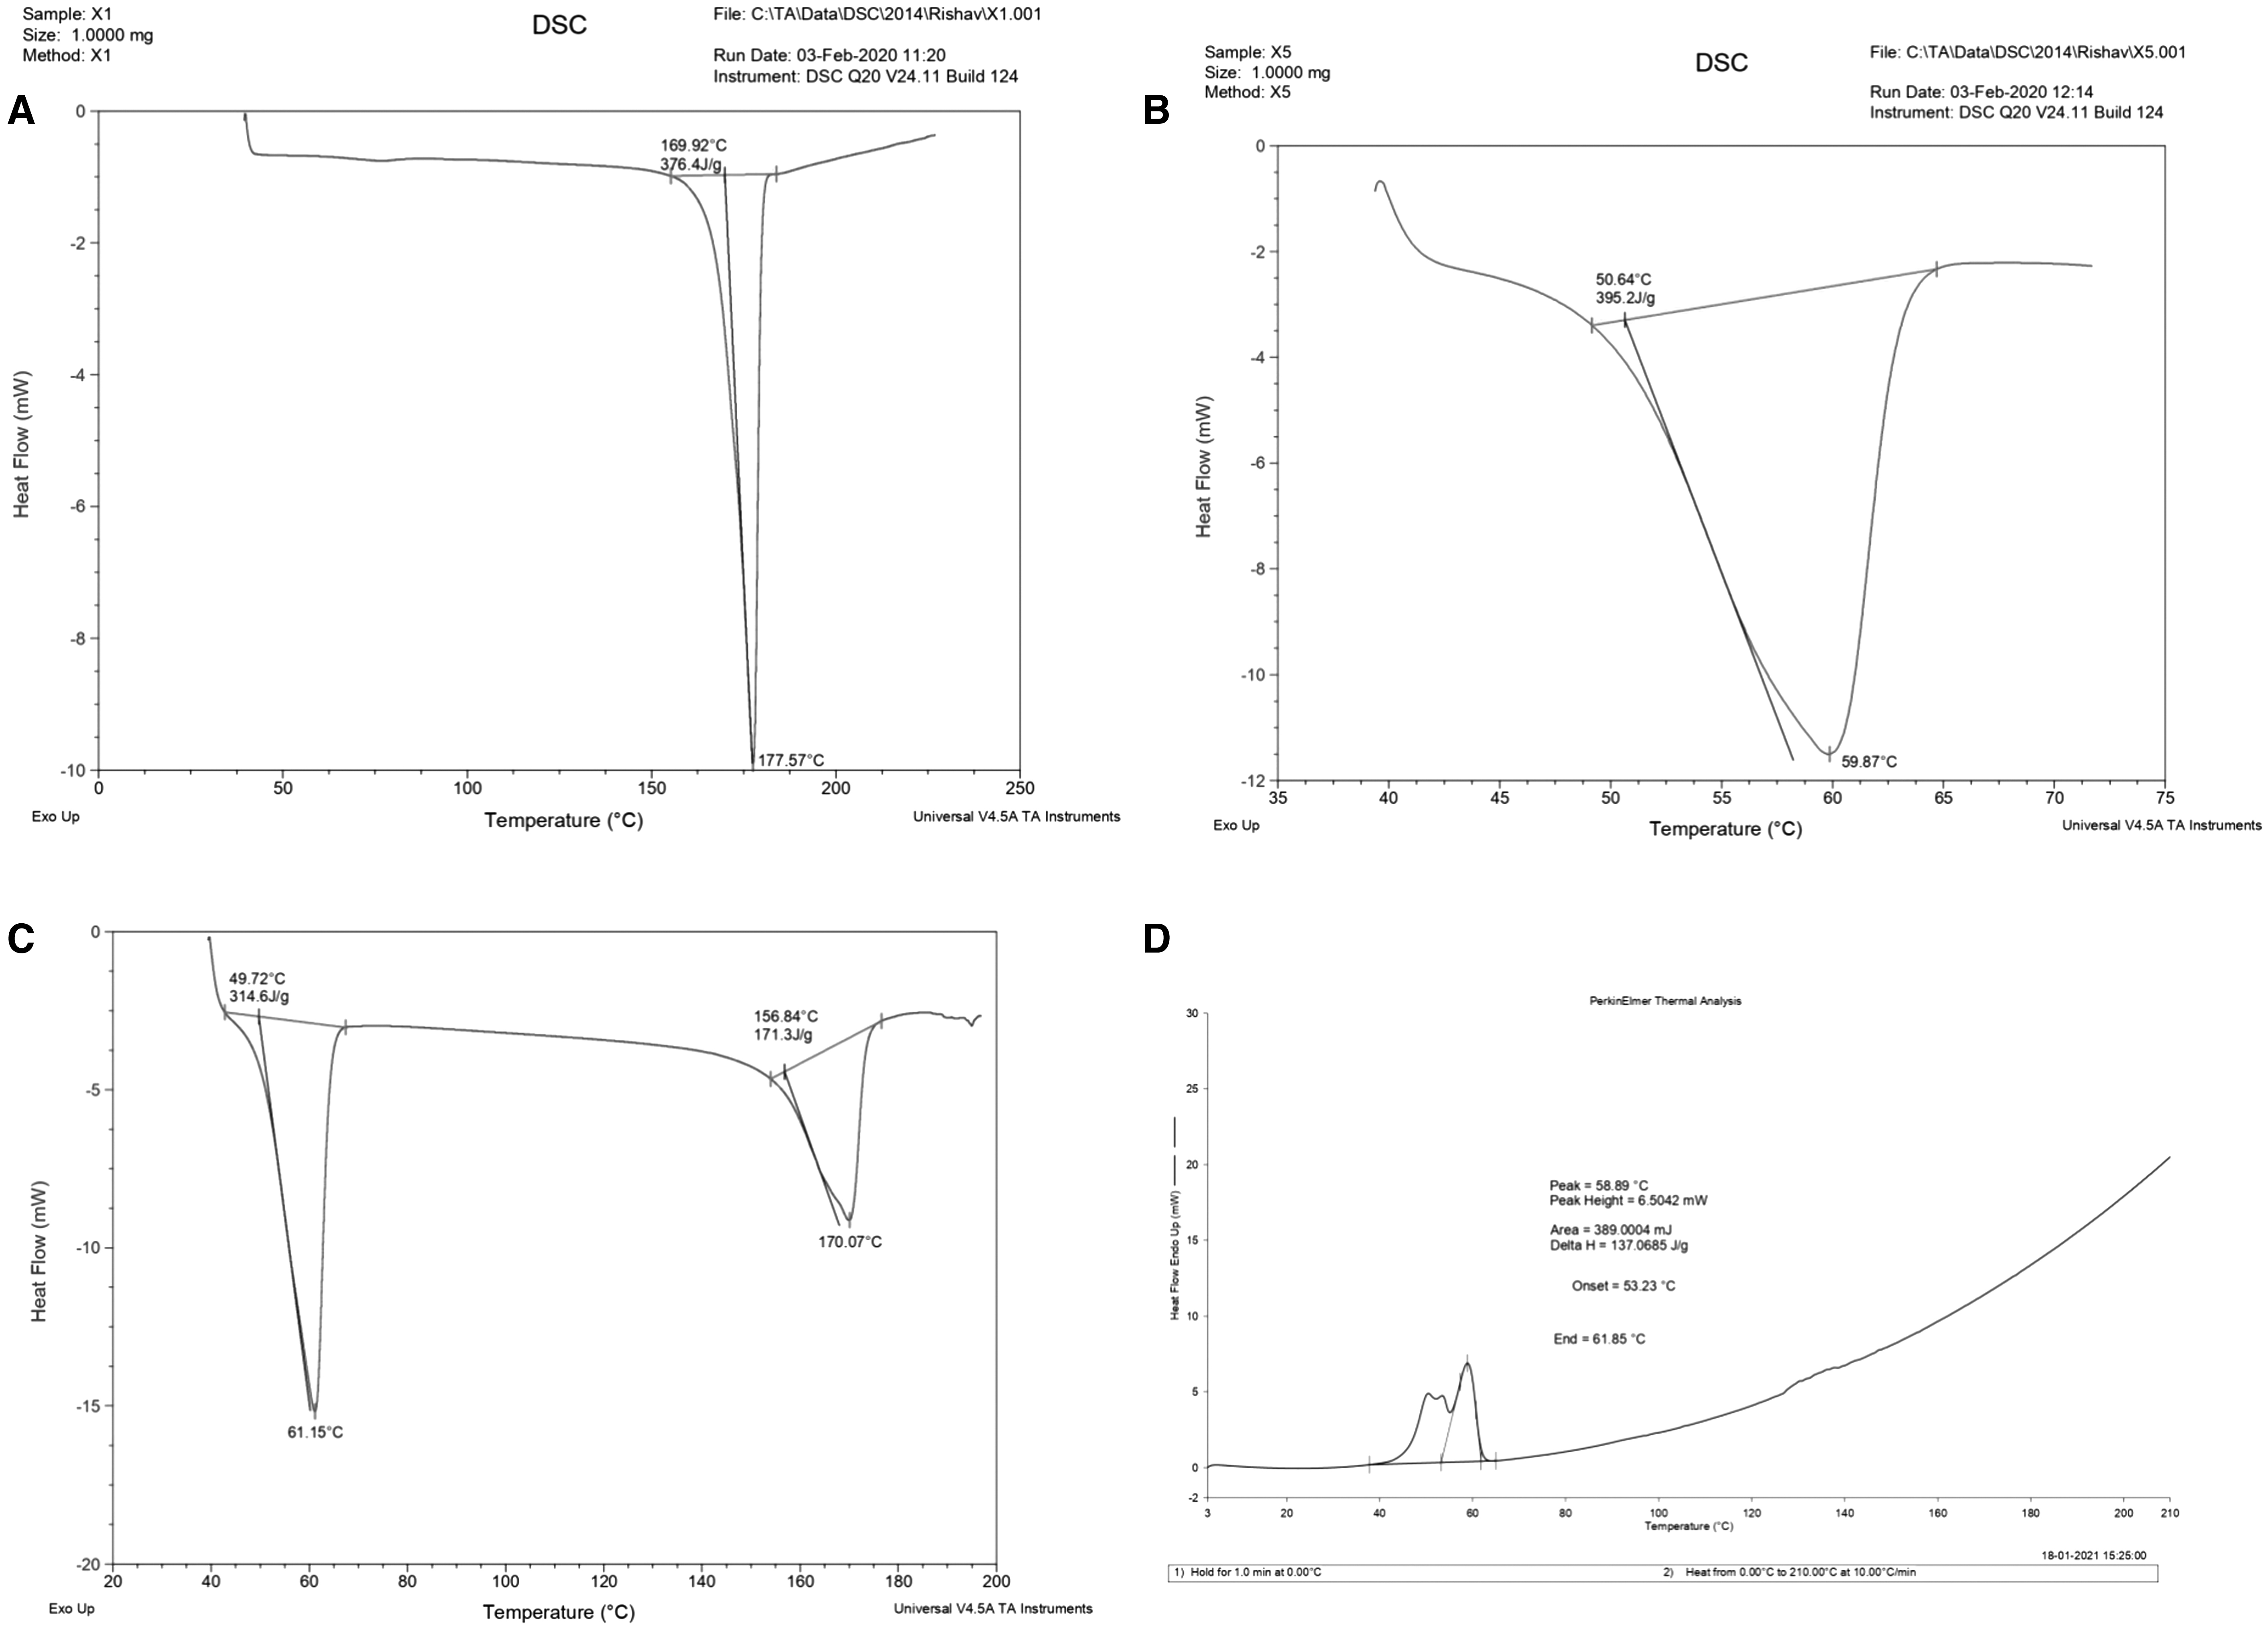
DSC thermogram of
In Vivo Studies
Pharmacokinetic studies
The chromatogram of blank (plasma) and standard curcumin obtained using by HPLC using the already developed method is given in Figures 10 and 11, respectively. The retention time of curcumin was 2.967 with area 424,908. The plasma calibration curve of curcumin was obtained in the range of 200–1,200, given in Figure 12. The comparative pharmacokinetics of the optimized Cur-SLN and plain drug suspension after oral administration is given in Figure 13. Various pharmacokinetics parameters such as C max, T max, AUC(0-t), AUC(0-inf), K el, T 1/2, Vd , and Cl were calculated using plasma concentration versus time profile; results are given in Table 6. T max and half-life of optimized Cur-SLN were higher than those compared with a plain drug suspension, which offers that optimized Cur-SLN retains for a long time in the body before dropping down. Eventually, clearance elimination rate constant and Vd of the optimized formulation is lower than plain curcumin suspension, which shows the existence of the drug in the body for a longer period. C max and AUC(0–24) obtained using plasma drug concentration–time curve of optimized Cur-SLN were found to be significantly higher (p < 0.01) than the plain drug suspension, which shows that optimized formulation has prolonged and sustained release compared with a plain drug suspension.
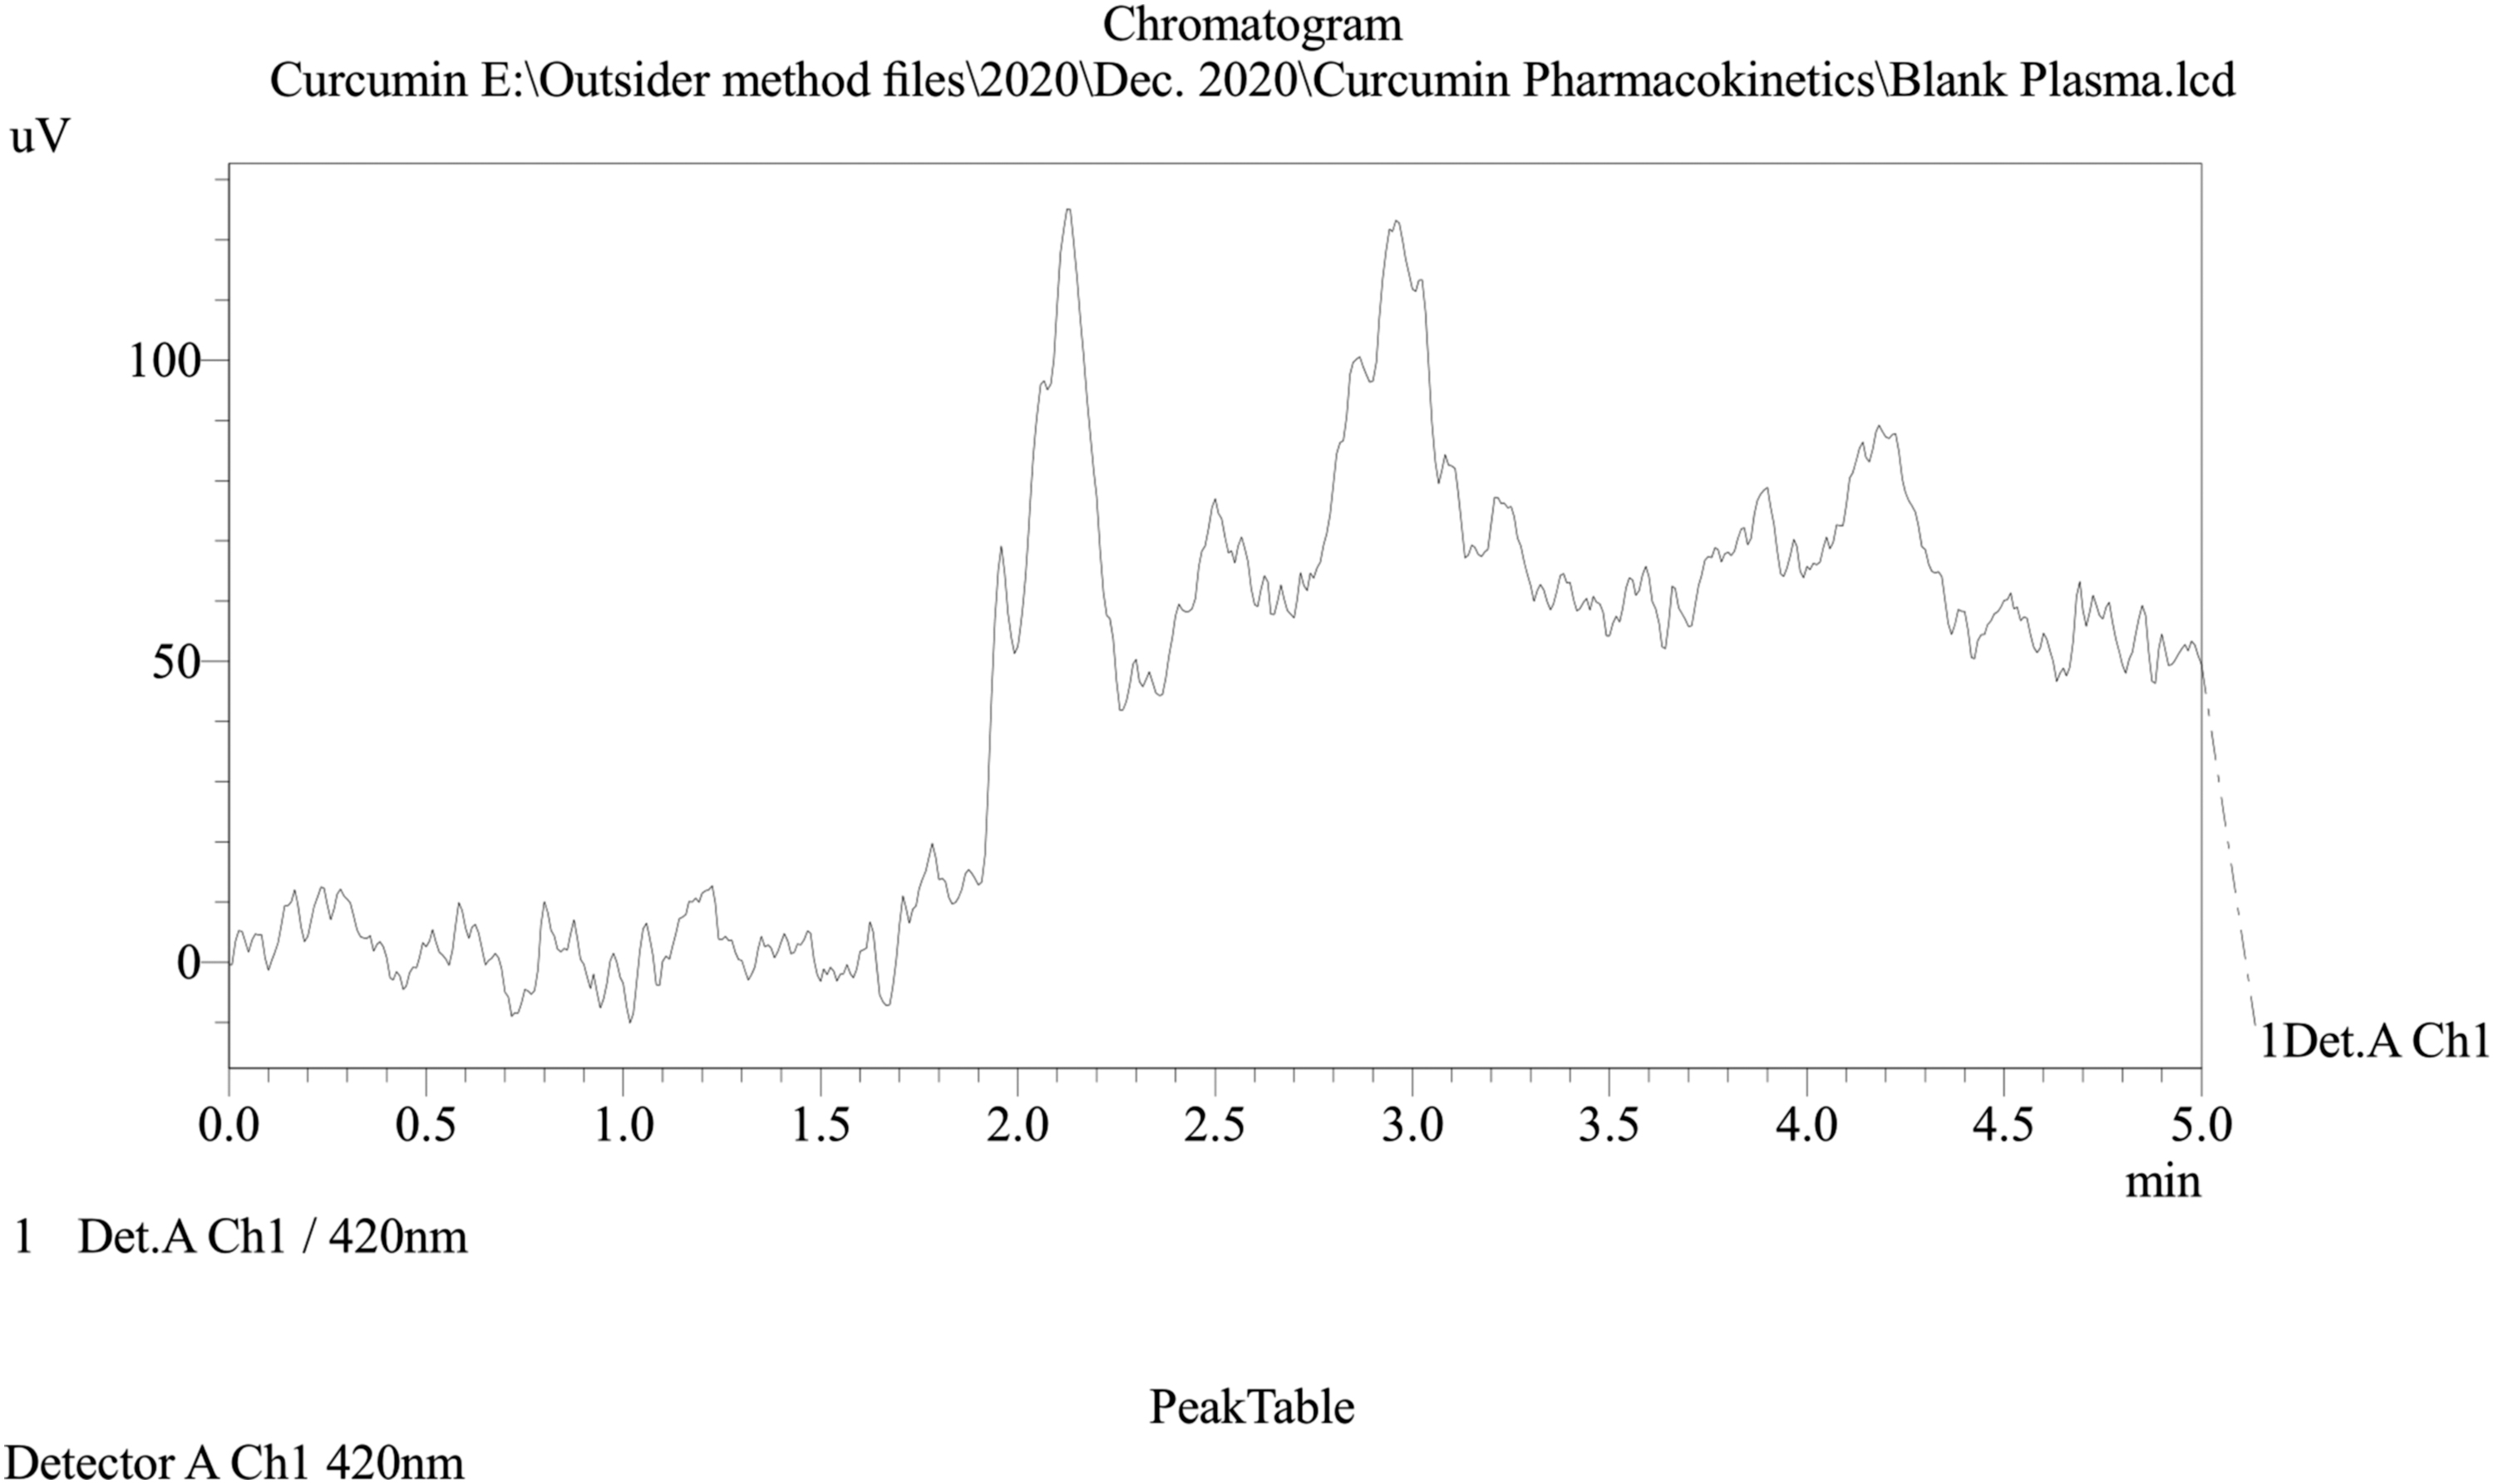
Chromatogram of blank plasma.
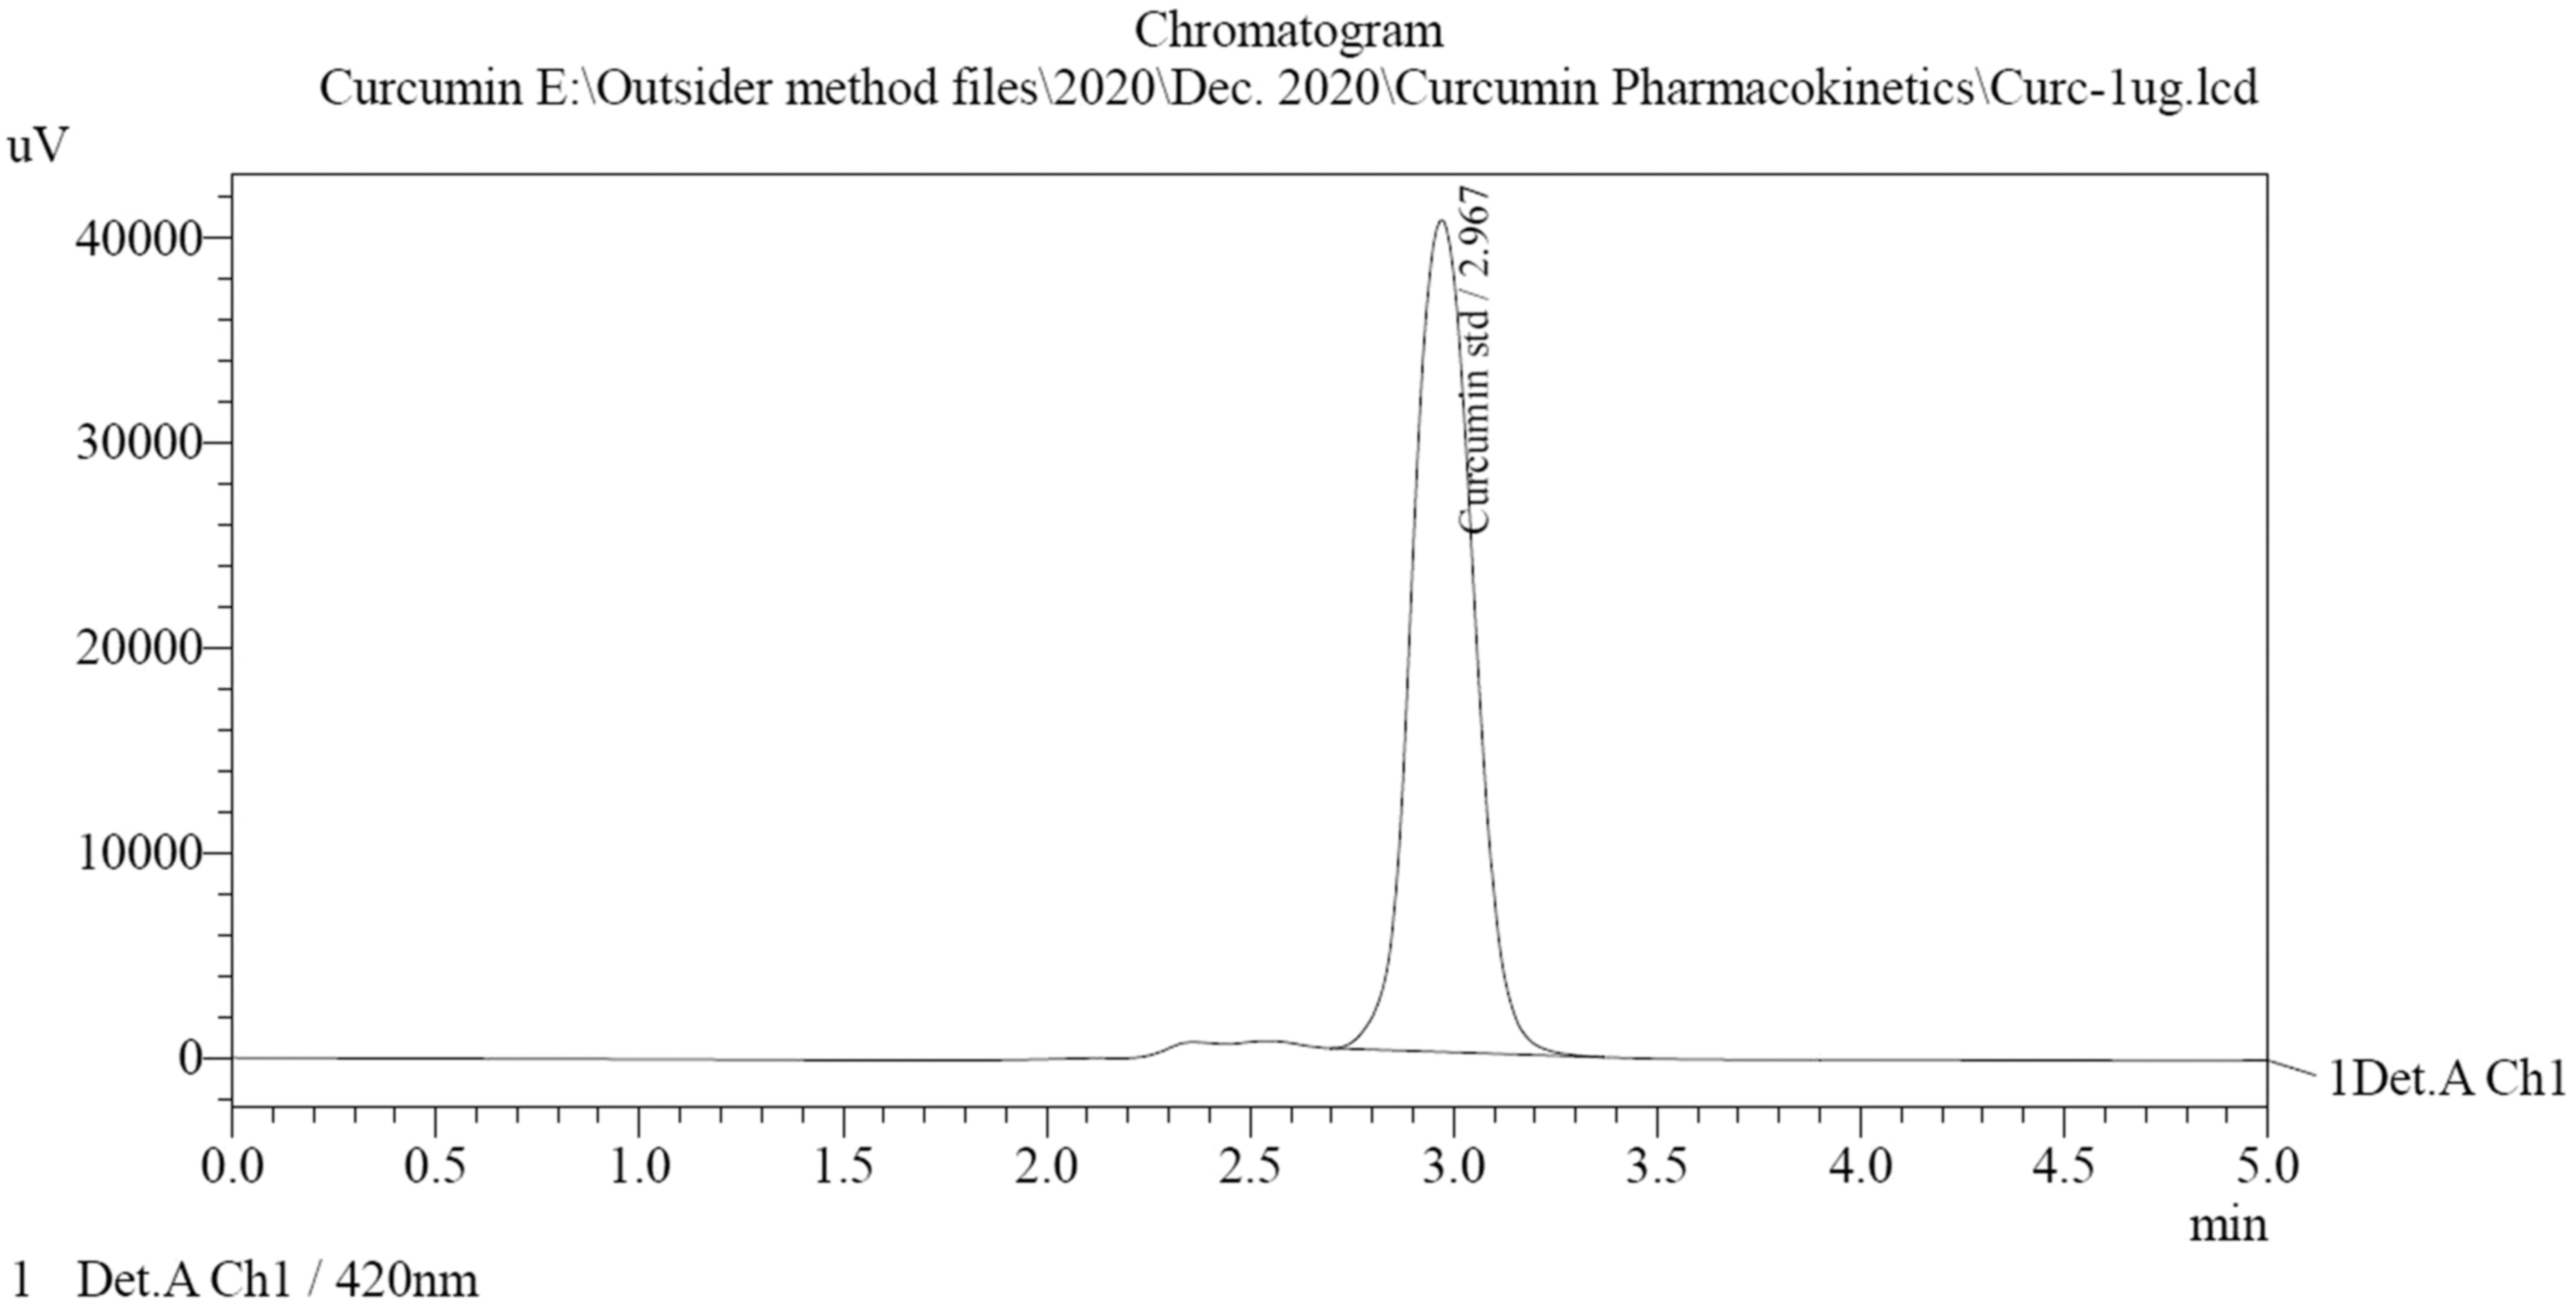
Chromatogram of curcumin (1,000 ng/mL).
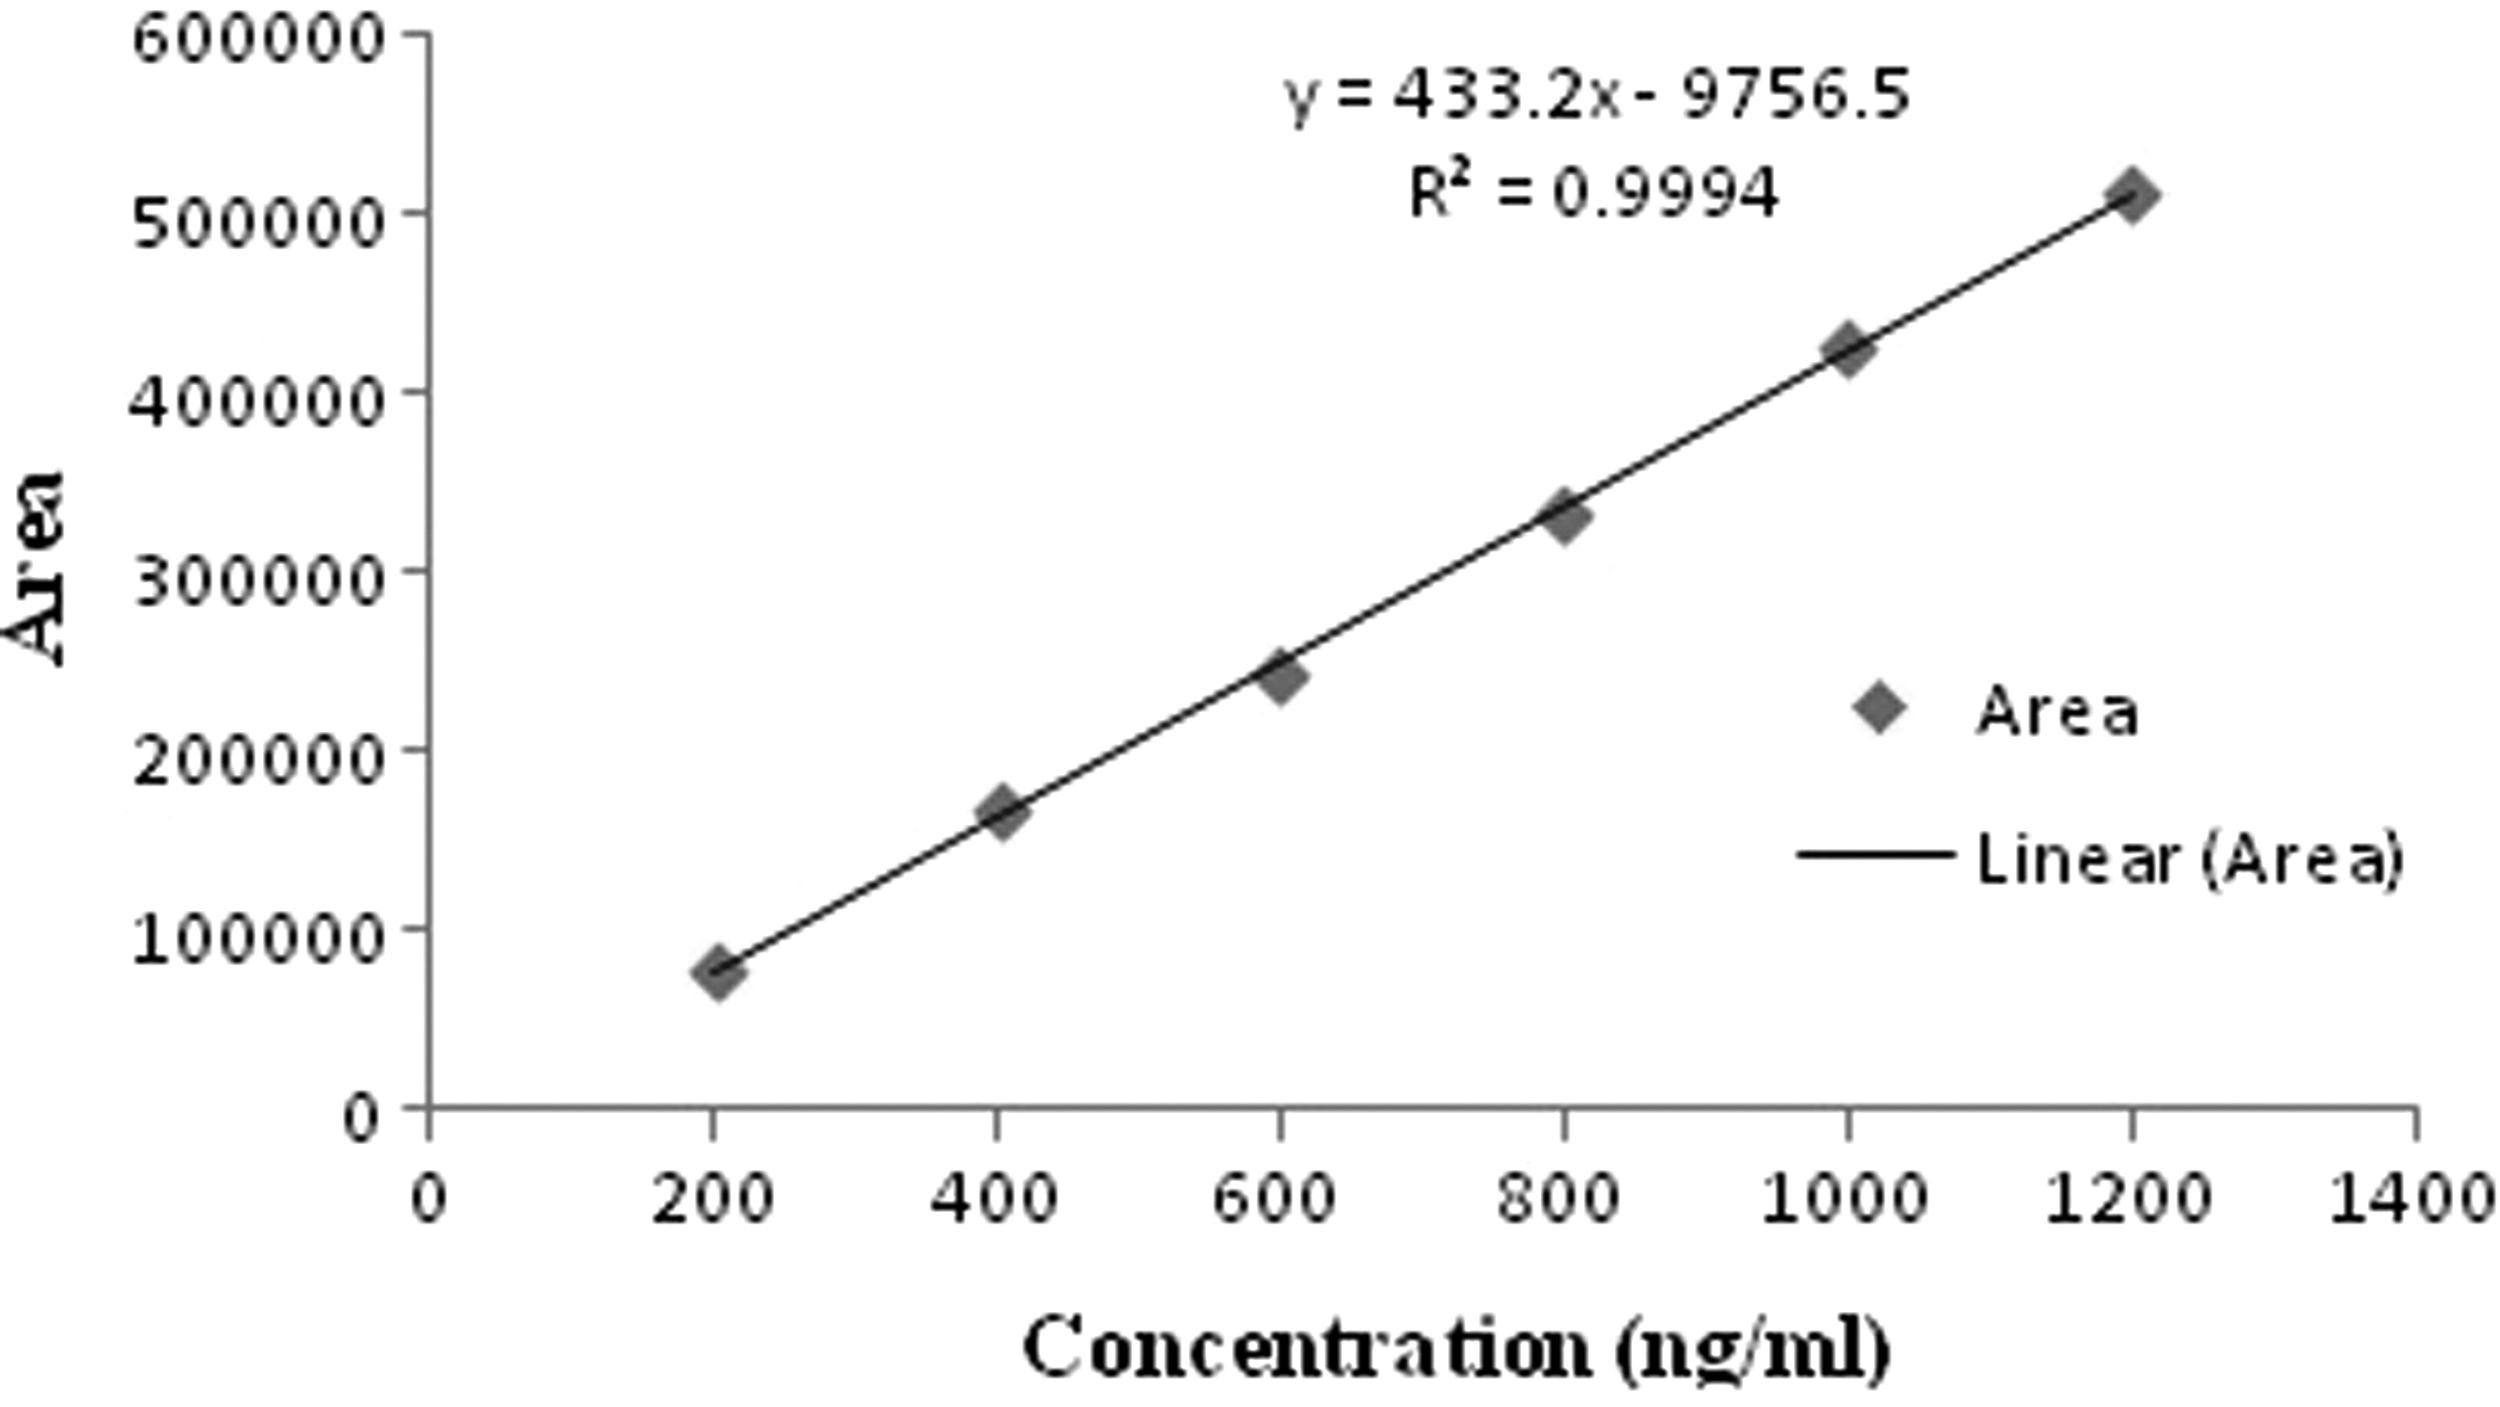
Plasma calibration curve of curcumin.
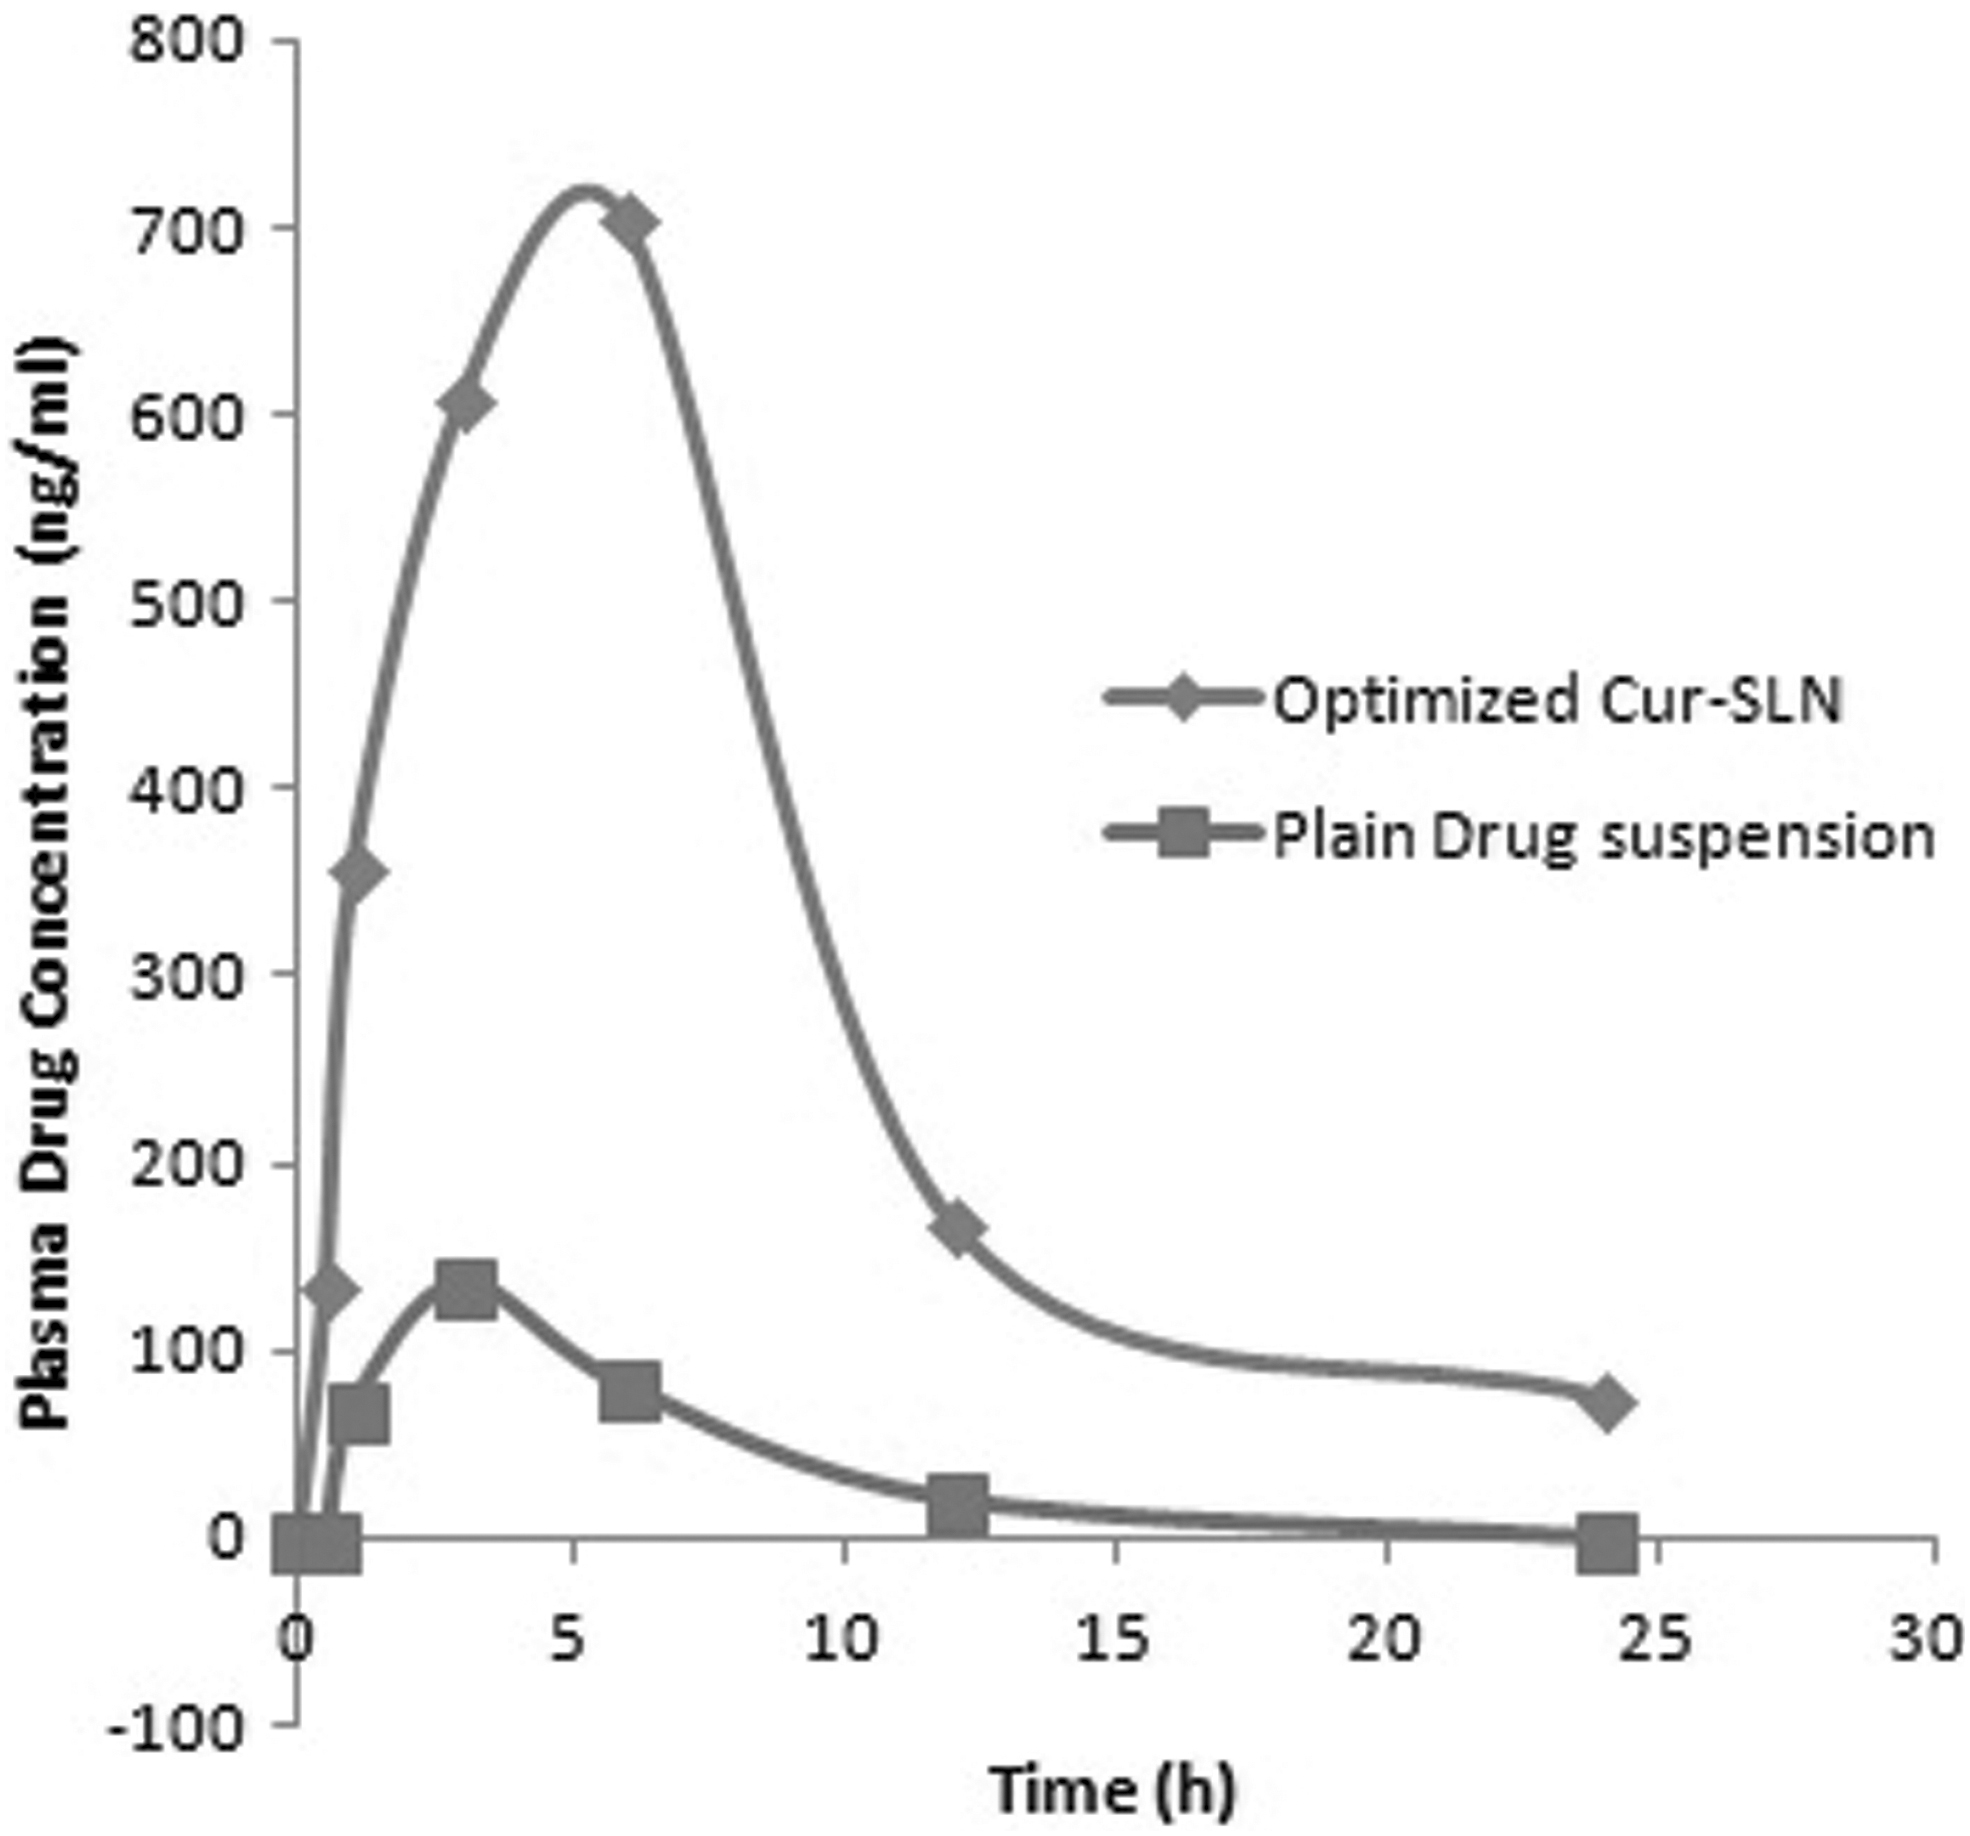
Comparative pharmacokinetics study of plain curcumin suspension and optimized Cur-SLN.
Comparative Results of Pharmacokinetics Parameters of Optimized Curcumin-Loaded Solid Lipid Nanoparticles and Plain Drug Suspension
AUC, area under curve; Cur-SLN, curcumin-loaded solid lipid nanoparticles.
Pharmacodynamic studies
Effect of optimized Cur-SLN on the incidence of diabetes. The mean blood glucose levels of blood samples taken at 0, 7, 14, 21, and 28 days were calculated for all the experimental groups; data are given in Table 7. STZ significantly (p < 0.05) induced diabetes in animals, with fasting glucose levels >200 mg/dL compared with nondiabetic control. Group I (nondiabetic control), treated with blank SLN, was observed with a stable mean blood glucose level throughout the study. By the end of study, group II (diabetic control-STZ [60 mg/kg]) animals were fully diabetic with a mean blood glucose level of 309.4 ± 3.528 at a significance of p < 0.001 compared with nondiabetic control. Reduction in mean blood glucose level (from 234.2 ± 7.621 mg/dL to 141.8 ± 4.290 mg/dL) was observed in the animals of group III (STZ [60 mg/kg]+pure drug suspension) and the incidence of diabetes was found to be decreased from 100% to 60% by the end of 28th day. A significant change (p < 0.05) in mean blood glucose level (272.0 ± 2.795 mg/dL–106.4 ± 6.908 mg/dL) was observed in the animals of group IV (STZ [60 mg/kg]+optimized formulation Cur-SLN) compared with diabetic control animals. The mean blood glucose level of group IV animals was almost similar to nondiabetic control animals by the 21st day onward. A quite acceptable decrease (from 100% to 39%) in the incidence of diabetes was found by the end of the 28th day.
Mean Blood Glucose Level (mg/dL) in Experimental Groups During the Pharmacodynamic Study
Values are expressed as Mean ± SD at n = 6, one-way ANOVA followed by Bonferroni test, * p < 0.050, compared to the Control group.
STZ, streptozotocin.
Effect of optimized Cur-SLN on body weights
No change was observed in the bodyweight of nondiabetic control animals, whereas body weight was drastically decreased in diabetic control animals. As compared with diabetic control, improvement was observed in the bodyweight of animals of a pure drug suspension and optimized Cur-SLN. Bodyweight of animals receiving optimized Cur-SLN was found to be increased after 28 days (Table 8).
Body weight (g) in Experimental Groups During the Pharmacodynamic Study
Stability Studies
Table 9 provides the data for the stability studies over 6-month period. During this period, no changes were observed in the physical appearance of the Cur-SLN, whereas a slight decrease was observed in entrapment efficiency at both the temperature conditions. The particle size of optimized formulation changed from 119.7 to 120.8 nm at 25°C ± 2°C/60% ± 5% RH, and from 119.7 to 125.9 nm at accelerated conditions after 180 days of storage. The comprehensive study revealed that formulation is stable over 6 months and can be stored for the extended period at room temperature. Still, slight changes can be observed at the accelerated conditions.
Stability Profile of Optimized Curcumin-Loaded Solid Lipid Nanoparticles Over 6 Months
RH, relative humidity; SD, standard deviation.
Conclusion
GMS was selected for the formulation of SLN based on lipid solubility studies. Trial batches were conducted for the selection of stabilizer concentration and frequency and time of sonication. The CCD was used for the preparation of SLN. Where drug concentration, lipid concentration, and surfactant concentration were selected as the independent variable, their effect was determined on the dependent variable, that is, particle size and the entrapment efficiency. In our result, the particle size and entrapment efficiency of the optimized batch obtained using CCD were 119.7 and 81.93 ± 0.974, respectively, which were in close agreement with the predicted values. The in vitro release study of the optimized batch showed burst release followed by the sustained release. The TEM results showed that particles were spherical in size and monodispersed in the formulation. The DSC study revealed that the drug changed from crystalline to amorphous form in the SLN. In vivo studies showed improved pharmacokinetics and enhanced antidiabetic activity of optimized formulation compared with a plain drug suspension. So, SLN could be used as a technique for curcumin delivery in the management of diabetes mellitus.
Footnotes
Disclosure Statement
No competing financial interests exist.
Funding Information
No funding was received.