
Abstract
Unhealthy alcohol use is prevalent among persons living with HIV (PLWH). Aging and increased survival of PLWH on antiretroviral therapy (ART) are complicated by metabolic dysregulation and increased risk of insulin resistance (IR) and diabetes mellitus. The objective of this study was to determine the prevalence and association of IR with unhealthy alcohol use in adult in-care PLWH. A cross-sectional analysis of metabolic parameters and alcohol use characteristics was conducted in adult PLWH enrolled in the New Orleans Alcohol Use in HIV (NOAH) Study. IR was estimated using homeostatic model assessment (HOMA-IR), triglyceride index, and McAuley index and beta cell function (HOMA-β). Alcohol use was assessed using Alcohol Use Disorders Identification Test (AUDIT)-C, 30-day timeline followback (TLFB), lifetime drinking history, and phosphatidylethanol (PEth) measures. A total of 351 participants, with a mean age [±standard deviation (SD)] of 48.1 ± 10.4 years, were included (69.6% male). Of these, 57% had an AUDIT-C score of 4 or greater, indicating unhealthy alcohol use. Mean body mass index (BMI) was 27.2 ± 7.0 kg/m2, 36.4% met criteria for metabolic syndrome, and 14% were diagnosed with diabetes. After adjusting for education, race, BMI, smoking status, viral load, CD4 count, use of protease inhibitors, statins, or metformin; physical activity and diabetes diagnosis, HOMA-IR, and McAuley index were negatively associated with AUDIT-C, and HOMA-β cell function was negatively associated with AUDIT-C, PEth, and TLFB. Cross-sectional analysis of NOAH participants indicates that alcohol use is associated with decreased HOMA-β cell function, suggesting dysregulation of endocrine pancreatic function.
Introduction
Aging and prolonged survival of persons living with HIV (PLWH) on antiretroviral therapy (ART) are complicated by several comorbidities, including metabolic dysregulation, leading to a higher risk for insulin resistance (IR), glucose intolerance, and frank diabetes mellitus. 1 –6 The mechanisms underlying glucose intolerance and IR in PLWH remain poorly understood. Evidence suggest that mechanisms include the human immunodeficiency virus, chronic subclinical inflammation, immune activation, and ART drugs, 7 –10 and can be exacerbated by increased prevalence of obesity 11 –16 and unhealthy alcohol use 17,18 in PLWH.
Studies on the effects of alcohol use and development of IR are inconsistent. Moderate alcohol consumption is reported to have a negative association with IR, 19 –24 whereas many human 25 –27 and rodent 28 –36 studies report increased metabolic dysregulation and IR with unhealthy alcohol use. The effects of alcohol on regulation of insulin and glucose metabolism may be influenced by a number of factors, including the nutritional status, acute or chronic response to alcohol, and patterns of alcohol use. 37 Clinical studies show that alcohol decreases circulating basal insulin levels 20 and the insulin and c-peptide responses to glucose. 38
Our study using a clinically relevant model of simian immunodeficiency virus (SIV)-infected macaques showed that chronic binge alcohol (CBA) exacerbates metabolic dysregulation. Using the frequently sampled intravenous glucose tolerance test, with a third-phase insulin infusion (modified minimal model), we demonstrated that CBA significantly impaired endocrine pancreatic response to a glucose load and decreased disposition index, an indicator of IR. 39
CBA administration also increased skeletal muscle proteasomal activity, impaired anabolic pathways and insulin signaling, 40 –43 altered mitochondrial function, 44,45 and dysregulated gene networks that regulate muscle homeostasis. 46 This was also associated with an ART-mediated increase in hepatic gene expression of key gluconeogenic and fatty acid synthesis enzymes. 47 Together, these whole-body and tissue-specific alterations indicating a CBA and ART-mediated exacerbation of metabolic dysregulation were seen in the absence of fasting dysglycemia or dyslipidemia. Furthermore, these alterations were present despite the consumption of a nutritionally balanced diet and without significant alterations in body composition. We speculate these alterations may precede a phase of overt glucose intolerance over time or with disease progression.
Homeostatic model assessment (HOMA) of β cell function and IR are simple, noninvasive, widely used measures, and are calculated from basal glucose and insulin values. 48,49 Moreover, strong positive associations exist between measures of HOMA, euglycemic clamp, and Bergman's minimal modeling. 50,51 IR also integrates impairments in utilization of fatty acids, increased triglycerides, and increased flux of free fatty acids from adipose to other tissues that can potentially amplify metabolic dysregulation. 52 Mathematical modeling using fasting plasma glucose, insulin, and triglycerides has been used to develop IR indices, including the triglyceride index and McAuley index. 53 –59
Our preclinical studies used young SIV-infected ART-treated rhesus macaques fed a nutritionally complete diet and administered alcohol (peak blood alcohol concentration is 50–60 mM) in a binge pattern everyday for a year. Although clinically relevant, confounding factors, including age, dietary patterns, patterns of alcohol use, physical activity, duration of HIV disease, and ART, can influence metabolic homeostasis in a clinical setting. To determine whether our preclinical findings translate in PLWH, a cross-sectional analysis of a prospective longitudinal cohort of adult PLWH recruited from University Medical Center New Orleans (UMCNO) was used and measures of IR were correlated to measures of alcohol use.
Materials and Methods
Cross-sectional analysis of baseline data collected from the New Orleans Alcohol Use in HIV (NOAH) Study, a prospective cohort study of biological mechanisms and socioenvironmental modifiers that contribute to the relationship between alcohol use and HIV-associated comorbidities, accelerated aging, and disease progression was performed. Details of the NOAH Study protocol have been published. 60 The study was reviewed and approved by the Louisiana State University Health Sciences Center New Orleans (LSUHSC-NO) Institutional Review Board (IRB #8786), and informed consent was obtained from all study participants.
Study population
The NOAH Study is a longitudinal investigation of a clinic-based sample of in-care PLWH in the greater New Orleans metropolitan area, conducted by the LSUHSC-NO Comprehensive Alcohol-HIV/AIDS Research Center. Patients ≥18 years of age were recruited from the UMCNO HIV Outpatient Program (HOP) Clinic and a community health center in New Orleans. Exclusion criteria included acute illness within the preceding 6 weeks, nonprophylaxis prescription of antibiotics, pregnancy, or acute intoxication on the day of visit as determined by a breathalyzer test. The original sample (N = 365) was further restricted to include only those participants who had complete laboratory values for fasting insulin, glucose, and triglycerides. The final sample size for the analysis of this study was 351.
Data collection
The data used in this analysis are from the comprehensive baseline visit completed between October 2015 and November 2017. Data were collected through survey questionnaires and physical examinations, including body weight, blood pressure, and blood samples. Viral loads and CD4 counts were performed at the UMCNO clinical laboratory. Data on ART regimen, medications used, and diabetes diagnosis were collected from the UMCNO's electronic medical records. Alcohol use was assessed using multiple validated instruments and a biological marker.
Characteristics of the NOAH cohort
Participants self-reported demographic information on gender (male or female), race (African American, white, or other), and educational attainment (less than high school, high school diploma or GED, at least some college, including junior, vocational trade and the like, or college graduate). Body mass index (BMI) was classified as follows: <18.5 as underweight, 18.5 to <25.0 as normal, 25.0 to <30.0 as overweight, and ≥30.0 as obese. Smoking status was categorized as nonsmoker, former smoker, or current smoker. CD4 was categorized as <200, 200–350, and >350 cells/μL. Viral load was categorized as <50, 50–200, 201–1,000, or >1,000 copies/mL.
Blood metabolic measures
Subjects were advised to not consume alcohol for 24 h and not consume food or drink from midnight, before the visit in the morning. Alcohol levels had to be zero using a breathalyzer test and the subjects had to confirm that they had fasted since midnight before blood collection. Blood was used for collection of serum, plasma, and dried blood spots for phosphatidylethanol (PEth) determination. Blood chemistries were performed at UMCNO clinical laboratories. The metabolic panel included cholesterol, triglycerides, high-density lipoprotein (HDL), low-density lipoprotein (LPL), and glucose. Plasma insulin was measured using an ELISA kit (Millipore Human Insulin ELISA Cat. No. EZHI-14K) according to the manufacturer's instructions.
IR was determined using the following equations.
HOMA-IR = product of fasting insulin, μU/mL × fasting glucose, mg/dL divided by 405. Participants with a HOMA-IR ≥1.9 were considered insulin resistant. 61,62
Triglycerides index = Ln [fasting triglycerides (mg/dL) × fasting glucose (mg/dL)/2]. Participants with an index of >8.5 were considered insulin resistant. 63
McAuley index = exp [2.63–0.28 × log (insulin, μU/L) −0.31 × log (triglycerides, (mg/mL)/89]. Participants with a McAuley index <5.8 were considered insulin resistant. 55,54
HOMA-β cell function was calculated as 360 × fasting insulin (μU/mL)/[fasting glucose (mg/dL) −63]. 48
Metabolic syndrome was defined as having three of five conditions: high blood pressure [≥130 mm of Hg (systolic) and ≥85 mm of Hg (diastolic) or a medical history of hypertension], low HDLs [≤40 mg/dL (men)/50 mg/dL (women)], high triglycerides (≥150 mg/dL), high glucose (≥100 mg/dL), or high waist circumference >88 cm (women)/102 cm (men).
Measures of alcohol use
The Alcohol Use Disorders Identification Test (AUDIT) questionnaire is a 10-item tool developed by the World Health Organization with an overall score ranging from a possible 0–40. 64 For this study, AUDIT-C, the sum of the first three questions of AUDIT with a scale of 0–12 was used as the primary predictor of hazardous drinking. An AUDIT-C score of ≥3 in women and ≥4 in men was considered unhealthy alcohol use.
Thirty-day Timeline Followback (TLFB) Calendar was used to assess quantity and frequency of alcohol use. Participants were interviewed with prompts and props to report days in which alcoholic beverages were consumed, the number of drinks, and the types of alcoholic beverages consumed for the past 30 days before the study visit. Total grams of alcohol were tabulated by utilizing the self-reported drinks data to calculate the total standard alcohol drinks consumed by day and type (beer, wine, or liquor), which was then used to calculate total grams of alcohol consumed each day; 14 g of alcohol was equated to one standard drink. A heavy drinking day was defined as five or more drinks on a day.
Lifetime drinking history was assessed using a questionnaire for retrospective assessment of frequency and quantity of alcohol use by decade starting at ages 10–20 years to current age decade. Age of first drink and regular drinking (once a month for 6 months in a row) was also determined. Lifetime total consumption in grams was calculated by the following formula: “times a month” × “reported drinks on a typical day when drinking.” Quartile cut points <100, 100–600, and >600,000 g were evaluated.
PEth is a direct biomarker of alcohol use and is formed on the surface of red blood cells when ethyl alcohol reacts with phosphatidylcholine. PEth can be measured and is a highly reliable blood test allowing for detection of unhealthy alcohol use for the previous 3–4 weeks. 65 Dried blood spot samples were sent for analysis at United States Drug Testing Laboratories Inc. (Des Plaines, IL). A measure of ≥8 ng/mL was considered a positive test and a measure of >250 ng/mL was categorized as alcohol misuse.
Statistical analysis
Chi-square test was used to compare demographic characteristics and drinking status and drinking patterns by gender. Wilcoxon ranked sum test was used due to the lack of normality to compare the means of the continuous alcohol measures across by drinking status. Linear regression and logistic regression were used to model alcohol measures, IR, and metabolic syndrome. Crude and adjusted associations between alcohol use measures and outcomes were tested using bivariate and multivariable regression models, respectively. Models were adjusted for education, race, BMI, smoking status, viral load, CD4 count, protease inhibitor use, and use of statins or metformin, physical activity, and diabetes diagnosis. Analyses were completed using SAS version 9.4 (SAS Institute, Cary, NC) and GraphPad Prism. A two-sided p-value <.05 was used for determining statistical significance.
Results
Demographics, clinical, and anthropometric measures
The mean age [±standard deviation (SD)] of the NOAH participants included in the analyses was 48.1 ± 10.4 years, 69.6% were male, 84.1% African American, and 14% were diagnosed with diabetes (Table 1). There were no statistically significant differences by gender for the proportion of race groups, education, smoking status, CD4 count, or viral load. Women had significantly higher BMI (p = .001), and higher frequency of obesity (44.4% compared with 21.8% among men) (Table 1 and Fig. 2).
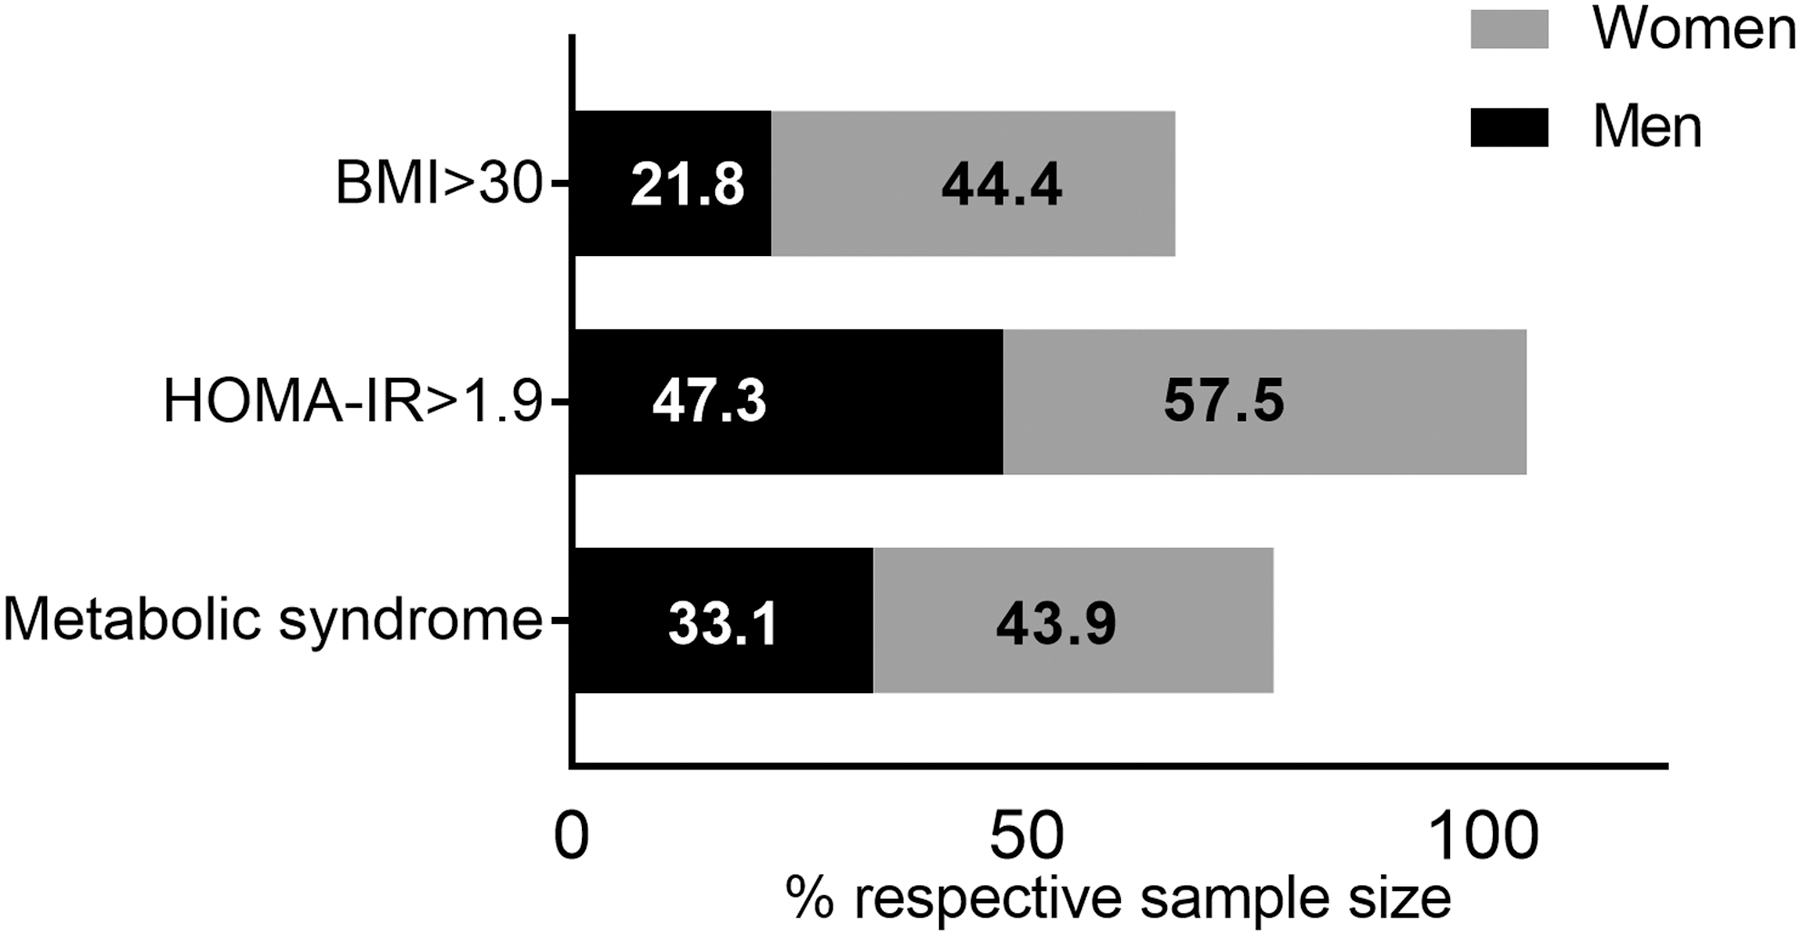
Percentage of men and women in the NOAH cohort with BMI >30, a score >30 indicates obesity. Percentage of men and women with a HOMA-IR ≥1.9. A score of ≥1.9 indicates insulin resistance. Percentage of men and women meeting criteria for metabolic syndrome. Criteria for metabolic syndrome were having three of the five following conditions: hypertension [≥130 mm of Hg (systolic) and ≥85 mm of Hg (diastolic) or a medical history of hypertension], low high-density lipoproteins [≤40 (men)/50 (women)], high triglycerides (≥150 mg/dL), high glucose (≥100 mg/dL), or waist circumference >88 cm (women)/102 cm (men). BMI, body mass index; HOMA-IR, homeostatic model assessment—insulin resistance.
Demographics of Participants in the New Orleans Alcohol Use in HIV Study
Bold value indicates that p value is statistically significant.
Blood metabolic measures
There were no differences by gender for fasting plasma glucose, fasting plasma insulin (FPI), or HbA1C. Women had higher levels of total cholesterol (179.3 ± 38.9 mg/dL vs. 166.3 ± 39.2 mg/dL), HDL (54.9 ± 15.2 mg/dL vs. 49.6 ± 17.3 mg/dL), and LDL (103.4 ± 34.1 mg/dL vs. 91.2 ± 33.2 mg/dL), whereas men had higher levels of triglycerides (128.2 ± 76.3 mg/dL vs. 105.5 ± 56.97 mg/dL) (p < .05, mean ± SD) (Fig. 1). Although participants were advised to not consume alcohol for 24 h before blood collection, the Timeline Followback questionnaire demonstrated that 15% of subjects reported consuming some alcohol on the day before the visit. The median amount of alcohol consumed was 49 g. The Timeline Followback is a self-report of the past 30 days of alcohol consumption and it does not provide information on the time of day when alcohol was consumed.
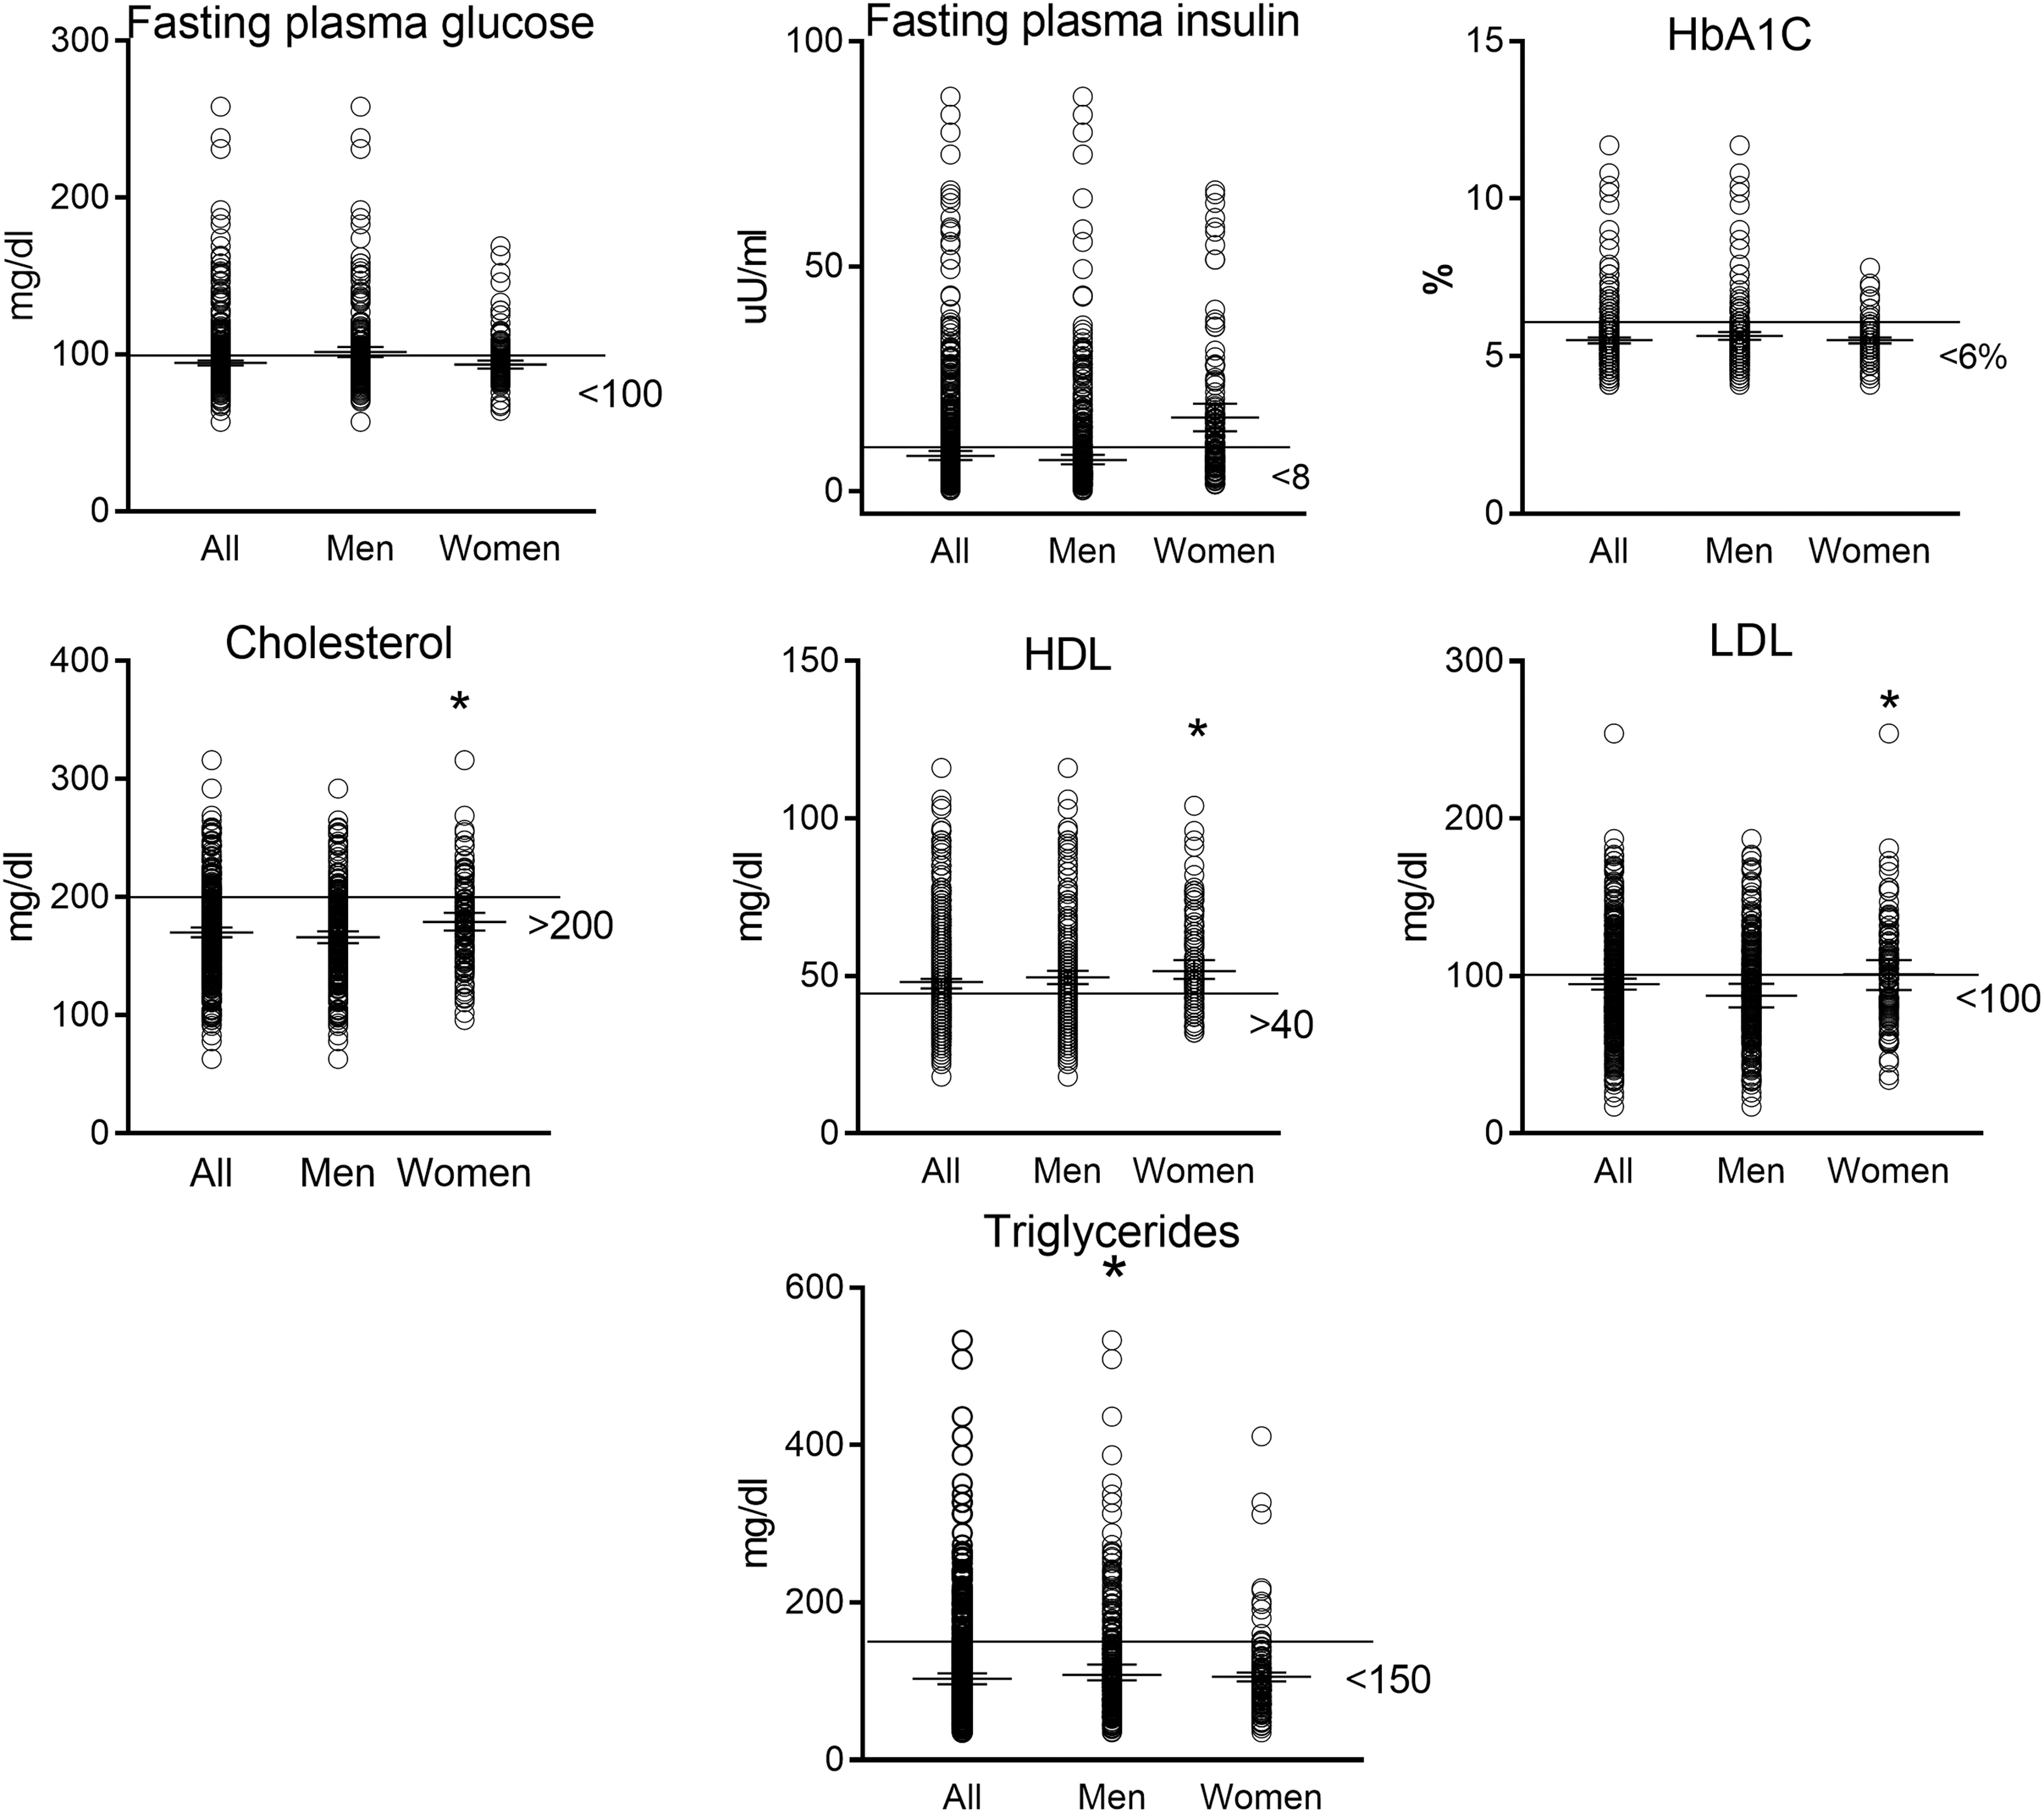
Mean with 95% confidence interval with minimum and maximum values for blood metabolic measures in the NOAH cohort. *Significant difference between men and women (p < .05). The line represents the normal cutoff points for the respective measures. NOAH, New Orleans Alcohol Use in HIV.
Using a cut point of ≥1.9 for HOMA-IR, 50.2% of participants were insulin resistant, 57.5% among women and 47.3% among men. The overall prevalence of metabolic syndrome was 36.4%, 43.9% among women and 33.1% among men (Fig. 2).
Association of alcohol use with IR
Bivariate linear regression was used to determine associations between AUDIT-C and outcome measures of IR. FPI was negatively associated with AUDIT-C overall and among men (p < .05) (Fig. 3A). There were no significant associations of fasting plasma glucose or triglycerides with AUDIT-C (Fig. 3B, C).
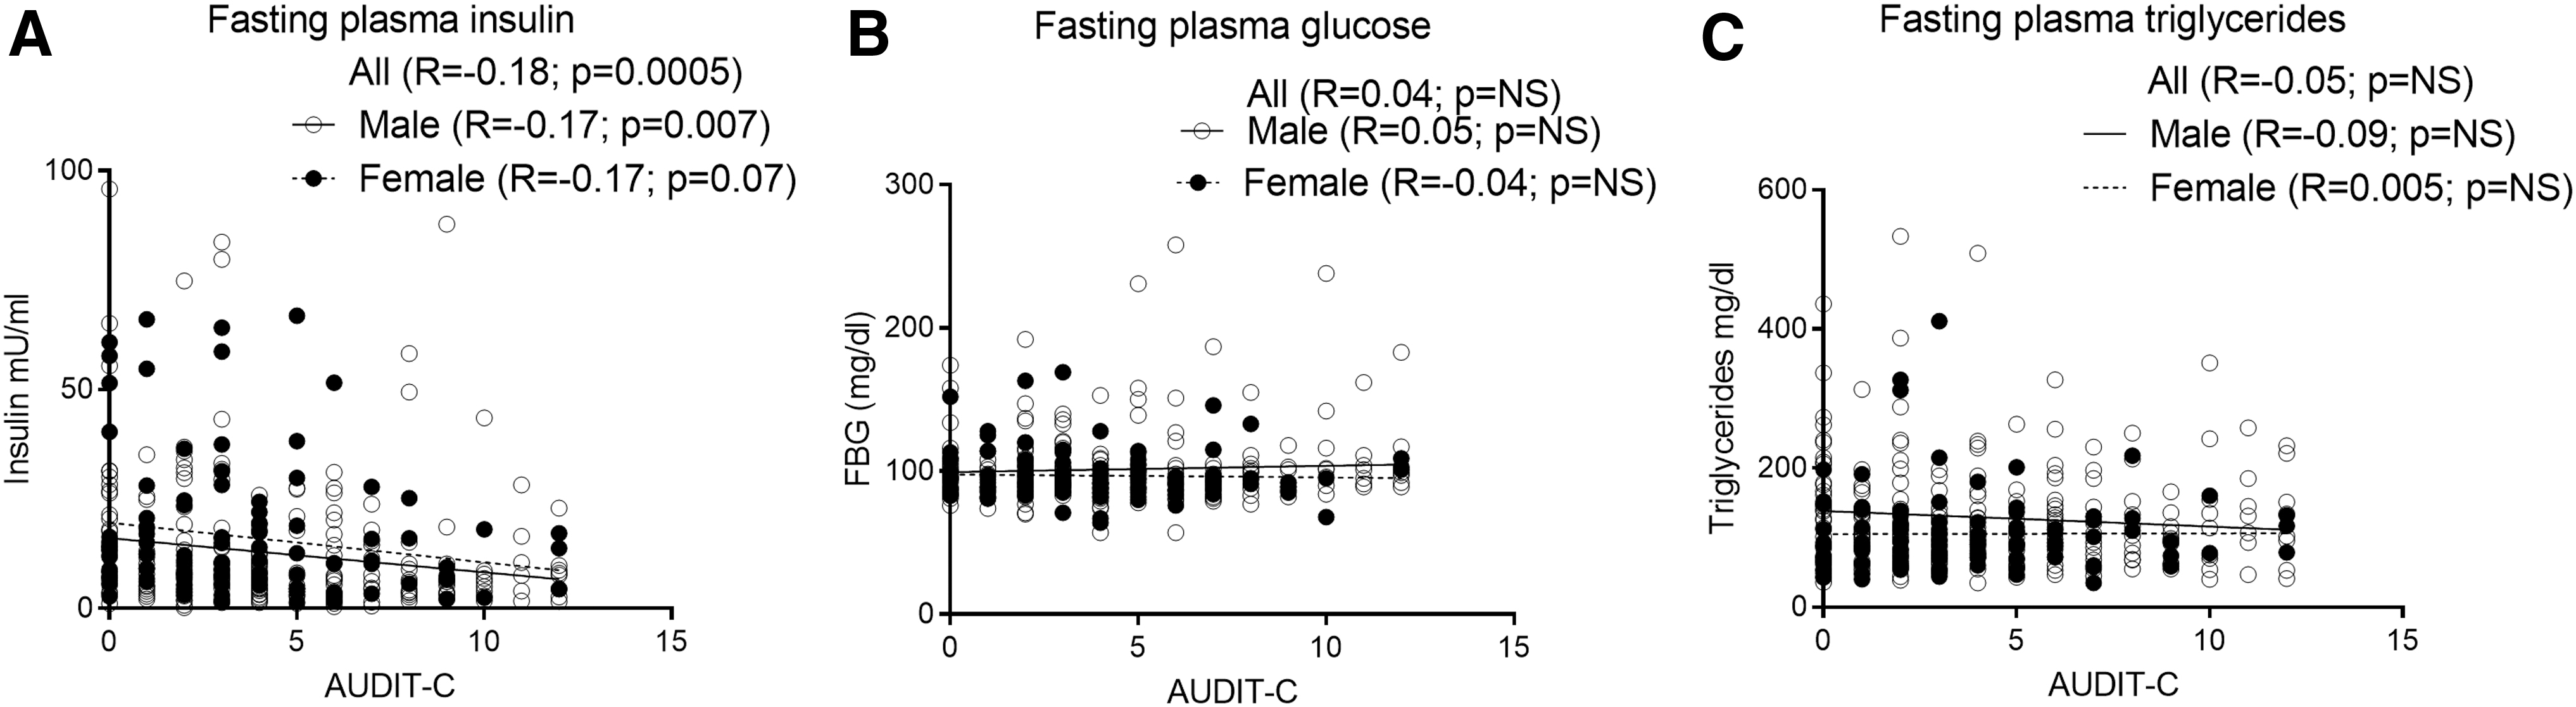
Association of blood metabolic measures to AUDIT-C.
A statistically significant negative association was observed between AUDIT-C and HOMA-IR overall and among men (≥1.9 considered insulin resistant; Fig. 4A). There was no statistically significant association between AUDIT-C and triglyceride index (>8.5 considered insulin resistant; Fig. 4B). A statistically significant positive association was observed between AUDIT-C and McAuley index (<5.8 considered insulin resistant; Fig. 4C) and there was a statistically significant negative association between AUDIT-C and HOMA-β cell function (Fig. 4D).
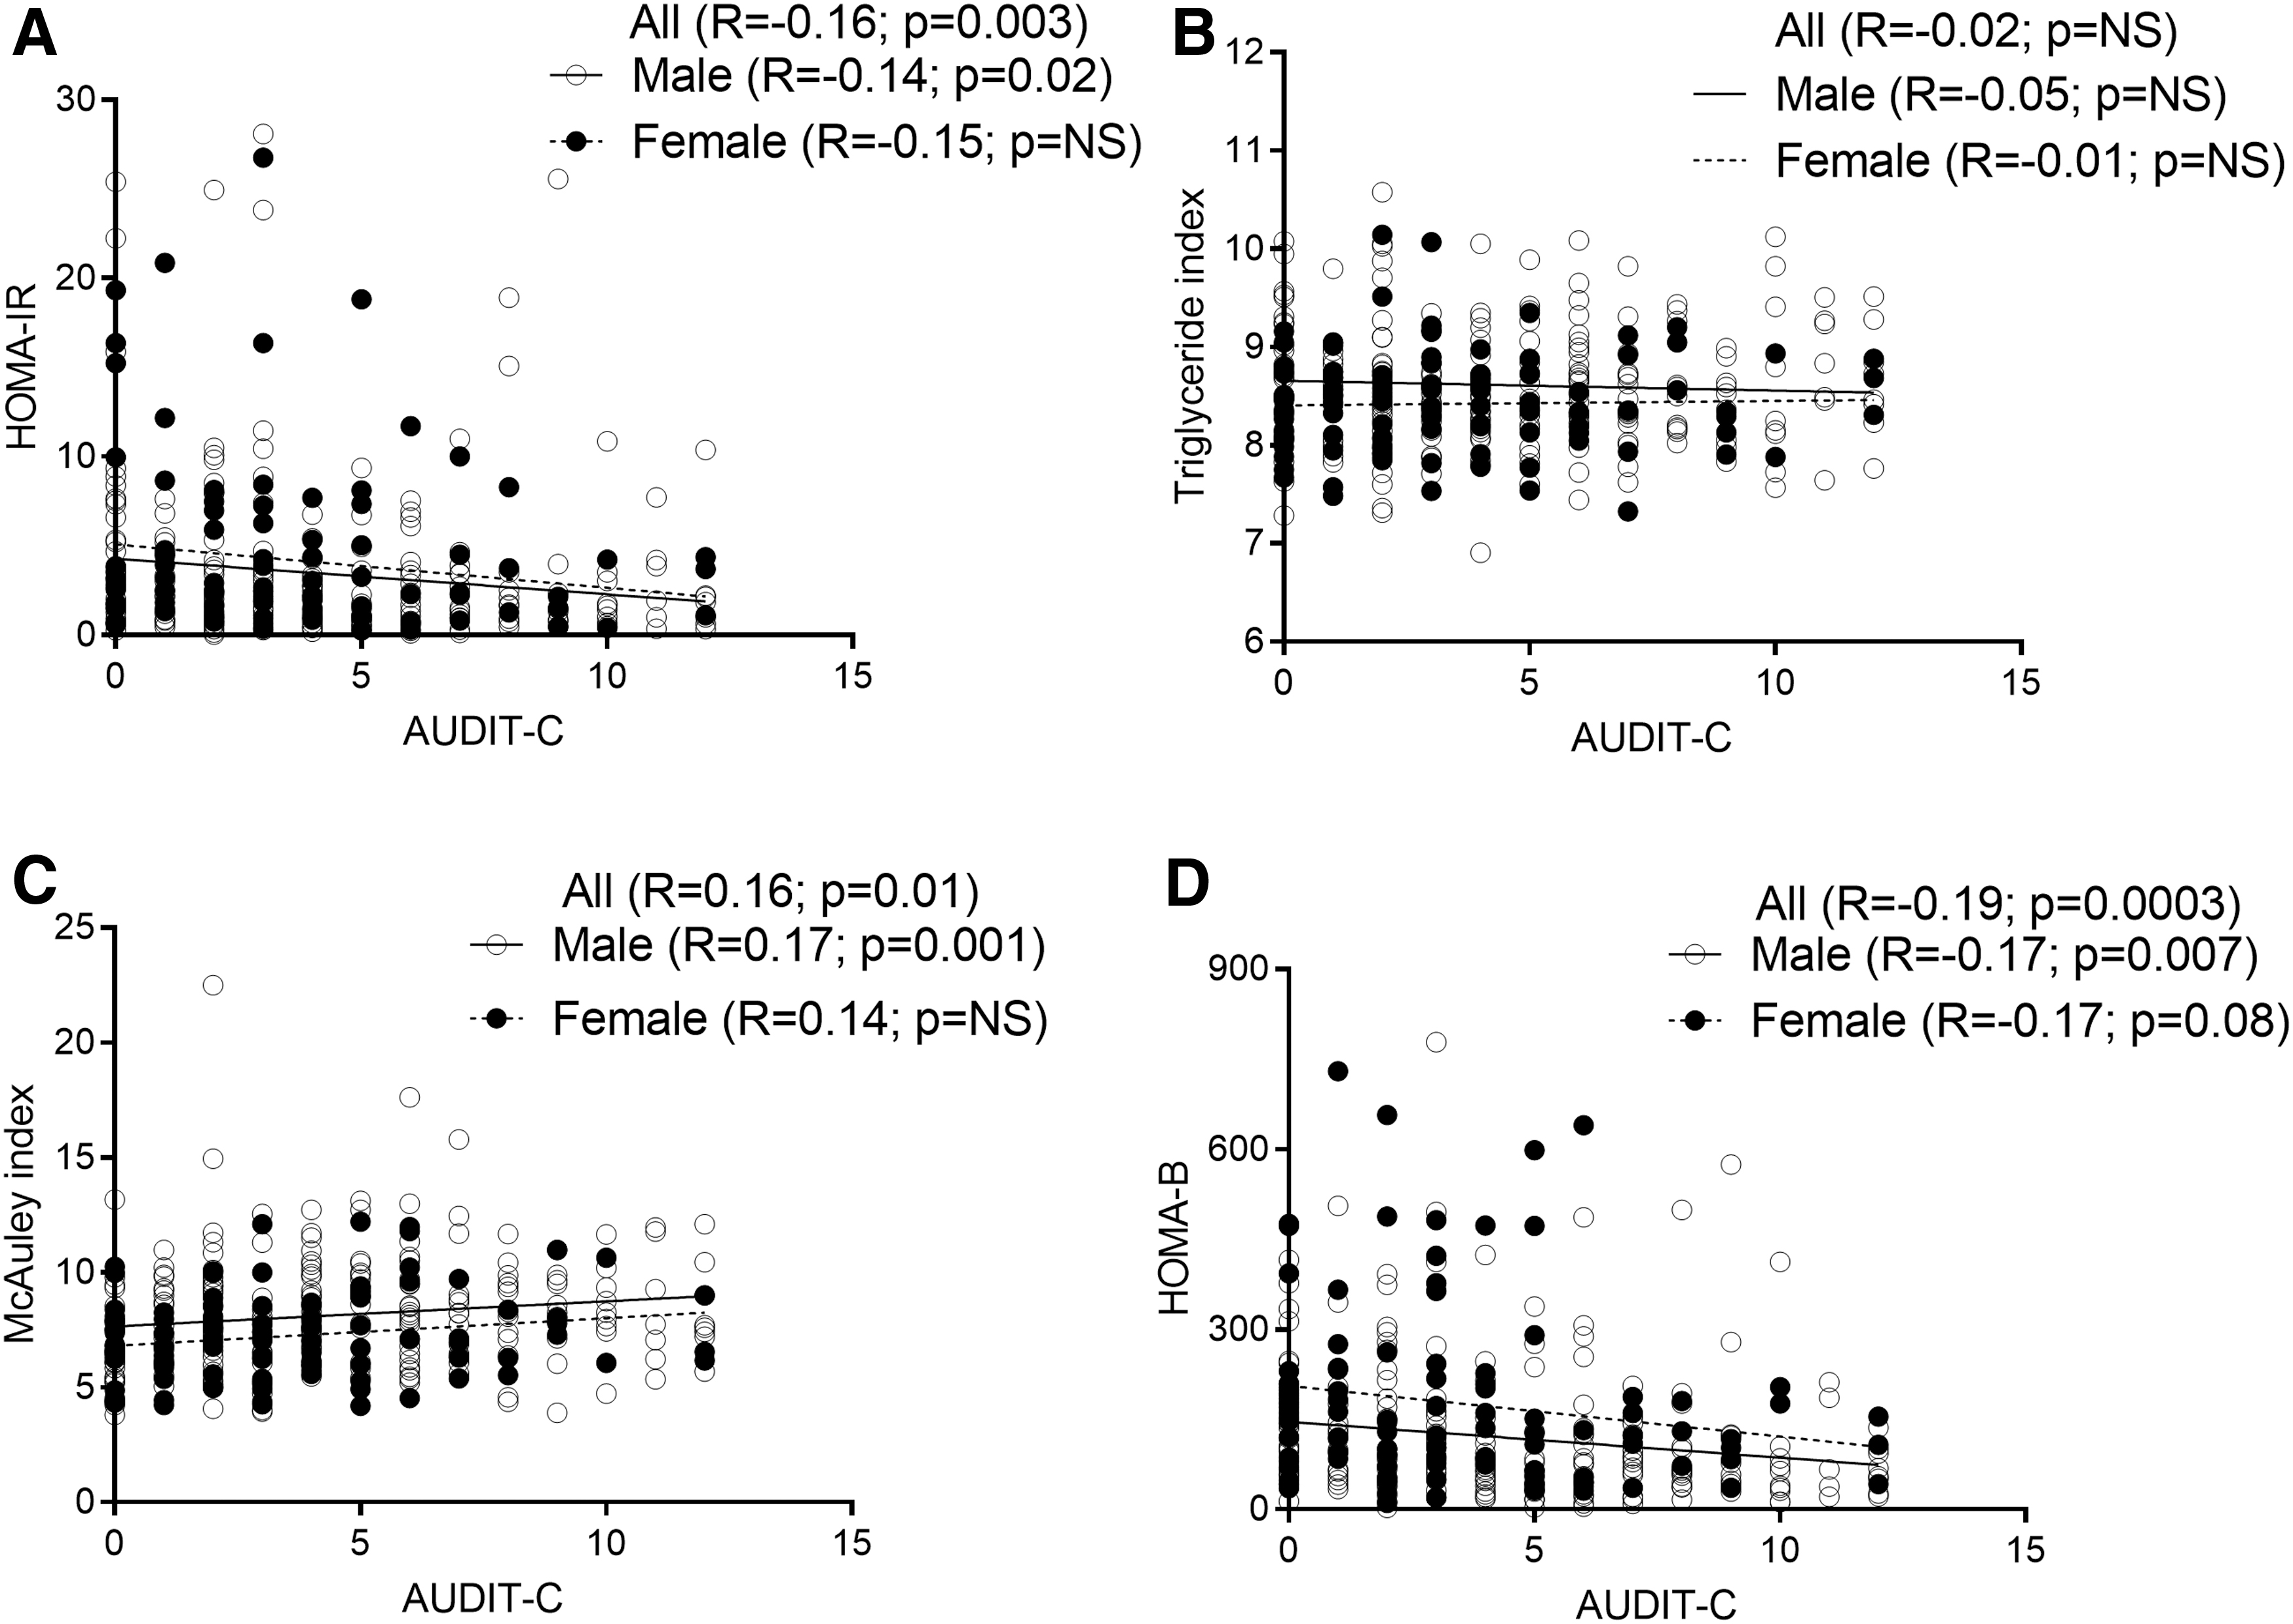
Association of measures of IR to AUDIT-C.
Multivariate regression was used to model continuous measures of alcohol use and outcome measures of IR after adjusting for education, race, BMI, smoking status, viral load, CD4 count, protease inhibitor use, use of statins or metformin, physical activity, and diabetes diagnosis. Physical activity was described as total physical activity (METS minutes) using the International Physical Activity Questionnaire (IPAQ). A statistically significant linear negative association was observed overall and among men between AUDIT-C and log transformed HOMA-IR (>1.9 considered insulin resistant) and among women between PEth and log transformed HOMA-IR. A statistically significant linear positive association was observed overall and among men between AUDIT-C and McAuley index. A statistically significant negative association was observed overall between HOMA-β cell function and AUDIT-C, Peth, and Timeline Followback, and with AUDIT-C among men and with PEth among women. There were no significant associations between triglyceride index and measures of alcohol use (Table 2). There were no significant associations of age and alcohol use on any measures of IR.
Linear Regression Beta Coefficients of Measures of Insulin Resistance by Alcohol Use Measures Among Men and Women in the New Orleans Alcohol and HIV Study
All models were adjusted by education, race, BMI, smoking status, viral load, CD4 count, protease inhibitor use, and use of statins or metformin, physical activity, and diabetes diagnosis.
Bold values indicate that the beta coefficients are statistically significant.
AUDIT, Alcohol Use Disorders Identification Test; BMI, body mass index; HOMA-IR, homeostatic model assessment—insulin resistance; HOMA-β, homoeostatic model assessment of beta cell function; PEth, phosphatidylethanol.
Categorical variables of alcohol use and dichotomous outcomes of metabolic syndrome and IR were used to determine association of alcohol use and IR. Lifetime drinking history was associated with increased odds of metabolic syndrome. AUDIT-C and PEth were associated with decreased odds of McAuley index overall and among men. There was no statistically significant association of alcohol use and HOMA-IR or triglyceride index (Table 3).
Adjusted Odds Ratios for the Association of Insulin Resistance and Measures of Alcohol Use
Insulin resistance measured by HOMA-IR, triglycerides index, and McAuley index among men and women in the NOAH Study. All models were adjusted by education, race, BMI, smoking status, viral load, CD4 count, protease inhibitor use, use of statins or metformin, physical activity, and diabetes diagnosis.
Bold values represent higher or lower odds ratio that are statistically significant.
NOAH, New Orleans Alcohol Use in HIV.
Discussion
This study investigated the association of alcohol use and measures of IR in a prospective longitudinal cohort of in-care PLWH. Unhealthy alcohol use was determined using AUDIT-C as the primary predictor, together with Timeline Followback, Peth, and lifetime drinking history. In this cross-sectional analysis of in-care virally controlled ART-adherent PLWH, there was a significant negative association of HOMA-β cell function with alcohol use. There was a twofold increased risk of developing metabolic syndrome with increased lifetime alcohol use. HOMA-IR and McAuley index were negatively associated with AUDIT-C. However, an association of lifetime alcohol use with IR was not evident.
HOMA of β cell function and IR is widely used and is calculated from basal glucose and insulin values. 48,49 Although hyperinsulinemic-euglycemic or hyperglycemic clamp are the “gold standards” to better assess IR, hepatic glucose output and pancreatic β cell function, measures of HOMA, euglycemic clamp, and Bergman's minimal modeling show strong positive associations. 50,51 HOMA modeling is a physiologically based structural model and is based on the theory that basal glucose and insulin interactions are largely determined by a simple feedback loop, adjusted to population norms. 49
Using the HOMA model, the results indicate that pancreatic β cell function is negatively associated with recent alcohol use. These data suggest that alcohol use among PLWH may impair endocrine pancreatic function. These findings agree with our published data from SIV-infected macaques demonstrating that CBA administration significantly reduced plasma insulin and c-peptide in response to a glucose challenge. CBA also decreased the kinematic measures of glucose-insulin dynamics, disposition index, and acute insulin response to glucose, irrespective of ART treatment. 39 The ART regimen included daily subcutaneous injections of 20 mg/kg of tenofovir ( 9-[R-2-(phosphonomethoxy) propyl] adenine, PMPA) and 30 mg/kg of emtricitabine (FTC), initiated at viral set point (2.5 months post-SIV infection) and continued for 8.5 months post-SIV infection. This regimen effectively suppress viral load in both control and CBA-administered macaques and have no renal or hepatic toxicity. 66
We subsequently demonstrated that despite euglycemia and normal lipid levels, CBA and ART differentially regulated peripheral insulin-sensitive tissues to promote metabolic dysregulation. 47 Although the current cross-sectional analysis of the NOAH Study does not indicate overt alcohol-mediated changes in insulin sensitivity, whether there are molecular or cellular alterations in peripheral insulin-sensitive tissues or whole-body glucose insulin dynamics warrants investigation.
More than 57% of the study cohort had a BMI >25 (overweight or obese), 36% met criteria for metabolic syndrome and about 50% had a HOMA-IR >1.9. However, blood levels of triglycerides, cholesterol, HDL, and LDL were in the normal range. Despite the increased proportion of participants with BMI >25, and contrary to our expectations, 77% of participants had normal triglyceride levels. This was also reflected in IR measures using triglycerides as a variable, in which a lower proportion of the cohort met criteria for IR. Studies indicate that HIV infection increases triglyceride levels, 67 –69 but studies also indicate that certain ART drugs can counter these effects and lower triglyceride levels. 70,71 Whether controlled management of HIV and associated comorbidities of the in-care cohort, ART drugs used, and specific cohort characteristics contribute to lack of alterations in blood metabolic parameters must be considered.
When triglyceride levels are categorized as below normal (<50 mg/dL), normal (50–150 mg/dL), and above normal (>150 mg/dL), there was a significant difference between the groups for HOMA-IR and triglyceride index (Supplementary Fig. S1). The percentage of participants with a HOMA-IR >1.9 was 19% in the below normal, 45% in the normal, and 66% in the above normal groups, respectively, suggesting that triglyceride levels potentially also influence HOMA-IR. Interestingly, only 11% of the participants met criteria for IR using the published triglyceride index cutoff values. 63,72 Whether cutoffs for measures of IR should be adjusted for PLWH and persons with alcohol use disorder is a focus of current investigations by our group.
Contrary to our hypothesis, IR was negatively associated with alcohol use when using AUDIT-C or PEth as alcohol measures. Both measures reflect recent alcohol use. Furthermore, there was no association of IR with lifetime drinking history. Reports on alcohol use and IR are inconsistent. Moderate alcohol consumption is reported to have a negative association with IR, 19 –24 whereas many studies report increased IR with unhealthy alcohol use. 73 –77
However, as discussed earlier, in our study, HOMA-β cell function was negatively associated with alcohol use. This observation is counterintuitive, since fasting plasma glucose was not associated with AUDIT-C, and FPI was negatively associated with AUDIT-C. One potential explanation is that the alcohol-mediated decrease in endocrine pancreatic function may be compensated by increased insulin sensitivity in peripheral tissues. However, reports in the literature do not support alcohol-mediated sensitization to insulin. 37 To better understand the changes in endocrine pancreatic function in PLWH with AUD, ongoing studies use oral glucose tolerance tests (OGTTs) to better assess glucose insulin dynamics in this cohort. We hypothesize that this will potentially reveal persons with prediabetes or diabetes despite normal fasting plasma glucose levels. 78,79
One limitation of the study is that this is a cross-sectional analysis that prevents from drawing conclusions of causality and assessment of progression of metabolic dysregulation. Our ongoing longitudinal studies will provide insight of how changes in alcohol use, time on ART, HIV infection, dietary patterns, and body composition influence glucose insulin dynamics and metabolic dysregulation.
In summary, this cross-sectional study did not identify statistically significant positive associations of measures of IR and alcohol use. However, in this cohort of mostly African American ART-adherent virally suppressed PLWH, there was a significant negative association of alcohol use and pancreatic beta cell function as determined by HOMA-β cell function. Ongoing studies will use OGTTs to assess insulin secretory response and effectiveness that we will couple with measures of incretin release. The implications of alcohol use on IR may help formulate recommendations to reduce risk of metabolic comorbidities among PLWH.
Footnotes
Acknowledgments
We thank the subjects willing to participate in the NOAH Study. The authors acknowledge the investigators and research staff affiliated with the LSUHSC Comprehensive Alcohol-HIV/AIDS Research Center for their contributions to the study, including Virginia Garrison, Rebecca Gonzales, Rhonda Martinez, Jasmine Hall, Erin Meyaski, Mary Meyaski-Schluter, Ikenna Nnamani, Oluwaseun Oguntomole, Connie Porretta, Wendemi Sawadogo, Aneisha Simon, and Arnold Zea.
Authors' Contribution
L.S. and P.E.M. conceived of the presented idea. L.S., T.F.F., C.V.S., S.D.P., D.A.W., and P.E.M. interpreted the data. L.S., C.V.S., T.F.F., and M.M.B. performed the analysis. L.S., T.F.F., S.D.P., K.P.T., D.A.W., and P.E.M. wrote and revised the article. C.V.S. and M.M.B. contributed to the revisions. K.P.T., D.A.W., and P.E.M. designed the human study design. D.A.W. was responsible for implementation of the human study design. All authors approved the final article.
Author Disclosure Statement
No competing financial interests exist.
Funding Information
Research reported was supported by the National Institutes of Alcohol Abuse and Alcoholism of the National Institutes of Health under award number P60AA009803 (LSUHSC-NO CARC).
Supplementary Material
Supplementary Figure S1
References
Supplementary Material
Please find the following supplemental material available below.
For Open Access articles published under a Creative Commons License, all supplemental material carries the same license as the article it is associated with.
For non-Open Access articles published, all supplemental material carries a non-exclusive license, and permission requests for re-use of supplemental material or any part of supplemental material shall be sent directly to the copyright owner as specified in the copyright notice associated with the article.