
Abstract
In the era of combination antiretroviral therapy (ART), people living with HIV (PLHIV) still face an increased risk of cardiovascular disease (CVD). Tenofovir alafenamide fumarate (TAF) is superior to its precursor tenofovir disoproxil fumarate (TDF) regarding bone and renal toxicity, but there are concerns about a negative effect on lipid profile. This observational, single-center study investigates the effects on lipid profile and cardiovascular (CVD) risk of the switch from TDF to TAF, in combination with emtricitabine/elvitegravir/cobicistat (FTC/EVG/c), in patients with no exposure to other antiretrovirals. Routine laboratory measurements, somatometric characteristics, and smoking status were analyzed for the assessment of CVD risk changes, using D:A:D and ATP III scores pre- and postswitch. A total of 62 patients with a mean age of 32.9 years were included in this study. Sixty-one patients (98.4%) were men, 38 (61.3%) late presenters, and 39 (62.9%) active smokers. A year after the switch, there was a significant increase in total cholesterol (178 ± 38 to 194 ± 40 mg/dL, p < .001), high-density lipoprotein (45 ± 12 to 48 ± 13 mg/dL, p = .001), and low-density lipoprotein (117 ± 32 to 137 ± 36 mg/dL, p < .001). Mean increase of the 10-year D:A:D score was 1.13% (95% confidence interval, 1.05–1.22, p = .002). Changes were more prominent in nonsmokers. Body mass index and average weight showed an upward trend. Switching from TDF to TAF caused significant changes in lipid profile at 14 months of follow-up, in young, otherwise healthy PLHIV. CVD risk, as measured by D:A:D, showed a statistically significant increase, but more data are needed to determine clinical significance. These results point toward a patient-centered approach when selecting an ART regimen.
Introduction
In the era of combination antiretroviral therapy (ART), people living with HIV (PLHIV) still face an increased risk of cardiovascular disease (CVD). 1,2 Multiple factors are implicated, involving low-grade chronic inflammation, lipid metabolism disturbances, ART effects, and higher prevalence of usual risk factors for CVD, such as smoking. 1 Furthermore, with life expectancy approaching that of the general population, especially in high-income countries, PLHIV face an increased incidence of comorbidities as a result of aging, such as hypertension, dyslipidemia, and diabetes. 3
New antiretroviral agents have a better profile concerning serious side effects when compared with the older ones. However, even in the case of new regimens, there are noteworthy differences regarding their safety profile, such as renal toxicity, dyslipidemia, cardiovascular risk, and bone density. 4 –6 Guidelines for treatment initiation in PLHIV recommend the use of a dual nucleoside analogue reverse transcriptase inhibitor (NRTI) backbone, in combination with an integrase strand transfer inhibitor. 7 Tenofovir disoproxil fumarate (TDF) has been a widely used NRTI, with a high efficacy and a favorable effect on lipid profile, but there are growing concerns regarding renal and bone toxicity issues with long-term use. For this reason, tenofovir alafenamide fumarate (TAF), another prodrug of tenofovir, has been developed. 8 This new tenofovir formulation requires a lower dose to produce the same effect, resulting in reduced impact in renal function and bone mineral density. 8 On the contrary, there are concerns that treatment with TAF could ameliorate the favorable effect of TDF in lipid profile and cardiovascular risk, whereas it has been associated with weight gain. 8 –13
In this study, we assess the changes observed in lipid profile and cardiovascular risk in PLHIV who switched from a TDF to a TAF-containing ART, keeping all other antiretroviral agents the same [emtricitabine (FTC), elvitegravir (EVG), cobicistat]. Participants were treatment naive when started on the TDF-containing regimen, whereas treatment-experienced HIV patients were excluded to avoid confounding.
Methods
Patients and study design
We conducted an observational, single-center study to depict the changes in lipid profile and cardiovascular risk as a result of switching from TDF to TAF-based EVG-cobicistat (c) antiretroviral combination therapy, in PLHIV attending the ambulatory HIV Unit of Attikon University Hospital. Inclusion criteria were (1) HIV diagnosis, (2) antiretroviral treatment with TDF/FTC/EVG/c as first-line ART and retention into therapy for at least 12 months, (3) switch to TAF/FTC/EVG/c, (4) retention to the latter ART regimen for at least 9 months, and (5) signing of informed consent. Patients were excluded if they received treatment with a lipid-lowering compound at any time during the study time period, owing to the effect of this treatment on lipid measurements. However, we conducted a secondary analysis including participants who started lipid-lowering treatment during the study, to avoid selection bias of individuals at high-risk for CVD.
The study was reviewed and approved by the Institutional Review Board (Scientific Committee) and Ethics Committee of General University Hospital “Attikon” (ΕΒΔ355/8-7-2021), and all patients provided signed informed consent to participate.
All data were retrieved from the patients' medical files, being part of their routine clinical and laboratory evaluation. Clinical and laboratory parameters were assessed at three distinct timepoints: before TDF/FTC/EVG/c initiation (Visit 1—V1), before TAF/FTC/EVG/c initiation (Visit 2—V2), and at the last recorded visit while on this ART regimen (Visit 3—V3) (Fig. 1). Clinical data included sex, age, route of infection, evidence of acquired immune-deficiency syndrome (AIDS) at diagnosis, body mass index (BMI), smoking status, and history of cardiovascular comorbidities (diabetes and hypertension). Laboratory data included CD4 count, total cholesterol (TC), low-density lipoprotein cholesterol (LDL-c), high-density lipoprotein cholesterol (HDL-c), triglycerides (TG), and serum creatinine (SCr) levels.
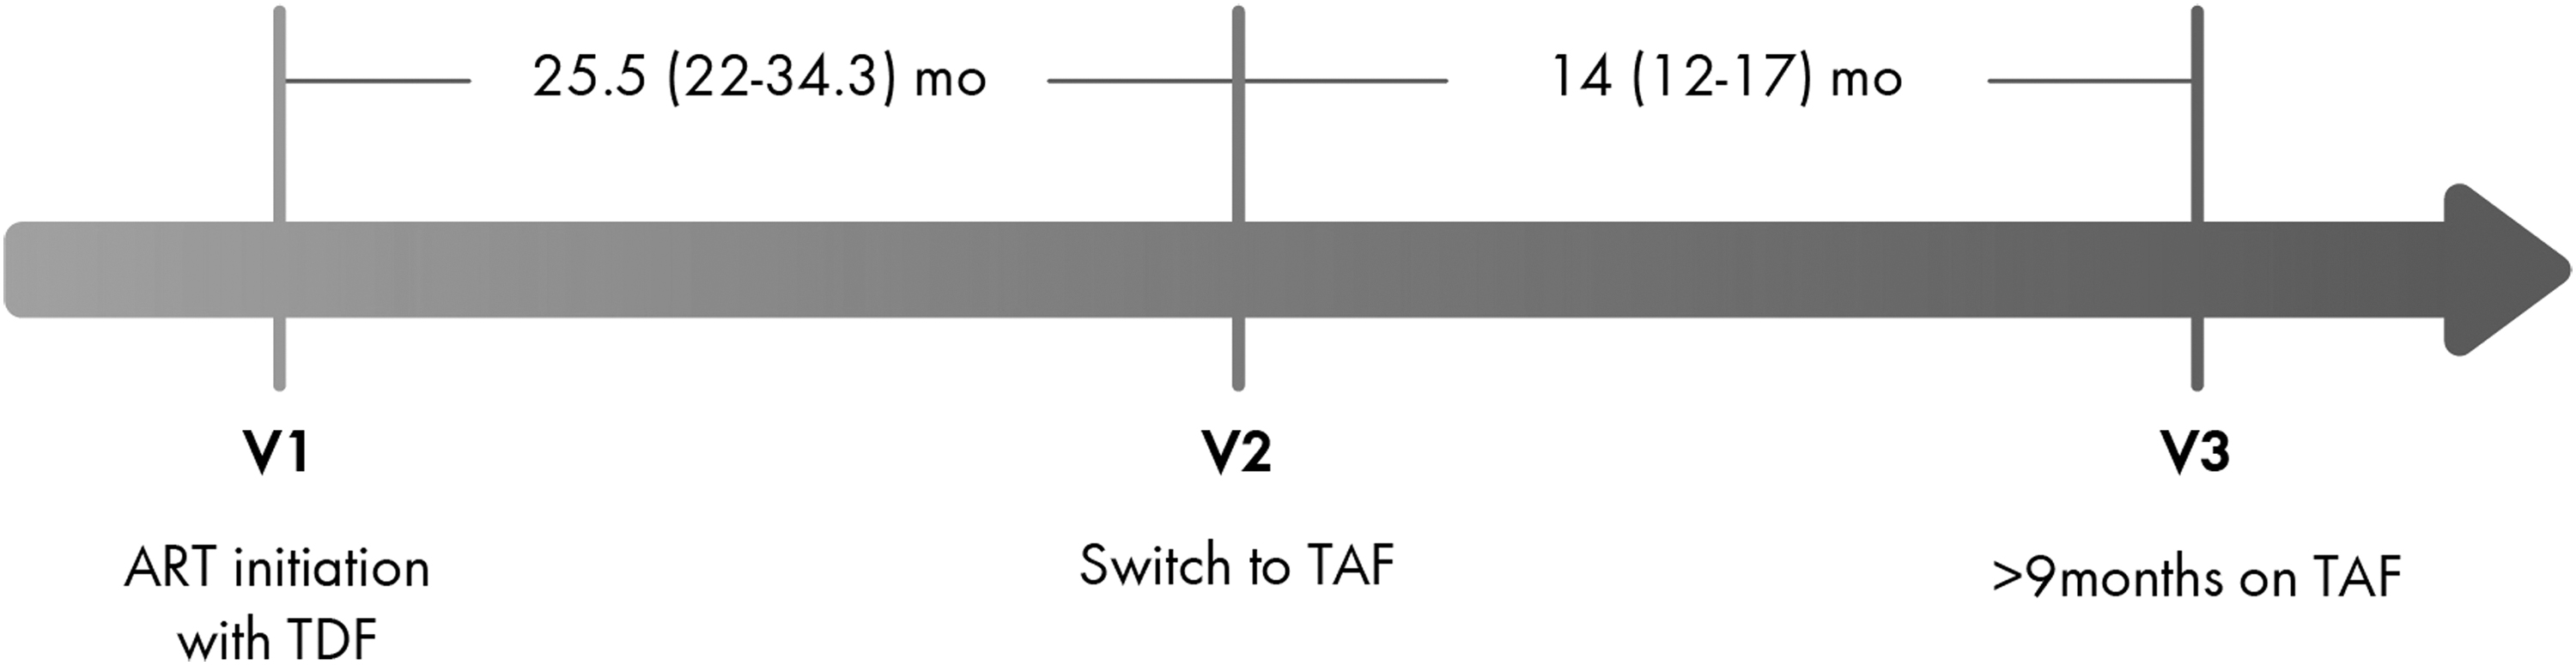
Timepoints of patient visits for clinical and laboratory evaluation of newly diagnosed treatment-naive PLHIV, starting ART at Visit 1. ART, antiretroviral therapy; PLHIV, people living with HIV; TAF, tenofovir alafenamide fumarate; TDF, tenofovir disoproxil fumarate.
We defined dyslipidemia according to the National Cholesterol Education Program Adult Treatment Panel III (NCEP ATP III) classification.
14
For cardiovascular risk estimation we used the 10-year Data Collection on Adverse Events of Anti-HIV Drugs (D:A:D) risk prediction model
15
and the Framingham Adult Treatment Panel III (ATP III).
16
D:A:D score has been specifically developed for CVD risk assessment in PLHIV, also taking into consideration HIV-specific parameters. This score is available in two forms (full and reduced), the full version including exposure to specific antiretroviral drugs (e.g., abacavir). As participants with such an exposure were per protocol excluded from this study, we used the reduced D:A:D score, calculated with an online application requiring the following patient data: age, gender, smoking history, family CVD history, diagnosis of diabetes, CD4 cell count, systolic blood pressure, TC, and HDL (
Estimated glomerular filtration rate (eGFR) was calculated with the Chronic Kidney Disease Epidemiology Collaboration (CKD-EPI) formula as suggested by the European AIDS Clinical Society guidelines and is expressed in milliliters per minute (mL/min). 7 World Health Organization (WHO) standardized BMI categories were used to stratify participants as follows: underweight (<18.5 kg/m2), normal weight (18.5–24.9 kg/m2), overweight (25.0–29.9 kg/m2), and obese (30.0–39.9 kg/m2). 17
Statistical analysis
We performed the statistical analyses with SPSS (IBM SPSS Statistics for Windows, v. 23.0.; IBM Corp., Armonk, NY). Dichotomous variables are presented as percentages, whereas continuous variables are presented as mean (standard deviation) for normal and median (interquartile range) for nonparametric distributions, respectively. McNemar test was used for comparison of nominal variables and Wilcoxon signed-rank test or related samples t-test for continuous variables. Owing to the right skew of CVD risk scores, means with confidence intervals (95% CI) have been calculated by log transformation. Alpha level of statistical significance was set at 0.05.
Results
Patient characteristics
We identified 62 patients who fulfilled the inclusion criteria and were enrolled in our cohort. Three more patients who initiated statin treatment after the switch to TAF but before their follow-up visit were excluded from the primary analysis, but were included in a separate secondary assessment. No participants started lipid-lowering treatment before the switch to TAF. All but one (98.4%) were male patients with a mean age of 32.9 (7.8) years. The most prevalent route of transmission was men who have sex with men (MSM) (n = 54, 87.1%) and only 2 (3.2%) were diagnosed with AIDS. The mean CD4 count at the time of ART initiation was 370 (216) c/μL. Thirty-eight (61.3%) patients were late presenters (CD4 cell count <350/mm3 at diagnosis). Smoking at the time of diagnosis was reported by 39 PLHIV (62.9%), mean BMI was 23.2 (2.9), whereas 8 participants had a familial history of CVD. None of the included patients had a history of hypertension or diabetes mellitus (Table 1). The median time of treatment with a TDF/FTC/EVG/c regimen was 25.5 (22–34.3) months.
Demographics
AIDS, acquired immune-deficiency syndrome; ART, antiretroviral therapy; BMI, body mass index; CKD-EPI, Chronic Kidney Disease Epidemiology Collaboration formula; CVD, cardiovascular disease; EVG, elvitegravir; FTC, emtricitabine; GFR, glomerular filtration rate; IQR, interquartile range; MSM, men who have sex with men; PWID, people who inject drugs; SD, standard deviation; TAF, tenofovir alafenamide fumarate; TDF, tenofovir disoproxil fumarate.
Changes in biological parameters, lipid levels, and CVD risk scores after switching
We compared the lipid levels of the patients before the initiation of TAF/FTC/EVG/c (V2) and at the last recorded visit while on TAF/FTC/EVG/c (V3) (Table 2). The median duration of this interval was 14 (12–17) months. We noticed an increase in CD4 count, 736 (333) versus 822 (317) c/μL (p = .016). BMI increased not significantly from 24.2 (3.3) to 24.7 (3.1) kg/m2 (p = .06). Changes depending on WHO BMI categories are given in Figure 2. Average unadjusted weight increased by 1.8 kg (95% CI, 0.07–3.6) during this time period (p = .04). We also found a slight, although statistically significant decrease in eGFR between V2 and V3, 85.1 (19.3) versus 80.9 (16.1) mL/min (p = .026). In a subsequent univariate analysis, we did not find any correlation between eGFR decline and age, CD4 count, smoking status, BMI, systolic blood pressure, family history of CVD, or treatment duration on each ART regimen (Supplementary Table S2).
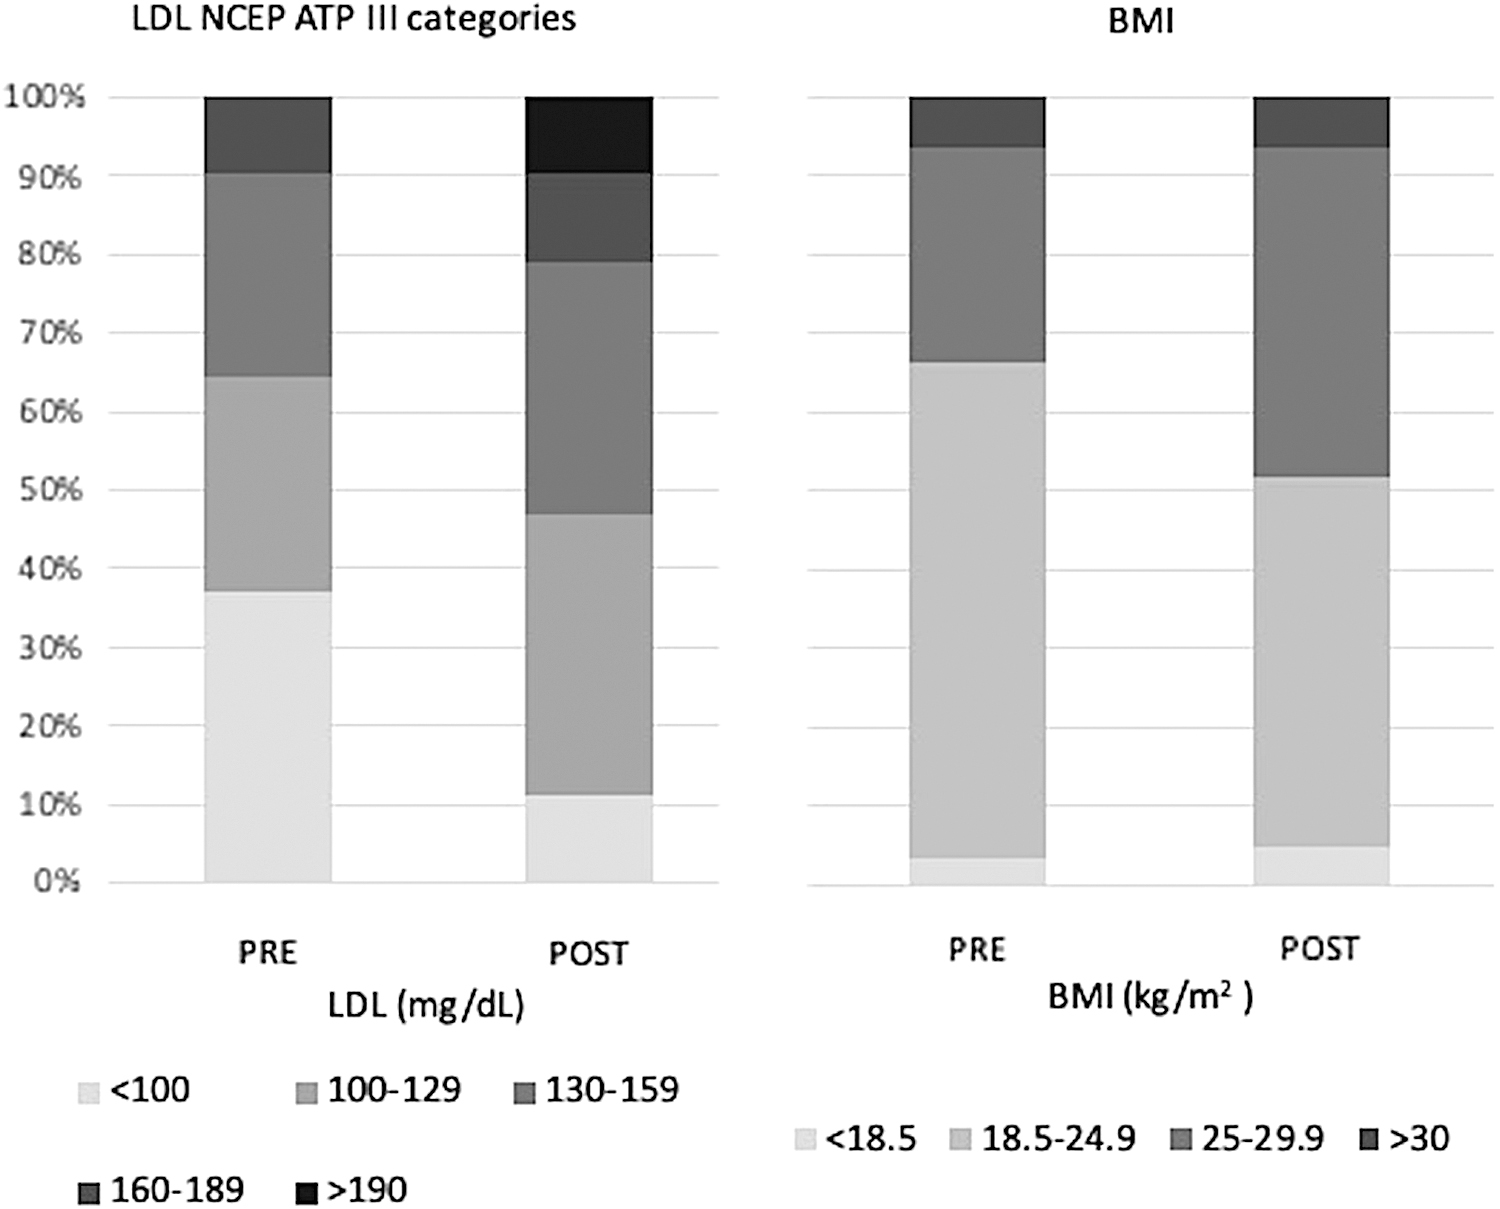
Pre- and postswitch changes in LDL NCEP ATP III categories and BMI WHO classification. LDL, <100: optimal; 100–129: near optimal; 130–159: borderline high; 160–189: high; ≥190: very high. BMI, <18.5: underweight; 18.5–24.9: normal weight; 25–29.9: overweight; ≥30: obesity. BMI, body mass index; LDL, low-density lipoprotein; NCEP ATP III, National Cholesterol Education Program Adult Treatment Panel III; WHO, World Health Organization.
Changes in Laboratory Parameters and Cardiovascular Disease Risk Across V1, V2, and V3
Statistically significant p-values are given in bold.
All values are expressed as mean (SD), except for the CVD risk scores that are expressed as mean (95% CI).
Owing to the right skew of CVD risk scores, mean (95% CI) was calculated by log transformation. Presented values have been back-transformed.
ATP III, Framingham Adult Treatment Panel III; CI, confidence interval; D:A:D, Data Collection on Adverse Events of Anti-HIV Drugs risk prediction model; eGFR, estimated glomerular filtration rate; HDL, high-density lipoprotein; LDL, low-density lipoprotein; TC, total cholesterol; TDF, tenofovir disoproxil fumarate; TG, triglycerides.
Compared with V2, all lipids (TC, HDL-c, LDL-c) increased in V3, with the exception of TG. In more detail, V2–V3 values were as follows: TC: 178 (38) versus 194 (40) (p < .001); HDL-c: 45 (12) versus 48 (13) (p = .001); LDL-c: 117 (32) versus 137 (36) (p < .001); and TG: 138 (72) versus 142 (75) mg/dL (p = .59). The respective mean percentage changes for TC, HDL-c, LDL-c, and TG were 10.9% (95% CI: 5.6–16.2), 11% (95% CI: 5.9–16.1), 20.6% (95 CI: 9.7–31.6), and 9.6% (95% CI: −0.6 to 19.8). TC/HDL-c ratio did not change between V2 and V3, but LDL-c/HDL-c ratio increased by 7.1% (p = .04) (Table 2). LDL-c dyslipidemia (≥130 mg/dL) increased from 35.5% to 53.2%. Changes in distribution among NCEP ATP III categories for LDL-c values are given in Figure 2.
Consequently, 10-year D:A:D and ATP III CVD risk scores were calculated before and after switching to TAF. We noticed a statistically significant increase in 10-year D:A:D score (p = .001) (Fig. 3). ATP III did not change significantly between these timepoints (p = .32) (Table 2).
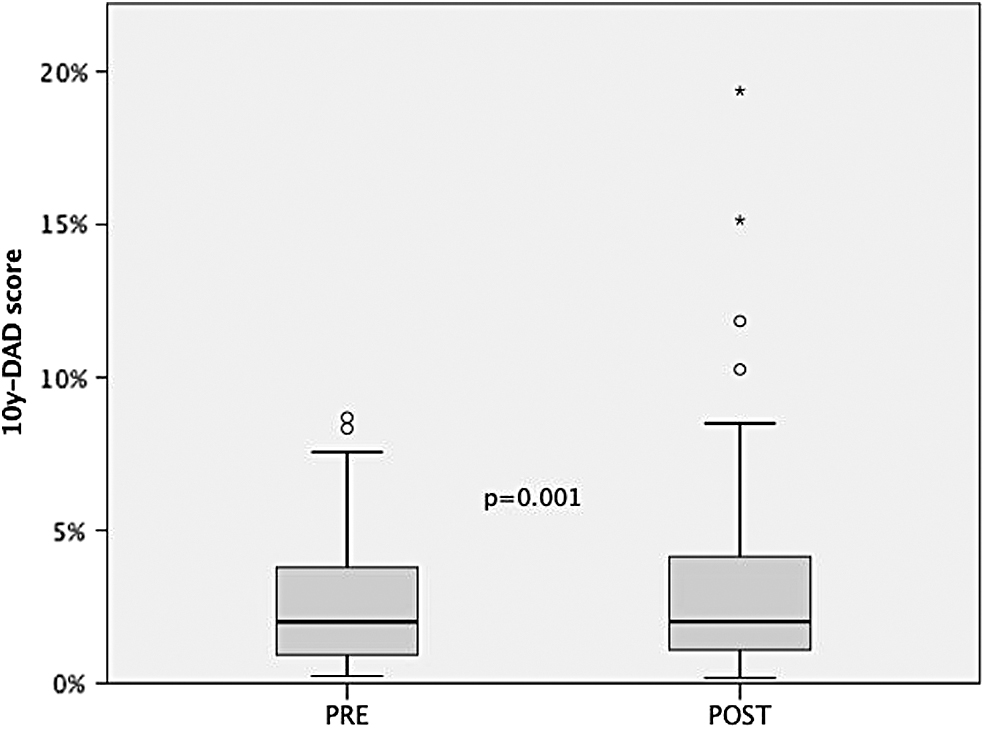
Ten-years D:A:D score before and after switching from TDF to TAF. D:A:D, Data Collection on Adverse Events of Anti-HIV Drugs.
Finally, we performed a secondary analysis to include three patients who started statin treatment after the switch to TAF but before the follow-up visit, and were excluded in our primary analysis. The inclusion of these patients did not influence our primary results (Supplementary Table S1).
Effect of smoking on lipid level and CVD risk changes
Finally, we studied the immunologic, somatometric, and laboratory changes as well as the changes in CVD risk scores separately in nonsmokers (n = 26) and smokers (n = 36) (Table 3). Among nonsmokers, we observed an increase in BMI, 24 (3.4) versus 25 (2.7) (p = .01) and a nonsignificant decrease in eGFR, 81.3 (17.5) versus 75.3 (15.2) (p = .07). Again, all lipids, with the exception of TGs, increased during treatment with TAF/FTC/EVG/c, whereas TC/HDL-c and LDL-c/HDL-c ratios remained stable. Ten-year D:A:D score increased significantly [0.94 (1.1) vs. 1.29 (1.36), p < .001] but not ATP III score [0.5 (0.5) vs. 1.0 (0.5), p = .07].
Differences in Cardiovascular Disease Risk Factors Between V2 (Preswitch) and V3 (Postswitch) in Smokers and Nonsmokers
Statistically significant values (p < .05) are given in bold.
All values are expressed as mean (SD), except for the CVD risk scores that are expressed in median (IQR).
In the smokers' subgroup, BMI and eGFR changes were nonsignificant (p = .55 and .15, respectively), although showing similar trends with the total cohort and with the nonsmoker's subgroup. All lipids increased significantly between the two visits, except for the TGs. As observed in nonsmokers, TC/HDL-c and LDL-c/HDL-c ratios did not differ between V2 and V3. The change of CVD risk scores between the two visits was not statistically significant in smokers.
Statin treatment initiation
Revising the patients' medicine records we identified 12 (19.4%) individuals in our cohort that started treatment with a lipid-lowering agent the year following Visit 3. Statin treatment was initiated upon physician's decision and in accordance to the local guidelines. The mean age of these patients was 40.3 (5.5) years, eight were current smokers and two previous smokers.
Discussion
According to existing literature, it is widely accepted that switching from TDF to TAF annuls the favorable effect of TDF on lipid profile, causing an increase in TC, HDL, LDL, and TG levels. 10 –12,18 However, the clinical significance of these changes and their impact on cardiovascular risk is still debated. 19 –21
This study investigates the changes in lipid profile and CVD risk scores after switching from a TDF to a TAF-containing ART. We included only patients with well-controlled HIV infection, who were initially treated with TDF/FTC/EVG/c, and the only modification in their ART regiment was the switching from TDF to TAF. All lipids, except TGs, increased significantly between pre- and postswitching. It is noteworthy that according to NCEP ATP III classification, the proportion of patients with LDL-c dyslipidemia (≥130 mg/dL) was also significantly increased from 35.5% preswitch to 53.2% (p = .035). Similar trends were observed in both smokers and nonsmokers after the treatment switch. Such alterations were not as dominant regarding the TC/HDL-c and LDL-c/HDL-c ratios. We consider this an important finding given the association that has been identified between these biomarkers and carotid artery intima–media thickness. 22 –24
Switching to TAF was followed by a slight, although statistically significant increase in D:A:D, but not in ATP III. D:A:D score has been found to predict more accurately the subclinical atherosclerosis and coronary artery calcium, even in PLHIV with low cardiovascular risk, as those constituting our cohort. 25 –27
Prevalence of smoking among PLHIV is almost twofold of that of the general population in developed countries, and it constitutes the single most important risk factor for CVD development. 28 For this reason, we separately evaluated the impact of switching from TDF to TAF on CVD risk scores according to smoking status. We observed that CVD risk increase was more prominent among nonsmokers, in comparison with the smokers' subgroup. Apparently, in the nonsmokers group the increase in CVD risk is driven by the changes in lipid profile, whereas in the smokers' group, CVD risk is mainly influenced by smoking. In addition, we emphasize the significant impact of smoking in CVD risk even in this cohort of young and otherwise healthy PLHIV, as given in Table 3.
Overweight and obesity are well-known, independent risk factors for CVD and cardiac death. 29 In our cohort, we observed a mild nonsignificant increase in BMI between V2 and V3, from 24.2 to 24.7 kg/m2 (p = .06). Of importance, when patients were stratified according to WHO-standardized BMI categories, we noted a 14.5% increase in overweight individuals (27.4% in V2 vs. 41.9% in V3). Normal weight rate was accordingly reduced, whereas underweight and obesity rates remained almost unchanged. Weight gain is expected during the early stages of ART initiation, as this alleviates the consequences of chronic inflammation in patients' metabolism. However, our patients were already on ART for ∼2 years when their regimen was changed (V2), so it can be hypothesized that changing from TDF to TAF was the main factor for their weight gain. This finding has been confirmed by previous studies focusing on the subject, 30,31 and by a large U.S. cohort that found an average adjusted weight gain of 1.6 kg, at 12 months after switching to TAF. 32
We also noted an unexpected, slight, but statistically significant, drop of eGFR by 5.6%. As our study was not designed to assess the renal function in PLHIV, and our results do not coincide with existing literature, we report this finding with reservation. However, we did not identify any other potential contributing factors to explain the decline, as opposed to the expected improvement, in renal function.
Strengths and limitations
This study has several strengths. First, we included all treatment-naive PLHIV attending our clinic and who started on ART with an TDF/FTC/EVG/c regimen, and subsequently changed to TAF/FTC/EVG/c, as soon as it became available in our hospital. Therefore, we were able to eliminate the confounding from previous exposure to other antiretrovirals, and at the same time limit the treatment switch in only one compound, without changing the other components. Furthermore, lipid levels and other risk factors for CVD were linked to a clinically relevant outcome of CVD risk, assessed both with a score designed specifically for PLHIV (10-year D:A:D score) and with a well-validated score for the general population (ATP III). Finally, our study provides real-life data regarding the potential negative effects on lipid profile for patients using TAF-containing regimens, even after a short-term exposure of ∼60 weeks.
However, this study is not without limitations. The retrospective design and the absence of a control group could introduce biases in our cohort. Moreover, the study cannot determine a causal relationship between TAF exposure and observed changes in lipids, BMI, and CVD risk. The exclusion of individuals who started lipid-lowering treatment during the study period and therefore had a high risk for CVD, could also introduce selection bias. To address this limitation, we performed a secondary analysis including data from the last visit before statin initiation and found that the inclusion of these individuals did not influence the primary results of this study.
As we have shown, ART initiation per se leads to changes in lipids and body weight, but owing to the lack of a control group we cannot conclude whether continuing TDF versus switching to TAF would lead to similar trends. However, we consider the 24-month period between ART initiation and switch to TAF adequate to allow for the elimination of the “return-to-health” effects. In addition, the population of the study consisted mainly of MSM, and as a result women, heterosexual men, and other groups, such as intravenous drug users, are underrepresented in this cohort, thus limiting the generalizability of our results. In addition, the possibility exists that the 60-week interval between the two visits (V2–V3) was not long enough for the assessment of long-term effects of TAF on lipids. As a matter of fact, a meta-analysis by Tao et al found that lipid increases identified at week 48 from TDF to TAF switching were alleviated by week 96. 33 Finally, our cohort is characterized by young age and generally low cardiovascular risk, and may not adequately reflect the effects of the switch in persons with more advanced age and comorbidity burden.
Conclusion
TAF-containing regimens have provided an alternative for PLHIV at risk for impaired renal function and reduced bone density. Nevertheless, in this study we provide data for a negative effect on lipid profile and cardiovascular risk, when compared with TDF-containing regimens. We also document a potential link between TAF and weight gain that needs to be further explored. Taken together, these findings stress the importance of an individualized approach, which takes into account the background and different risk factors of PLHIV, when selecting an ART regimen.
Footnotes
Authors' Contributions
Conception and design: C.D.M., D.K., A.P., and A.A.; acquisition of data: C.D.M., K.P., and K.T.; interpretation of data: C.D.M., K.T., D.K.; drafting the article: C.D.M., K.P., and K.T; revising critically the article for important intellectual content: C.D.M., D.K., A.P. and A.A. All authors approved the final version of the submitted article.
Author Disclosure Statement
No competing financial interests exist.
Funding Information
No funding was received for this article.
Supplementary Material
Supplementary Table S1
Supplementary Table S2
References
Supplementary Material
Please find the following supplemental material available below.
For Open Access articles published under a Creative Commons License, all supplemental material carries the same license as the article it is associated with.
For non-Open Access articles published, all supplemental material carries a non-exclusive license, and permission requests for re-use of supplemental material or any part of supplemental material shall be sent directly to the copyright owner as specified in the copyright notice associated with the article.