
Abstract
Abstract
Introduction:
Phenones and hydroxybenzophenones are widely used as ultraviolet radiation filters, and in the manufacturing of insecticides and pharmaceuticals. Understanding the estrogenic potential of these chemicals is of interest to the U.S. Environmental Protection Agency and other international environmental organizations.
Materials and Methods:
This study sequentially combined complementary in vitro rainbow trout estrogen receptor (rtER) binding and liver slice vitellogenin (Vtg) mRNA induction assays in the context of a defined estrogen receptor-mediated adverse outcome pathway.
Results/Discussion:
Cyclic phenones, branched phenones, and hydroxybenzophenones bound to rtER with relative potency ranging from no affinity to high binding affinity of 0.11%, and many induced Vtg gene expression in rainbow trout (rt) liver slices. In addition, cyclohexylphenylketone, which did not bind rtER binding in cytosol, was biotransformed within liver tissue to a chemical that induced Vtg expression.
Conclusion:
Cyclic phenones, branched phenones, and hydroxybenzophenones were estrogenic in these rt in vitro assays, therefore are potential endocrine disruptors.
Introduction
Regulatory initiatives such as the Registration, Evaluation, Authorization and Restriction of Chemicals (REACH) within the European Union (http://echa.europa.eu/regulations/reach), and those addressed by the Endocrine Disruptor Screening Program (EDSP) within the U.S. Environmental Protection Agency (EPA; www.epa.gov/endocrine-disruption/endocrine-disruptor-screening-program-edsp-overview) have led to increased efforts toward using in vitro assays to evaluate the endocrine disrupting and hazard potential of chemicals. Estrogen receptor (ER) binding assays and ER gene induction assays fall within the group of in vitro assays.
Phenones and hydroxybenzophenones are a suspected endocrine disrupting class of interest to the EPA and other international environmental organizations. 1 For example, benzophenone (diphenyl ketone; DPK) derivatives are widely used as filters to protect skin and hair from ultraviolet (UV) radiation and as starting materials for manufacturing of other chemicals, insecticides, and pharmaceuticals. However, various hydroxylated benzophenone metabolites have shown significant estrogenic activity in mammals and thus have raised concern for potential health effects in humans and fish.1–3 This investigation specifically reports chemical affinity for the rainbow trout estrogen receptor (rtER), and ability to induce liver slice ER-mediated gene expression for representative phenones, hydroxybenzophenones, and phenone-related chemicals.
Our group has reported the advantages of sequentially combining complementary in vitro rtER binding and liver slice vitellogenin (Vtg) mRNA induction assays in the context of a defined ER-mediated adverse outcome pathway (AOP).4–9 Advantages include the following: (1) increased understanding of the outcome of diverse chemical-ER interactions; (2) enhanced interpretation of rtER binding data; and (3) a better understanding of the role of metabolic transformation of chemicals on estrogenic activity. The rtER binding assay provides information for understanding chemical structure determinants of receptor–ligand interactions, the molecular initiating event (MIE) of the ER-mediated AOP. The subsequent verification of ER-mediated Vtg mRNA production in a fish liver slice provides confirmation of downstream biological events. In cases where data from these two assays generate conflicting results, analysis of the exposure chemical's fate during the assay can provide insight into the reason for the conflicting results. Since the liver slices are known to have full metabolic capabilities, the fate of a chemical incubated with a slice maybe different than when incubated in cytosol. 10
This study characterizes the ER binding activity and Vtg induction of a select group of phenones and hydroxybenzophenones. The phenones studied include both cyclic, containing a second saturated or unsaturated ring structure, and branched, containing an alkyl chain (Table 1). The hydroxylated forms of the cyclic phenones compose the hydroxybenzophenone test chemicals. Additional chemicals tested include phenone-related alcohols. These chemicals are the corresponding alcohol version of the nonhydroxylated phenone ketones.
Chemicals Tested
Chemical subgroups are chemical classifications within the ERES
Chemical purity (%) as reported by supplier.
AC, Atlantic Research Chemicals Ltd. (Stratton View Park, Stratton, Bude, United Kingdom, EX23 9NR); ERES, estrogen receptor expert system; NA, not available from supplier; SA, Sigma-Aldrich (St. Louis, MO).
Ultimately, the information obtained from these assays was used to define effects-based chemical categories upon which the ER expert system (ERES) for predicting ER binding potential for large numbers of structurally diverse chemicals was built.6,7 Furthermore, the data from this study were used in conjunction with data from other chemical classes to provide the experimental foundation upon which the prediction of the ERES is based.
The main objectives of the research were to
Materials and Methods
Fish
Immature rainbow trout (rt; Oncorhynchus mykiss), 500–1000 g, Erwin strain, were obtained from the United States Geological Survey Upper Midwest Environmental Science Center (LaCrosse, WI). Fish were acclimated to EPA (Duluth, MN) holding facilities (Lake Superior water, 2 μm filtered, UV light treated, 11°C, pH 7.7, hardness 45 mg/L; 16:8 light:dark photoperiod) and fed trout pellets (Skretting, Inc., Tooele, UT) for at least 2 weeks before use.
Chemicals
Chemical name, acronym, ERES classification, CAS registry number, commercial source, and percent purity of chemicals tested in binding and gene expression assays are provided in Table 1. All reagents were of the highest purity and grade available. Tritiated estradiol ([3H]-E2) was purchased from PerkinElmer (Waltham, MA). Ultima gold scintillation cocktail was purchased from Packard Bioscience Co. (Meriden, CT). Leibowitz-15 (L-15) media, with glutamine and without phenol red, were obtained from Gibco BRL (Grand Island, NY). Ethanol was obtained from Aaper Alcohol and Chemical Co. (Shelbyville, KY). Hydroxyapatite was purchased from Bio-Rad Laboratories (Hercules, CA). All other chemicals and reagents were obtained from Sigma-Aldrich (St. Louis, MO).
Estrogen receptor binding assays
Two competitive binding assays, the rt hepatic cytosolic ER (cyto rtERαβ) and the recombinant rtER (rec rtERα), were conducted to determine the relative binding affinities (RBAs) of chemicals to the rtER. All test chemicals were evaluated in the cyto rtERαβ assay. A subset of chemicals was further tested in rec rtERα.
Trout liver cytosol was prepared in 10 mM Tris, 1.5 mM ethylenediaminetetraacetic acid, 1.0 mM dithiothreitol, and 10% glycerol, pH 7.6 (TEDG), and assays were conducted as previously described.2,11 The assays were optimized by testing chemicals to the maximum concentration of the chemical's solubility in cytosol. Briefly, rtER competitive binding assays were performed using rt liver cytosol likely containing both endogenous α and β ER.11–13 The cytosol total protein concentration was ∼4 mg/mL and likely contained endogenous enzymes. The test chemical's ability to displace [3H]-17-β-estradiol from the ER was measured and compared to displacement by the positive control, unlabeled 17-β-estradiol (E2). Ethanol (maximum 1.6%) was used as a vehicle for all chemicals tested and unlabeled E2. Radiolabeled [3H]-E2 (2 μL) was added to cytosol (253 μL) to a final concentration of 5 nM. Unlabeled competitor chemicals were added (2 μL) to the cytosol [3H]-E2 solution to achieve desired concentrations and final volume of 257 μL. Unlabeled E2 competitor, as positive reference control, was prepared at −10 to −6 log M. During each individual experiment, every chemical was tested in duplicate at a minimum of six concentrations covering 4–6 log intervals. Multiple cyto rtERαβ binding experiments were performed on all test chemicals, except benzhydrol (BADPK) and 4-hydroxybenzophenone (OHDPK). The binding assay solution containing cytosol, [3H]-E2, and competitor chemical or unlabeled E2 was incubated for 20 hours at 4°C.
A subset of the test chemicals, DPK, BADPK, OHDPK, cyclobutylphenylketone (CBP), 2,4-dihydrophenylcyclohexyl ketone (opCPK), and cyclohexylphenylmethanol (CPKOH), was additionally tested in the rec rtERα assay. The rec rt ER was produced by using the rtERα gene to generate a recombinant baculovirus, which was in turn used to infect Sf9 insect cells for the production of ER protein as previously described.11,14–16 The cell lysate containing the expressed rtERα was a gift from Dr. Phillip Hartig, Toxicity Assessment Division, EPA, ORD, NHEERL, Research Triangle Park. The expressed rec rtERα was prepared using the same homogenization and centrifugation steps used for preparation of the trout liver cytosol. A 1:10,000 dilution of this preparation in TEDG was used to determine equilibrium dissociation constant (Kd = 1.33 nM) and maximum binding capacity (Bmax = 1760 fmol/mg protein). The rec rtERα binding assay was performed under very similar conditions as the cyto rtERαβ binding assay, but at a lower total protein concentration of 0.01 mg/mL compared to 4 mg/mL in the cyto rtERαβ assay.
Rainbow trout liver slice Vtg mRNA expression assay
DPK, CBP, CPK, opCPK, CPKOH, 2-hydroxy-4-methoxybenzophenone (HMBP), OHDPK, isopropylphenylketone (IBP), isobutylphenylketone (IVP), tert-butylphenylketone (MPPK), and 2,2,5-trimethyl-1-phenyl-hex-4-en-1-one (TPH) were further tested in the rt liver slice Vtg mRNA expression assay. Liver slice assays were conducted as previously described.4–7 Test chemical stocks in ethanol were diluted to appropriate test concentrations in exposure media composed of phenol red-free L-15 media, 10% fetal bovine serum (FBS), and penicillin (100 U/mL)/streptomycin (100 μg/mL). Slices from one trout were used for each chemical exposure. Slices were incubated in 12-well plates, one slice per well with 1.7 mL of exposure media. Plates were incubated at 11°C for 48 hours. Positive control E2 (−10 to −5 log M; n = 2 replicates per concentration) and ethanol vehicle control (n = 6; concentration 0.054%) were conducted with every chemical exposure. Chemicals were tested over a concentration range of at least 2 log units and up to the limit of solubility. Each test concentration had six replicates.
Slices were processed and expression of Vtg mRNA was measured using quantitative real-time reverse transcription polymerase chain reaction (RT-PCR) technology as previously described.5,8 Primers and probe were designed using Primer Express software (PE Applied Biosystems, Foster City, CA). Probe P1-S22 and primer VTG1 S22 primer set were designed to straddle an exon-exon junction (Table 2). Primers were purchased from Integrated DNA Technologies (Coralville, IA). Primer target specificity was confirmed by gel analysis. Probe was purchased from Biosearch Technologies, Inc. (Novato, CA). Primer set VTG1-S22 was designed to detect a 150 bp sequence of the rt VTG gene sequence and was used for real-time RT-PCR. The RBT-TRG primer set was designed to produce a 601 bp amplicon that encompassed the VTG1-S22 amplicon. In addition, RBT-TRGL contained a T7 promoter sequence. The RBT-TRG primer set was used to produce VTG RNA to be used as standard for the quantitation of VTG in liver total RNA.
Quantitative Real Time-Reverse Transcription Polymerase Chain Reaction Probe and Primer sequences
Media pH and osmolality were monitored using a Radiometer Blood Gas Analyzer ABL800 Flex (Radiometer Medical, Copenhagen, Denmark). Precipitation or chemical insolubility in the slice incubation media was determined by both visual inspection and nephelometry (Nepheloskan Ascent; Thermo Electron Corp., Vantaa, Finland).
Slice viability was determined by measuring leakage of lactate dehydrogenase enzyme (LDH) from the liver slices into the media. Media samples for LDH analysis were removed from the same wells that contained the slice/media used for Vtg analysis. The activity of LDH in the media was measured following the 48-hour incubation and compared with total LDH activity in the slices as previously described.4,17
Gas chromatography-mass spectrometry analyses
DPK and cyclohexylphenylketone (CPK) showed adequate sensitivity, volatility, and thermal stability for GC analysis. For analyte characterization, hexane extracts of samples were analyzed on an Agilent 6890N gas chromatograph connected to either an Agilent 5975 Inert XL or Agilent 5973 mass selective detector (Agilent Technologies, Santa Clara, CA). Electron and chemical ionization experiments were used for qualitative analyses. Selected ion from full scan total ion current (TIC) was used for quantitative analyses. Gas chromatography-mass spectrometry (GC-MS) parameters are listed in Table 3.
Gas Chromatography-Mass Spectrometry Analysis Parameters
MS, mass spectrometer.
Analytical chemistry of DPK and CPK in cytosol
The hexane extraction efficiencies of DPK and CPK were measured in TEDG at a range of concentrations at 25°C (−5.7 to −3 log M [2.5–1000 μM]). Chemical measurements of TEDG hexane extracts were performed by GC-MS as follows: a volume of hexane (257 μL) equal to the final assay volume was added to each tube (two replicates per time point and concentration), vortexed (10 seconds), and centrifuged at 20800 rcf for 12 minutes at 4°C. A 170 μL supernatant aliquot was then transferred to a clean vial and diluted to a highest concentration of 100 μM with hexane if necessary. Chemical stocks used for chemical additions to TEDG spikes were diluted with hexane for calibration standards. An internal standard, p-cresol (IStd; 25 μM final concentration), was added to all samples and chemical standard solutions before analysis by GC-MS. Measured extraction efficiencies of 97.2% ± 0.95% (n = 14) for CPK and 98.5% ± 0.92% (n = 6) for DPK were obtained in TEDG.
Chemical concentrations were measured in binding assay cytosols exposed to DPK and CPK at −4 and −3 log M at 4°C to monitor potential phase I metabolism in the presence of any endogenous cytosolic enzymes. Chemical concentration in cytosol was measured as described for TEDG at time 0 and following the termination of the incubation period at 20 hours. Results for parent chemical are reported in this article. For details on additional chemical forms found in hexane and aqueous fractions analyzed, please see Serrano et al. (article in preparation).
Analytical chemistry of DPK and CPK in slice assay
Extraction efficiencies of DPK and CPK were measured in exposure media at room temperature at the same concentrations used for TEDG buffer as follows: concentrated solutions of chemical in ethanol (1–20 μL) were added to 430 μL slice media and made to 450 μL with additional ethanol, and then combined with 450 μL hexane, vortexed, and centrifuged. Hexane supernatant was subsampled (340 μL), spiked with p-cresol (25 μM) to a final volume of 349 μL, and transferred to glass vials for analysis by GC-MS. Extraction efficiencies for CPK of 100.6% ± 0.25% (n = 14) and DPK of 100.3% ± 1.2% (n = 6) were obtained from slice media.
In a set of plates prepared in parallel to the Vtg/LDH test plates, DPK and CPK concentrations were measured in exposure media in the presence and absence of liver slice tissue as described above for extraction efficiency samples. Both chemicals were tested at −4 log M (100 μM) nominal concentrations. While CPK concentrations were measured throughout the incubation period at 0, 4, 8, 24, and 48 hours, DPK concentration was measured only initially and at the 48-hour test termination point. Duplicate samples were taken at each time point.
Data analyses
All data were plotted or reported as mean ± standard deviation (SD) or mean ± standard error of mean (SEM). GraphPad Prism for Windows (V5.02; GraphPad software, San Diego, CA) was used for statistical analyses and curve plotting (binding and Vtg mRNA studies) as reported by Hornung. 7 RBA in the cyto rtERαβ, and rec rtERα assays, and Vtg mRNA expression in the liver slices were determined as previously described.7,11 Incomplete binding curves were extrapolated to 100% displacement by constraining the bottom of the binding curves to zero, which then provided an extrapolated IC50. RBAs were calculated for each experimental replicate (different cytosols run on different days) by comparing the IC50 of the test chemical to the IC50 of the full E2 binding curve that was run in parallel in the same experiment: RBA% = 100 × (IC50 E2/IC50 test chemical). Calculated RBAs presented are mean and SEM of the three experimental replicates.
Enhanced MSD Chemstation (E-MSDChem for Windows; Rev E.02.01.1177; Agilent Technologies) was used for GC-MS data analysis. Response factors (RFs; ratio of chemical to IStd area responses) were used for quantification. Amounts of DPK and CPK were measured with standards by selected ion quantification from full scan TIC data and RF (m/z 105 for DPK and CPK, and m/z 107 for p-cresol). Limit of detection (LOD) for GC-MS analyses was established as the analyte concentration corresponding to a Signal/Noise ratio method in E-MSDChem of at least 3:1. Lower limits of quantification (LLOQ) were measured at an S/N of at least 10:1 for each chemical. For all assays and analytes tested, a linear correlation (R 2 > 0.999) was obtained between response and concentration over the calibration range selected (0.9–200 μM) using p-cresol as IStd. LLOQ and LOD were 1.1 and 0.3 μM, respectively, for both DPK and CPK.
Results and Discussion
Cyto rtER binding and Vtg expression assays
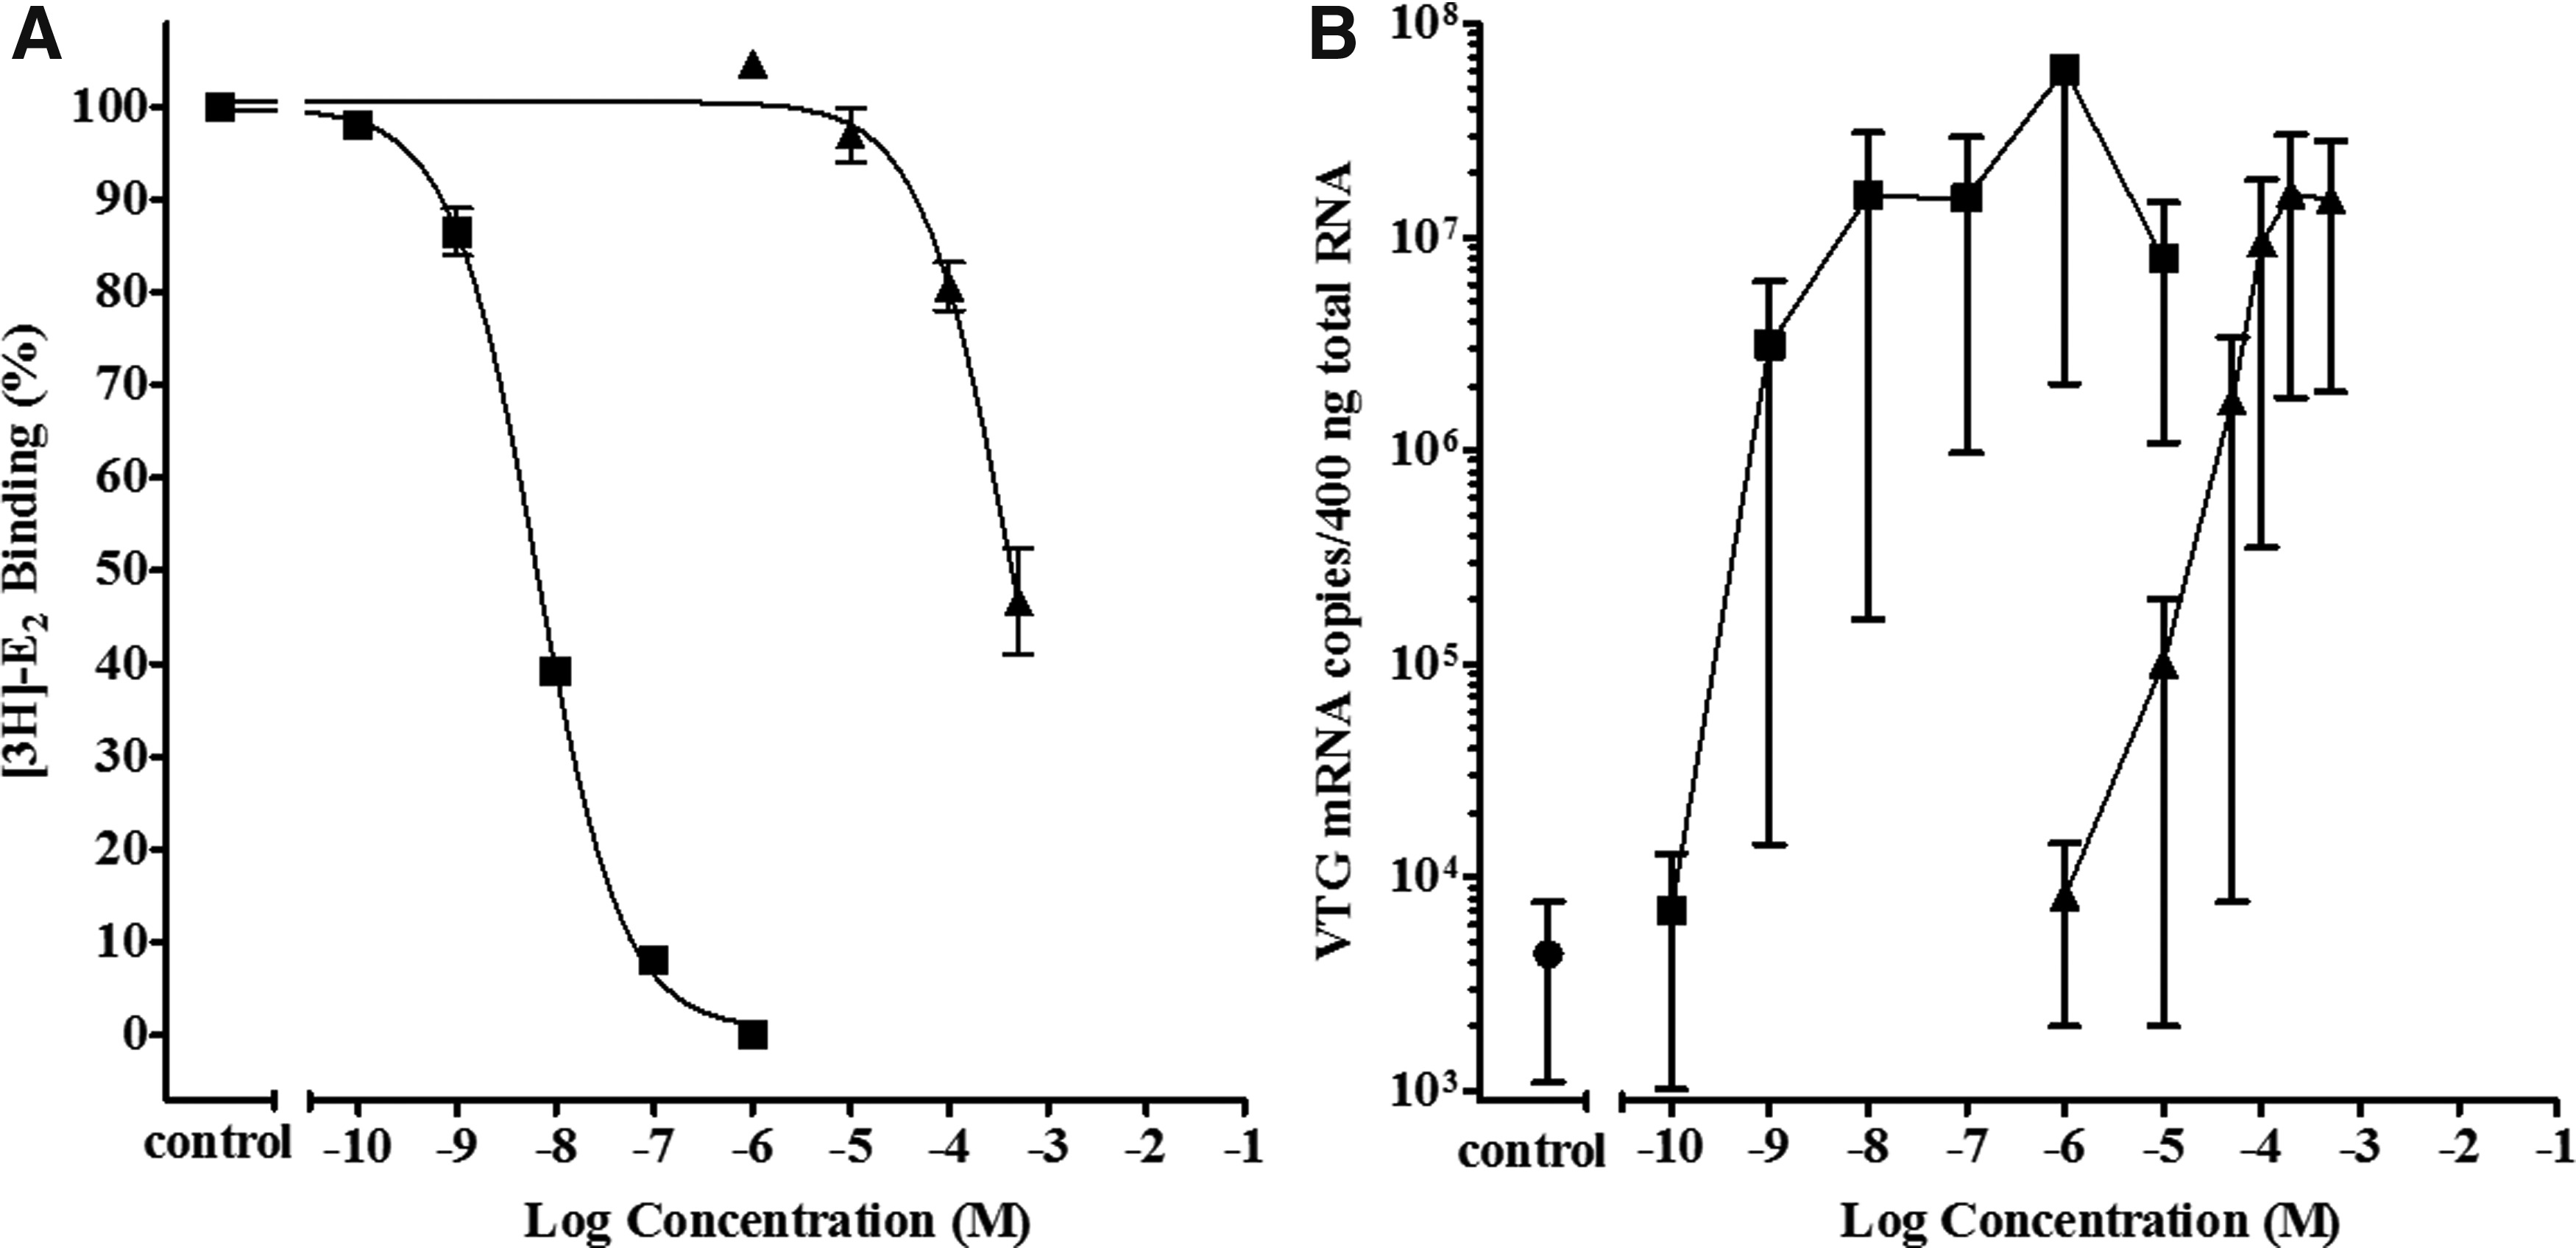
Cyto rtER αβ assay competitive binding curves showing displacement of [3H]-E2 from the rtER by three phenones CBP, DPK, and CPK are presented in Figure 1. Both DPK and CBP displaced >50% of the [3H]-E2 (Fig. 1), resulting in RBAs of 0.00030% and 0.00015%, respectively, relative to E2 (Table 4). In contrast, CPK displaced none of the [3H]-E2 from the rtER and would be classified as a nonbinder following decision criteria in Hornung, 7 if only the ER binding data are considered.
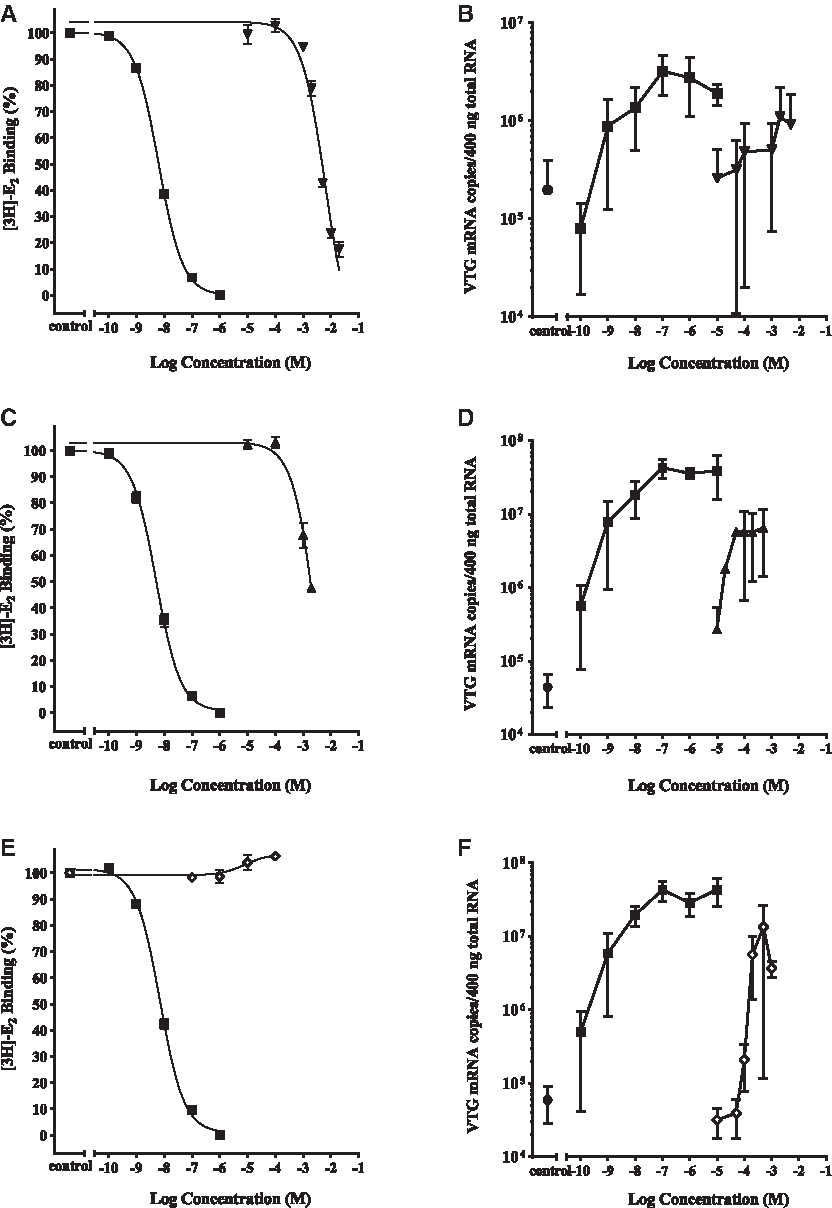
Activity of cyclic phenones CBP, DPK, and CPK in the cyto rtERαβ competitive binding assay and Vtg mRNA induction assay. Competitive binding curves (20 hours, 4°C) for positive control E2 (▪); and
Activity of Test Chemicals in Cytosol and Recombinant Competitive Binding, and Liver Slice Vitellogenin mRNA Expression Assays
Cyto rtER RBA are mean and SEM values for at least two replicate binding experiments, except for OHDPK and BADPK. These two chemicals cyto RBA and all rec rtER RBA are mean values for two technical replicates from one experiment. Vtg activity is the slice Vtg mRNA expression in response to exposure to test chemicals.
nt = not tested.
BADPK, benzhydrol; OHDPK, 4-hydroxybenzophenone; RBA, relative binding affinity; rtER, rainbow trout estrogen receptor; SEM, standard error of mean; Vtg, vitellogenin.
When the apparent rtER binders CBP and DPK were exposed to trout liver slices, both induced Vtg mRNA (Fig. 1). DPK produced a Vtg efficacy similar to maximum E2 response. CBP produced lower than maximum, but significant induction of Vtg expression, before showing signs of slice toxicity at −2.7 and −2.3 log M concentrations (Fig. 2). Despite lack of CPK binding to the rtER observed in the cell-free cyto rtER αβ assay (Fig. 1), metabolically competent liver slices exposed to CPK produced a significant induction of Vtg mRNA nearly equal to the maximum efficacy of E2 (Fig. 1). This gene activation despite lack of binding by parent chemical strongly suggested the biological response was due to a metabolite of CPK binding to rtER and inducing Vtg expression.
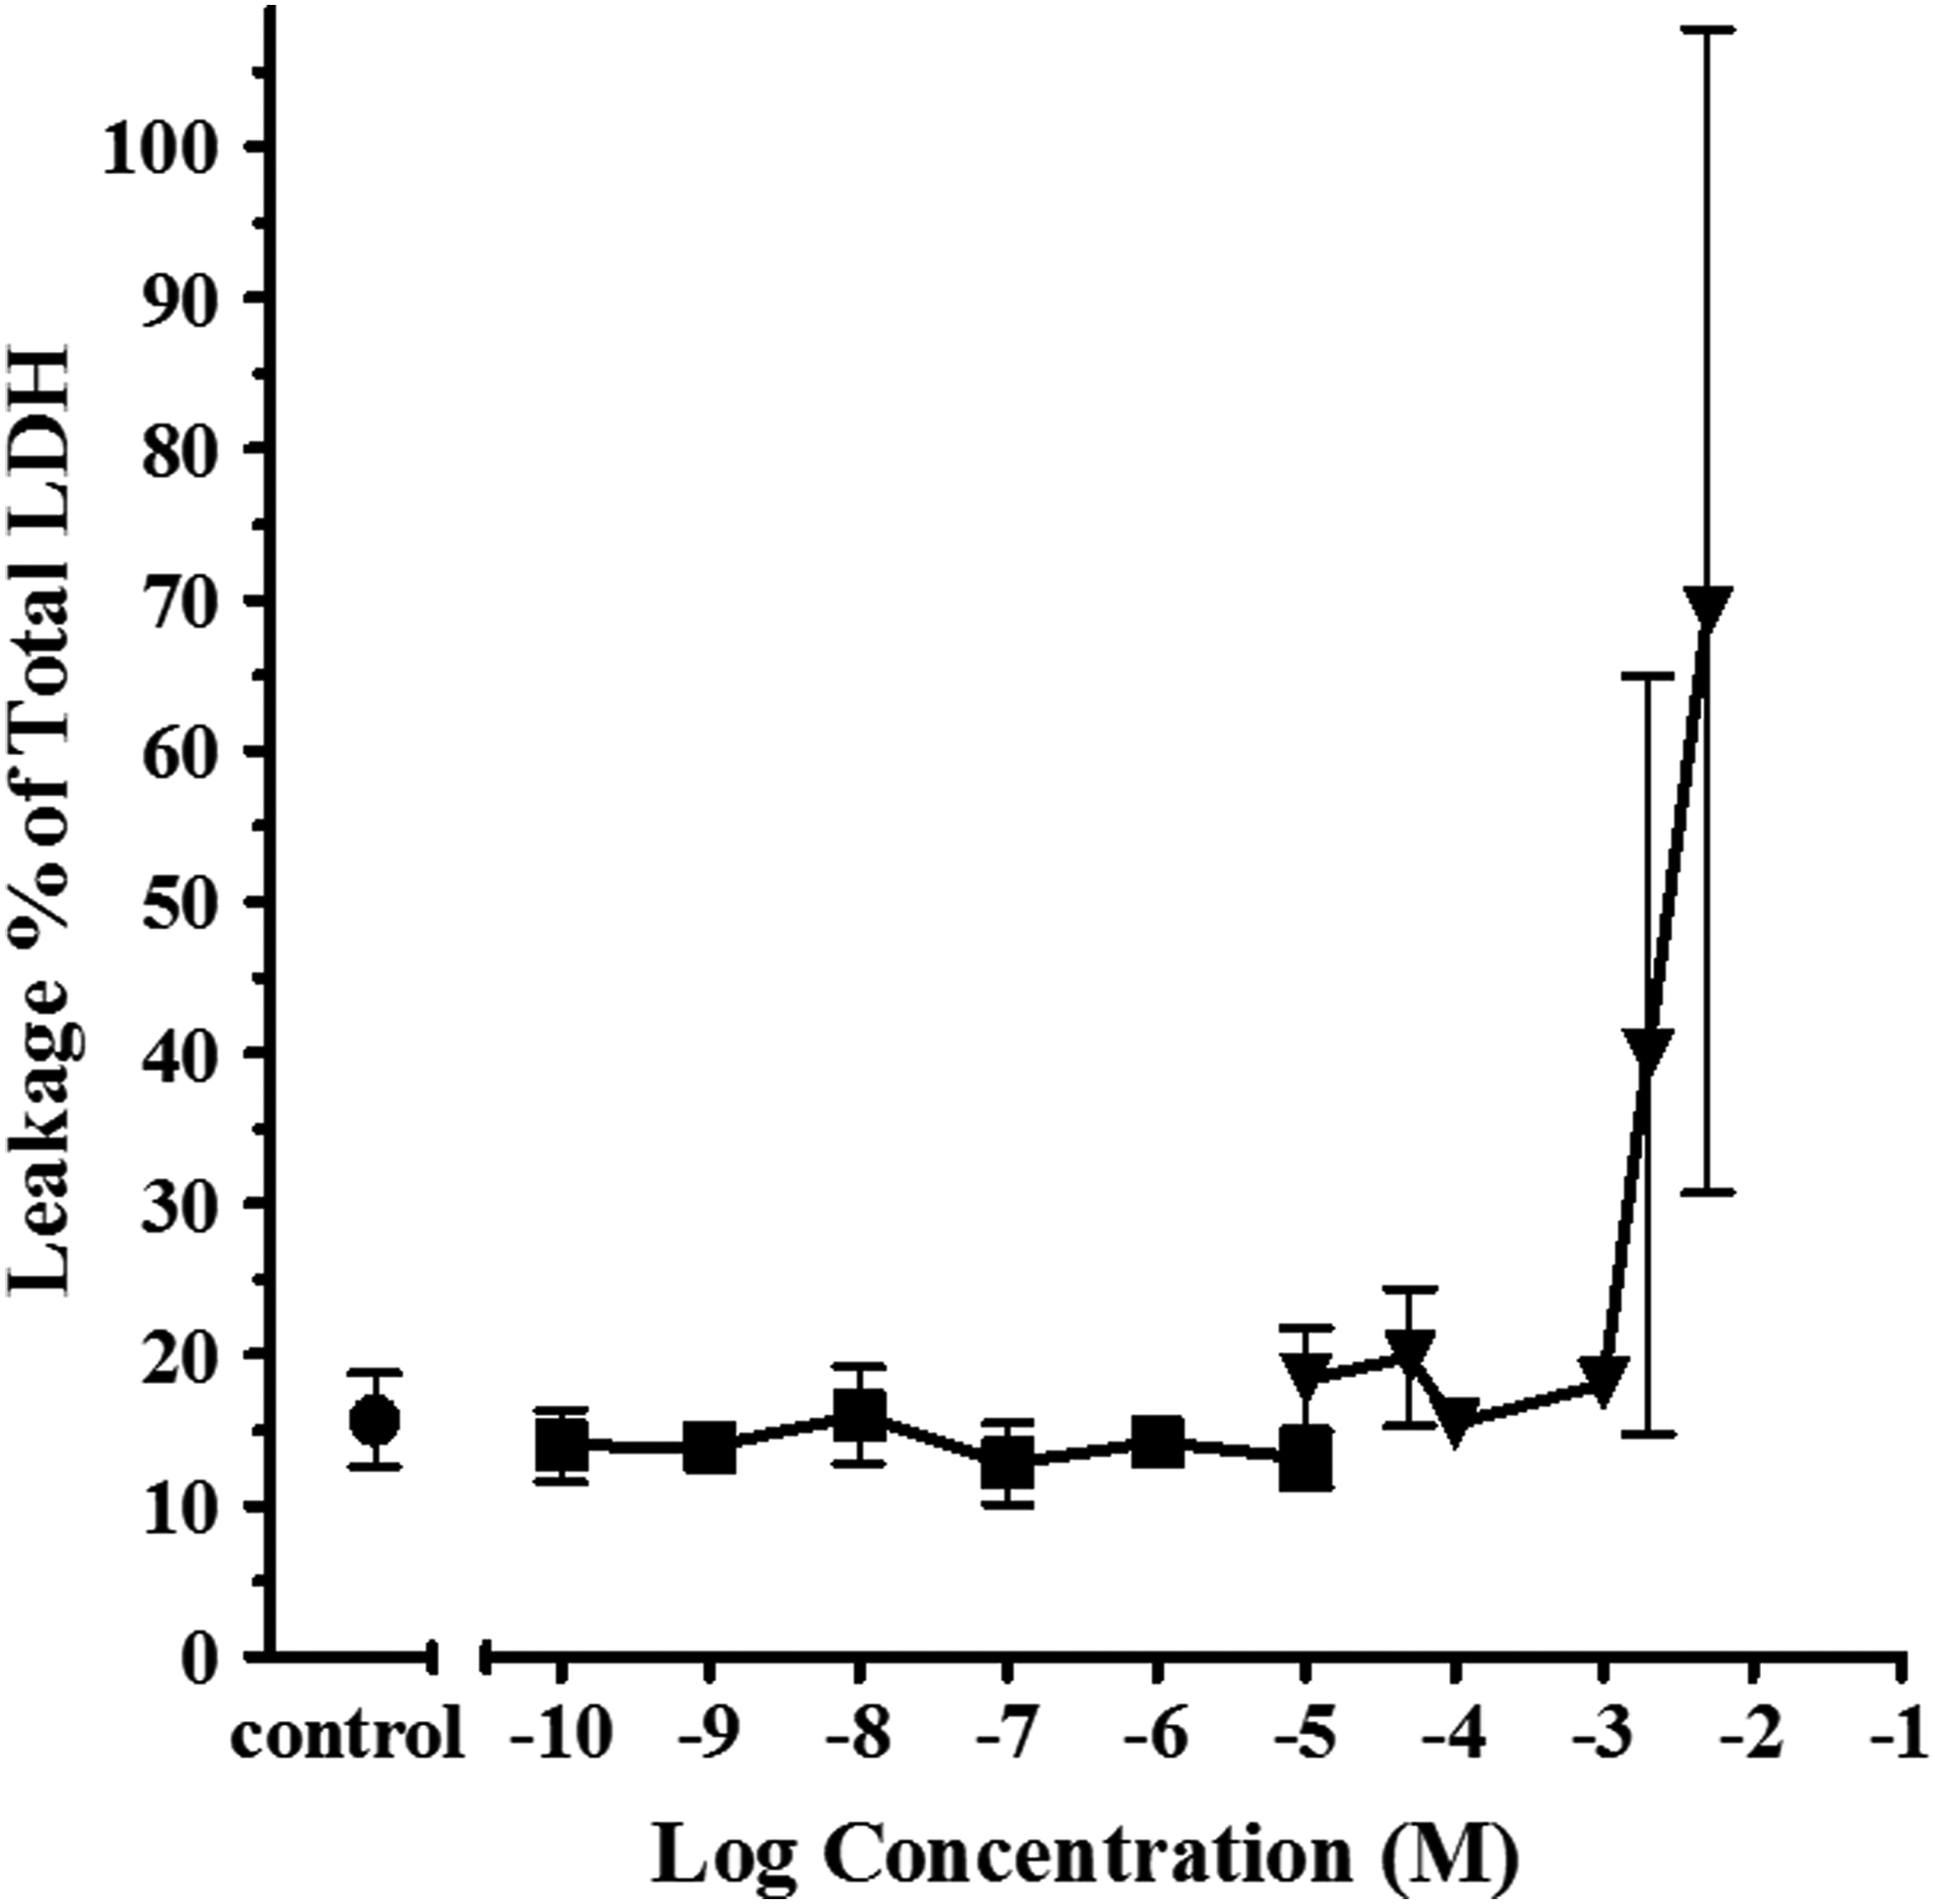
Determination of LDH leakage into media from slices exposed to ethanol (•), E2, (▪), or CBP (▾). Symbols represent the mean ± SEM of two replicate toxicity determinations. LDH, lactate dehydrogenase enzyme.
To further investigate these findings, the concentration of CPK and DPK in cytosol and exposure media was measured over the duration of the incubation period in separate experiments. DPK and CPK concentration in cytosol, dosed at −4 and −3 log M, were measured initially and at the end of the 20-hour incubation period. As expected, due to the limited metabolic capability within the cellular cytosols used for binding assays, there was no significant change in either DPK or CPK concentration over the length of the incubation period in either −4 log M or −3 log M exposures (Fig. 3). The measured DPK concentration was 94 ± 9.7 (n = 3) and 96% ± 7.3% (n = 3) of nominal concentrations for low and high exposures. The measured CPK concentration was 82% ± 2.8% (n = 2) and 83% ± 6.9% (n = 2) of nominal concentrations for low and high exposure.
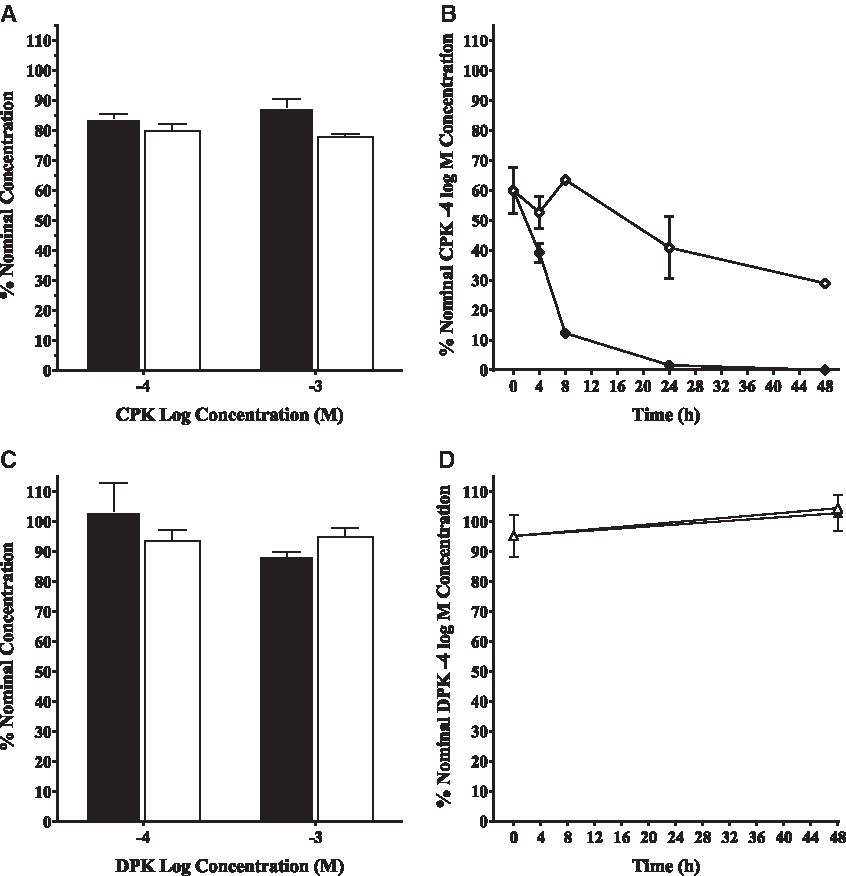
Concentrations of CPK and DPK in cytosol and slice exposure media.
While DPK concentration in liver slice exposure media did not change over time regardless of whether or not a liver slice was present in the media (Fig. 3), the fate of CPK in exposure media was much different. As seen with CPK in cell-free binding cytosols, the initial CPK concentration was significantly less than nominal (58% + 4.7% [n = 2] nominal) even in the absence of the liver slice. The CPK concentration in L-15 media with FBS then dropped to 40% at 24 hours and to roughly half (31%) of the initial CPK concentration by 48 hours. The loss of CPK in exposure media was greatly accelerated by the presence of liver tissue, starting again at 60% nominal (CPK) at 0 hours and dropping rapidly by 8 hours to 13%, only 3% at 24 hours, and was undetectable at 48 hours. This rapid loss of (CPK), along with evidence of Vtg induction in the slice assay in the absence of measurable CPK binding in the cyto rtER assay, was a strong indicator that CPK was likely metabolized to a rtER binding chemical cable of inducing Vtg mRNA expression (Fig. 1). These preliminary findings led to further investigation by Serrano et al. (article in preparation) into what CPK metabolite(s) produced in the presence of trout liver slices may be responsible for the observed Vtg induction.
With the exception of the nonbinder PAP, the remaining test chemicals based on chemical structure can be broken into three groups, DPK related, CPK related, and branched phenone (Table 4). DPK-related chemicals contain two unsaturated six carbon rings with a single carbon ketone bridge linking them, including 2,2,4,4-tetrahydroxybenzophenone (THBP), 2,4-dihydroxybenzophenone (DHDPK), OHDPK, HMBP, and 2-hydroxybenzophenone (HBO). CPK-related chemicals contain an unsaturated six carbon ring linked by the same ketone bridge as DPK-related chemicals to a saturated ring, including opCPK and CBP. Branched phenones are characterized by an unsaturated six-carbon ring linked by the same ketone bridge as DPK-related chemicals to a branched alkyl chain, including TPH, MPPK, IBP, and IVP.
Given the role of hydroxyl groups in rtER activation of low affinity chemicals, alcohol forms of DPK and CPK, BADPK, and CPKOH, respectively, as well as ring hydroxylated forms were tested in the binding and gene expression assays. These ring hydroxylated forms include four DPK-related forms: OHDPK, HBO, DHDPK, and THBP, and one CPK hydroxylated form: opCPK (Table 4).
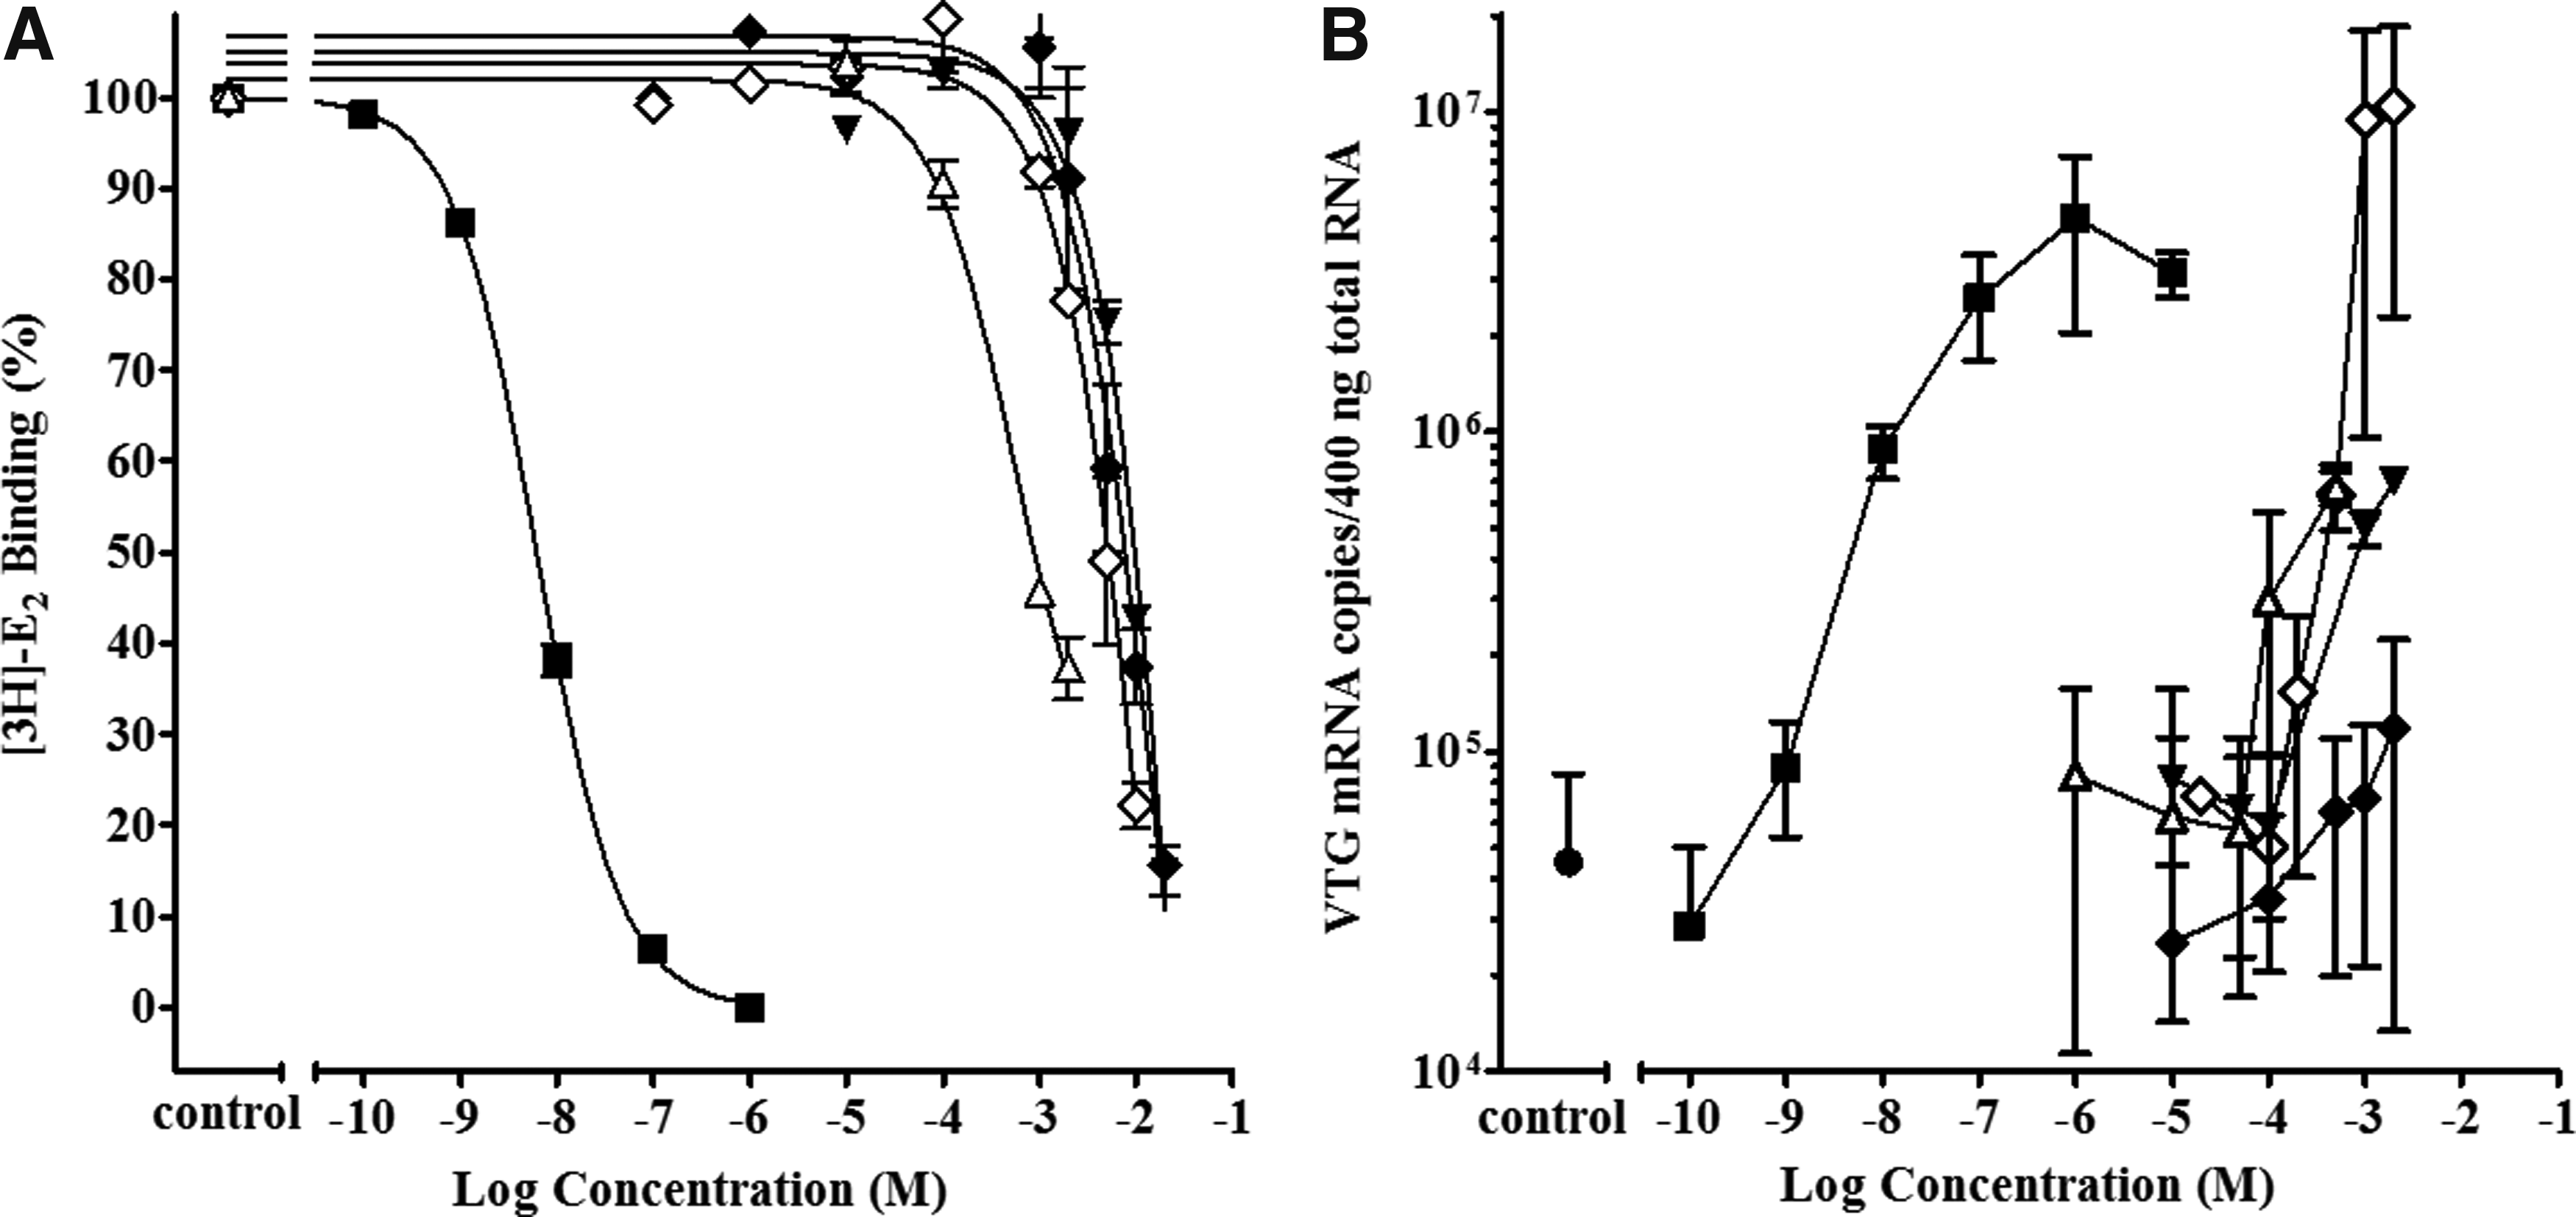
The cyto rtERαβ binding activity of DPK-related chemicals in comparison to DPK are shown in Figure 4A. For DPK, replacing the ketone oxygen with an alcohol as illustrated by BADPK in Figure 4, reduced the cyto rtERαβ RBA from 0.00030% to 0.000013% (Table 4). However, the addition of a hydroxyl (OH) group in the 4-position on one of the benzyl rings to achieve a phenolic ring, as in OHDPK, considerably increased the binding potency of the chemical by an order of magnitude (cyto rtERαβ RBA = 0.0032%), with the displacement curve shifting to the left. When the single OH group was moved from the 4- to 2-position on the ring as in HBO, the RBA decreased from 0.0032% to 0.00084%, which was still higher than the RBA of 0.00030% for the unsubstituted DPK. This is illustrated in Figure 4A by the displacement curve of HBO shifted to the left of that for DPK.
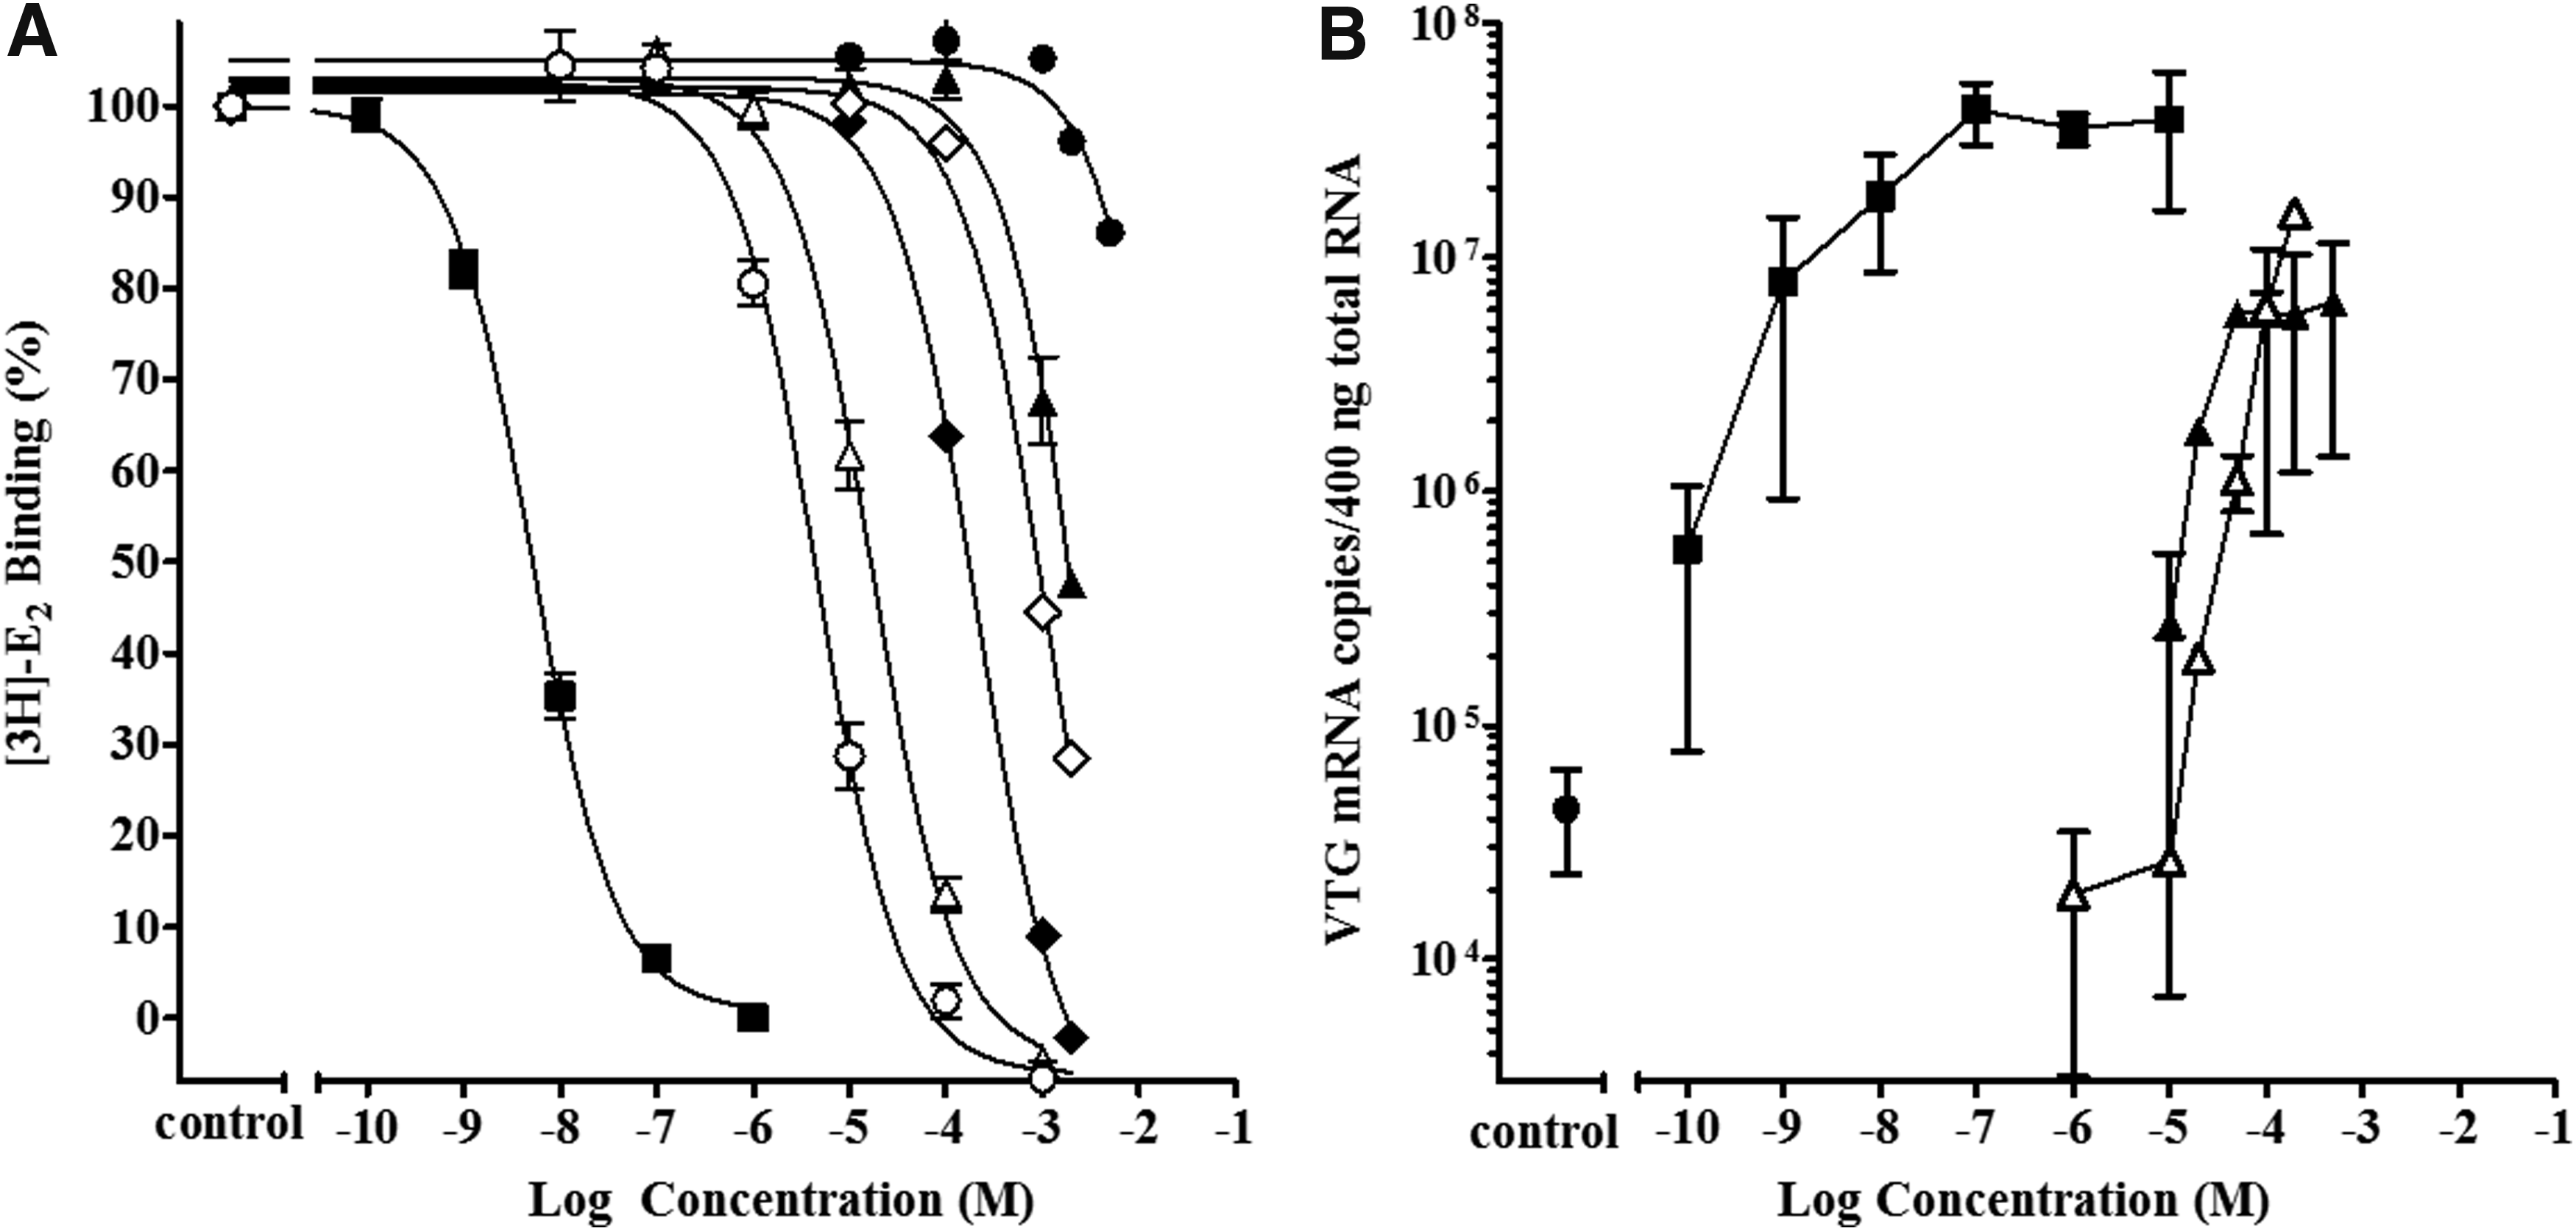
Activity of the benzophenone-related chemicals BADPK, DPK, HBO, OHDPK, DHDPK, and THBP in the cyto rtERαβ competitive binding assay and Vtg mRNA induction assay with liver slices from immature male trout.
Adding a second OH group to the ring as in DHDPK increased the RBA again by an order of magnitude to 0.029%, which was further increased to a relatively high RBA of 0.11% when four ring OH groups were present as in THBP. Note that the displacement curve for THBP in Figure 4A is closest to that of E2. Both DPK and DHDPK were further tested in the Vtg liver slice assay and both were shown to induce Vtg to maximum levels, similar to that of E2 tested in the same assays, although at higher concentrations (Fig. 4B).
To further examine the relationship of chemical structural features to rtER binding potential, an additional DPK-related chemical, HMBP, that had been the subject of earlier investigations was tested.2,3 Molina et al. found HMBP did not bind to the rtERα in a whole cell competitive binding assay when tested to a maximum concentration of −5 log M, but measured an RBA of 0.06% for DHDPK and 1.35% for THBP. 2 In addition, they found THBP and DHDPK induced Vtg protein production in primary rt hepatocytes, but no significant increase in hepatocytes exposed to a maximum HMBP concentration of −4 log M was observed. The lack of HMBP activity seen at the concentrations tested by Molina et al. 2 is not surprising since significant binding did not occur until −4 log M and significant induction of Vtg mRNA expression until −3.7 log M, in these studies. Kunz did report significant activity of HMBP in the recombinant yeast rt ERα assay at −4 log M and higher concentrations, but no effect on VTG expression in fathead minnows (Pimephales promelas) exposed in vivo by water. 3 DHDPK and THBP were active in both the in vitro recombinant yeast rt ERα assay and the fathead minnow in vivo exposures.
HMBP had an rtER binding affinity of 0.0015%, somewhat greater compared with the 2-hydroxy, HBO, but less compared with the 4-hydroxy, OHDPK, and much less than the 2,4-dihydroxy, DHDPK (Table 4 and Fig. 5A). A summary of the DPK-related structures and the RBAs are presented in Table 4, showing the progression of decreasing binding affinities with structural changes. In the liver slice assay, HMBP produced a Vtg induction curve similar to that of DHDPK (Fig. 5B). Given the previously demonstrated metabolic capabilities of the liver slices, an O-demethylation reaction in slices converting the 4-methoxy to 4-hydroxy would be a likely explanation for the observed data. 2
Activity of HMBP in cyto rtERαβ competitive binding and Vtg mRNA induction assay with liver slices from immature male trout.
The cyclic phenone CPK was a nonbinder in the cyto rtER αβ assay as previously mentioned. Addition of two phenolic hydroxyls to CPK produced the 2,4-dihydroxy cyclic phenone opCPK, which bound rtER with an RBA of 0.067% (Table 4). Thus, opCPK was a more potent binder than the corresponding 2,4-dihydroxybenzophenone DHDPK. Unlike the nonbinding ketone oxygen structure of CPK, the benzhydrol form CPKOH bound rtER with an RBA = 0.00025% (Table 4 and Fig. 6A). The rtER binders CPKOH and opCPK were further tested in the slice assay. Both of these CPK-related chemicals induced significant Vtg mRNA (Fig. 6B). As might be expected from its greater RBA, slices exposed to opCPK showed Vtg gene induction with efficacy similar to that of E2, and a dose–response nearly two orders of magnitude more potent than seen for CPKOH and ∼10 times more potent than DHDPK (Figs. 4B and 6B). The nonbinder CPK induced Vtg gene expression in liver slices, with a maximum efficacy similar to opCPK and E2, and with less potency than opCPK, but greater compared with the benzhydrol CPKOH. Again, this result suggested the potential metabolic conversion of CPK in the trout hepatocytes to one or more metabolites capable of binding to the rtER and inducing a response.

Activity of the CPK and CPK-related chemicals CPKOH and opCPK in cyto rtERαβ competitive binding and Vtg mRNA induction assay with liver slices from immature male trout. ), and opCPK (♦). Symbols represent the mean ± SEM of three replicate binding determination for CPK and opCPK and two for CPKOH.  ,▪), and CPK (◊), CPKOH (), and opCPK (♦). Symbols represent the mean ± SEM of four replicate slice exposures for CPK (left Y-axis), and mean ± SD of five technical replicates from single experiments for CPKOH and opCPK. CPKOH, cyclohexylphenylmethanol; opCPK, 2,4-dihydrophenylcyclohexylketone.
Cyclic phenone activity in rec rtER competitive binding assay
All of the subset of chemicals opCPK, OHDPK, DPK, CPKOH, CBP, and BADPK, tested in the rec rtERα bound to the rtER (Fig. 7). Complete rec rtER binding displacement curves were generated by all chemicals tested, with the exception of BADPK (Fig. 7). BADPK bound to the rec rtER, producing greater than 50% displacement, which led to classifying it as a binder even though it only produced a 20% displacement curve in the cyto rtERαβ (Fig. 4).
Activity of phenones CBP, DPK, BADPK, OHDPK, CPKOH, and opCPK in the rec rtERα competitive binding assay. Competitive binding curves (20 hours, 4°C) for positive control E2 (▪); and CBP (▾), DPK (▴), BADPK (•), OHDPK (♦), CPKOH (), and opCPK (◊). Symbols represent the mean ± SD of two technical replicates from single experiments.
The order of RBA among the chemicals tested in the rec rtERα, opCPK 3.0%, OHDPK 0.052%, DPK 0.0028%, CPKOH 0.0010%, CBP 0.00046%, and BADPK 0.00045% was the same as seen in the cyto rtERαβ, but the rec RBA was generally at least 10-fold greater than the corresponding cyto RBA (Table 4). This is likely due to higher total protein in the cyto rtERαβ assay, ∼4 mg/mL versus 0.01 mg/mL in the rec rtERα assay, which reduces the free chemical concentration by nonspecific binding to proteins. 18 Chemicals tested in the rec rtERα assay have a higher free fraction of test chemical for a given nominal concentration than in the cyto rtERαβ assay matrix, thus more chemical is available to interact with the rtER.
The exception was CBP, which had only a threefold higher rec RBA, 0.00046%, than cyto RBA, 0.00015% (Table 4). It is possible that some or all the CBP was metabolized in the cytosol to a more active chemical, but this conversion did not occur in the metabolically limited rec rtER assay matrix. Therefore, the CBP cyto RBA would reflect not only the contribution of CBP but also the metabolites, which may have increased the RBA in cytosol above that of CBP alone. The metabolism of CBP in cytosol and slice exposure media has been further investigated by Serrano et al. (article in preparation).
Branched phenone activity in cyto rtER competitive binding and Vtg expression assays
All the branched phenones studied, TPH, MPPK, IBP, and IVP, were tested in the cyto rtERαβ and liver slice Vtg mRNA induction assays. All branched phenones produced nearly complete cyto rtER binding curves with corresponding cyto RBA of TPH 0.0012%, MPPK 0.000092%, IBP 0.000074%, and IVP 0.000066% (Table 4). The RBA of the three (C3)- and four-carbon (C4) alkyl group chemicals (MPPK, IBP, and IVP) was all very low and essentially the same, but the Vtg responses they produced in slices were different. IVP induced Vtg expression to maximum levels, while IBP had modest increases in expression (Fig. 8). The tert butyl phenone, MPPK, induced very low, but significant Vtg expression in three separate experiments, but when the mean values of these separate tests were analyzed, there was no significant difference from controls, given the large variation (Fig. 8).
Activity of branched phenones IBP, MPPK, IVP, and TPH in the cyto rtERαβ competitive binding assay and Vtg mRNA induction assay with liver slices from immature male trout.
The eight-carbon alkyl chain branched phenol TPH had a cyto RBA that was over an order of magnitude higher than the other branched phenols tested. This was not surprising based on previous studies using this same model, which found a relationship between increasing alkyl chain length and increased RBA with alkylphenols. 7 The low Vtg response in slice exposed to TPH was somewhat surprising based on the cyto RBA. TPH Vtg induction did not occur at a lower concentration or to a greater maximum efficacy than seen with the C3 and C4 branched phenones (Fig. 8). The binding assay is relatively simple with a homogenous matrix used to measure the interaction of the chemical with the ER. While this interaction is only the initiating event of the ER-mediated AOP, it is only one step along the process of Vtg mRNA production in the liver. Additional factors in the slice assay, such as chemical partitioning into the slice, metabolism, elimination, chemical cytotoxicity, and transcription competency, are variables not present in the binding assay. One or a combination of the factors may have resulted in the lower-than-expected Vtg response to TPH.
Conclusions
This article describes the application of in vitro approaches to evaluate the estrogenic potential of cyclic phenones, branched phenones, and hydroxybenzophenones. Specifically, the use of information obtained with the competitive rtER binding and rt liver slice Vtg mRNA induction assays to assess the estrogenic activity of these model phenones was reported. Cyclic phenones, branched phenones, and hydroxybenzophenones were shown to be capable of binding to rtER and inducing Vtg gene expression. The relative potency of these chemicals ranges from nonbinder to high binding affinities, on par with the RBA of tamoxifen. The addition of OH groups on the aromatic rings of cyclic phenone increased affinity for the rt ER; therefore, the hydroxybenzoates were more potent than the phenones. Similarly, oxidization of CPK to an alcohol changed the affinity to the rtER from a nonbinder to a binder CPKOH.
The expansion of the binding and gene induction assays to include quantitative chemical analysis was invaluable in situations where the two biological assays gave conflicting results, as in the case of CPK. Results indicated that CPK was stable in cytosol where it did not bind the rtER, but was theoretically metabolized in the presence of liver slice to a chemical capable of binding the ER and inducing Vtg gene expression. The role of biotransformation of CPK and other model cyclic phenones in both cytosol and slice exposure media is further addressed in two complementary articles by Serrano et al. (article in preparation).
Footnotes
Acknowledgments
The authors thank Phillip Hartig for the gift of recombinant rainbow trout estrogen receptor. The authors also thank Joe Korte for critical review of the article and Evan Timmerman for care of the trout. The research described in this article has been funded wholly by the U.S. Environmental Protection Agency.
Disclaimer
Mention of trade names or commercial products does not constitute endorsement or recommendation for use. The views expressed in this article are those of the authors and do not necessarily reflect the view or policies of the U.S. Environmental Protection Agency.
Author Disclosure Statement
No competing financial interests exist