
Abstract
Racial and ethnic minority men who have sex with men (MSM) are disproportionately affected by HIV/AIDS in Los Angeles County (LAC), an important epicenter in the battle to end HIV. We examine tradeoffs between effectiveness and equality of pre-exposure prophylaxis (PrEP) allocation strategies among different racial and ethnic groups of MSM in LAC and provide a framework for quantitatively evaluating disparities in HIV outcomes. To do this, we developed a microsimulation model of HIV among MSM in LAC using county epidemic surveillance and survey data to capture demographic trends and subgroup-specific partnership patterns, disease progression, patterns of PrEP use, and patterns for viral suppression. We limit analysis to MSM, who bear most of the burden of HIV/AIDS in LAC. We simulated interventions where 3000, 6000, or 9000 PrEP prescriptions are provided annually in addition to current levels, following different allocation scenarios to each racial/ethnic group (Black, Hispanic, or White). We estimated cumulative infections averted and measures of equality, after 15 years (2021–2035), relative to base case (no intervention). By comparing allocation strategies on the health equality impact plane, we find that, of the policies evaluated, targeting PrEP preferentially to Black individuals would result in the largest reductions in incidence and disparities across the equality measures we considered. This result was consistent over a range of PrEP coverage levels, demonstrating that there are “win–win” PrEP allocation strategies that do not require a tradeoff between equality and efficiency.
Introduction
The HIV epidemic in Los Angeles County (LAC) remains one of the largest nationwide, with ∼52,000 people living with HIV (PLWH) and over 1600 new HIV diagnoses annually. 1 –3 Men who have sex with men (MSM) comprise 83% of the PLWH in LAC (compared with 61% nationally). 4
There exist profound racial and ethnic disparities in HIV burden and care among MSM residing in LAC. An estimated 17.5% of LAC PLWH are non-Hispanic Black MSM, although non-Hispanic Black MSM represent only 7.9% of the LAC MSM population. 5 Additionally, only 65% and 73% of diagnosed non-Hispanic Black and Hispanic MSM were linked to care within a month, compared with 80% for diagnosed non-Hispanic White MSM. 5 Similar patterns exist with engagement in HIV care and viral suppression, with lower retention among non-Hispanic Black MSM (52%), compared with 60% and 61% retention rates among non-Hispanic White MSM and Hispanic MSM, respectively. 5
While reducing disparities has been a priority in HIV control policy, 6 there is less consensus around how to quantify disparity reductions across policies. Prior work has examined various measures of disparity, including the Gini, Atkinson, and Kolm indices to measure inequalities, which we use in this study. 7 –11 While these measures were originally developed by economists for measuring inequalities in resource allocation, such as income inequality, they have more recently been used to measure inequalities in health outcomes in HIV/AIDS. 7 Such indices can be used to measure inequality between groups (such by race/ethnicity) in a distribution of values, as in the value of incidence rates over a population. These indices typically range from 0 to 1, where 0 represents perfect equality (all groups are exposed to the same incidence rate) and 1 represents maximal inequality (e.g., every group has incidence rates of zero except one, which has extremely high incidence rates).
Prior work has compared these with other disparity metrics (rate ratio, population-attributable proportion, and index of disparity) in evaluating HIV intervention strategies and found that all measures were consistent in measuring a decrease in disparities by race/ethnicity after diagnosis rates were reduced. 7 Using and visualizing such measures for HIV control policy outcomes are critical for understanding policy impacts on inequality, and policy guides have called for the creation of measurable objectives, particularly for disparities, as a primary step to accelerating HIV prevention efforts. 12 Developing county-specific HIV studies that account for differences in HIV risk, and quantifying reductions in disparities, are critical to better understand and design strategies across population subgroups.
However, reducing disparities is only one policy goal. HIV prevention policies also aim to reduce overall HIV burden, as measured by incidence rates and cumulative new cases over time (intervention effectiveness), as well as investing in efficient policies, where each additional resource used results in reasonably large reductions in HIV burden. Therefore, in this work, we examine these metrics of policy performance across pre-exposure prophylaxis (PrEP) policies that vary by allocation and magnitude. In addition to reporting health and equality outcomes, we also provide a framework for visualizing measures of disparity against effectiveness, allowing comparison of potential tradeoffs.
The Ending the HIV Epidemic (EHE) initiative aims to end the HIV epidemic in the United States within 10 years. 13 It emphasizes prevention of new infections through the use of PrEP, 13,14 a highly cost-effective biomedical HIV/AIDS prevention strategy, which can reduce HIV infection risk by up to 99%. 14 –19 LAC aims to accelerate efforts that increase PrEP use, particularly for populations with disproportionately high HIV diagnosis rates and low PrEP coverage, such as Black and Latino MSM. 20
We, therefore, evaluated a variety of PrEP allocation strategies for MSM in LAC to determine their effectiveness in reducing new HIV infections and in narrowing racial and ethnic disparities in HIV incidence. Many studies to date have examined population-level effects, which mask potential disparities in outcomes for specific population subgroups, 16 –18,21 –26 or do not consider differences by race/ethnicity. 27 –29 Notable exceptions include agent-based models of HIV transmission among MSM in Baltimore, MD 22 and Atlanta, GA. 30 –32 Both models compare outcomes between non-Hispanic Black and non-Hispanic White MSM. Modeling HIV among the substantially larger MSM population in LAC necessitates the inclusion of a third major group, Hispanic MSM, given the unique racial/ethnic composition of LAC.
We developed an age- and race/ethnicity-stratified microsimulation model for MSM that considers subgroup-specific partnership patterns, disease progression, PrEP use patterns, and viral suppression outcomes from antiretroviral therapy (ART) adherence patterns. We used a microsimulation to allow HIV disease and treatment dynamics (rates of transmission, diagnosis, treatment adherence, death, etc.) to vary by individual characteristics (race/ethnicity and age). Besides examining infection outcomes, we additionally calculated equality indices (Gini Index, etc.) to evaluate the equality of outcomes across the examined policies. We evaluate various strategies to distribute PrEP by race/ethnic group, including ones that are unequal in coverage (targeting single race/ethnicities for PrEP uptake) to compare against more equally distributed policies. To our knowledge, this is the first publication using this type of analysis to examine PrEP allocation.
Methods
Model overview
We developed a discrete time microsimulation model to describe the transition of MSM in LAC between health and treatment states. We restricted the model to MSM, as this group alone accounted for 83% of new HIV diagnoses in 2019. 3 Each state is a collection of attributes that define an individual's infection status and disease state (i.e., no infection, CD4 ≥ 500, 200 ≤ CD4 ≤ 499, CD4 < 200), viral suppression (i.e., HIV-1 RNA <200 copies/mL), PrEP usage (i.e., actively on a PrEP prescription), and diagnosis status (i.e., aware vs. unaware if HIV positive). Transitions between states were determined by annual transition probabilities drawn from empirical data, derived from prior literature, or determined through model calibration (see section entitled “Model calibration and validation”), and varied by age (15–100) and race/ethnicity (non-Hispanic Black, Hispanic, and non-Hispanic White). For model simplicity and due to data limitations, we did not include other racial/ethnic minority MSM as they comprise a small fraction (less than 10%) of the PLWH in LAC.
The model used yearly cycles. Each year, men entered the model at age 15. Once in the model, they could acquire HIV with specified probabilities that varied by age and race/ethnicity, and progress through the stages of HIV infection. The risk of HIV depended on the prevalence of nonvirally suppressed HIV in the population subgroups of potential sexual partners, as well as on the individual and his number of sexual partners, PrEP usage, demographic characteristics of age and race/ethnicity, and level of viral suppression in the community based on ART adherence. HIV-negative MSM could initiate, adhere to, or discontinue PrEP, and PLWH could be diagnosed, initiate, and adhere to treatment with ART and attain viral suppression or discontinue treatment. Men can exit the model through death (either natural or AIDS related). We did not consider immigration or emigration.
Figure 1 depicts the states and transitions for a single age- and racial/ethnic group (only one of the age and race/ethnicity combinations from the model is shown, for illustrative purposes). Boxes represent states while arrows represent the possible transitions (that can be age, race, and HIV stage specific in the model code). Individuals in the susceptible state are HIV negative and can be either on or off PrEP. If infected, they can progress through HIV stages defined by CD4 count status. We have categorized three stages of HIV corresponding roughly to general CD4 cutoffs in the literature (stage 1 of CD4 count ≥500, stage 2 with CD4 count from 200 to 499, and stage 3 with CD4 under 200). Those who are HIV negative and not on PrEP may start PrEP, which reduces the likelihood of acquiring HIV. Those who are on PrEP might stop through PrEP discontinuation. Individuals on PrEP can still become infected if they are not adherent to his PrEP.
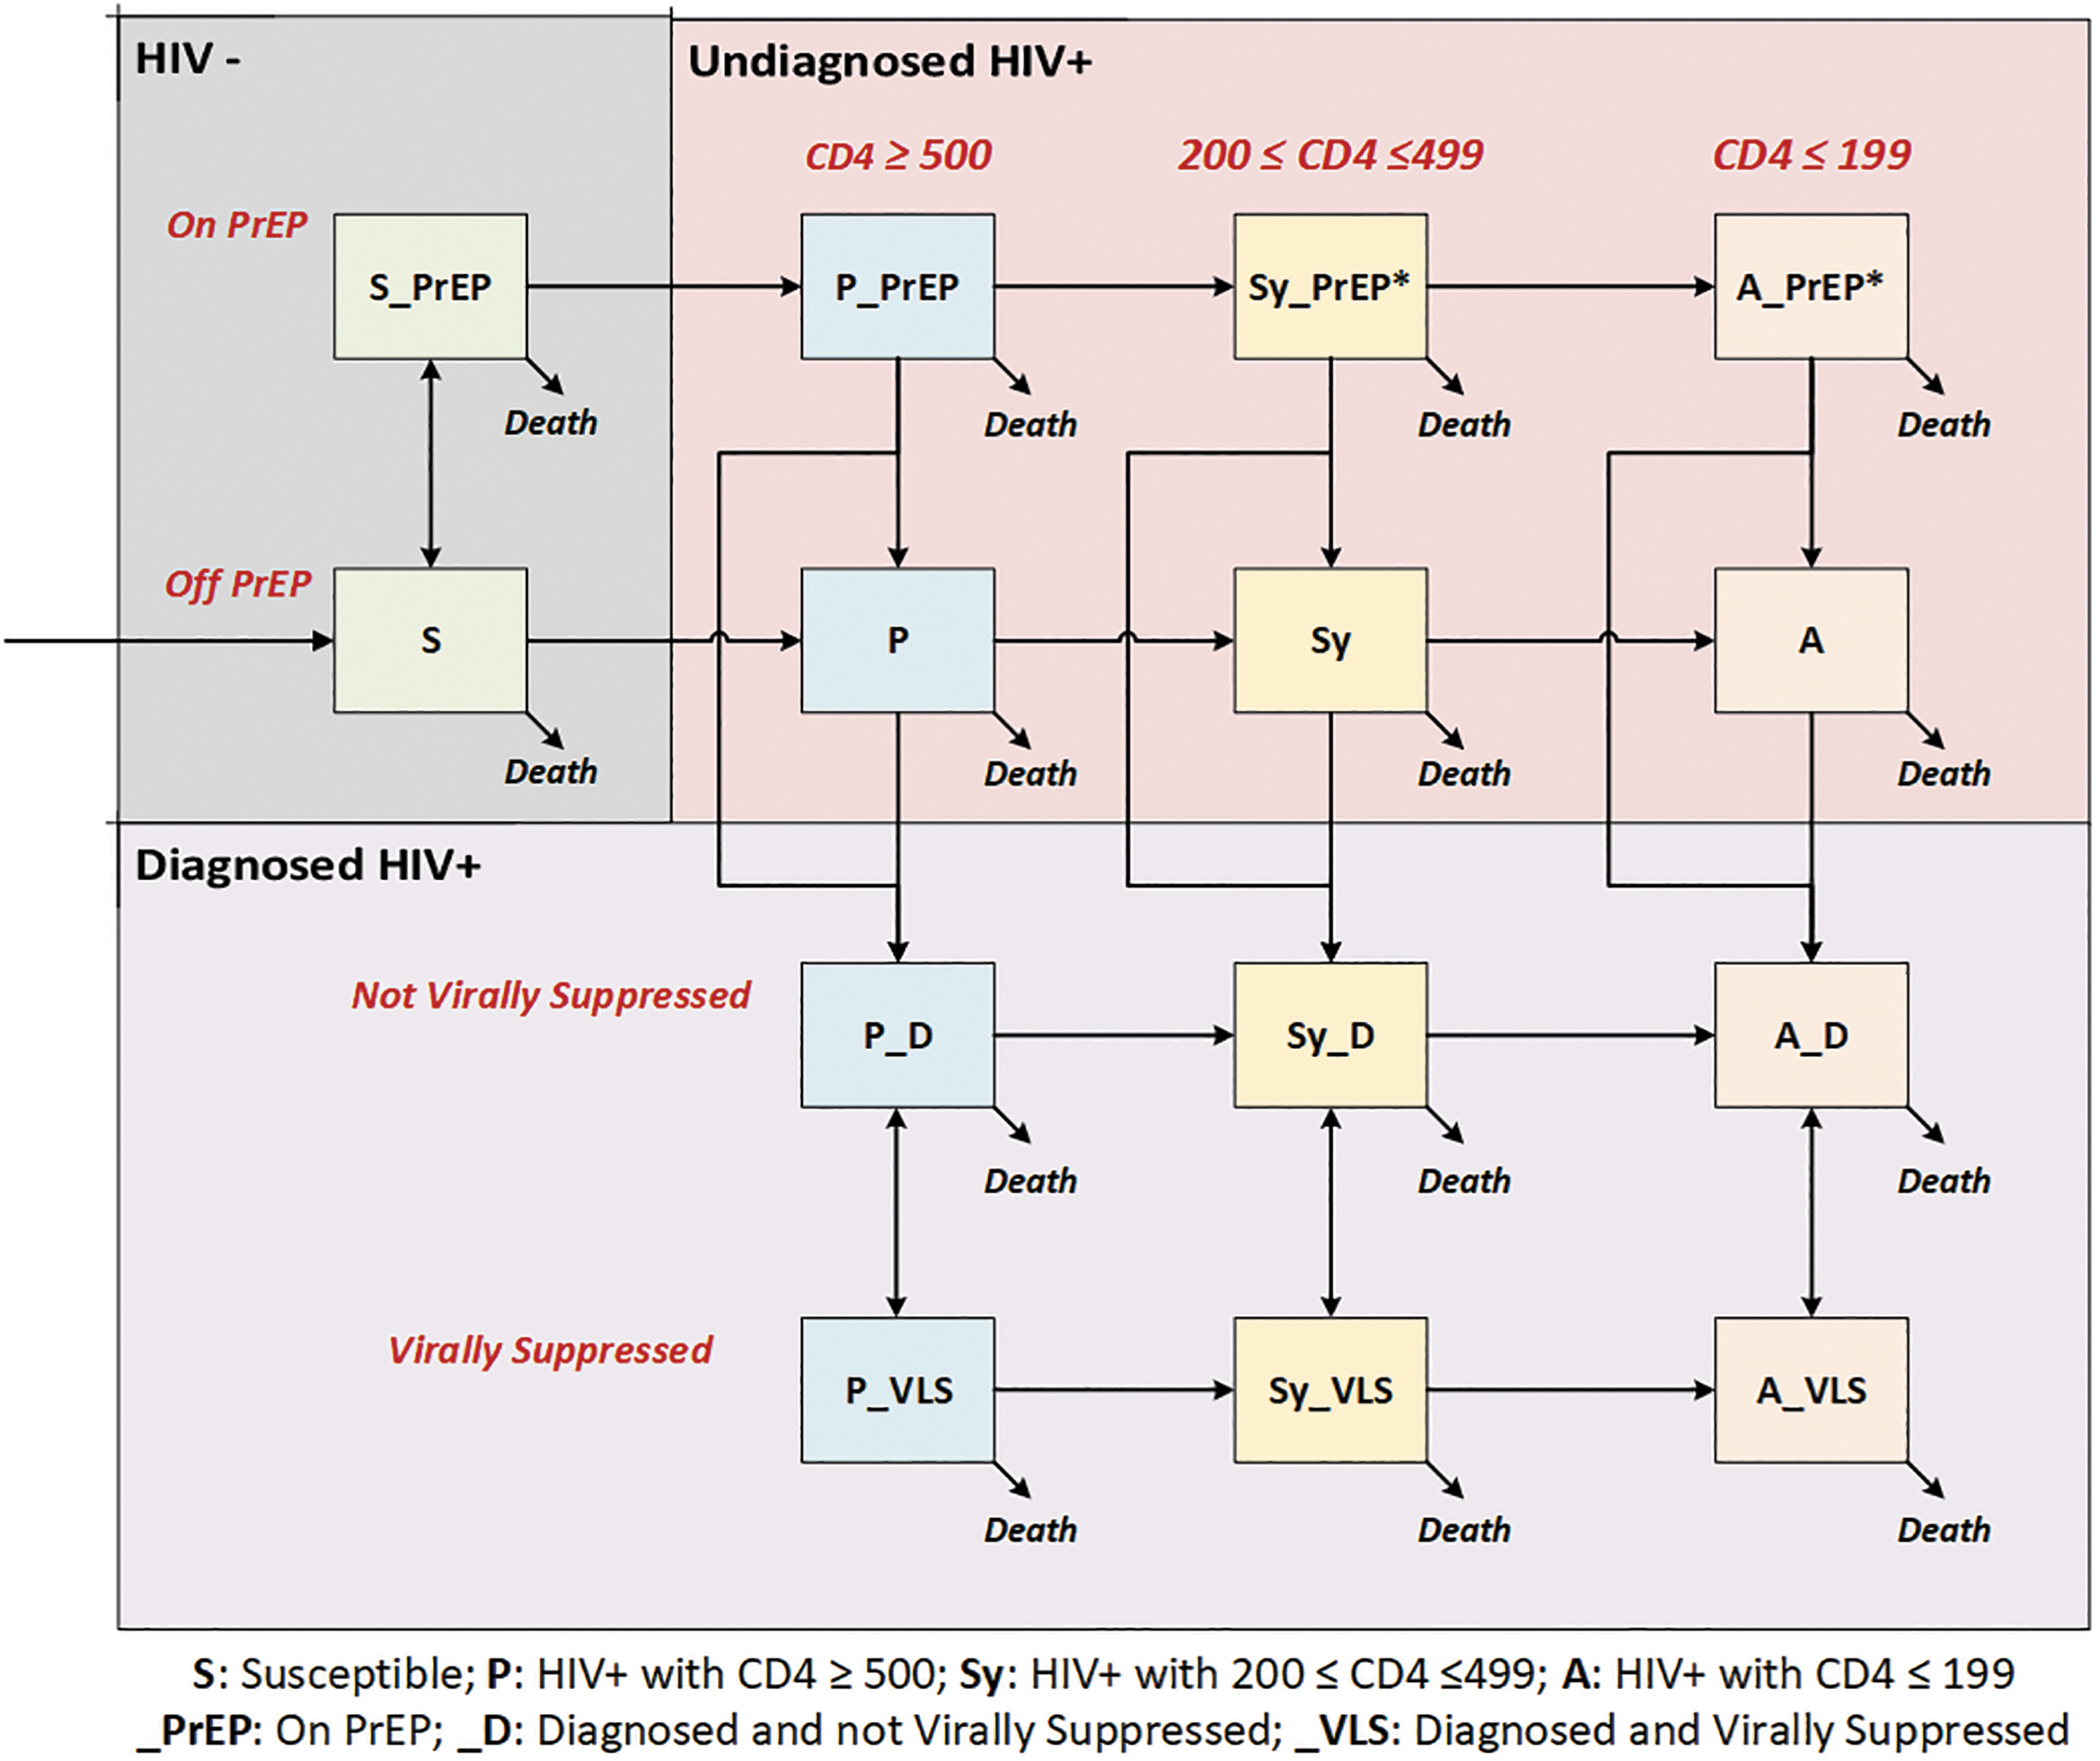
Microsimulation model schematic. This simplified model schematic reflects disease and treatment progression for one age and racial/ethnic group (all combinations are modeled but omitted from the diagram for clarity). Arrows represent transitions that can occur within a particular age and racial/ethnic group. Individuals who have been diagnosed cannot be on PrEP. Sy_PrEP and A_PrEP states have fewer than five individuals but are shown for completeness. PrEP, pre-exposure prophylaxis.
When someone acquires HIV, regardless of CD4 level, they will stop using PrEP when diagnosed and may become virally suppressed using ART. Patients who are virally suppressed from ART may be highly adherent through the year (95% likelihood), which results in no transmission of HIV. An individual's HIV status, PrEP usage, viral suppression, and diagnosis status changes his probability of acquiring HIV, becoming diagnosed, and transmitting HIV. Supplementary Sections 1–4 and Supplementary Tables S1 and S2 provide additional details.
Model input data
We drew model inputs from empirical data and prior published work. Selected values are shown in Table 1 (complete list in Supplementary Section 2, Supplementary Tables S3–S6). We used data from 2011 to initialize our simulation and data from 2012 to 2016 for calibration.
Selected Parameters (Complete List of Parameters Can Be Found in Supplementary Section 2)
Table contains a selection of parameters used in the microsimulation model.
Indicates age buckets: begin at 15 and are increments of 5 years until ages 85+.
Indicates age buckets: 15–29, 30–49, 50–64, 65+.
Indicates race buckets: Black, Hispanic, White.
Indicates HIV stages: CD4 ≥ 500, 200 ≤ CD4 ≤ 499, CD4 < 199.
Indicates years: 2012, 2014, 2017.
Indicates adherence levels: Low/None, Moderate, High.
ART, antiretroviral therapy; LAC, Los Angeles County; MSM, men who have sex with men; PLWH, people living with HIV; PrEP, pre-exposure prophylaxis.
The annual probability of HIV infection was defined by the individual's race/ethnicity, age, number of sexual partnerships, PrEP use, and adherence status, as well as the local HIV epidemic's characteristics, such as the number and distribution of infectious PLWH across different race/ethnicity, age, ART status, and adherence categories (Supplementary Section 2e and equation 1). Estimates were derived from the literature or calculated from a sexual partnership survey conducted by the LA LGBT Center (Supplementary Fig. S1).
From these data, we constructed a sexual partnership matrix, which characterizes some of the complex factors associated with differential sexual mixing patterns among MSM in LAC (e.g., preferences, neighborhood segregation, social/sexual racism), and potentially explain, for example, racial/ethnic and age group differences in HIV transmission rates.
Model calibration and validation
The simulated population is initialized to align with estimates for the 2011 MSM population, before when PrEP became available. PrEP uptake then increases over time from 2012 to 2017. To ensure that our model reflected realistic trends over time, we then compared model outputs with empirical data over the 2012–2016 period (the “calibration period”) to determine values for uncertain parameters that we were unable to estimate directly. In this comparison, we examined model outputs on new diagnosis, diagnosed PLWH, AIDS-related mortality, and viral suppression over this period, both over the simulated population and by simulated subgroup (e.g., by race and age groups), to ensure that both absolute values and trends over time were similar to those seen in surveillance reports, published literature, and survey data. We chose to use multiple years of data in our calibration process as it meant that our model needed to match well with empirical levels as well as trends over time.
In all, there were 35 different epidemic outcomes examined, each with annual information over the calibration period from the LAC Department of Public Health surveillance data (details in the Supplementary Section 3 and Supplementary Table S7). We used a hierarchical calibration process to vary the uncertain parameters in the model (calibrated values) such that the model outputs matched these 35 targets. Calibrated values included scaling factors to account for relative risks across subgroups, such as for the likelihood of reaching viral suppression through ART by race/ethnicity and age, and the probability of disease progression while virally suppressed or not.
We validated the model by comparing its predicted outcomes (19 distinct model outcomes) against estimates for comparable local and national outcome measures derived from the US Centers for Disease Control and Prevention (CDC) data and other scientific literature reports of HIV prevalence, incidence, viral suppression, new diagnoses, serostatus awareness and PrEP use, overall, and by race/ethnicity and age (Supplementary Section 4 and Supplementary Tables S9 and S10).
Policy interventions
We simulated three PrEP coverage levels (i.e., 3000, 6000, and 9000 additional PrEP prescriptions were provided annually beyond current levels) for 15 years (2021–2035). In each coverage level, we examined six allocation strategies that distributed the additional PrEP prescriptions across different racial/ethnic groups (for a total of 18 interventions). This was meant to proxy uneven PrEP uptake across groups, as may occur if the additional PrEP prescriptions are distributed by clinics or other resource-providing organizations that primarily service specific racial/ethnic groups (e.g., due to location or other factors); or if outreach encouraging PrEP uptake varied in effectiveness across different communities. For reference, under the baseline PrEP uptake (no intervention), ∼4500 individuals started PrEP in 2020. The additions of 3000, 6000, and 9000 prescriptions therefore increased the amount of PrEP prescribed by ∼67%, 133%, and 200%, respectively, relative to 2020.
The six allocation strategies considered PrEP distribution by prevalence, diagnosis rate, and targeted to a single race/ethnic group (Black, White, or Hispanic). Specifically, we considered: (1) Equal allocation (equal quantity of PrEP for each group), (2) Count allocation (proportional allocation based on the number of PLWH in each group), and (3) Rate allocation (proportional allocation by the new diagnosis rate in each racial/ethnic group), and strategies 4–6 allocated the additional PrEP to only one racial/ethnic group to better understand policy outcomes. (Detailed policy descriptions in Supplementary Section 5 and Supplementary Tables S11 and S12.)
Model outcomes
Health outcomes
For each allocation strategy under each coverage scenario, we calculated the incidence of HIV infections (rates per 100,000 population) and cumulative infections averted in 2035 relative to no intervention. We reported average values over 30 iterations per intervention, which was sufficient to generate small standard errors. We measure the effectiveness of a policy through the number of new HIV infections averted over the simulated time horizon. We additionally report the 2035 PrEP-to-need ratio (PnR), as defined by Siegler's (ratio of individuals on PrEP and number of new diagnoses in the prior year), 33 to measure how PrEP coverage would be impacted by each strategy.
Health equality impacts
We used the Gini Index,
9
–11
along with other equality indices (Atkinson and Kolm),
8
to measure the health equality impact of alternative PrEP allocation strategies under each coverage scenario. Equality refers to the ability of policies to reduce disparities by race/ethnicity. The Gini Index was calculated by examining the distribution of HIV incidence rates in 2035 across groups. The Gini Index, Atkinson Index, and Kolm Index are defined in Equations (1), (2), and (3), respectively.
8
–11
Lower values for these indices relative to the base case scenario indicate a reduction in disparities. Results were consistent across the three measures, so we only present results using the Gini Index for brevity. Further details can be found in Section 7 of the Supplementary Data.
Gini Index equation. xi
is the incidence rate in racial/ethnic group i, n is the number of susceptible (HIV-) individuals, and i is the rank of values in ascending order (e.g., if the incidence rates for Black, Hispanic, and White race groups were 1100, 550, and 310 infections per 100,000 MSM, respectively, the associated rank values for these incidence rates are 3, 2, and 1, respectively).
Atkinson Index equation.
Kolm Index equation.
Tradeoffs between health and health equality impacts
A health equality impact plane was used to relate changes in the Gini Index to efficiency and to assess potential tradeoffs between health and equality impacts. We measure efficiency as the reduction in incidence rate per PrEP coverage at the end of the simulated period, relative to no intervention.
Sensitivity analyses
We conducted sensitivity analyses to assess the impact of uncertainties in transmission patterns on outcomes, as these values were inferred from a nonrepresentative sample. We used two alternative partnership mixing scenarios: (1) Assortative mixing: individuals only have partners of the same racial/ethnic group, with no age preferences; (2) uniform mixing: individuals have equal likelihood for a partner of any other age and racial/ethnic group (Supplementary Section 8 and Supplementary Figs. S3 and S4).
At baseline, PrEP uptake, adherence, and discontinuation were assumed to be the same between racial/ethnic groups, as there is disagreement in prior literature over whether differences in PrEP use are associated with race/ethnicity. While some work has demonstrated that there are not statistically significant differences, 34 others find differences in the proportion of users by race/ethnicity. 35 To consider differences in PrEP use by race/ethnicity, we performed a sensitivity analysis where the relative risk of PrEP discontinuation was twice as high among non-White individuals as White, as an extreme scenario analysis based on values seen in the literature. 36
Ethics approval
The UCLA and LAC Institutional Review Boards have approved this study as IRB Exempt (IRB#19–000110). No consent or consent waiver was needed, as the authors only had access to deidentified, aggregated data (from 2011 to 2016) or published data from prior literature (from 2008 to 2020). Authors report no conflicts of interest, and all have read and approved the final article. A preprint based on this work is hosted on MedRxiv (
Results
Calibration and validation results
Calibration outcomes are depicted in Supplementary Fig. S2, which can be found online. The sum of squared errors over population-level calibration targets were all less than 10% (Supplementary Table S8), indicating reasonable fit.
Our model also performs well on the validation process, as model outputs were within 10% of the values reported in the literature for the prevalence rates of HIV/AIDS (undiagnosed and total), viral suppression, new diagnoses, incidence rate, and PrEP coverage. 37 –39 Our model also performed well in predicting these outcome measures across racial/ethnic groups for LA County (Supplementary Table S10 of the Supplementary Section 4). 3 Our PnR was also within the ranges reported in prior literature, AIDSVu, and AHEAD values. Siegler's work in 2018 identifies the national male PnR to be 2.1 in 2017. The AIDSVu and AHEAD dashboards for LA County, report PnR to be 6.0 and 8.1 in 2019. 40,41 Our model estimates PnR to be 3.18 in 2017 and 4.4 in 2019, values that lie within the range reported by Siegler's article, AIDSVu, and AHEAD.
Base case analysis (3000 PrEP units of PrEP coverage)
Health impacts
A strategy that prioritized expanding PrEP coverage among Black MSM averted the most cumulative new HIV infections (1019.5, 95% CI 852.2–1186.8) over a 15-year (2021–2035) program implementation period, as shown in Fig. 2, which depicts the number of cumulative infections averted relative to no intervention. Accordingly, this allocation strategy also led to the largest reductions in 2035 incidence rates (Fig. 3). This strategy was followed, respectively, by strategies that prioritized rate-based, equal, and count-based allocations, and coverage expansion to Hispanic MSM only, or White MSM only.
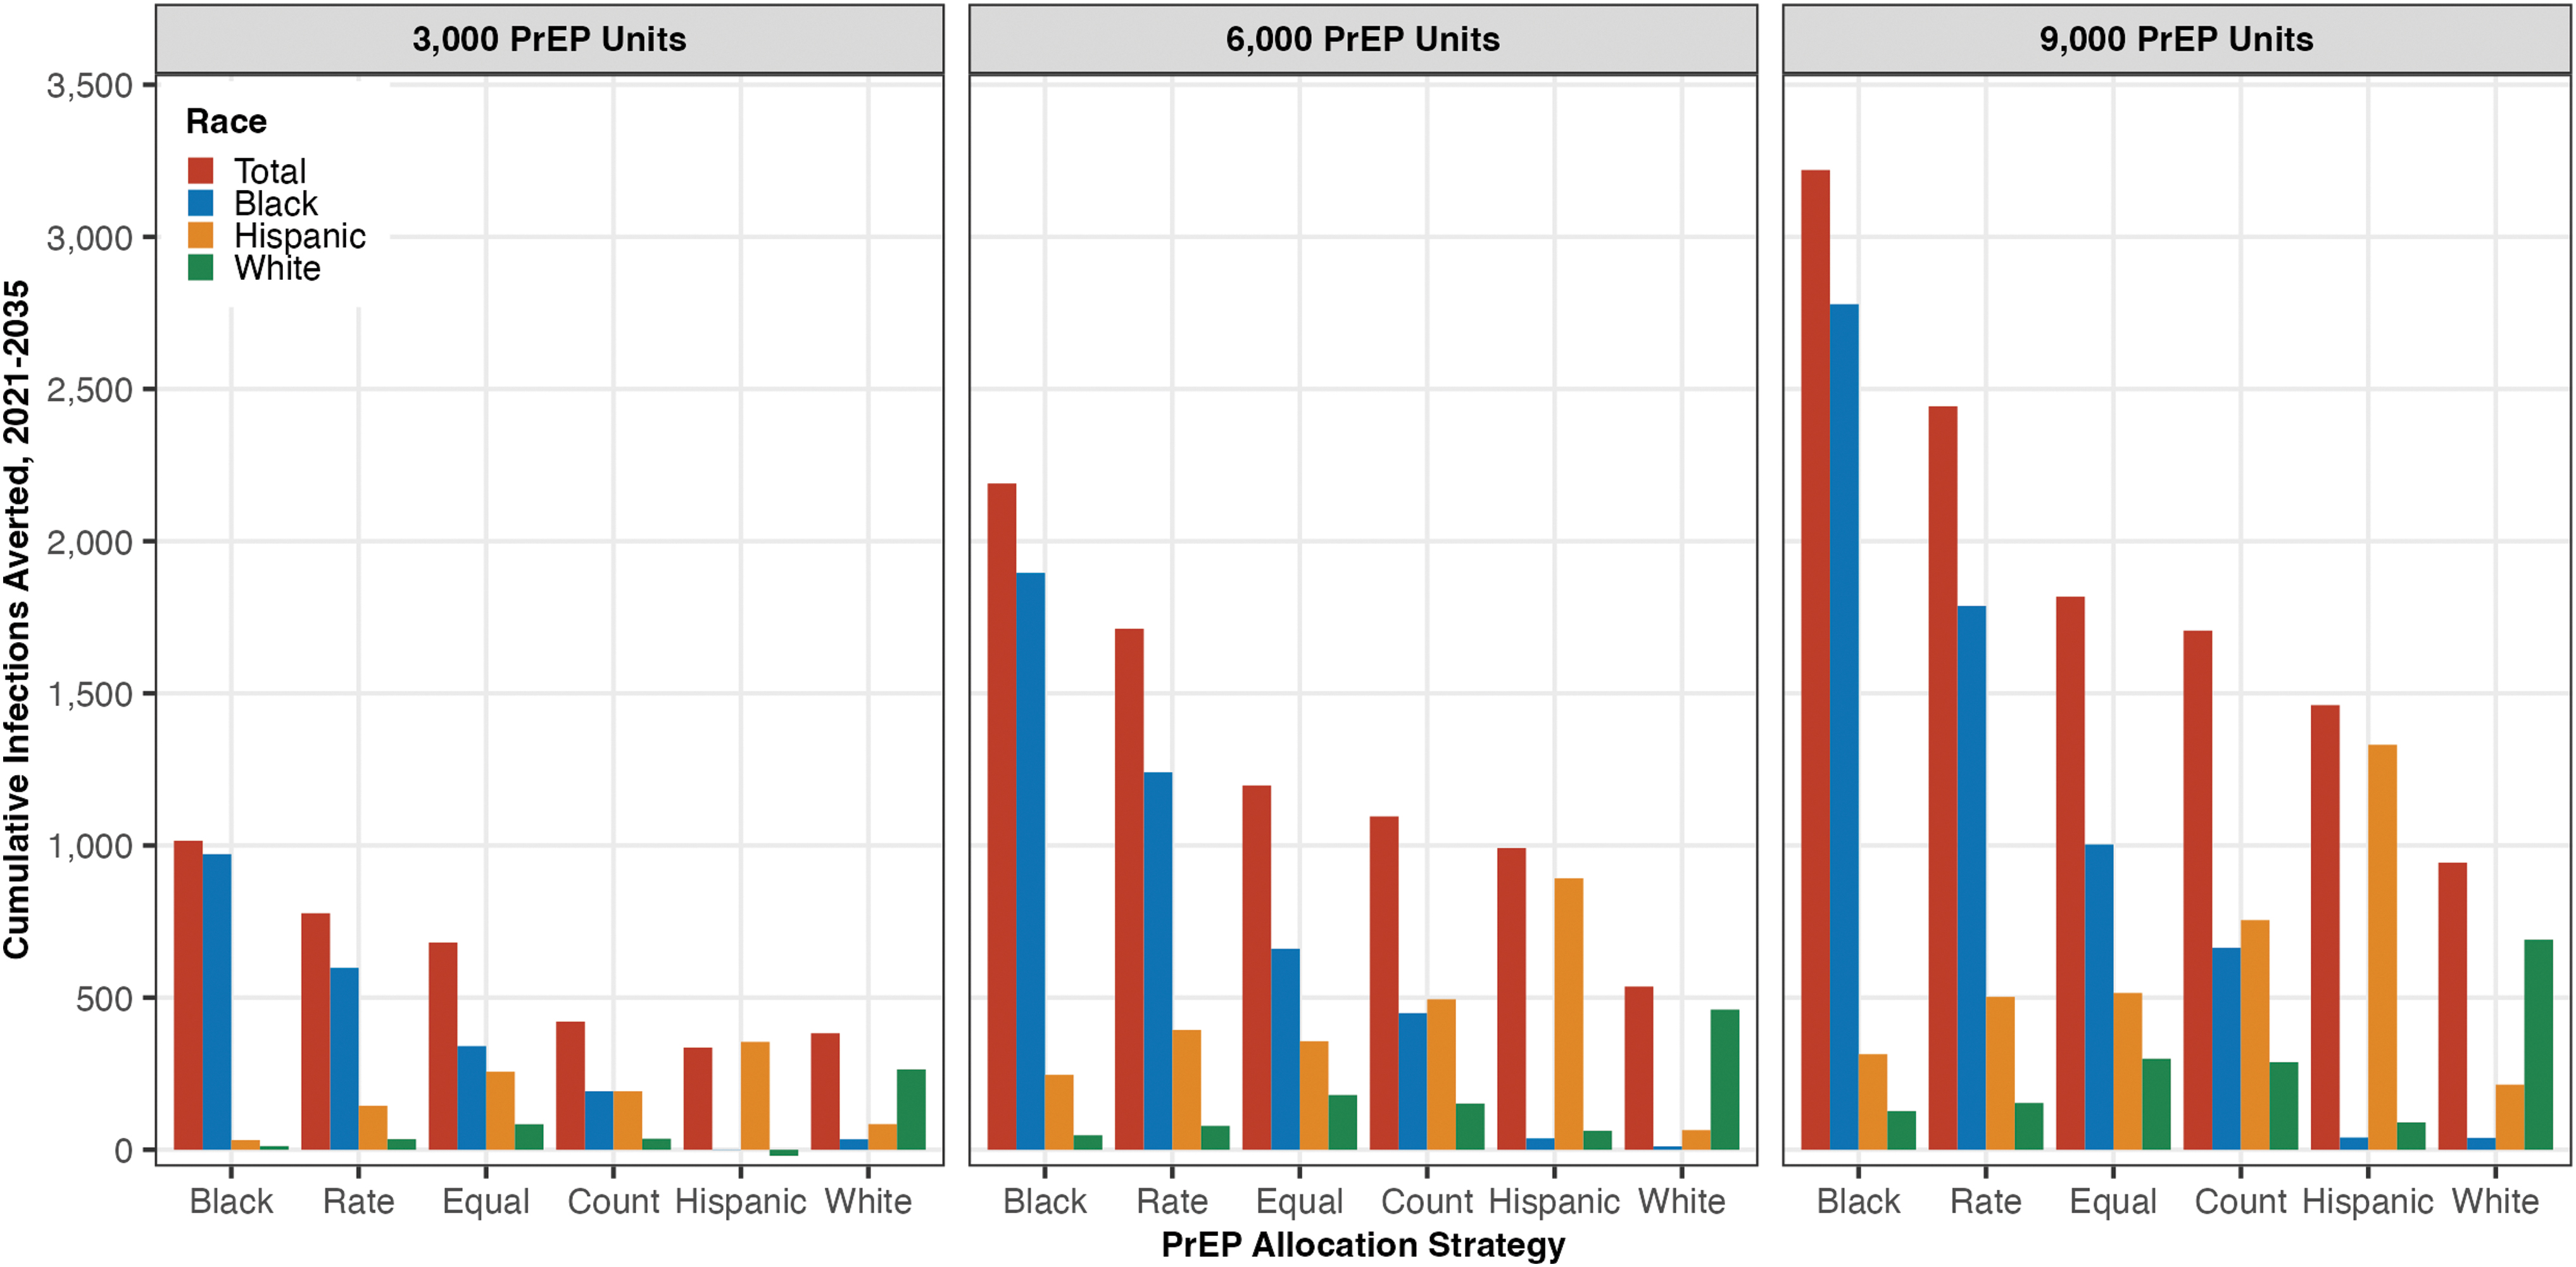
Cumulative infections averted by race/ethnicity. Cumulative infections averted for all simulated policies (3000, 6000, or 9000 annual additional PrEP coverage levels and across allocation strategies). Bars indicate where the benefit was observed in the total population and by race/ethnicity (Black, Hispanic, or White). See Supplementary Table S13 for values and standard errors and Supplementary Fig. S7 for incidence trends over time. PrEP, pre-exposure prophylaxis.
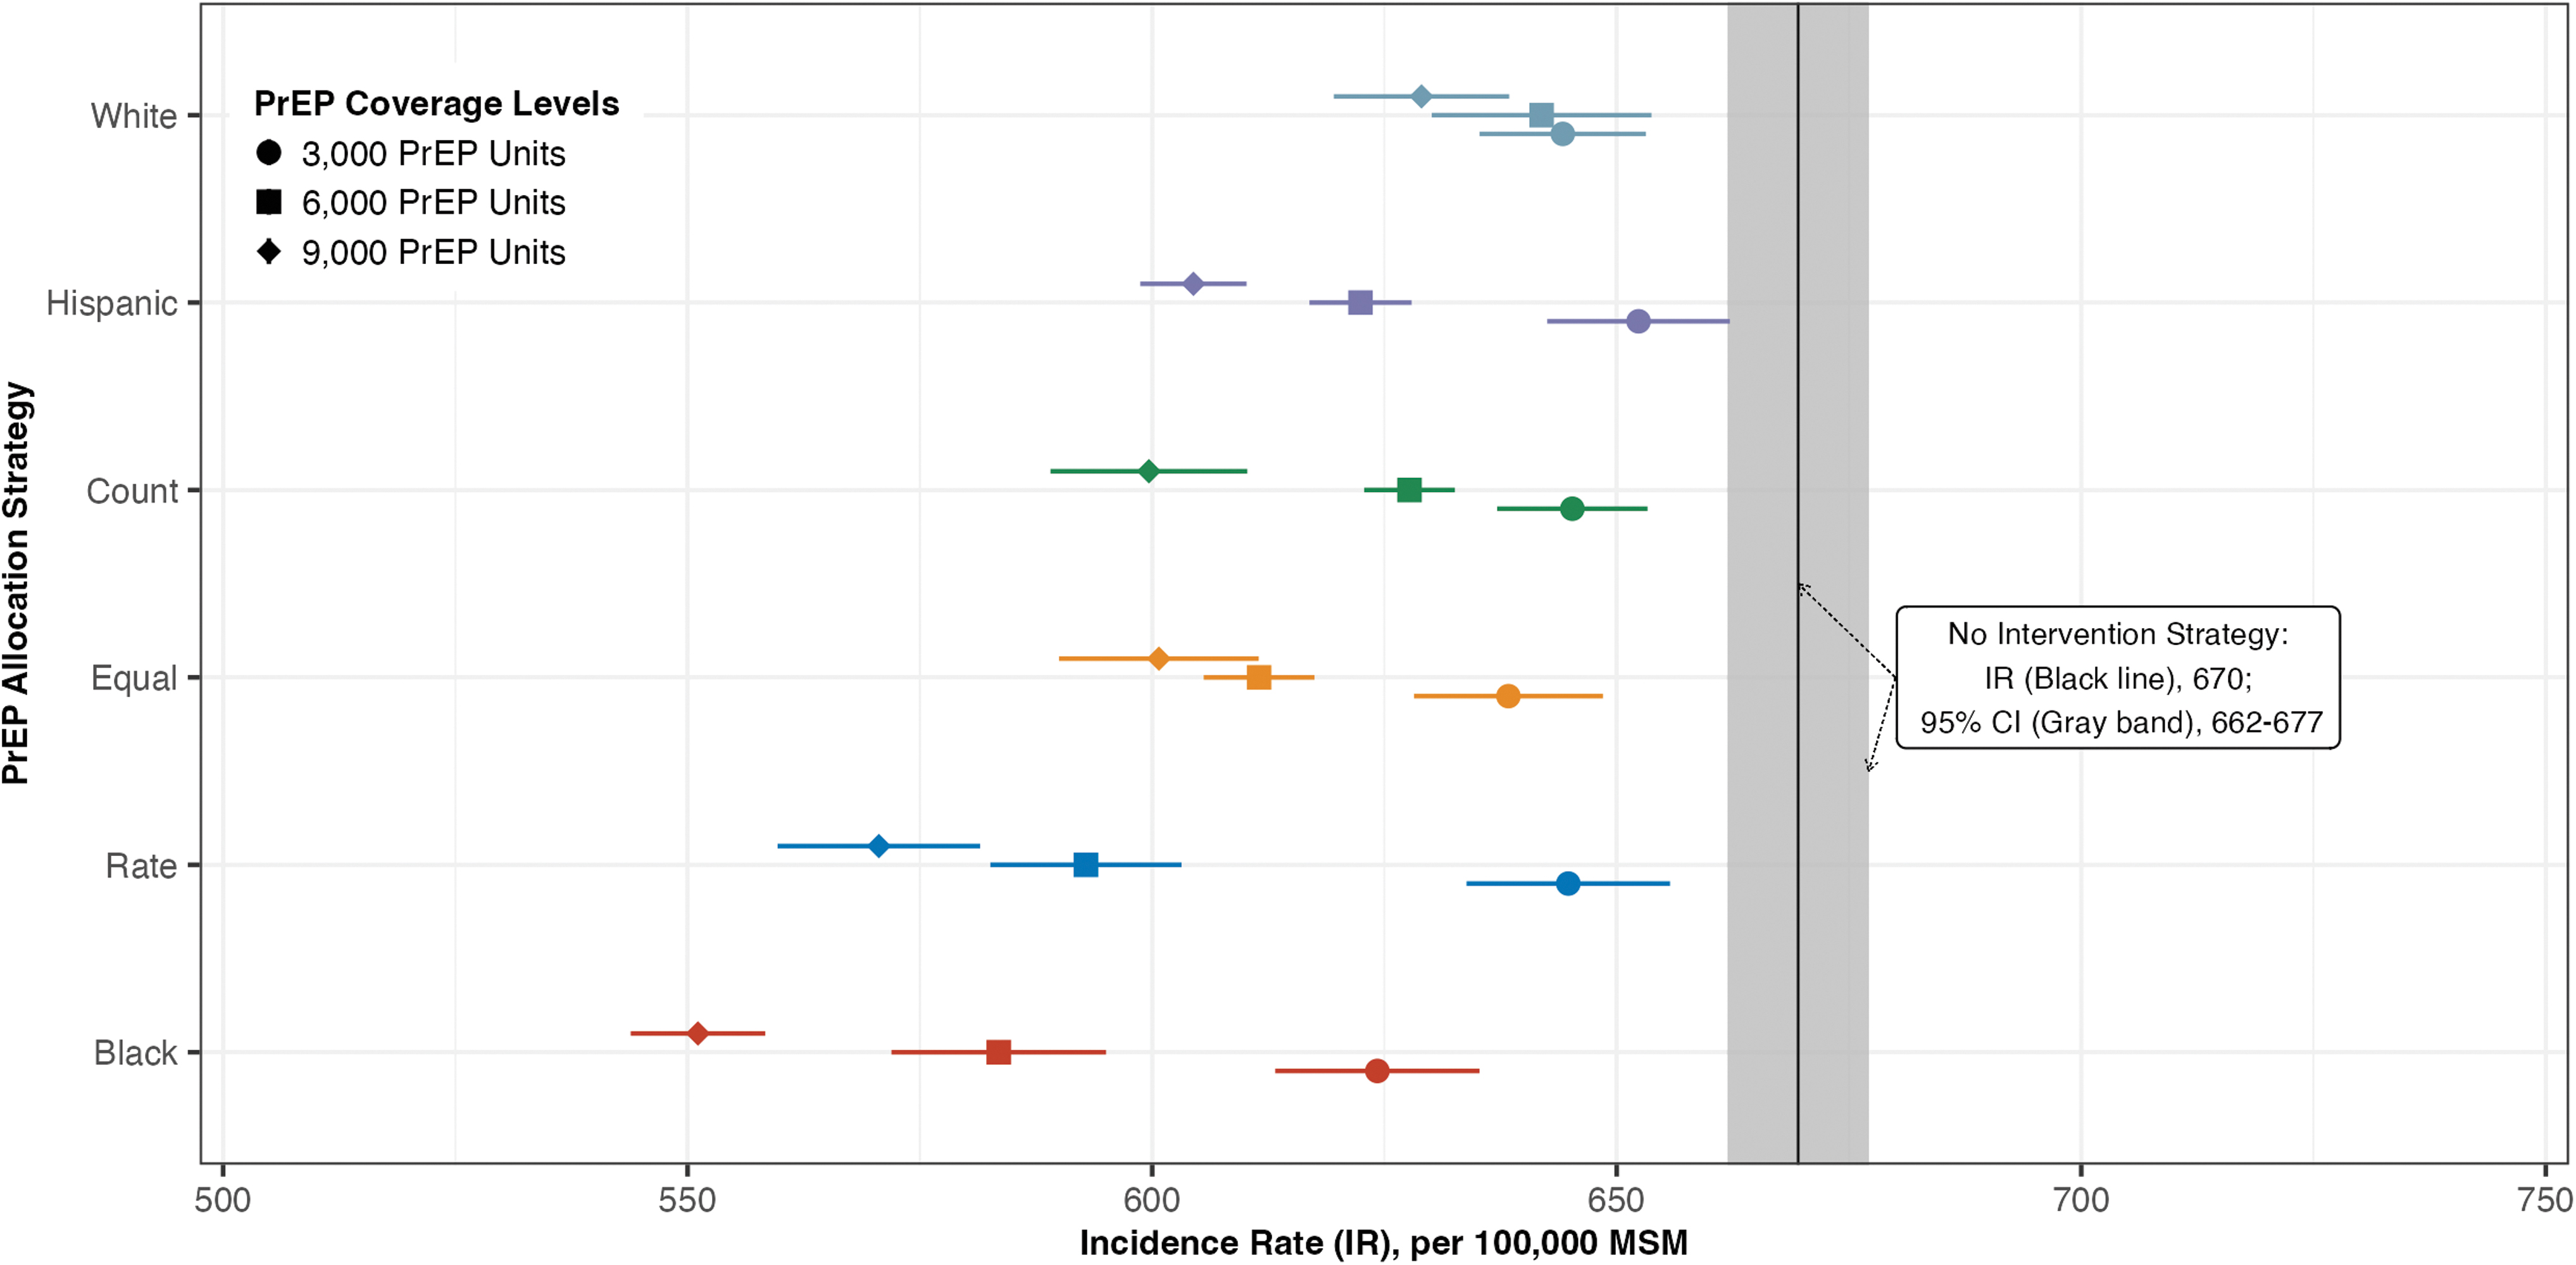
Incidence rate in 2035, by PrEP allocation strategy. The incidence rate, per 100,000 MSM in 2035 across all coverage levels and allocation strategies. All interventions reduce incidence rate, where strategies with 9000 additional annual PrEP prescriptions garnering the largest health benefits. MSM, men who have sex with men; PrEP, pre-exposure prophylaxis.
By 2035, our base analysis has PnR increasing to 5.9 with the White subpopulation having the highest PnR followed by the Hispanic and the Black subpopulations. Under all allocation quantities, we find that the overall PnR is highest under the Black and Rate allocation strategies (9.9 and 9.8, respectively), which further supports the value in prioritizing PrEP resources under these strategies. A full table of PnR in 2035 is provided in our Supplementary Section 9 and Supplementary Table S18.
Health equality impacts
Targeting only Black MSM also generated a more equal distribution of incidence rates across the population, as measured by the Gini Index. This strategy reduced the Gini Index from 0.24 (during no intervention) to 0.21 (Fig. 4). It was followed by the Rate (allocation proportional to new HIV diagnoses rates in each race/ethnic group) and Equal policies (equal quantity of PrEP for each group). By contrast, the other single-race policies, targeting Hispanic or White MSM only, led to roughly equal or higher Gini Indices (thus more disparities) compared with having no intervention. The Gini, Atkinson, and Kolm indices showed similar trends, so we only show the Gini Index outcomes in Fig. 4 (Supplementary Section 7 and Supplementary Tables S14–S16 for the others).
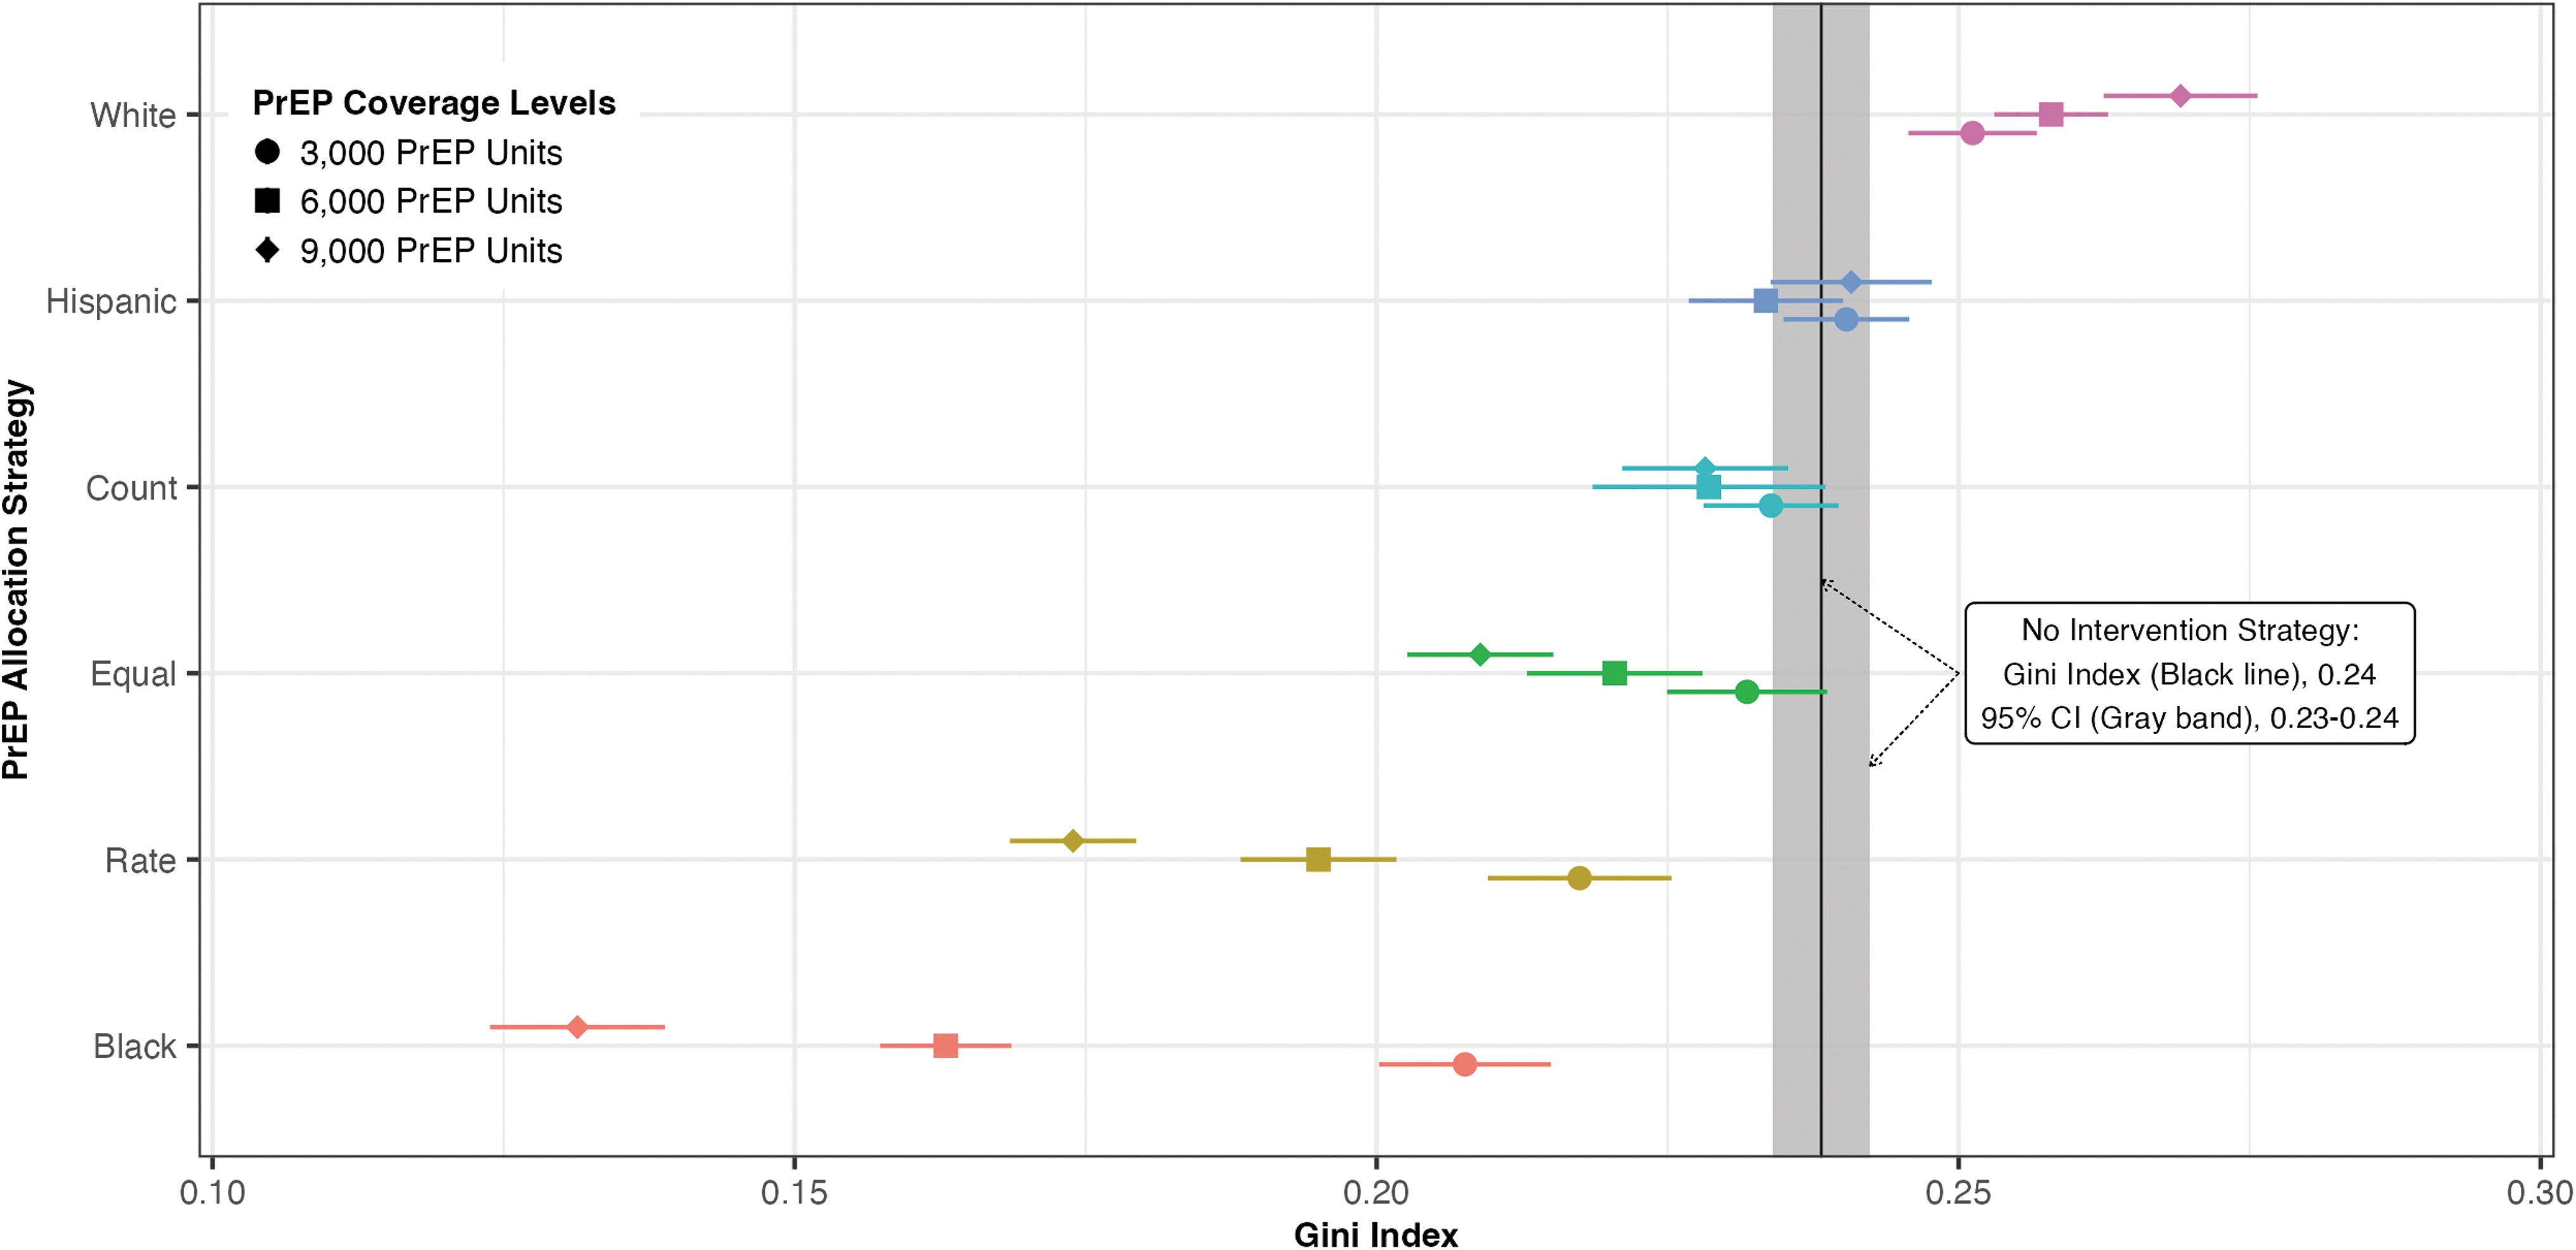
Gini Index in 2035, by PrEP allocation strategy. Lower Gini Index values indicate lower disparities between groups. All allocation strategies will likely reduce disparities except those interventions that allocate all additional PrEP coverage to White or Hispanic MSM. MSM, men who have sex with men; PrEP, pre-exposure prophylaxis.
Tradeoffs between health and health equality
Figure 5 depicts the equality impact plane, which relates the equality and health impacts of alternative interventions, under alternative PrEP coverage levels. All allocation strategies besides those targeting White MSM improved both health and equality outcomes relative to no intervention—allocations targeting White MSM reduced incidence but exacerbated disparities (thus “win–lose” interventions). Relative to no intervention, a strategy of targeting Black MSM yielded the highest reductions in the Gini Index and incidence rates. However, most allocation strategies we considered lay in the “win–win” (upper right) quadrant of the health equality impact plane, indicating that there are few policies with significant tradeoffs between the health and equality impacts of these interventions, relative to no intervention.
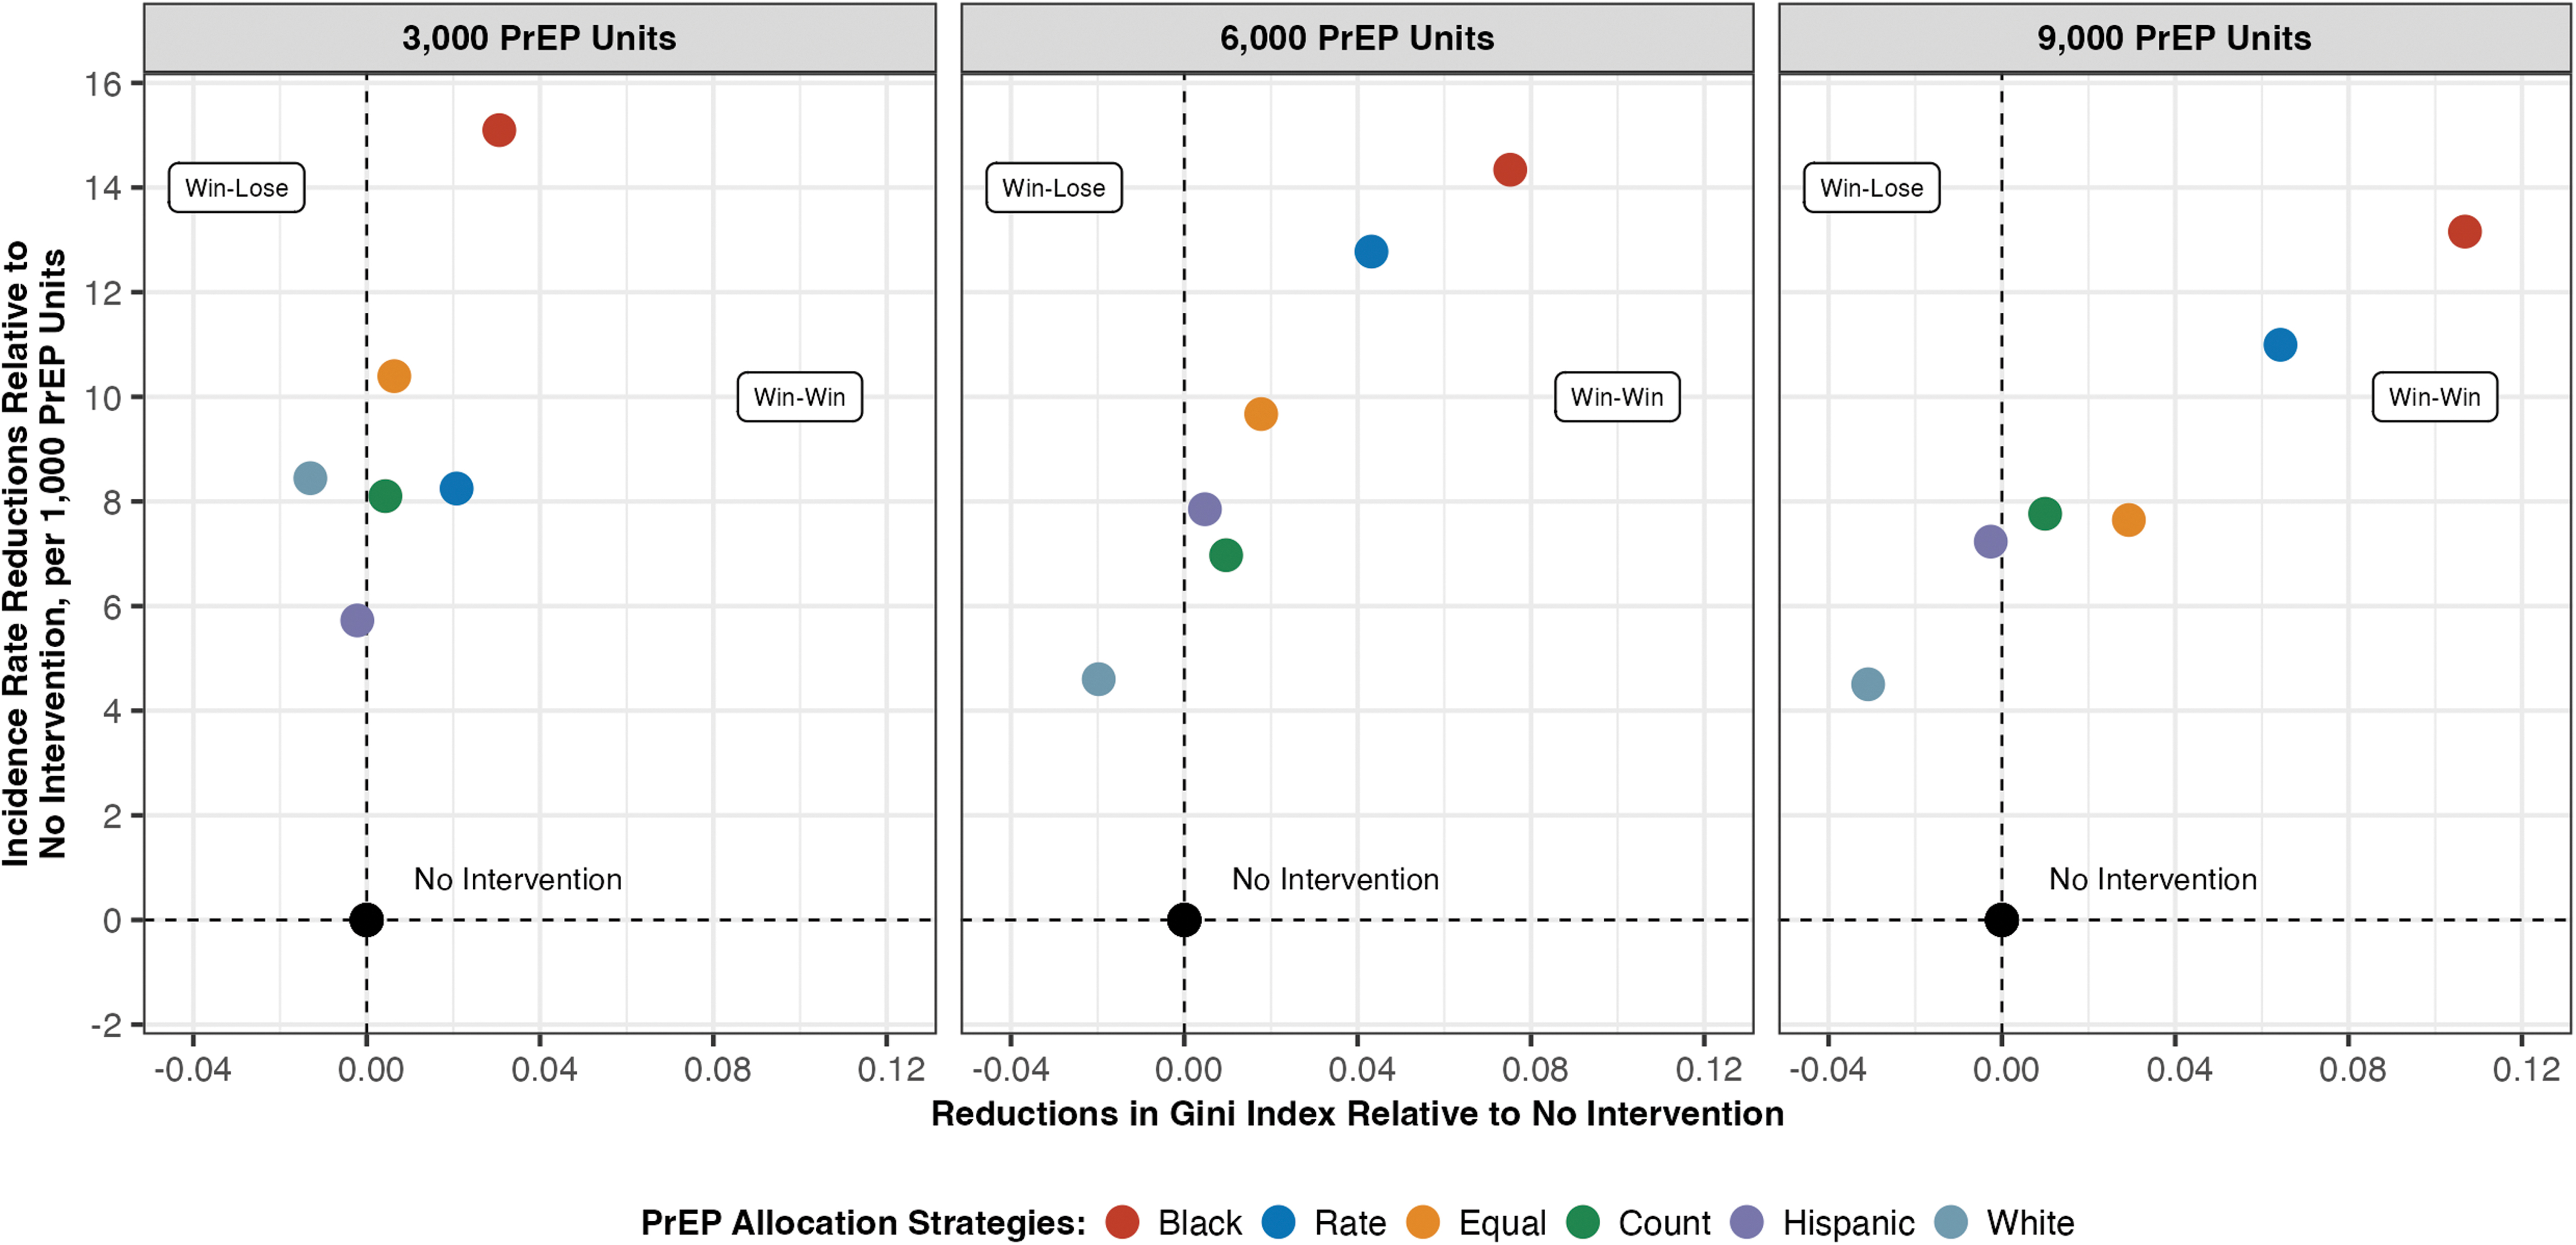
Health equality impact plane. Reduction in incidence rate versus reductions in the Gini Index relative to no intervention, by allocation strategy and coverage level. Points in the upper right quadrant of the graphs indicate “win–win” allocations, where there is no tradeoff between efficiency and equality.
Effect of coverage intensity
As health and equality impacts, and potential tradeoffs between them, may vary with the intensity of resource use, we also analyzed these outcomes across different levels of PrEP coverage (6000 and 9000 PrEP units).
Health impacts
Results suggest that, across all coverage levels and allocation strategies, expanding PrEP coverage to 9000 additional Black MSM, annually, averted the most cumulative infections from 2021 to 2035 (Fig. 2). Increasing PrEP coverage by 9000 additional prescriptions annually to Black MSM would avert ∼3140 HIV infections by the year 2035, with incidence rates of ∼720, 650, and 350 per 100,000 among Black, Hispanic, and White MSM, respectively, in 2035. This represents a much smaller disparity gap than the projected incidence with no policy intervention (1940, 680, and 380 per 100,000 MSM in these groups, respectively). As anticipated, larger increases in PrEP coverage resulted in greater overall health benefits under all PrEP allocation strategies. At higher PrEP coverage levels among Black MSM, there were “spillover” effects to Hispanic MSM as secondary infections among Hispanic MSM are averted. By contrast, PrEP allocation strategies prioritizing Hispanic MSM only or White MSM only did not yield similar spillover effects.
Strategies that prioritized expanding PrEP coverage to White MSM only were more effective than the one prioritizing coverage expansion to Hispanic MSM at a low PrEP coverage level (3000 PrEP units), but not at higher (6000 and 9000 units) coverage levels. By 2035, the PrEP-to-need results were consistent across all allocation levels. The Black and Rate allocations continued to have the highest PnR at both the 6000 level (14.4 and 14, respectively) and the 9000 level (19.3 and 18.9 respectively). Additionally, we found that the White, Hispanic, Equal, and Count allocations resulted in similar PnR at the 3000 level (∼9.5), but at the 6000 and 9000 levels, only the Hispanic, Equal, and Count polices had similar PnR, whereas the White PnR was lower at these 2 levels. A complete table can be found in the Supplementary Section 9 and Supplementary Table S18.
Health equality impacts
Using all equality metrics, we found that the policy targeting Black MSM with 9000 additional PrEP resulted in the most equal outcomes of the policies we evaluated in 2035. Targeting Black MSM for PrEP reduced the Gini Index to 0.13 in 2035 from 0.24 with no intervention, a 46% reduction. Within the distributed allocations (Equal, Count, and Rate), the Rate policy—allocation proportional to new HIV diagnoses in that group—distributed most of the PrEP to Black MSM, whereas the Count policy—allocation proportional to size of PLWH population in that group—distributed the least to Black MSM. At all three coverage levels, the Rate policy averted more cumulative infections than the other distributed policies. At the 9000 PrEP level, it resulted in ∼2500 cumulative cases averted and final incidence rates of 1090, 630, and 350 per 100,000 in 2035 among Black, Hispanic, and White MSM, respectively.
Tradeoffs between health and health equality impacts
Results from the health equality impact plane (Fig. 5) suggest that health and equality tradeoffs remain similar as PrEP coverage increase, with allocations where Black MSM are prioritized for additional PrEP providing the most benefit even at higher coverage levels. As in the case with a 3000 PrEP coverage level, this was followed by the Rate allocation when assessing reductions in both incidence rate, per PrEP unit, and Gini Index simultaneously. At higher coverage levels, prioritizing White or Hispanic MSM for additional PrEP remained ineffective at reducing disparities, despite improving incidence rates (these policies remained in the “win–lose” quadrant in Fig. 5).
Sensitivity analyses results
Sensitivity analyses on patterns of sexual contacts showed that the number of cumulative infections averted varied widely depending on mixing assumptions. However, our general findings always held true: the Black allocation strategy had the most cumulative infections averted for the single race policies and that the rate policy had the most cumulative infections averted for the distributed policies. Gini Indices also remained consistent in that the Black allocation strategy and rate allocation strategy have the greatest reductions on disparities. The Gini Index values found with no intervention under empirical, assortative, and uniform partnerships were 0.24, 0.45, and 0.18, respectively. At the 3000 level, the Black allocation reduced these to 0.21, 0.38, and 0.16, respectively, whereas in the Rate allocation, the Gini Index values were reduced to 0.227, 0.41, and 0.16. A complete table of these results is presented in the Supplementary Section 8a and Supplementary Table S17.
Similarly, results from the race-specific PrEP discontinuation rate scenario did not significantly differ from our base case results. Calibration outcomes were similar and validation results remained within validation ranges. Results on the effectiveness across PrEP allocations to increase the cumulative infections averted were as expected, reducing discontinuation rates among Whites and increasing it among non-Whites increased effectiveness for allocations with more PrEP allocated to White men. At the 3000-allocation level, The Black and Hispanic Policies became less effective, with 854 and 458 cumulative infections averted, compared with 1015 and 356 in the base case, while the White policy became more effective (640 infections averted compared with 383 in the base case). The Count policy increased in the number of cumulative infections averted (606 compared with 421 in the base case), whereas the opposite was true for the Equal and Rate policies (611 and 671 cumulative infections averted instead of 681 and 771 in the base case, respectively). However, note that the Black allocation still generated the highest number of averted infections and the Rate policy remained the best performing policy among the distributed policies, as in the base case analysis.
Gini Index outcomes were also consistent with the base case. Values were higher under the Black and Rate policies, compared with the base scenario, indicating there was a smaller reduction in disparities if PrEP discontinuation varied by race/ethnicity. However, the Rate and Black policies still resulted in the lowest disparity outcomes across all allocations. Similarly, incidence rates per 100,000 MSM in 2035 show the same trends across allocations as in the base case.
In general, our sensitivity analyses indicate that while the number of cumulative infections averted and the distribution of infections across the different racial/ethnic groups are sensitive to model assumptions, ultimately the relative results across interventions were consistent with the base case, as the Black policy averted the most infections in all cases, and among the distributed allocations, the Rate policy was most effective in reducing disparities. Detailed sensitivity results can be found in Supplementary Section 8, Supplementary Figs. S4–S8.
Discussion
We developed a race/ethnicity- and age-stratified microsimulation model to assess the health and health equality impacts—and potential tradeoffs in these outcomes—of PrEP allocation strategies among MSM residing in LAC. We found that disparities in incidence rates across racial/ethnic groups will persist across our time horizon if no additional policies are implemented. While efforts in the past decade have reduced disparities, there is much work yet to be done. None of the interventions examined in this study was able to eliminate disparities in incidence rates by 2035, despite doubling PrEP from 2020 levels in the largest interventions.
However, we were able to identify interventions that would simultaneously improve health outcomes and reduce health inequalities. Our findings indicate that PrEP allocation strategies could substantially influence health and inequality outcomes. Despite this, our results suggest that many strategies can improve both health and equality, with no tradeoff between the two, demonstrating that even suboptimal PrEP allocation strategies can still make substantial strides in both metrics.
Overall, our results suggest that a policy targeting Black MSM for PrEP can generate the most cumulative reduction in new cases over the next 15 years—and that doing so would also reduce the gap between incidence rates between Black MSM and MSM of other racial/ethnic groups. This finding is consistent across all three PrEP coverage levels evaluated in this study, with the most benefit seen at the largest coverage level. Of the policies that do not target only a single race/ethnicity, the Rate policy, which allocates PrEP by diagnosis rate in 2021, averts the most HIV infections and decreases disparities the most.
Of the policies we considered, there are many “win–win” PrEP allocation strategies that improve both equality and health impacts over no intervention regardless of coverage intensity. Policies targeting Black MSM garnered the highest reductions in both incidence rate and disparities within each PrEP coverage level. In general, we found that all policies besides targeting White MSM improved both overall incidence rate and the Gini Index, suggesting that a tradeoff between equality in outcomes and effectiveness is generally not a concern in the interventions we evaluated. This is likely because policies that target by race/ethnicity reduce incidence rates the most in groups that bear disproportionate disease burdens. Examining disparity measures on a health equality impact plane can quantify whether there is a tradeoff between policy priorities—and for which strategies there is not.
These results show that advancing toward equality in outcomes, and lower incidence over the entire population, can be best achieved through distinctly unequal targeting of PrEP. This highlights the possible discrepancy between equality in outcomes versus equality in coverage, and it is an example that careful application of unequal policies may be required to achieve equal outcomes in the HIV/AIDS context. In our assessment, distributing PrEP resources based on disparities in incidence rate resulted in better outcomes than distributing PrEP resources based on differences in prevalence.
These results are dependent on our model inputs and assumptions, as demonstrated by our sensitivity analysis around mixing patterns and PrEP discontinuation. Changes in mixing patterns greatly change model projections of incidence and disparities. The likelihood of averting cases in other racial/ethnic groups when one group is targeted depends strongly on partnership patterns. Additional sensitivity analysis was run using differential PrEP discontinuation between White and non-White race/ethnicity. Magnitude of infections averted and distribution of infections averted across racial/ethnic groups showed some differences, whereas trends in terms of Gini Index remained consistent. Regardless of mixing patterns or having different PrEP discontinuation by race/ethnicity, we found that targeting Black MSM for additional PrEP prescriptions continued to result in the largest cumulative infections averted and the lowest disparities between groups in 2035, suggesting that this result is robust to even extreme changes in model assumptions. The rate policy (which also prioritizes Black MSM) was the second-most effective strategy.
This study has several limitations. First, we drew from multiple data sources, including county-specific surveillance data for MSM, published literature and models, CDC reports, and others at various levels of stratification by age, race/ethnicity, and treatment. The use of disparate data sources can result in possible data discrepancies and there may be uncertainty in the surveillance data as reporting practices change over time. Second, due to lack of data on multiple characteristics simultaneously, we used a quadratic programming approach to infer the joint distributions, assumed independence, or assumed that the parameter did not vary by demographic characteristics. While this approach may not perfectly accurately capture all demographically correlated trends, it provides our best estimate given available data. Third, we used nonrepresentative survey data on partnerships to define the partnership matrix, as this was the best data available. We mitigated this limitation by conducting sensitivity analyses on partnership patterns, which revealed that cumulative infections averted can vary substantially under different partnership mixing.
Fourth, we did not consider mental health status, substance use, housing status, and other risk factors (beyond age and race/ethnicity) that have been shown to influence HIV risk, ART adherence, and PrEP uptake. Incorporating these additional factors would require substantially more data, much of which may not be available. Additionally, the influence of these factors may be indirectly captured in the model, insofar as they are correlated with age and race/ethnicity. Finally, we were unable to capture multiracial individuals in the model. Unfortunately, there was limited data on transmission, testing, viral suppression, and other values specific to multiracial individuals, and therefore we could not explicitly include them in the model. As such, our results should not be interpreted as only needing to target Black, Hispanic, and White racial/ethnic groups for PrEP.
Despite these limitations, our analysis provides important insights into the relationship between effectiveness and disparity reduction across a variety of PrEP policies. We quantified equality of outcomes using widely accepted indices, providing comparable metrics for evaluating the relative equality benefits of the policies evaluated. This allowed us to examine the relationship between equality and overall incidence, which showed that most policies we examined were able to reduce inequality and incidence simultaneously. In addition, we found that targeting Black MSM dominated other policies at all intervention levels we considered. Our model outcomes highlight the benefits of targeting racial groups that are disproportionately burdened. However, the model does not consider how doing so may also translate to improvements in engagement and adherence behavior outside of PrEP as these populations become more prioritized after historically being neglected. It is thus possible that such cascading effects will result in even larger benefits.
We improved upon existing models by disaggregating by age and race/ethnicity and incorporating empirical data on partnership mixing patterns. While imperfect, this approach may capture partnership mixing patterns that are influenced by a variety of social factors, including segregation and racism. This treatment of mixing within the model therefore represents a substantial advance in how sexual partnerships are represented. These partnership dynamics also allow for a more nuanced understanding of the downstream effects of averted HIV infections through PrEP uptake. To the best of our knowledge, this microsimulation model is also the first to reflect LAC demographics, with stratifications for age and race/ethnicity.
Models like this one can enable policymakers to assess tradeoffs between the dual goals of reducing overall HIV burden and reducing inequalities. Simultaneous achievement of these aims is integral toward achieving EHE objectives at the local level. However, health gains and inequality reduction objectives must be balanced against the costs of policies and programs. These may include, for example, differential costs related to outreach to different population subgroups and distribution of resources across the portfolio of HIV prevention and treatment strategies. Recommended strategies may differ after consideration of these tradeoffs. The insights from this analysis will be useful in informing the discussion around strategies to reduce racial/ethnic disparities in HIV/AIDS burden, prevention, and care.
Authors' Contributions
All authors have read and approved the final article.
A.N.: Conceptualization, Data curation, Formal analysis, and Methodology, Software, Validation, Visualization, Writing (original draft), and Writing (review and editing).
E.F.D.: Conceptualization, Funding acquisition, Methodology, Validation, Visualization, and Writing (review and editing).
W.G.: Conceptualization, Data curation, Validation, and Writing (review and editing).
C.M.: Conceptualization, Funding acquisition, Project administration, Validation, and Writing (review and editing).
A.L.: Conceptualization, Funding acquisition, Project administration, Validation, and Writing (review and editing).
I.W.H.: Conceptualization, Funding acquisition, Project administration, Validation, and Writing (review and editing).
S.S.: Conceptualization, Data curation, Funding acquisition, Methodology, Validation, Project administration, Supervision, Writing (original draft), and Writing (review and editing).
Footnotes
Acknowledgments
All contributors qualify as authors for this work. The authors would like to acknowledge Citina Liang, who contributed code for the outcome metrics in this analysis.
Additional Files
Additional file 1: Online Supplement. This file contains technical details regarding the model development process, validation, and additional tables and graphics that supplement the results presented in the article. The online supplement can also be found at
Author Disclosure Statement
No competing financial interests exist.
Funding Information
This work was supported by the California HIV/AIDS Research Program (Grants RP15-LA-007, H21PC3446), the UCLA Center for HIV Identification, Prevention and Treatment Services (Grant MH058107), the UCLA Center for AIDS Research (Grant #5P30AI028697), UCLA AIDS Institute and USC Keck School of Medicine Seed Grant for Cross-Campus Collaboration, and the NIH/National Center for Advancing Translational Science UCLA CTSI (Grant UL1TR000124). The funding sources had no role in the study design, data analysis and interpretation, decision to publish, or preparation of the article.
Supplementary Material
Supplementary Data
Supplementary Table S1
Supplementary Table S2
Supplementary Table S3
Supplementary Table S4
Supplementary Table S5
Supplementary Table S6
Supplementary Table S7
Supplementary Table S8
Supplementary Table S9
Supplementary Table S10
Supplementary Table S11
Supplementary Table S12
Supplementary Table S13
Supplementary Table S14
Supplementary Table S15
Supplementary Table S16
Supplementary Table S17
Supplementary Table S18
Supplementary Figure S1
Supplementary Figure S2
Supplementary Figure S3
Supplementary Figure S4
Supplementary Figure S5
Supplementary Figure S6
Supplementary Figure S7
Supplementary Figure S8
References
Supplementary Material
Please find the following supplemental material available below.
For Open Access articles published under a Creative Commons License, all supplemental material carries the same license as the article it is associated with.
For non-Open Access articles published, all supplemental material carries a non-exclusive license, and permission requests for re-use of supplemental material or any part of supplemental material shall be sent directly to the copyright owner as specified in the copyright notice associated with the article.