
Abstract
Introduction
S
Classical Detection of miRNAs
Even with advances in high-throughput array and sequencing technologies, qPCR remains a popular method for gene expression quantification. This is due to low cost, strong reproducibility, precision, accuracy, and widespread equipment availability (52). The proliferation of qPCR-based miRNA detection has been spurred by the qPCR industry developing a plethora of both predesigned and custom miRNA detection primers and reagents, enabling researchers to spend little, if no, time in assay design and validation. Industry players in the miRNA qPCR market include Life Technologies, Exiqon, SABiosciences/Qiagen, and others. Further, the standardization of master mixes, cycling protocols, reverse transcription (RT), and preamplification methods have enabled qPCR-based miRNA detection to be highly multiplexed and high-throughput. Indeed, several companies now offer qPCR miRNA arrays, which are advantageous to profile a large set of miRNAs simultaneously and for signature-based analyses (27). However, qPCR-based miRNA detection is not as straightforward as for other transcripts. There are unique challenges related to specificity due to the small size of miRNAs (≈22 nt) and normalization. The length typically enables only one unique primer to provide specificity, which contrasts with the two primer pairs used to provide specificity in other applications. As a remedy, locked nucleic acid (LNA) primers, providing higher specificity, can be used (47). This primer is combined with either a stem-loop primer enabling priming of RT (Life Tech) or an oligodT primer following polyadenylation (polyA) tailing (Qiagen). The relatively uniform length of the miRNAs also does not allow the product size to be used as a specificity criterion, while differences in Tm values between miRNAs add challenges when multiplexed assays are designed. Normalization is also challenging. Small nuclear RNAs (snRNAs) and small nucleolar ribonucleic acid (snoRNAs) found to be stably expressed between tissues are offered as controls by many companies (59). However, recent studies have shown that these may vary considerably in cancers (16, 44). The advantages of qPCR include needing only standard qPCR instrumentation available at most research institutions, speed and ease of running the assay, wide dynamic range, and the availability of simple data analysis tools amenable to most biologists with no need for bioinformatics expertise. In addition, due to the sensitivity of a PCR-based method, very little RNA is needed for a qPCR (typically 10 ng of complimentary deoxyribonucleic acid [cDNA]), but even lower amounts can be used with common preamplification methods (36). Versatility is also an advantage, as qPCR primer sets can be designed to measure not only mature miRNAs but also precursor and primary transcripts (52). Finally, qPCR analysis is relatively straightforward with analysis outputs providing either absolute quantification (via a standard curve) or relative quantification (via reference assays and the delta-delta Ct analysis method) (53). The main disadvantage of qPCR is the need to have a prespecified primer set that limits the platform from being a completely unbiased discovery tool. By default, qPCR can only measure known miRNAs, thus excluding un-identified miRNAs. Further, the endpoint of qPCR is signal-based detection, and, thus, the sequence of the miRNAs is not obtained should a researcher be interested in genetic variation.
Studying hypoxia adds some challenges when assaying samples by qPCR. The first challenge is the identification of a proper reference small RNA. The expression of a proper reference transcript does not change due to the experimental condition. Hypoxia has profound effects on the transcriptome of cells and, thus, has the possibility of affecting the expression of common housekeeping genes as used for messenger ribonucleic acid (mRNA) assays (6). Indeed, the expression of common mRNA housekeepers such as glyceraldehydes 3-phosphate dehydrogenase (GAPDH), beta-Actin, and Cyclophilin has been shown to change in hypoxia when compared with normoxia (63). Thus, it is prudent then to determine proper housekeeping genes, when performing hypoxia studies, by profiling the expression of various housekeepers in the cell type of interest before initiating the differential expression of qPCR studies. Since it is difficult to identify stably expressed miRNAs, it is common to use snRNAs or snoRNAs; however, Gee et al. (16) have shown that snoRNAs expression levels can vary considerably in cancer samples, at levels comparable to hypoxamirs.
In hypoxia studies, 18s RNA has been used as a reference by Kulshreshtha et al. (29); while more recently, McCormick et al. (34) used RNU44, RNU48, and RNU6B for normalization. These references need to be determined empirically and adjusted according to tissue and cell type. Alternatively, global normalization methods (37) can be applied, but these require the profiling of a large number of miRNAs. An additional challenge is the time-dependent nature of hypoxia. The expression of hypoxia-regulated genes changes with the amount of time postinduction of hypoxia. Thus, any expression measurement represents a singular point within a dynamic hypoxic system, but can be addressed by measuring the expression of target miRNAs at multiple timepoints to assess acute and delayed transcriptional effects. Third and lastly is paying attention to the fidelity of the hypoxia. For in vitro experiments, this includes ensuring that proper hypoxic conditions are kept during the experiment and during cell lysis, and for tissue-based or in vivo experiments that great care is taken to capture hypoxic regions (e.g., using a hypoxia stain). When performing qPCR experiments involving conditions that compare normoxia with hypoxia, it is good practice to confirm the up-regulation of canonical hypoxia-inducible genes as positive controls such as carbonic anhydrase IX (CA9) (43), vascular endothelial growth factor A (VEGFA) (40), and hsa-miR-210 (3). However, it is still difficult to compare results between different studies, particularly when different hypoxia conditions have been applied. Nevertheless, hsa-miR-210 has been consistently identified as up-regulated in all tissues and cell lines studies, demonstrating that it is robustly up-regulated as well as that its sequence has enabled the design of assays with a high specificity across platforms as demonstrated in Refs. (3, 7, 8, 12, 16, 18, 28, 29, 33, 34, 39, 45, 50, 62) and reviewed in Refs. (4, 5, 11, 13, 24) and others.
A second classical method for the quantification of miRNAs is the use of miRNA microarrays (32). Primarily used as a discovery tool to identify known candidate miRNAs, this method enables each sample to be profiled for a large set of miRNAs (including precursor and primary transcripts). The ability to profile thousands of known transcripts is the main advantage of microarrays. With this advantage come the challenges of hybridization-based microarray technologies. This includes very specialized instrumentation, increased cost, longer assay run time, a propensity for batch effect, and more complex analyses (51). Initially, miRNA microarrays were frequently generated in-house using oligonucleotides and spotting devices available in genomics facilities. Due to the relatively small number of miRNAs originally identified (1000<), generating one's own arrays was feasible compared with whole transcriptome arrays needing >24,000 oligonucleotides to be spotted on a slide at a high density. Commonly used oligonucleotide collections targeting miRNAs were the ones offered by Ambion, which could be easily enriched with custom designs. These were used in many hypoxia studies with considerable success (see Table 1). Later on, established providers such as Affymetrix, Agilent Technologies, Illumina, LC Sciences, and Exiqon offered microarray-based miRNA detection solutions. From these, both Agilent and Exiqon have played a role in hypoxia research (Table 1). The bioinformatics analyses for these arrays are typically performed by specialized personnel, and in addition to signal ascertainment and differential expression, the analysis should take into account background normalization (due to hybridization noise) and any batch effects (51). In addition, a disadvantage of microarrays is a limited dynamic range secondary to signal saturation on a hybridization array. Similar to qPCR, microarrays are also limited in being a completely unbiased discovery tool for the same reasons. A microarray is limited by profiling only known or putative miRNAs, and base sequence data are not always attainable.
The spectrum of cell lines and samples is indicated as well as the technologies used. The progression from spotted arrays to next-generation sequencing is obvious over these years.
HUVEC, human umbilical vein endothelial cells; LNA, locked nucleic acid; miRNA, micro ribonucleic acid; SOLiD, sequencing by oligonucleotide ligation and detection.
In addition to qPCR and microarrays, alternative methods have been developed in order to address sensitivity and specificity issues. One method utilizes fluorescently labeled LNAs to perform single-molecule quantitation with high sensitivity and specificity (41). Another platform successfully used is the Nanostring nCounter. It enables the direct detection of miRNAs using miRNA-specific fluorescent probes at a single-cell level, without amplification (61). No matter what classical method is used, whether it is amplification based, hybridization based, or single-molecule detection, an underlying principal of these classical methods is that only known miRNAs can be profiled, and base-sequence data cannot be interrogated. To address these limitations, a newer technology is needed.
Next-Generation Sequencing of miRNAs
To answer some of the limitations discussed earlier, next-generation sequencing has become an increasingly popular method for miRNA profiling (21). This method is a complete discovery tool, as a priori knowledge of the miRNA is not needed, and every small RNA (typically 10–40 nucleotides) is sequenced. Thus, in addition to miRNAs, next-generation sequencing provides the quantification of a variety of small RNA species. Further, sequence information is derived, enabling a more specialized analysis into the role of SNPs/indels or somatic mutations in miRNA biology (17). Another important advantage is that next-generation sequencing provides accurate quantification and differential expression with a wide-dynamic range (58).
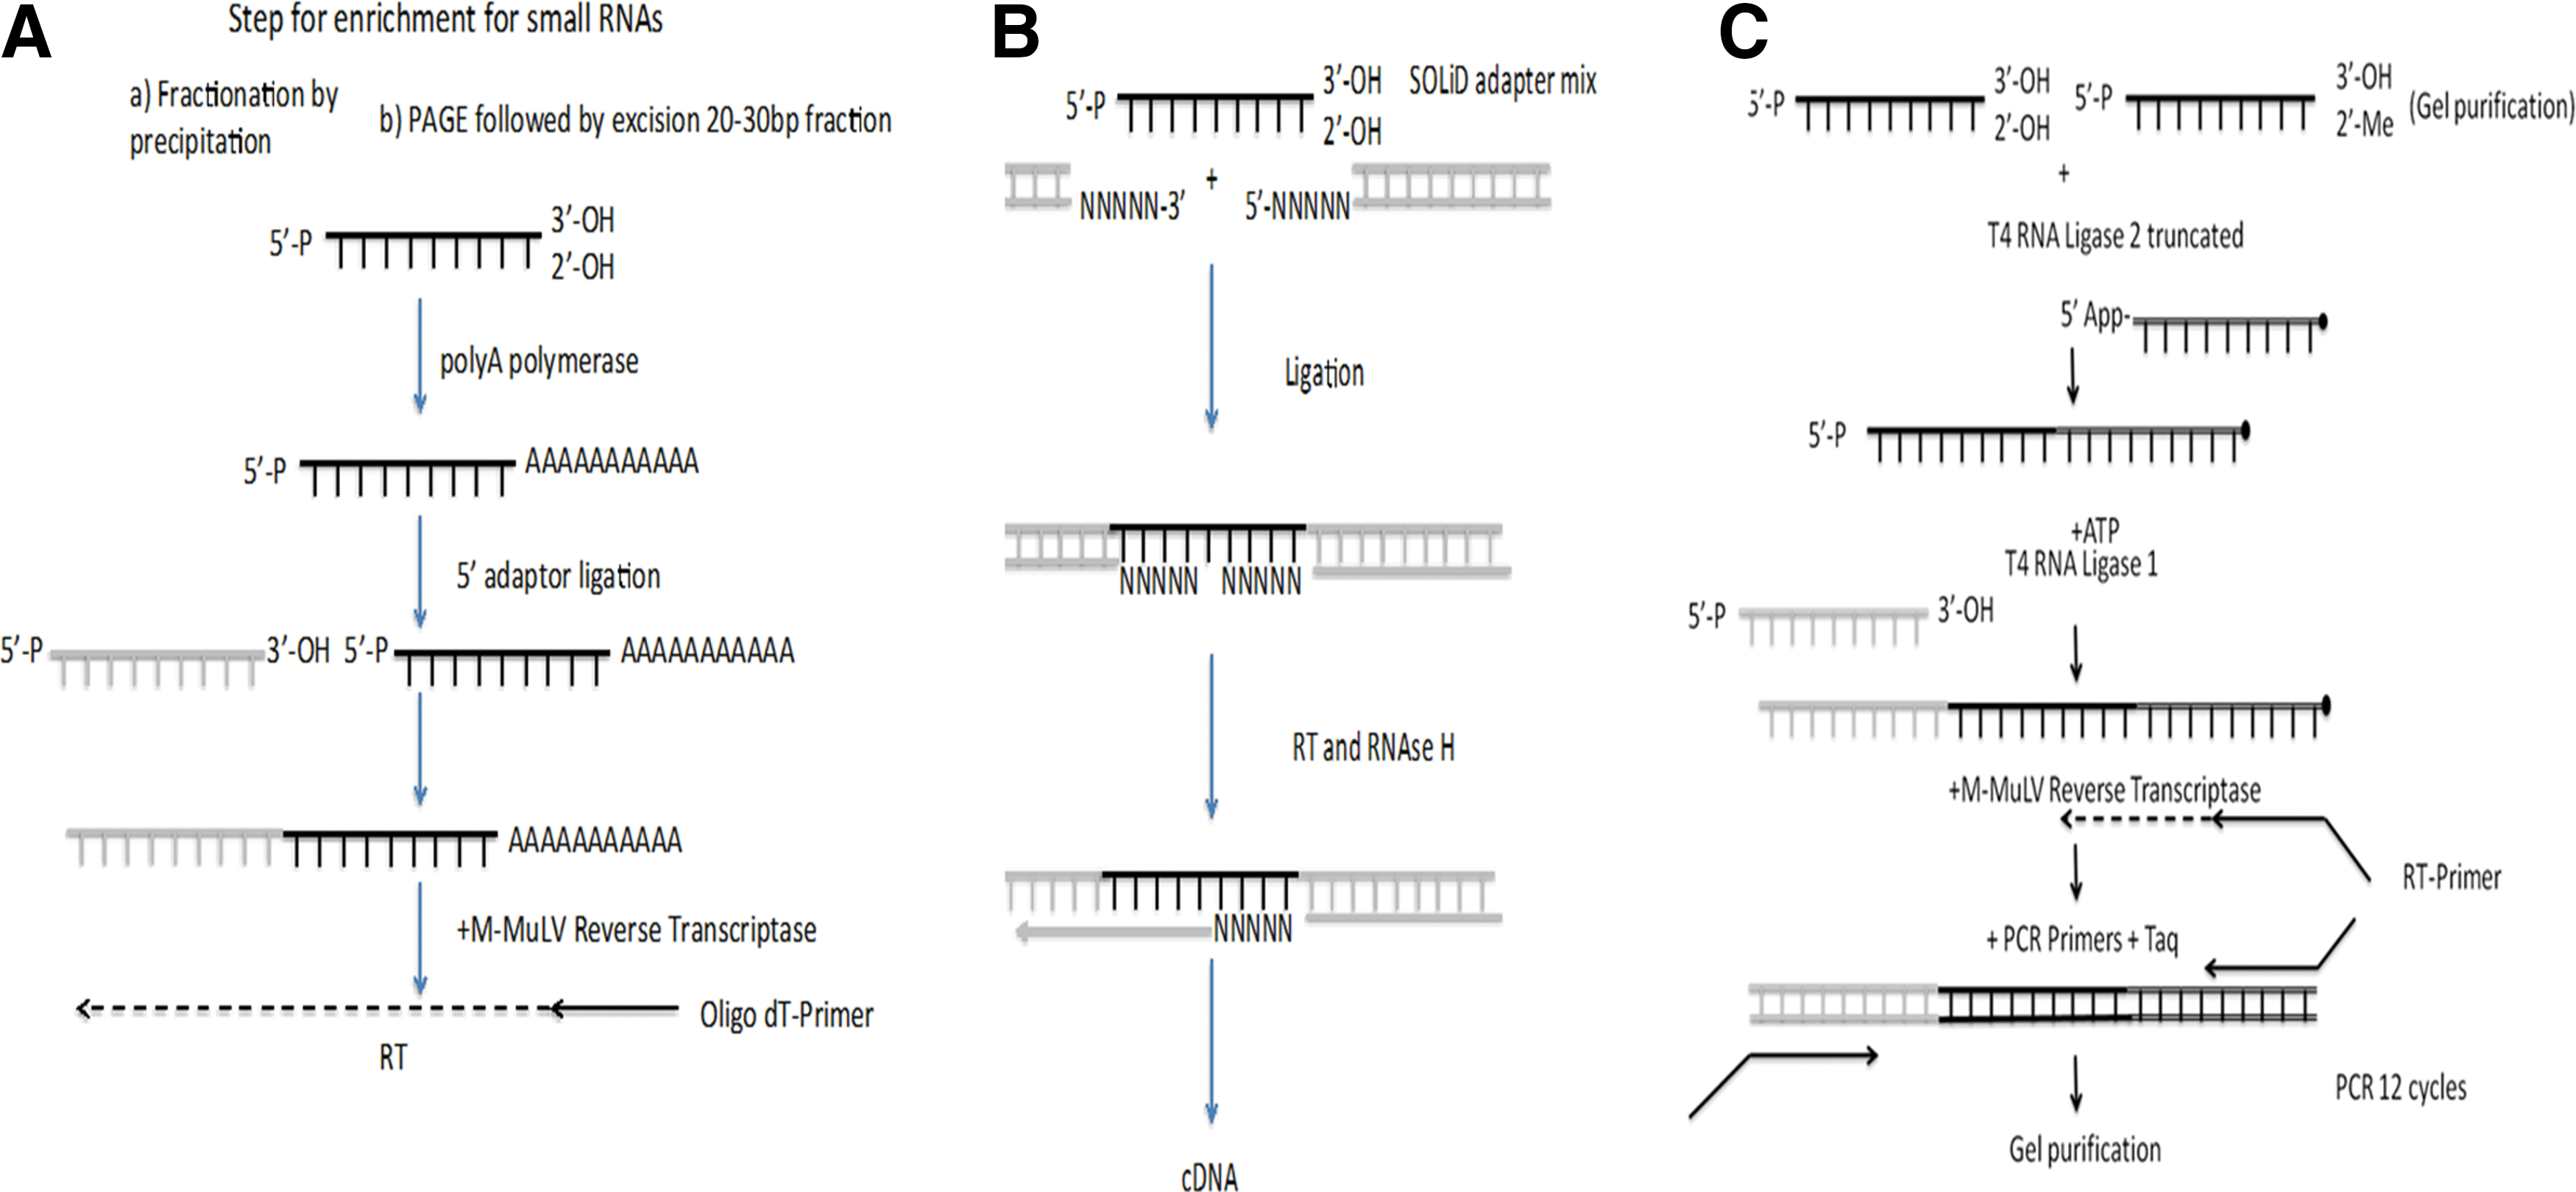
Protocols for small RNA library preparation have been continuously optimized. Each library preparation method has its own intricacies (31), which are based on either extending the 3′ end of the miRNAs by adding a polyA tail, or by ligating a mix of 5′ and 3′ adaptors with degenerate 5′ and 3′ overhangs (Fig. 1A, B respectively). Alternatively, library preparation can take advantage of the fact that the miRNAs have a 5′ phosphate and 3′ hydroxyl group that enables the ligation of specific adaptors added in separate successive steps: first, the 3′ adapter and then in a separate ligation step, the 5′ adapter (see Fig. 1C). This strategy is adopted by Illumina and is commonly used. The use of a mutated truncated RNA ligase for the ligation of the 3′ adapter, which is already adenylated at the 5′ end, without the addition of adenosine triphosphate (ATP), is able to minimize artifacts (56). Furthermore, it has been shown that by optimizing the ligation conditions and using a truncated ligase, it is possible to ligate adapters with good efficiency to small RNAs that are 2-O-methyl modified at their 3′ end as found in plant miRNAs and piRNAs (38). After adaptor ligation, the library is reverse transcribed, PCR amplified, and then purified. Additional steps can be introduced in order to deplete adaptor artifacts using LNA oligonucleotides at the RT step and, thus, increase efficiency in library preparation (26). Still, microRNA-seq library preparation had to overcome the challenge of preferential ligation linked to adaptor ligation using RNA ligase and a relatively low complexity mix of insert miRNAs compared with the preparation of mRNA or genomic DNA libraries. These sequence preferences lead to distortions due to the over-representation of particular miRNAs in the libraries and the under-representation of others. Effective countermeasures have been developed, and these include the use of pools of 5′ adaptor molecules and 3′ adaptors with four random nucleotides at the site of ligation (25). In addition to biases related to the library preparation protocol, further biases result from inherent biases in the sequencing method applied (Roche GS FLX, AB SOLiD, or Illumina).
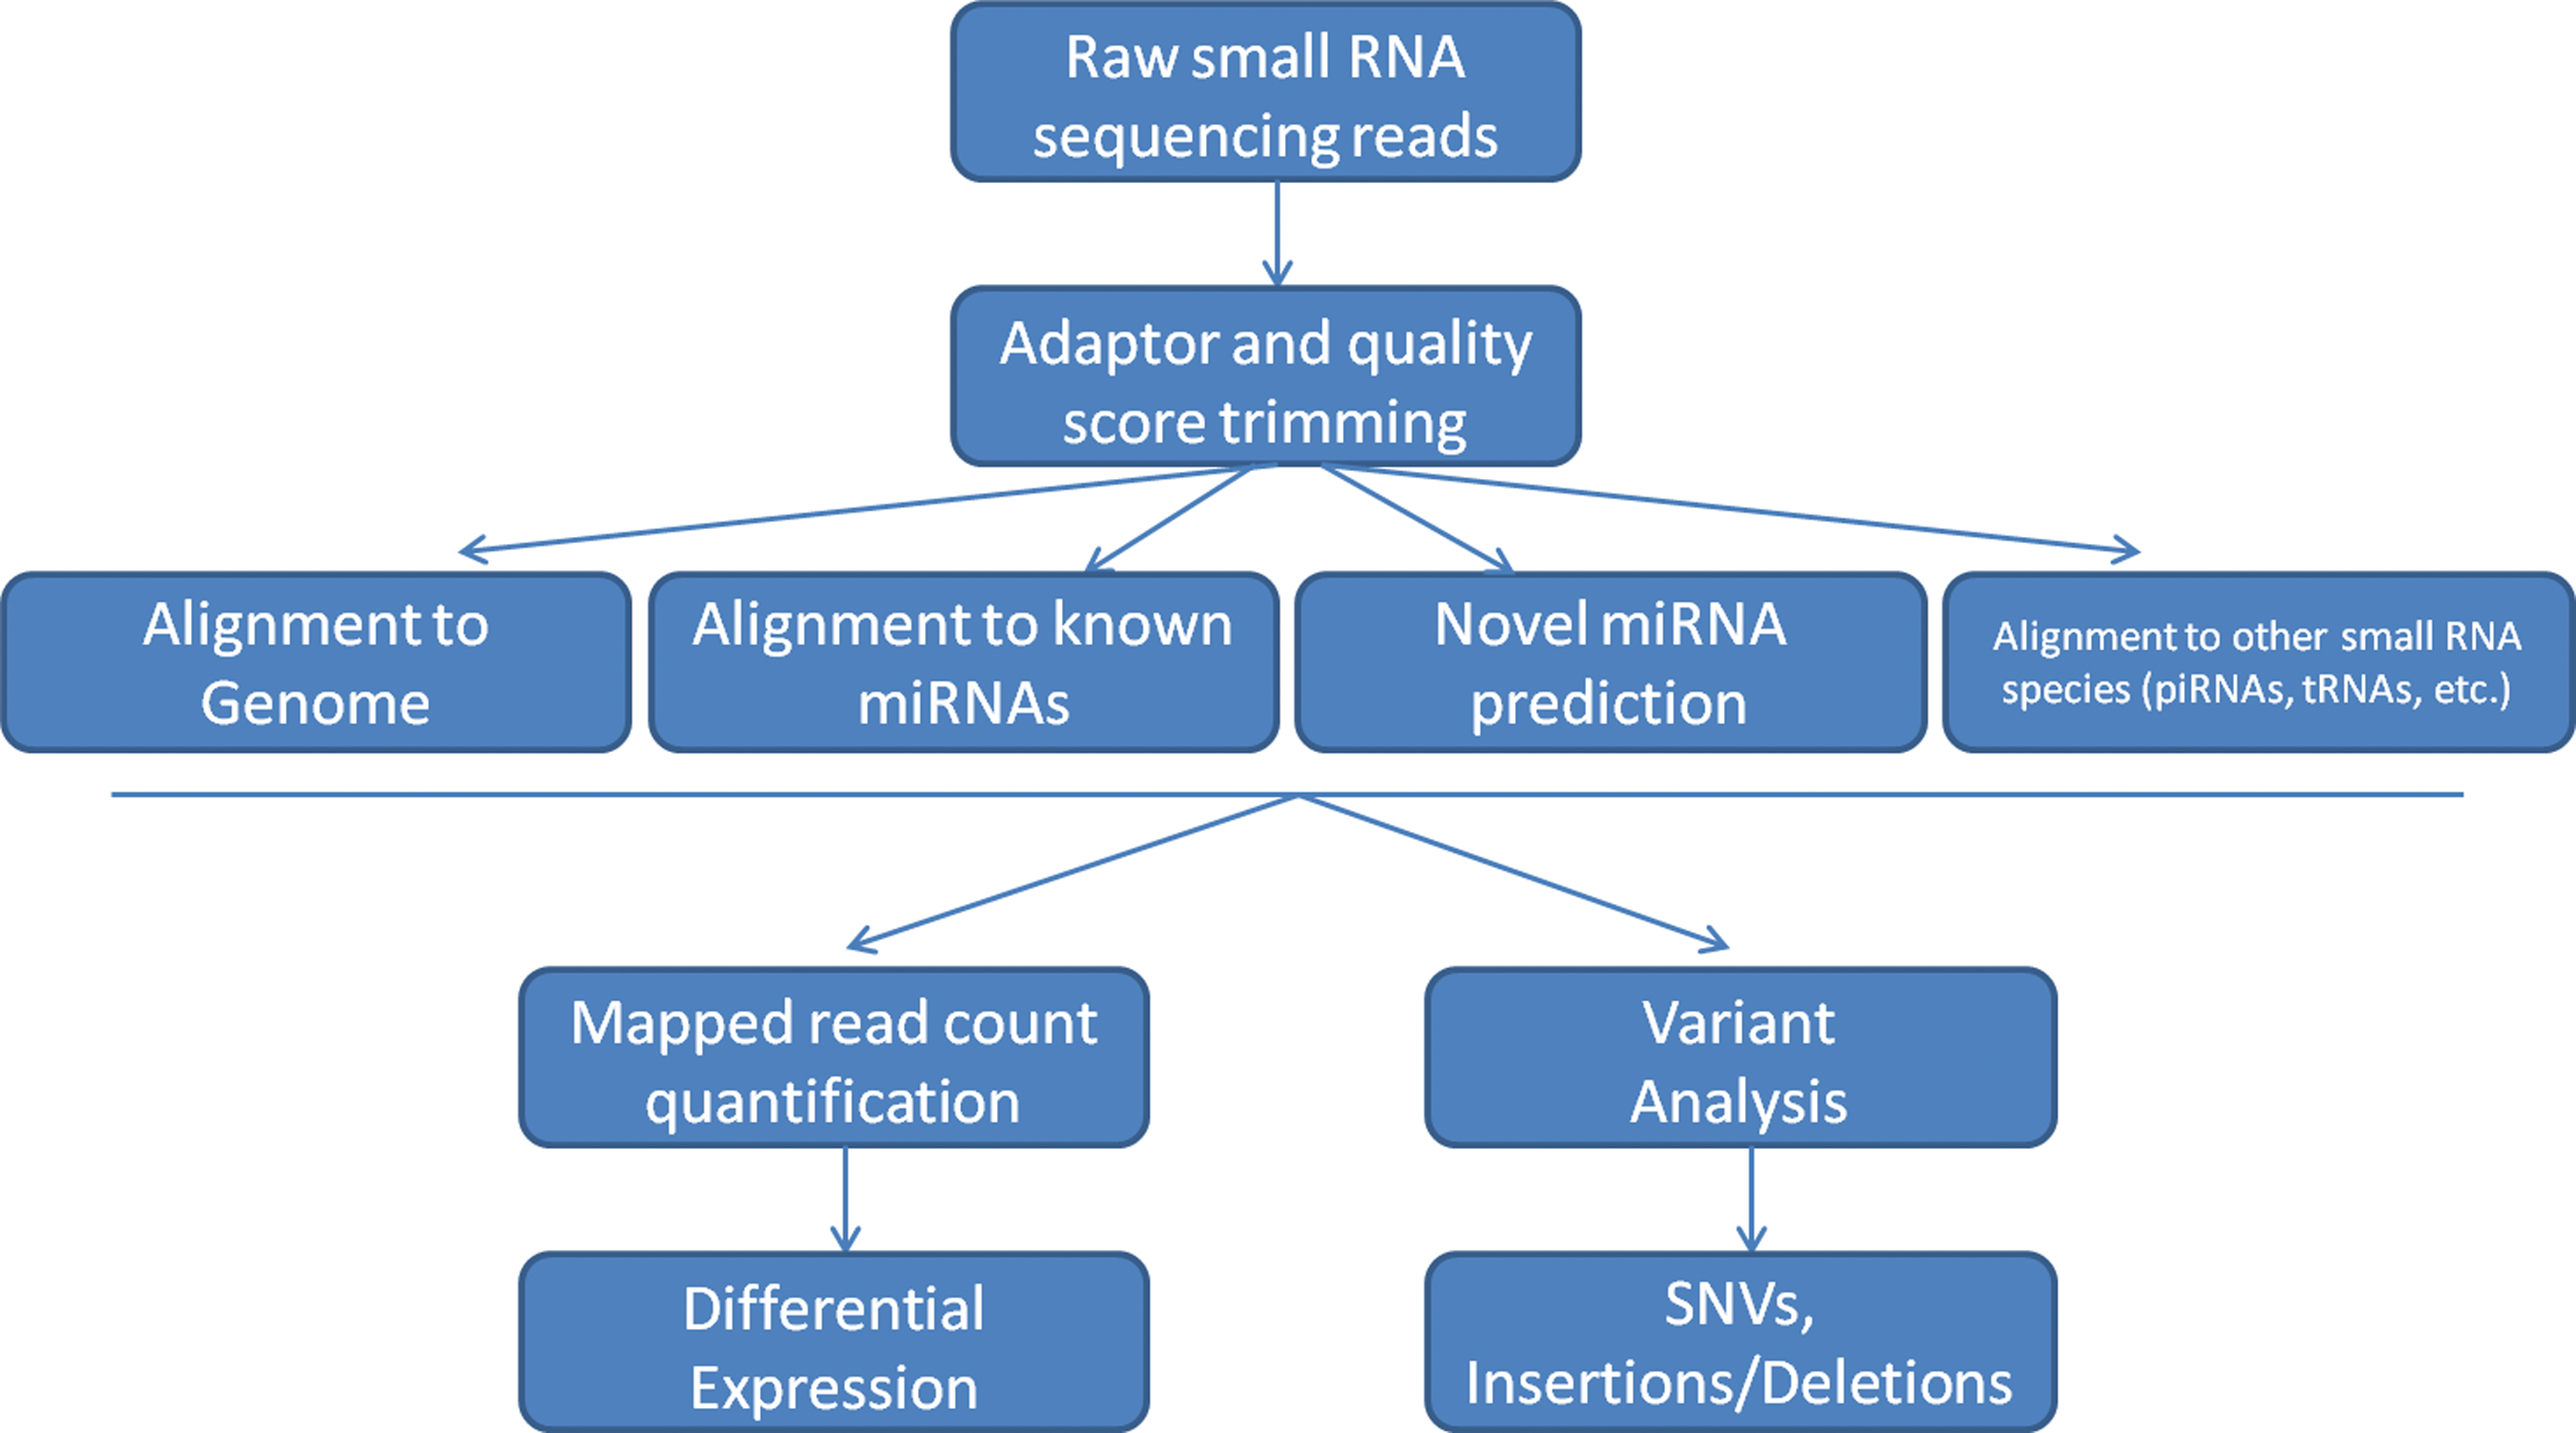
Several major challenges exist with the use of sequencing. First, a significant investment in specialized equipment is needed. This includes not only the sequencing instrument but also several dedicated library preparation instruments (i.e., Bioanalyzer, Polyacrylamide Gel Electrophoresis tanks, and qPCR machine,), and a high-performance computing cluster for analysis. Second, library preparation can be quite laborious, usually taking 1–2 days, and requires laboratory personnel who are well trained for the task. In addition, standard library preparation requires a significant amount of starting sample (in the region of 1 μg), which may not be available for every experiment, although low-amount miRNA library preparation reagents are now offered by several companies (Bioo Scientific, Biochain and others). This issue is particularly important for hypoxia research, where tissue-based starting material maybe quite limited. Third, analysis requires significant bioinformatics expertise, as the vast majority of tools are Linux and R based requiring specialized knowledge of how to use these systems. A variety of methods that analyze small RNA-seq are available with the basic framework shown in Figure 2. Basic steps include adaptor and quality score trimming, mapping to the human genome and other small RNA databases as well as novel miRNA prediction, quantification of read counts, variant analysis, and differential expression. Since bioinformatics analysis is typically the most daunting challenge of next-generation sequencing, a plethora of bioinformatics tools to meet this challenge have been developed for small RNA mapping, annotation, and quantification. These include (but not limited to) academically based software such as Chipster, DSAP (22), E-miR (2), Kraken (10), MiRanalyzer (20), miRCat (55), MiRDeep (1), MiRNAkey (48), MiRProf (55), and MirTools (64) and also commercial-based software such as Novocraft, CLC Genomics Workbench, QSeq, and Partek Genomics Suite (Table 2).
NGS, next-generation sequencing.
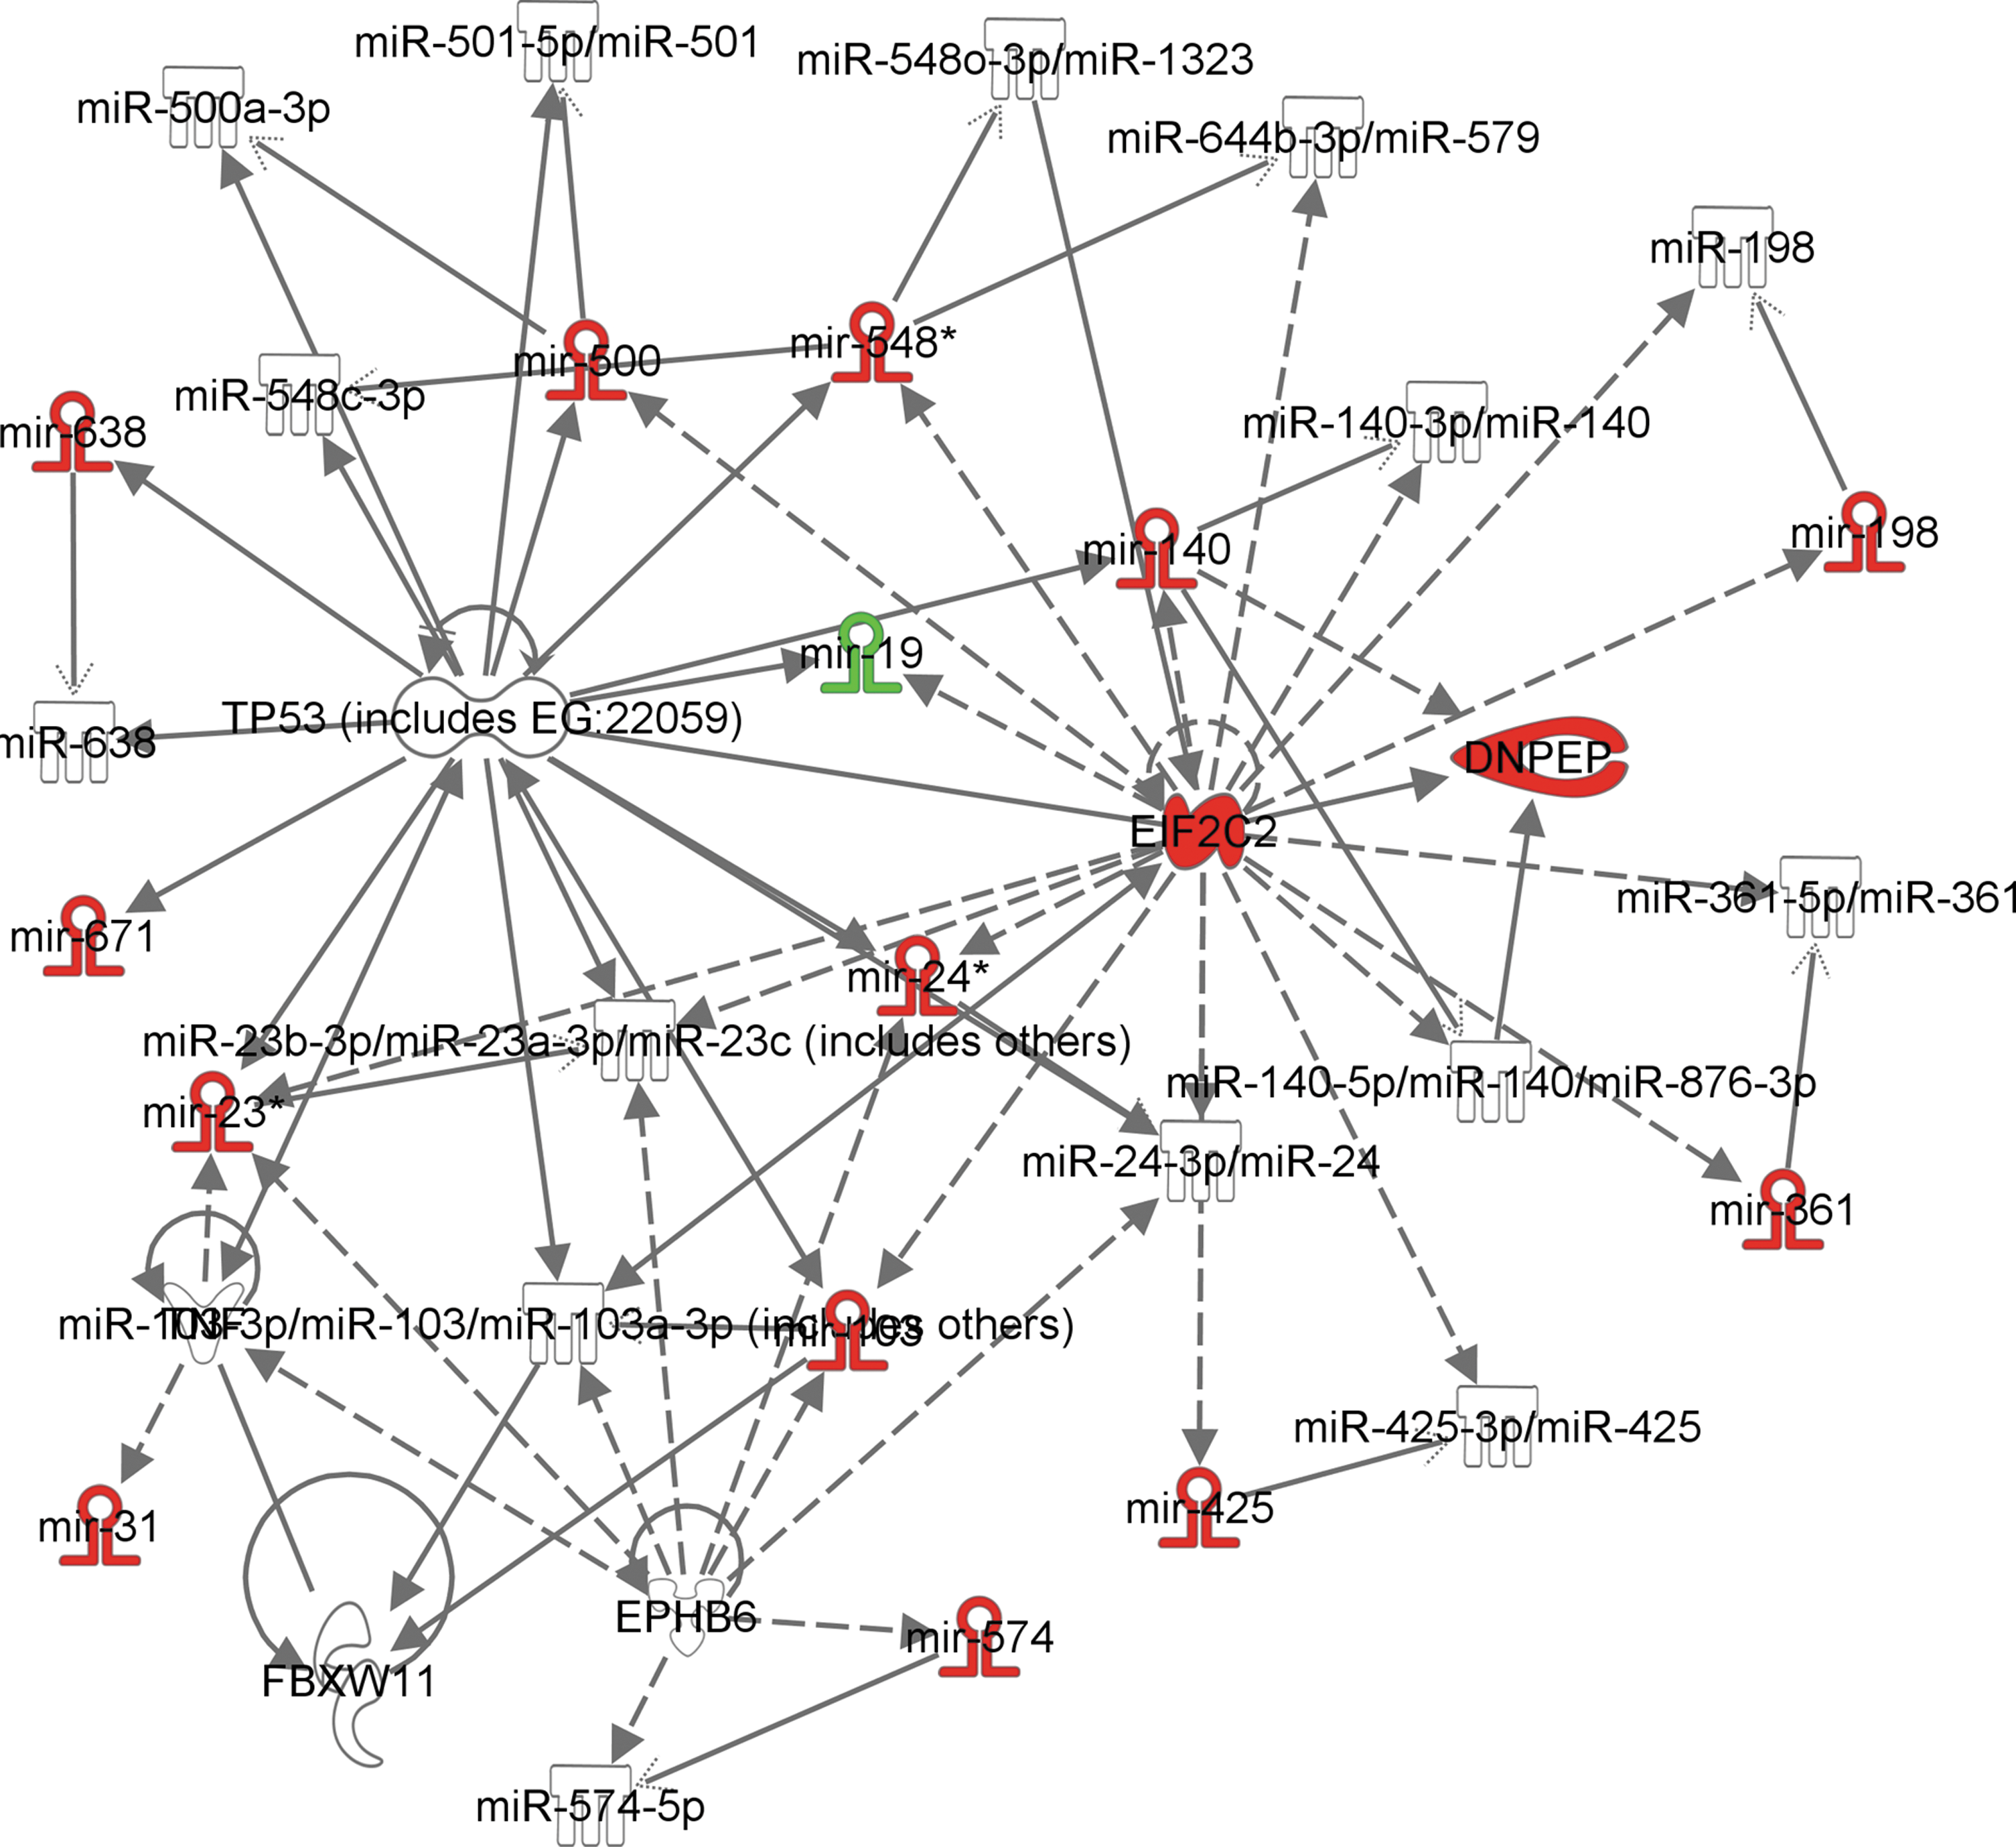
After read mapping and quantification, a powerful application of small RNA sequencing is combining the data with other sequencing modalities for integrated analyses. One common method is to combine small RNA-seq with regular full-length RNA-seq in order to develop miRNA/RNA networks. As shown in the example in Figure 3, by leveraging both known mRNA/miRNA interactions and also predicted interactions, networks between protein coding genes and miRNAs can be performed to understand the regulation of miRNAs beyond just the target genes they interact with. In particular, these analyses help understand what larger pathways and functions are influenced by a set of differentially expressed miRNAs and also how a particular miRNA or set of miRNAs influences the expression of other miRNAs. While sequencing is, by far, the most costly and expertise heavy approach, the comprehensiveness of sequencing all small RNAs with accurate quantification capabilities makes it the best platform for unbiased discovery.
Application of miRNA Profiling Technologies Used in Hypoxia-Related Studies
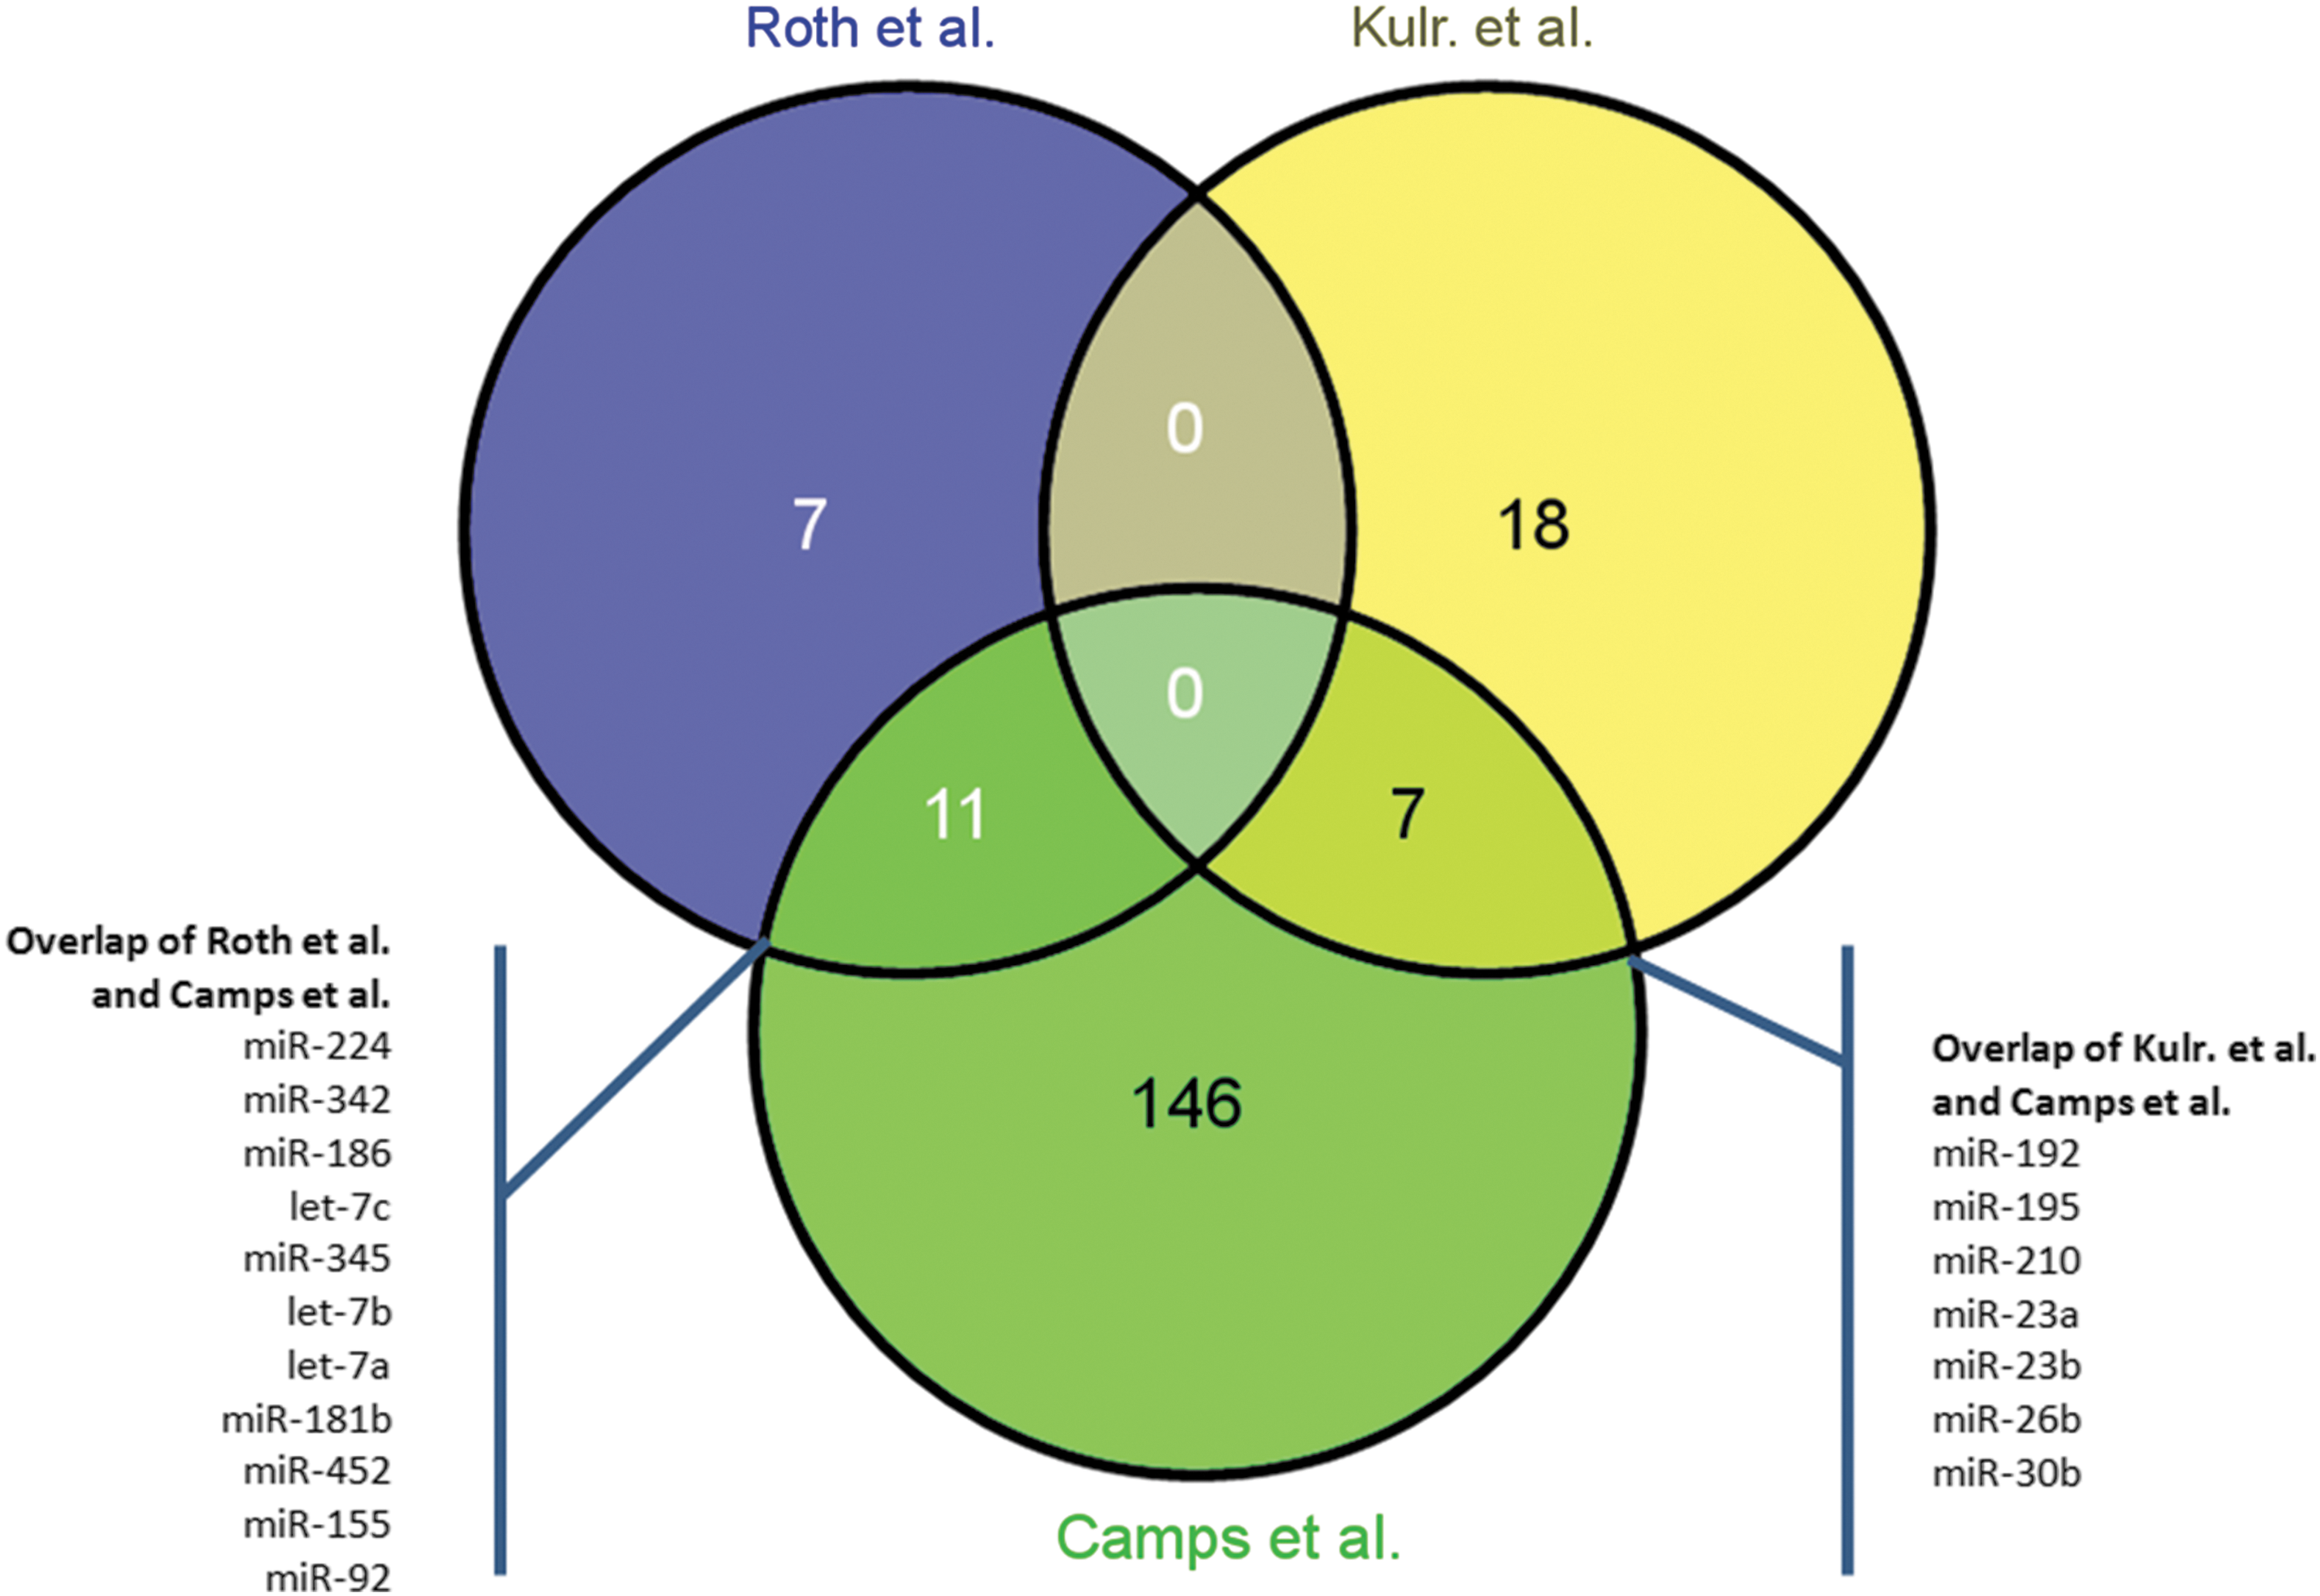
Expression profiling of miRNAs under hypoxia has faithfully followed the development of high-throughput technologies. Initially, custom oligonucleotide arrays were used; while more recently, next-generation sequencing-based studies have started appearing in the literature. This progression is shown in Table 1, with 16 representative studies included spanning the period from 2006 to date. The Ambion mirVana arrays are well represented, but we can see that a mix of technologies has been applied over the years, spanning from “home-made” spotted arrays to in situ synthesized technologies and next-generation sequencing. This makes comparisons very difficult. As an example in Figure 4, three studies are included: Two are based on the estrogen receptor-positive breast cancer cell line MCF-7 exposed to hypoxia, and the third is a breast tumor sample-based study, where miRNA data are available from estrogen receptor-positive tumors. All studies have used spotted oligonucleotide arrays (see Table 1). For simplicity, only miRNAs up-regulated in hypoxia are included in the two MCF-7 studies, showing that 7 out of 18 miRNAs identified as differentially expressed by Kulshreshtha et al. (Kulr) (29) are also found up-regulated in the Camps et al. (3) study, although different hypoxia conditions were applied. Overall, the relatively small overlap between datasets illustrates that miRNA expression profiling is challenging not only for technical reasons, but also due to data analysis difficulties as presented in this review.
The application of next-generation sequencing-based approaches has opened new avenues in miRNA research. Voellenkle et al. (57) have demonstrated the power of this technology by identifying not only the relative abundance of miRNA, but also isoforms with variations at the 5′ end, which may have functional implications, as well as 18 novel hypoxia-related miRNAs. Thus, next-generation sequencing-based technology provides an excellent discovery tool that can enable the characterization of the complete miRNA repertoire.
Discussion
As with all experiments in which a variety of technology is available, the proper selection of an approach requires an in-depth examination of the advantages and disadvantages of each platform. As previously delineated, the number of miRNAs profiled increases with each upgrade in platform: qPCR followed by microarrays followed by next-generation sequencing. With this increase in comprehensiveness come the increased challenges in cost, sample and library preparation, and, most notably, bioinformatics analyses. Due to the unbiased discovery capabilities of next-generation sequencing, this platform has become the favored tool when the miRNAs associated with a particular phenotype are unknown. A popular middle-ground to harness the power of sequencing technology, while mitigating costs, is to use sequencing for discovery in a smaller sample set followed by qPCR in a larger validation set. This gives two major advantages: (i) reduced costs with a larger sample size and (ii) biological validation using an orthogonal technology. Finally, detection and quantification are usually only a part of the larger design of experiments testing miRNA biology. Particularly with high-throughput technologies such as microarrays and next-generation sequencing, tertiary analysis tools have become popular in order to integrate miRNAs with biological phenotypes and with other genomics data. This includes miRNA signatures (e.g., miRNAs associated with cancer survival), miRNA network analysis, miRNA-mRNA interactions, correlation analysis of miRNAs with expression of mRNAs and other noncoding RNAs, and germline and somatic mutation analyses with miRNAs and their binding sites.
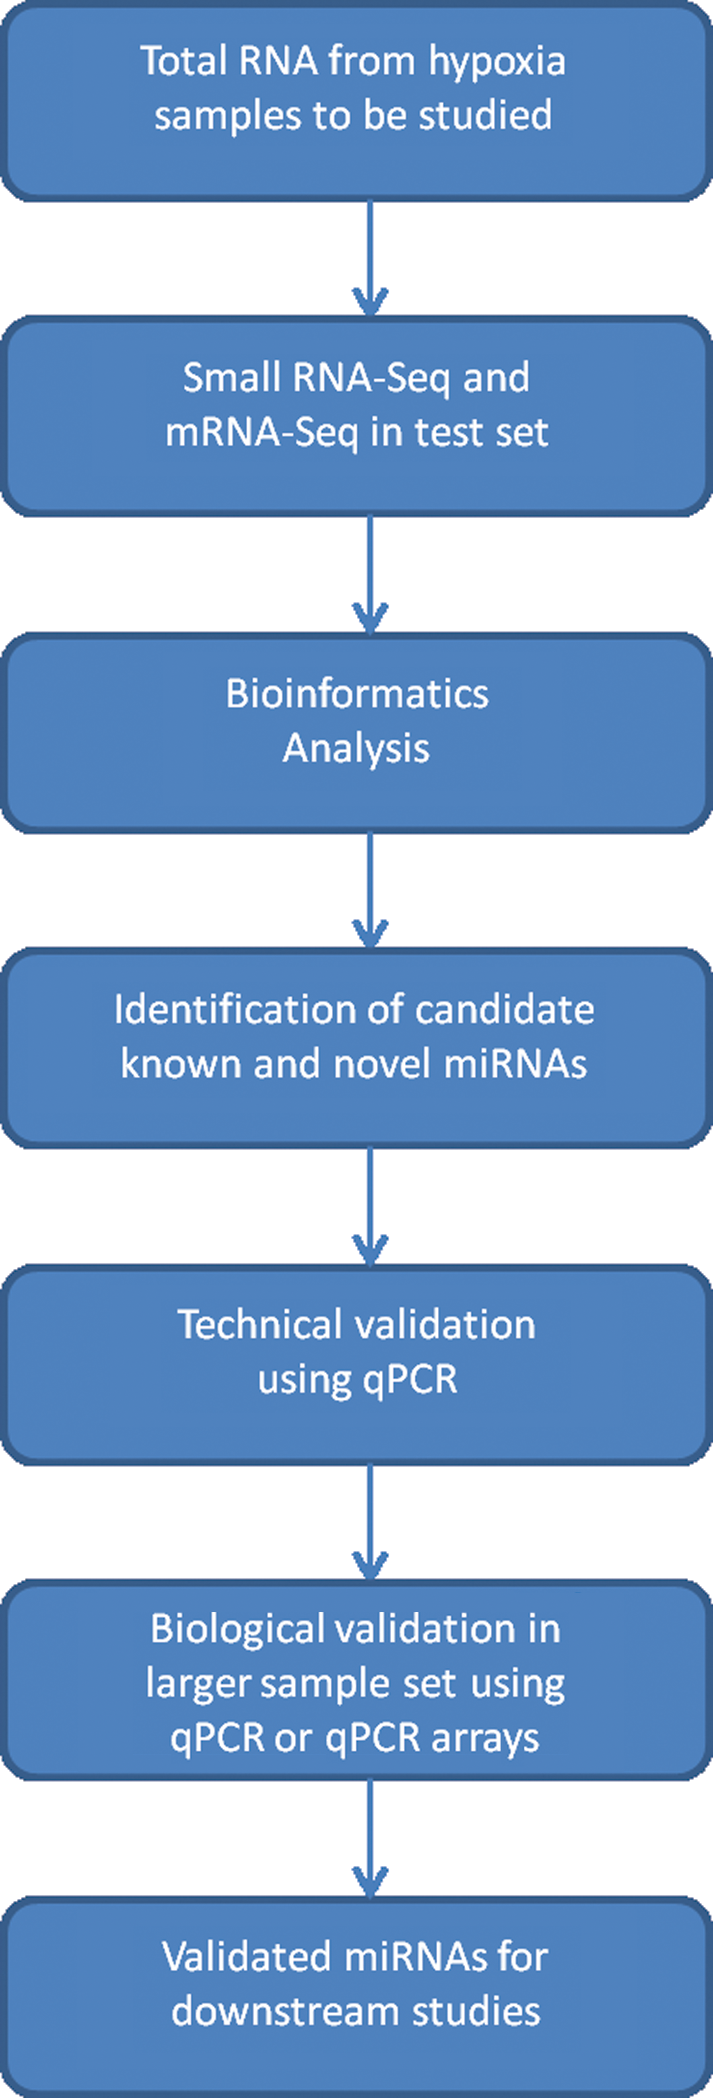
Since resource constraints are common, using next-generation sequencing for every sample within a hypoxia study may not be feasible, but could be used as an initial discovery tool followed by validation in larger sample sets using classical methods. Figure 5 outlines a potential flow diagram for identifying and validating candidate miRNAs. This workflow enables the broad-based discovery capabilities of next-generation sequencing coupled with the validation needed to inform downstream functional studies.
In conclusion, several methods of miRNA detection and quantification exist secondary to a large commercial presence, enabling researchers to choose from a variety of methods depending on their experimental design. The main decision factors include cost, expertise, and the comprehensiveness of the number of miRNAs profiled that are needed to test the hypothesis. Unbiased discovery resulting from improvements in next-generation sequencing methodology, followed by validation with qPCR, is becoming an increasingly popular method for miRNA research. However, next-generation sequencing-based discoveries and detailed isoform characterization can provide feedback to and inform microarray designs, which are destined to improve continuously. Integrated with tertiary analysis tools, these methods enable a comprehensive understanding of the role of miRNAs in hypoxia. Any researcher embarking in miRNA expression profiling projects can now select from a spectrum that covers miRNA discovery, identification, and relative expression as well as validation with the methods outlined.
Footnotes
Acknowledgment
The authors would like to thank Ernesto Iacucci (McGill University) for assistance with data analysis.