
Abstract
Aims:
The nuclear factor (erythroid-derived 2)-like 2 (NFE2L2; NFE2L2/NRF2) pathway contributes to the environmental resistance of cancers by enhancing the antioxidant capacity. Here, we explored the potential connection between NFE2L2/NRF2 and mitochondrial function in cancers.
Results:
Global miRNA expression analysis of HT29 and HCT116 human colon cancer cells identified that NFE2L2/NRF2 silencing upregulated miR-181c through nuclear factor-κB signaling, and this increase was associated with the reduction in mitochondria-encoded cytochrome c oxidase subunit-1 (MT-CO1), a catalytic core subunit of the complex IV of the electron transport chain (ETC). As a result of ETC dysfunction, NFE2L2/NRF2-silenced cancer cells exhibited the decreases in the mitochondrial membrane potential, oxygen consumption rate, and cellular adenosine triphosphate (ATP) contents. Notably, these changes induced adenosine monophosphate (AMP)-activated protein kinase-α (AMPKα) activation and subsequent metabolic adaptation signaling, including the inhibition of fatty acid and sterol biosynthesis enzymes. As supportive evidence of AMPKα-driven adaption, NFE2L2/NRF2-silenced cells were more vulnerable to AMPKα inhibition-induced growth suppression. Similarly, mouse tumor xenografts derived from NFE2L2/NRF2-silenced HT29 exhibited MT-CO1 reduction and AMPKα activation, thereby increasing responsiveness to the AMPK inhibitor treatment. The association of NFE2L2/NRF2 with MT-CO1 and AMPKα was confirmed in breast cancer cells.
Innovation:
We demonstrated the significance of NFE2L2/NRF2 in cancer mitochondria by elucidating the involvement of miR-181c/MT-CO1 as underlying molecular events. We also provide evidence of the crosstalk between NFE2L2/NRF2 and AMPKα as an adaptive link in cancers.
Conclusion:
Therefore, it may be an effective strategy to inhibit both NFE2L2/NRF2 and AMPKα signaling to overcome adaptive behaviors of cancer. Antioxid. Redox Signal. 27, 945–961.
Introduction
N
In this study, we elucidated the significance of NFE2L2/NRF2 in cancer mitochondria by identifying the involvement of miR-181c/MT-CO1 as an underlying mechanism. We also demonstrated that the mitochondrial modulatory effect of NFE2L2/NRF2 is connected with AMPKα signaling, which is another player that endows cancer resistance, and therefore, it may be considerable to inhibit both NFE2L2/NRF2 and AMPKα signaling to overcome adaptive behaviors of cancer.
However, NFE2L2/NRF2 is upregulated in many types of cancers through multiple mechanisms, including somatic mutations in NFE2L2/NRF2 or KEAP1 genes, reactive oxygen species (ROS) elevation by mutant KRAS, and fumarate accumulation by metabolic gene mutation (19, 48, 49). High NFE2L2/NRF2 levels can confer advantages to tumors by providing enhanced antioxidant capacity to cope with oxidative stress- or drug-induced apoptosis (54). In addition, a recent study showed that NFE2L2/NRF2 activates metabolism-related genes that are involved in the pentose phosphate pathway, nucleotide synthesis, and glutamine metabolism, all of which can promote cell proliferation and tumor growth (40).
The mitochondria electron transport chain (ETC) consists of five multimeric protein complexes (complexes I, II, III, IV, and ATP synthase), which are located in the inner membrane (12, 41). During adenosine triphosphate (ATP) production, NADH-derived electrons are serially transported from complex I to complex IV with the concomitant efflux of matrix protons to the intermembrane space by complexes I, III, and IV. Through a process of proton influx back into the mitochondrial matrix, ATP synthase generates ATP. Therefore, the proton gradient across the inner membrane (the mitochondrial membrane potential [MMP]) is an important physiological parameter reflecting mitochondrial capacity for ATP production (50, 51).
Cytochrome c oxidase, the ETC complex IV, is a terminal and rate-limiting complex in the transport of electrons to oxygen (12, 41). Cytochrome c oxidase consists of 13 subunits in vertebrates (1, 29), including three catalytic core subunits that are encoded by mitochondrial DNA: mitochondria-encoded cytochrome c oxidase subunit (MT-CO)-1, -2, and -3. The remaining 10 subunits are encoded by the nucleus and play roles in the activity regulation and assembly of this enzyme (29). As this enzyme acts as one of the three proton pumps that create the MMP (51), dysfunction of cytochrome c oxidase can affect MMP maintenance and cellular energy production (42). Notably, a recent study has demonstrated that cancer cell lines that are the most sensitive to low glucose-induced inhibition of proliferation had genetic mutations in the ETC (5). This study suggested that ETC and oxidative phosphorylation (OXPHOS) are critical determinants of tumor cell proliferation when cells are in an environment with a limited nutrient supply.
The activity of cytochrome c oxidase is affected by various physiological and pathological factors, including the availability of substrates such as NADH and oxygen, ATP/adenosine diphosphate (ADP) ratio, and nitric oxide (NO) (1). In particular, several recent findings have indicated that microRNAs (miRNAs) contribute to the regulation of mitochondrial metabolism (4). Hypoxia-inducible miR-210 targets the iron-sulfur assembly protein ISCU1/2, thereby inhibiting complex I activity (7). MiR-338 decreases ATP production through repression of the subunit-4 of cytochrome c oxidase (2). Importantly, evidence emerged that certain miRNAs localize in the mitochondrial compartment, suggesting their role as novel signaling mediators to control mitochondrial biogenesis (11, 32).
Adenosine monophosphate (AMP)-activated protein kinase-α (AMPKα) is a highly conserved energy sensor that maintains cellular energy homeostasis (30, 58). When ATP levels are low, activated AMPKα stimulates the expression of glucose transporter-4 (GLUT4) to enhance the cellular uptake of glucose and ATP production. AMPKα directly phosphorylates and inhibits acetyl-coenzyme A carboxylase-1 (ACC1) and 3-hydroxy-3-methylglutaryl-coenzyme A reductase (HMGCR), which are rate-limiting enzymes for fatty acids and sterol biosynthesis (39, 47). As AMPKα directs cancer metabolism to the activation of catabolism and the inhibition of anabolism, a high level of AMPKα can restrict cell proliferation and tumor growth under stress conditions (39, 47). However, lines of evidence suggest the context-dependent tumorigenic role of AMPKα (59). With a moderate level of AMPKα activation, cancer cells are allowed to adapt to stress conditions by preserving energy and by switching to other nutrient sources such as fatty acids, and these changes can eventually promote cancer survival and drug resistance (33).
Our previous study showed that NFE2L2/NRF2 silencing in colon cancer cells blocked hypoxia-inducible factor-1α (HIF-1α) accumulation under hypoxic condition, and it consequently suppressed tumor angiogenesis (31). As a probable mechanism, we demonstrated that NFE2L2/NRF2-silenced cancer cells consume lower levels of oxygen than control cells. This raised the intriguing question of whether NFE2L2/NRF2 signaling is connected with mitochondrial function. Accordingly, in this study, we explored the role of NFE2L2/NRF2 in mitochondrial function by using NFE2L2/NRF2-silenced cancer cells and investigated underlying molecular mechanisms with a focus on changes in the miRNA signature. In addition, we examined how the connection between NFE2L2/NRF2 and mitochondria affected adaptive signaling in cancers.
Results
Increased expression of miR-181c in NFE2L2/NRF2-silenced colon cancer cells
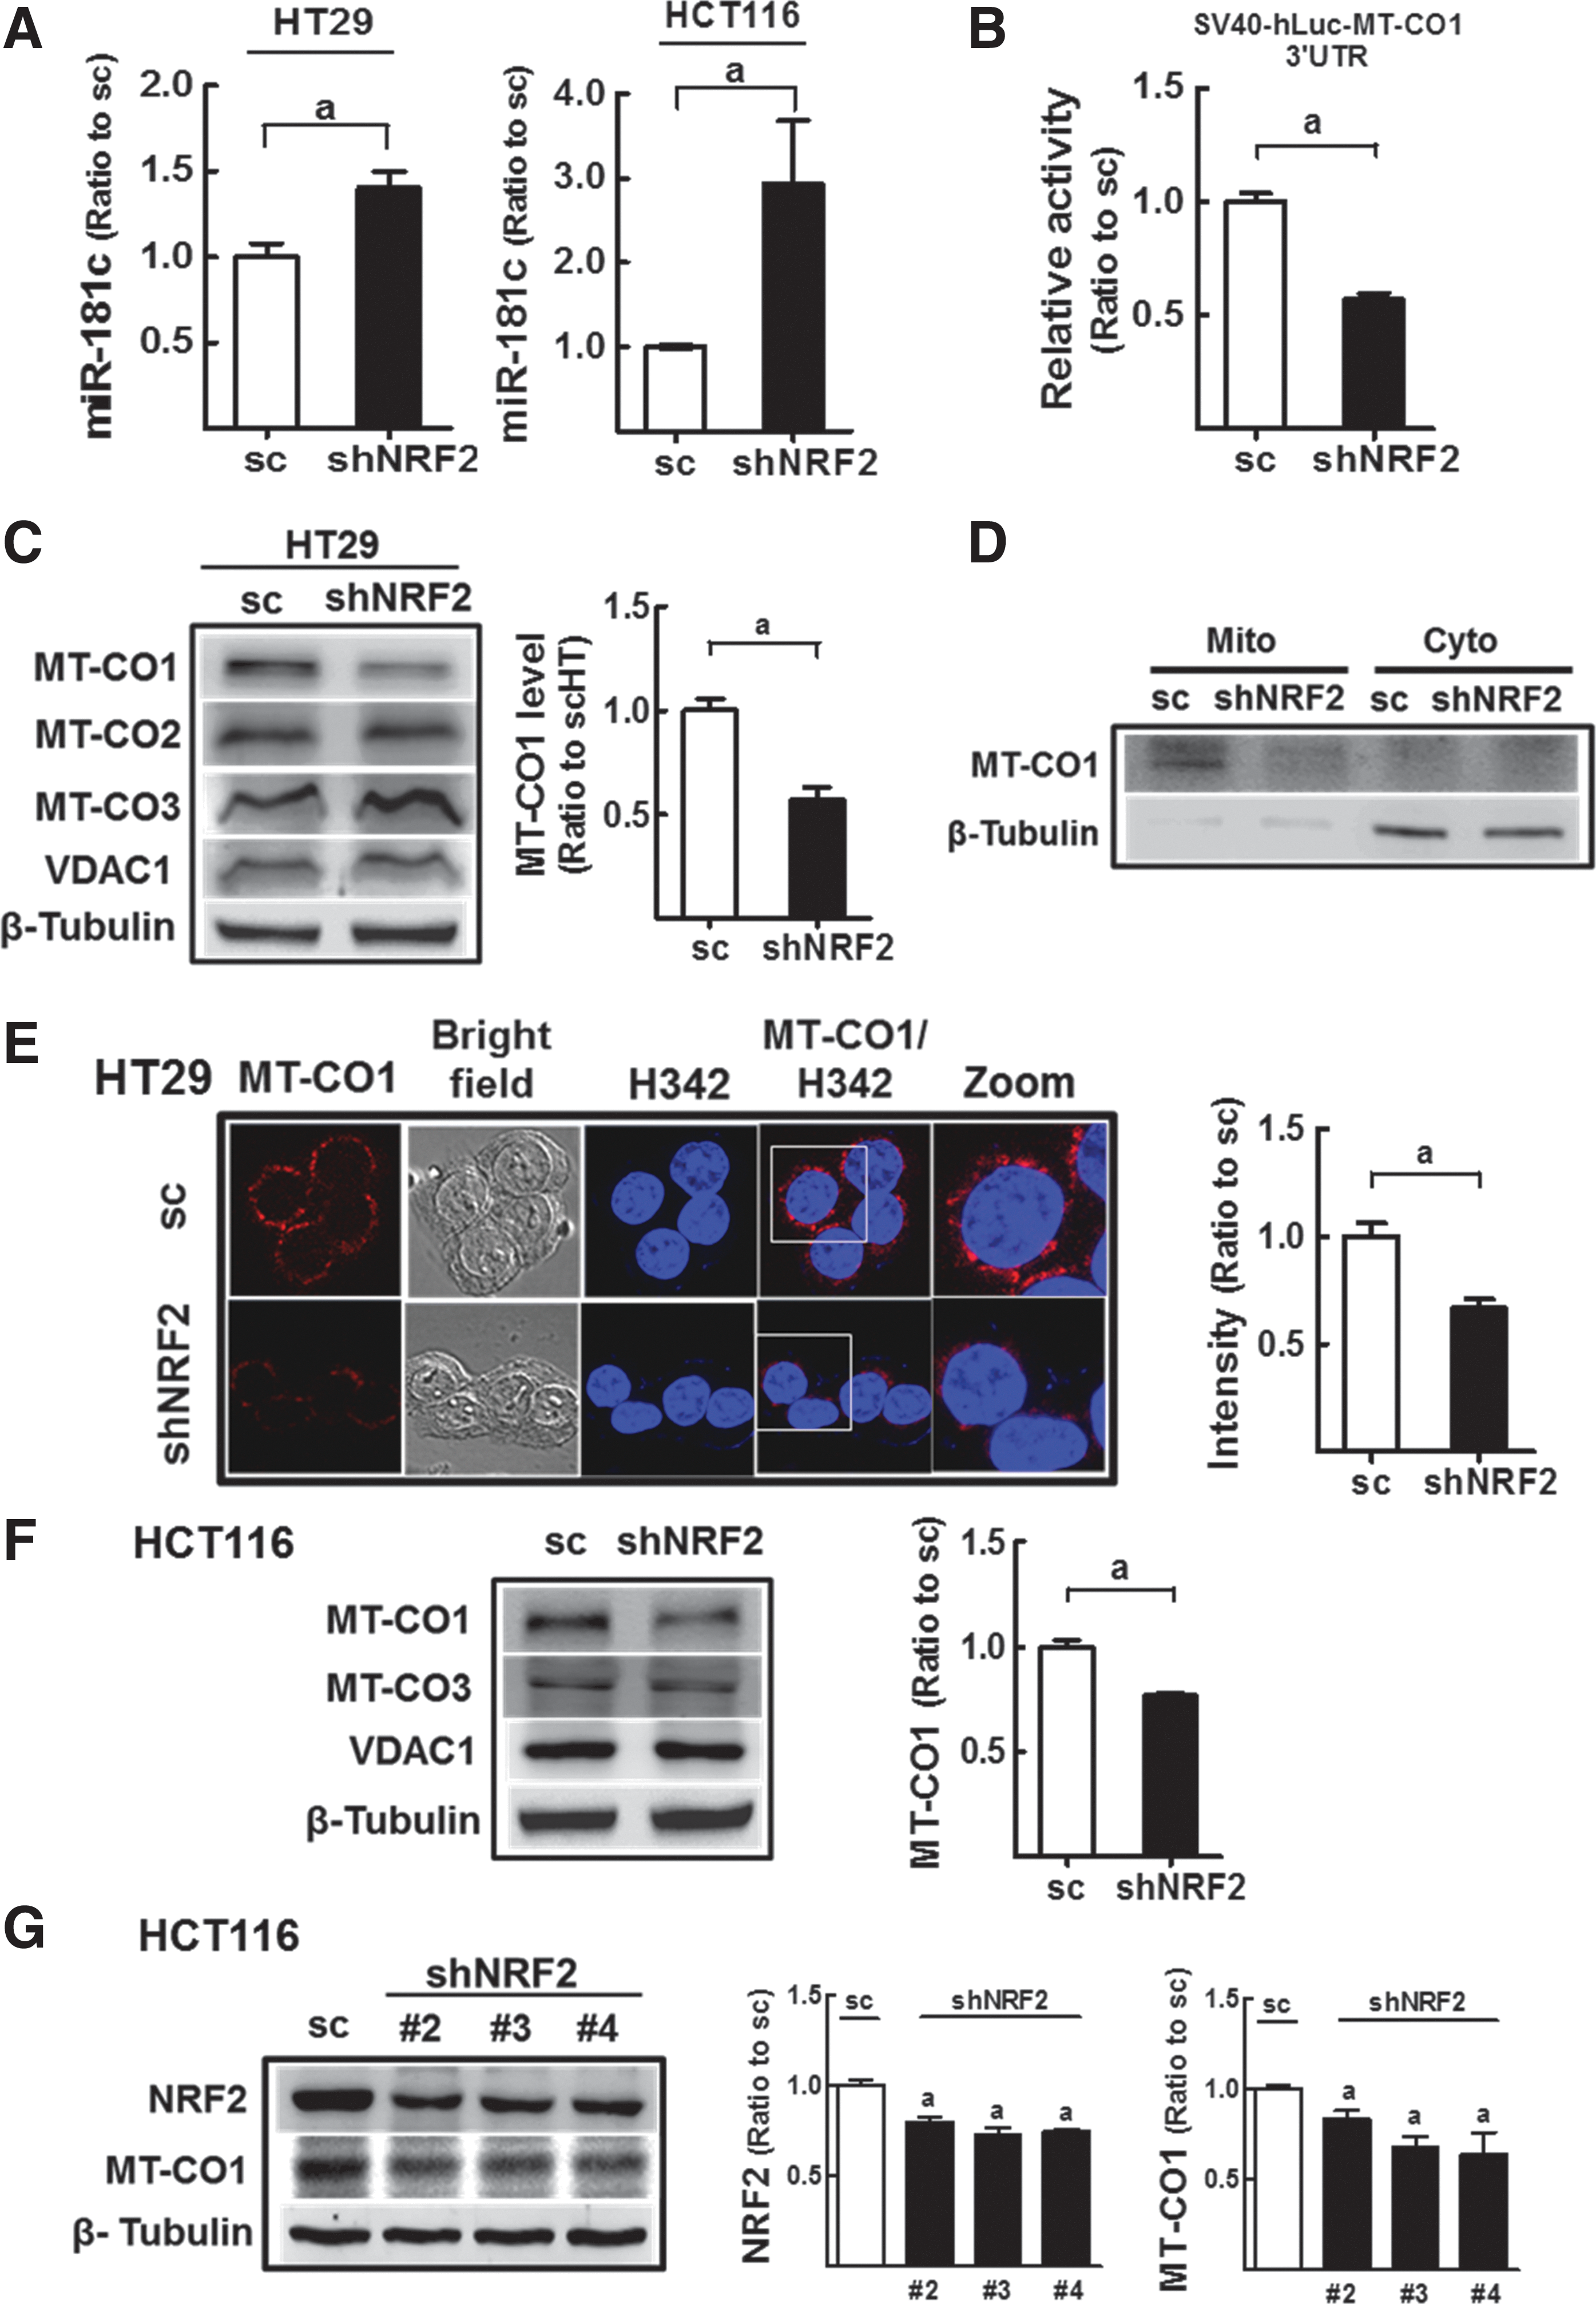
We previously found that cellular O2 consumption was lower in NFE2L2/NRF2-knockdown HT29 and HCT116 cells than in control cells (31). Therefore, we sought to elucidate the molecular mechanisms underlying the altered mitochondrial function in NFE2L2/NRF2-knockdown cells by focusing on miRNA signatures. Our established NFE2L2/NRF2-knockdown stable HT29 cell line (shNRF2-HT) showed lower levels of NFE2L2/NRF2 transcript (0.55-fold) and protein (0.6-fold), and repressed target gene expressions compared with scRNA-expressing control cells (scHT) (Supplementary Fig. S1A–C; Supplementary Data are available online at
Then, miRNA expression patterns were analyzed in these cell lines with the Affymetrix GeneChip miRNA 3.0 system. Through comparative analyses, miRNAs exhibiting increases in expression greater than 1.5-fold after NFE2L2/NRF2 knockdown were collected, and 23 miRNAs were commonly increased in both HT29 and HCT116 cells (Table 1). The pathway analysis (miRSystems;
Mitochondria pathway-related miRNAs are indicated.
n.d., not determined; OXPHOS, oxidative phosphorylation.
Decreased MT-CO1 levels in NFE2L2/NRF2-knockdown colon cancer cells
Next, we examined whether the increased miR-181c levels affected MT-CO1 expression in NFE2L2/NRF2-knockdown cells. Although MT-CO1 mRNA levels were not altered in NFE2L2/NRF2-silenced HT29 (shNRF2-HT) cells (Supplementary Fig. S2), luciferase activity derived from the 3′-untranslated region (3′-UTR) of the human MT-CO1 gene was significantly low in shNRF2-HT than that in the control cells (Fig. 1B). This result indicated the association of the NFE2L2/NRF2-mediated miR-181c elevation with 3-UTR of the MT-CO1 gene, and translational inhibition of MT-CO1. In agreement with this, MT-CO1 protein expression was reduced by 43% in shNRF2-HT compared with that in scHT cells (Fig. 1C). Unlike MT-CO1, protein levels for MT-CO2, MT-CO3, and VDAC1 were not altered after NFE2L2/NRF2 knockdown (Fig. 1C). MT-CO1 protein was also downregulated in isolated mitochondrial fractions (Fig. 1D) and in immunocytochemical analyses (Fig. 1E). Similarly, MT-CO1 protein levels were decreased by 23% in NFE2L2/NRF2-silenced HCT116 (shNRF2-HCT) cells compared with that in scHCT cells (Fig. 1F). The transient introduction with three additional shRNAs (NRF2 shRNA Nos. 2–4) could confirm the correlation of NFE2L2/NRF2 silencing and MT-CO1 repression (Fig. 1G). Thus, increased miR-181c levels may suppress MT-CO1 expression in shNRF2-HT and shNRF2-HCT cells.
In addition, we assessed expression levels of other ETC components in shNRF2-HT29. There were no significant changes in the expression of nucleus-encoded ETC genes (NADH dehydrogenase 1α subunit 5 [NDUFA5], NADH dehydrogenase iron-sulfur protein-8 [NDUFS8], succinate dehydrogenase iron-sulfur subunit [SDHB], cytochrome b-c1 complex subunit-1 [UQCRC1], and ATP synthase subunit-5O [ATP5O]) after NFE2L2/NRF2 knockdown (Supplementary Fig. S3A). When transcript levels for mitochondria-encoded ETC subunits (NADH-ubiquinone oxidoreductase chains [NDs], cytochrome b [CYB], MT-CO2, MT-CO3, and ATP synthase-6 [ATP6]) were monitored, several subunits, including ND1, ND2, ND3, ND6, and ATP6, were elevated by 1.36–1.54-fold compared with the control cells, indicating that the expression of other ETC subunits was not repressed significantly by NFE2L2/NRF2 knockdown (Supplementary Fig. S3B).
Reduced levels of cytochrome c oxidase activity, MMP, mitochondrial respiration rate, and ATP contents in NFE2L2/NRF2-knockdown colon cancer cells
Altered MT-CO1 expression can cause MMP disturbance and ETC dysfunction in NFE2L2/NRF2-silence cancer cells. Indeed, cytochrome c oxidase (complex IV) activity was significantly lower in shNRF2-HT cells (Fig. 2A). In addition, when ETC function was assessed by monitoring MMP levels by using fluorescence probes, cellular fluorescence intensity of MitoRed was reduced by 50% in shNRF2-HT cells compared with that in scHT cells (Fig. 2B). To exclude the involvement of differential uptake capacity of fluorescent dye, cellular MitoRed intensities were monitored by using a high-throughput cell imager after incubation with MitoRed for 10, 20, and 40 min. Results indicated that cellular MitoRed intensities were significantly lower in shNRF2-HT throughout the incubation time (Fig. 2C). In addition, MitoRed accumulation was greatly suppressed by carbonyl cyanide m-chlorophenyl hydrazone (CCCP), an inhibitor of MMP maintenance, in both cell lines. The accumulation of TMRM, another MMP-sensitive fluorescent dye, was also lower in shNRF2-HT cells than in scHT cells, which confirms MMP reduction in NFE2L2/NRF2-silenced colon cancer cells (Fig. 2D). Moreover, as direct evidence of diminished mitochondrial function, the levels of mitochondrial respiration were significantly low in NFE2L2/NRF2-silenced HT29. The basal oxygen consumption rate (OCR), which reflects the basal mitochondrial respiration, was reduced by 0.66-fold by NFE2L2/NRF2 knockdown, and spare respiratory capacity was also significantly lower in knockdown cells (Fig. 2E). As a result of MMP disturbance and respiration diminishment, cellular ATP levels were decreased by 23% in shNRF2-HT compared with that in the sc control (Fig. 2F). However, the activity of complex I (NADH:ubiquinone oxidoreductase) was not affected by NFE2L2/NRF2 silencing, indicating that altered tricarboxylic acid (TCA) cycle or differential NADH availability was not associated with MMP reduction and respiratory dysfunction in NFE2L2/NRF2-silenced cells (Fig. 2G). Similar to HT29, NFE2L2/NRF2-knockdown HCT116 cells showed reductions in MitoRed intensity and basal OCR (Fig. 2H, I).
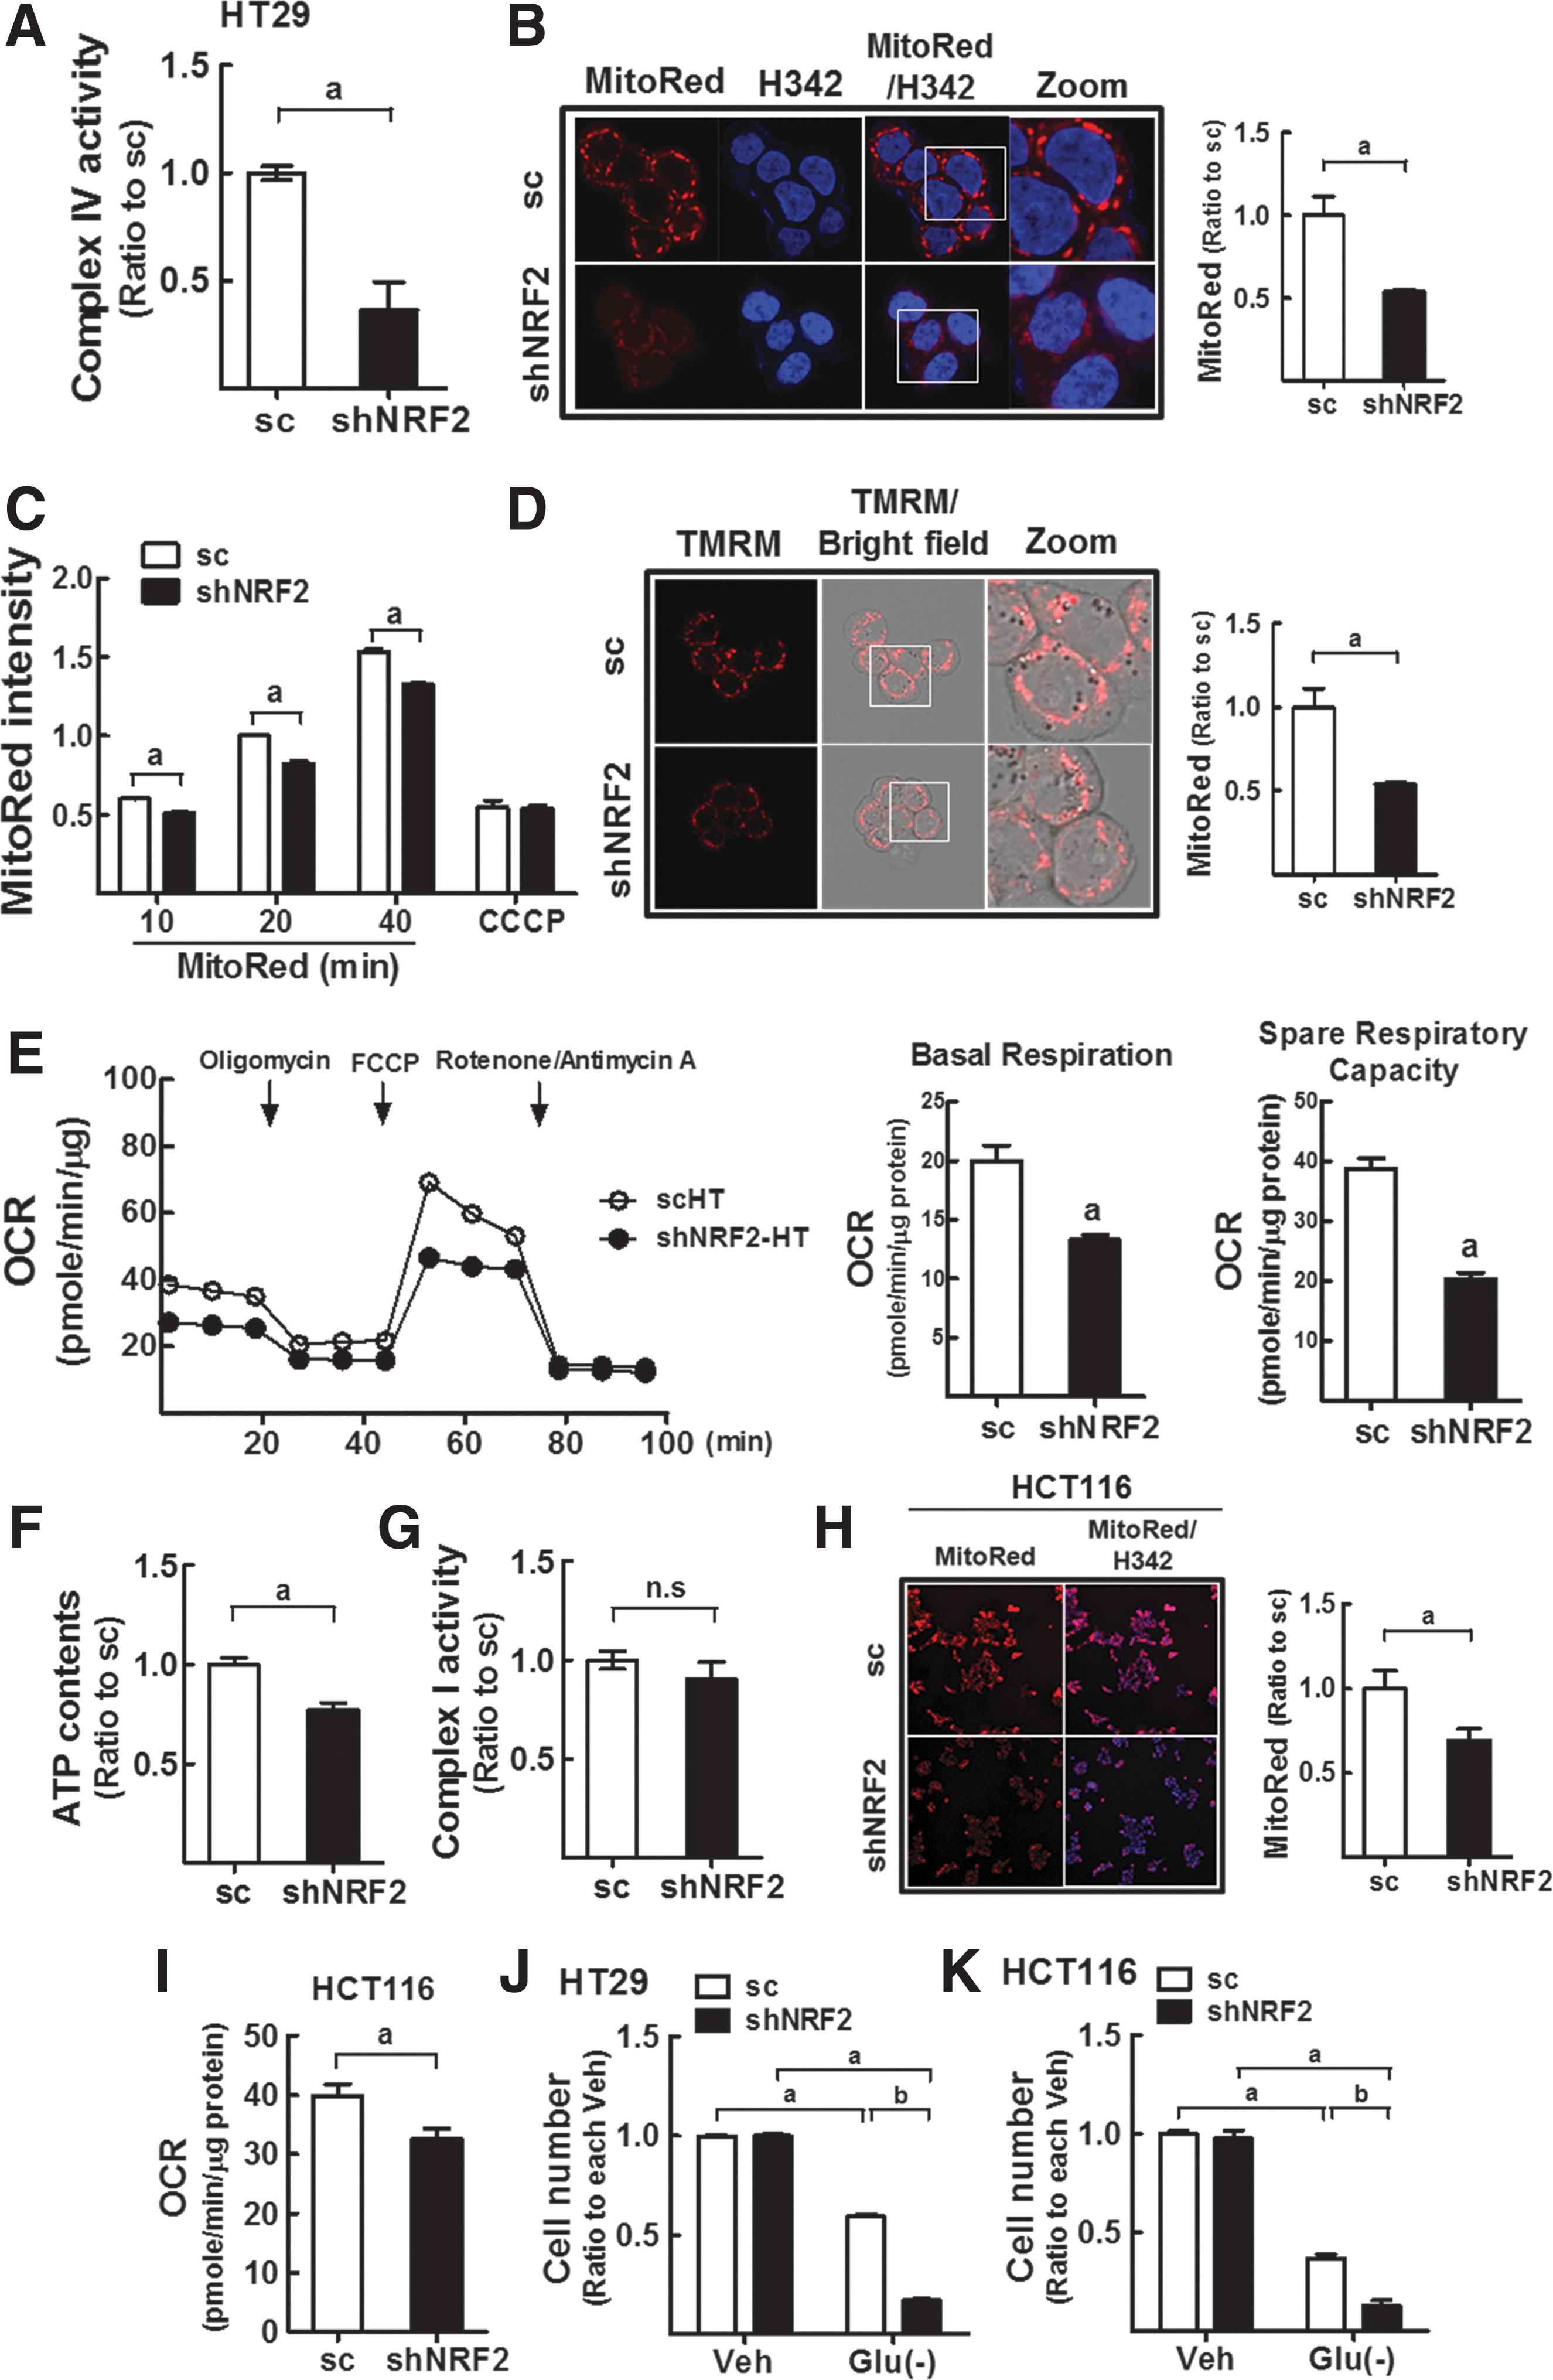
Based on diminished ATP production, NFE2L2/NRF2-silenced cancer cells may be dependent on the nutrient supply. Indeed, when shNRF2-HT and shNRF2-HCT cells were cultured in glucose-free medium, the viable cell number was significantly lower than that in the sc control (Fig. 2J, K), whereas no differences were observed in cells grown in normal glucose medium. These results demonstrate that NFE2L2/NRF2-silenced colon cancer cells retain mitochondria with ETC dysfunction, thereby producing lower levels of ATP, which causes vulnerability to glucose limitation.
Involvement of miR-181c in MT-CO1 reduction and MMP disruption
High ROS level is one of the factors affecting MMP (18). As shNRF2-HT cells retain high levels of ROS (Fig. 3A), reduced MMP level might be associated with the ROS increase. However, 1 mM NAC (24 and 72 h) incubation could not restore the repressed MMP levels in shNRF2-HT cells (Fig. 3B and Supplementary Fig. S4), despite decreasing ROS levels with NAC treatment (Fig. 3A). In addition, the incubation of shNRF2-HT with mitochondrial ROS inhibitor (Mito-TEMPO) completely diminished mitochondrial superoxide levels; however, MMP level was not affected by MitoTEMPO (Fig. 3C, D). These data suggest that ROS may not be a major factor contributing to MMP disturbance in NFE2L2/NRF2-knockdown cells.
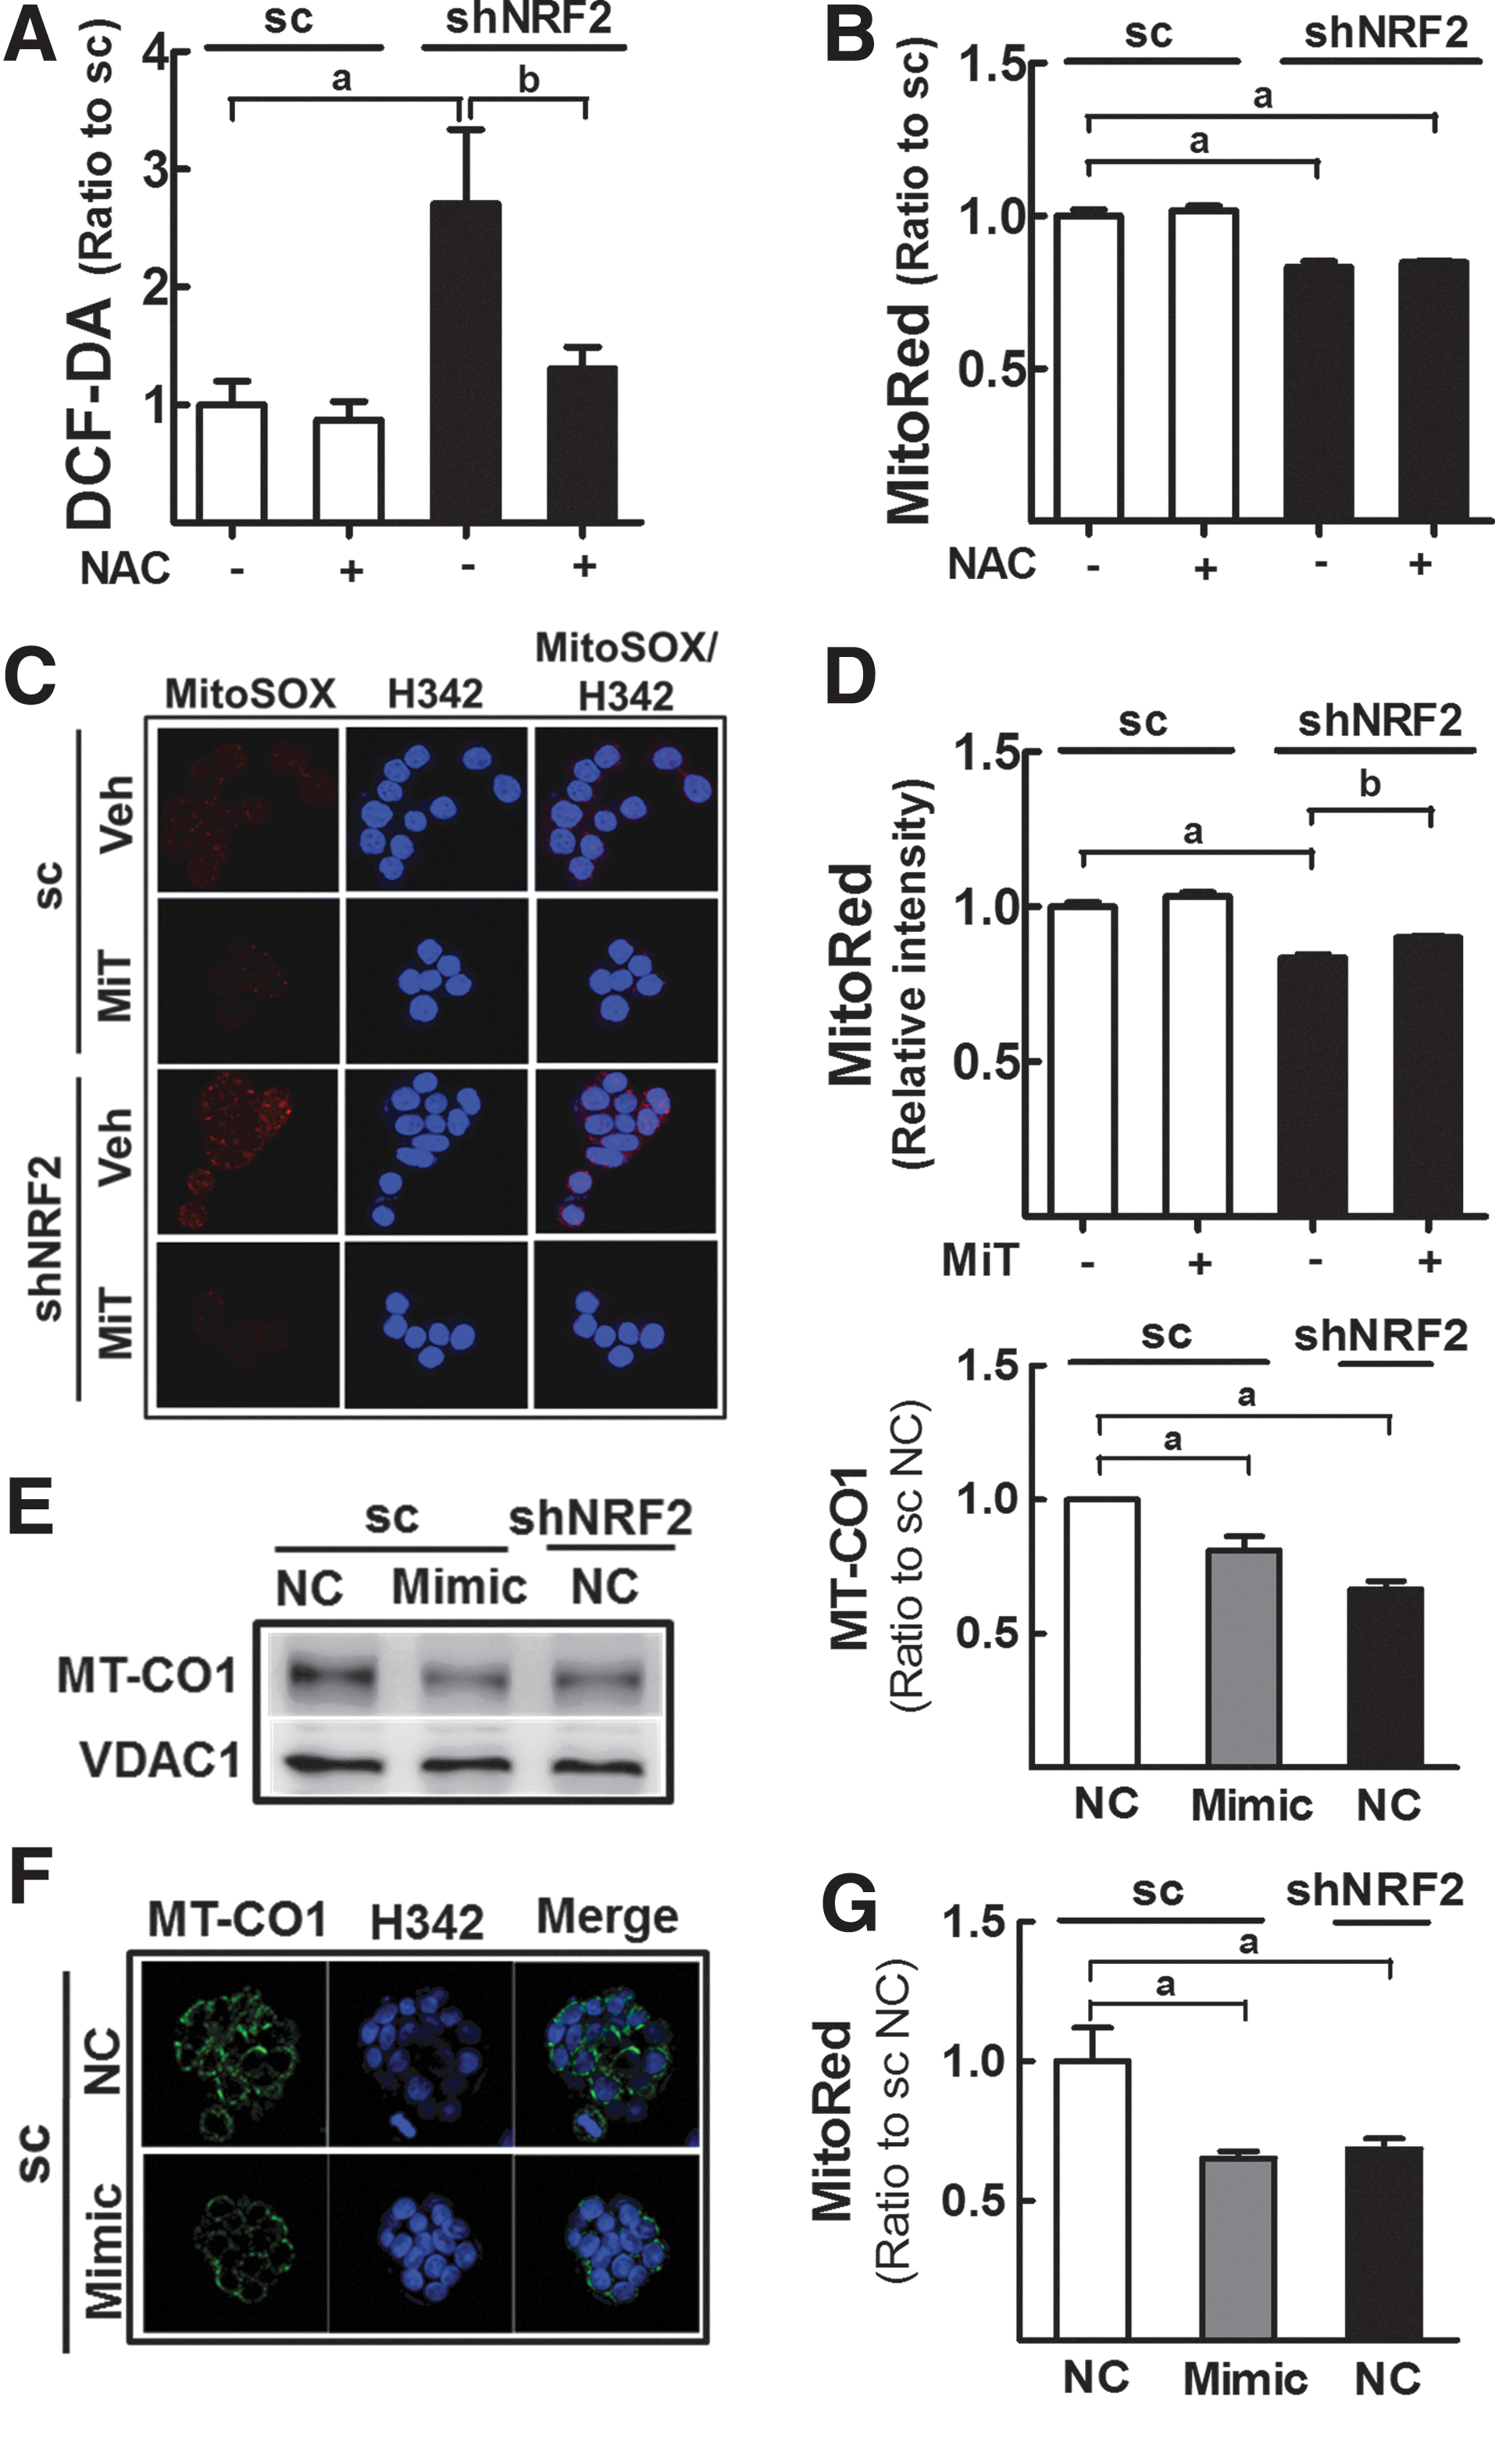
Next, to evaluate the direct relationship between miR-181c and MT-CO1/MMP, we transfected scHT cells with miR-181c mimic and examined MT-CO1 protein levels. After transfection, MT-CO1 protein expression was reduced by 20% compared with that in negative control nucleotide-transfected cells (Fig. 3E). These results were confirmed by immunocytochemical analyses (Fig. 3F). In addition, the MitoRed intensity decreased by 40% after miR-181c mimic transfection (Fig. 3G), indicating that miR-181c disrupted the MMP.
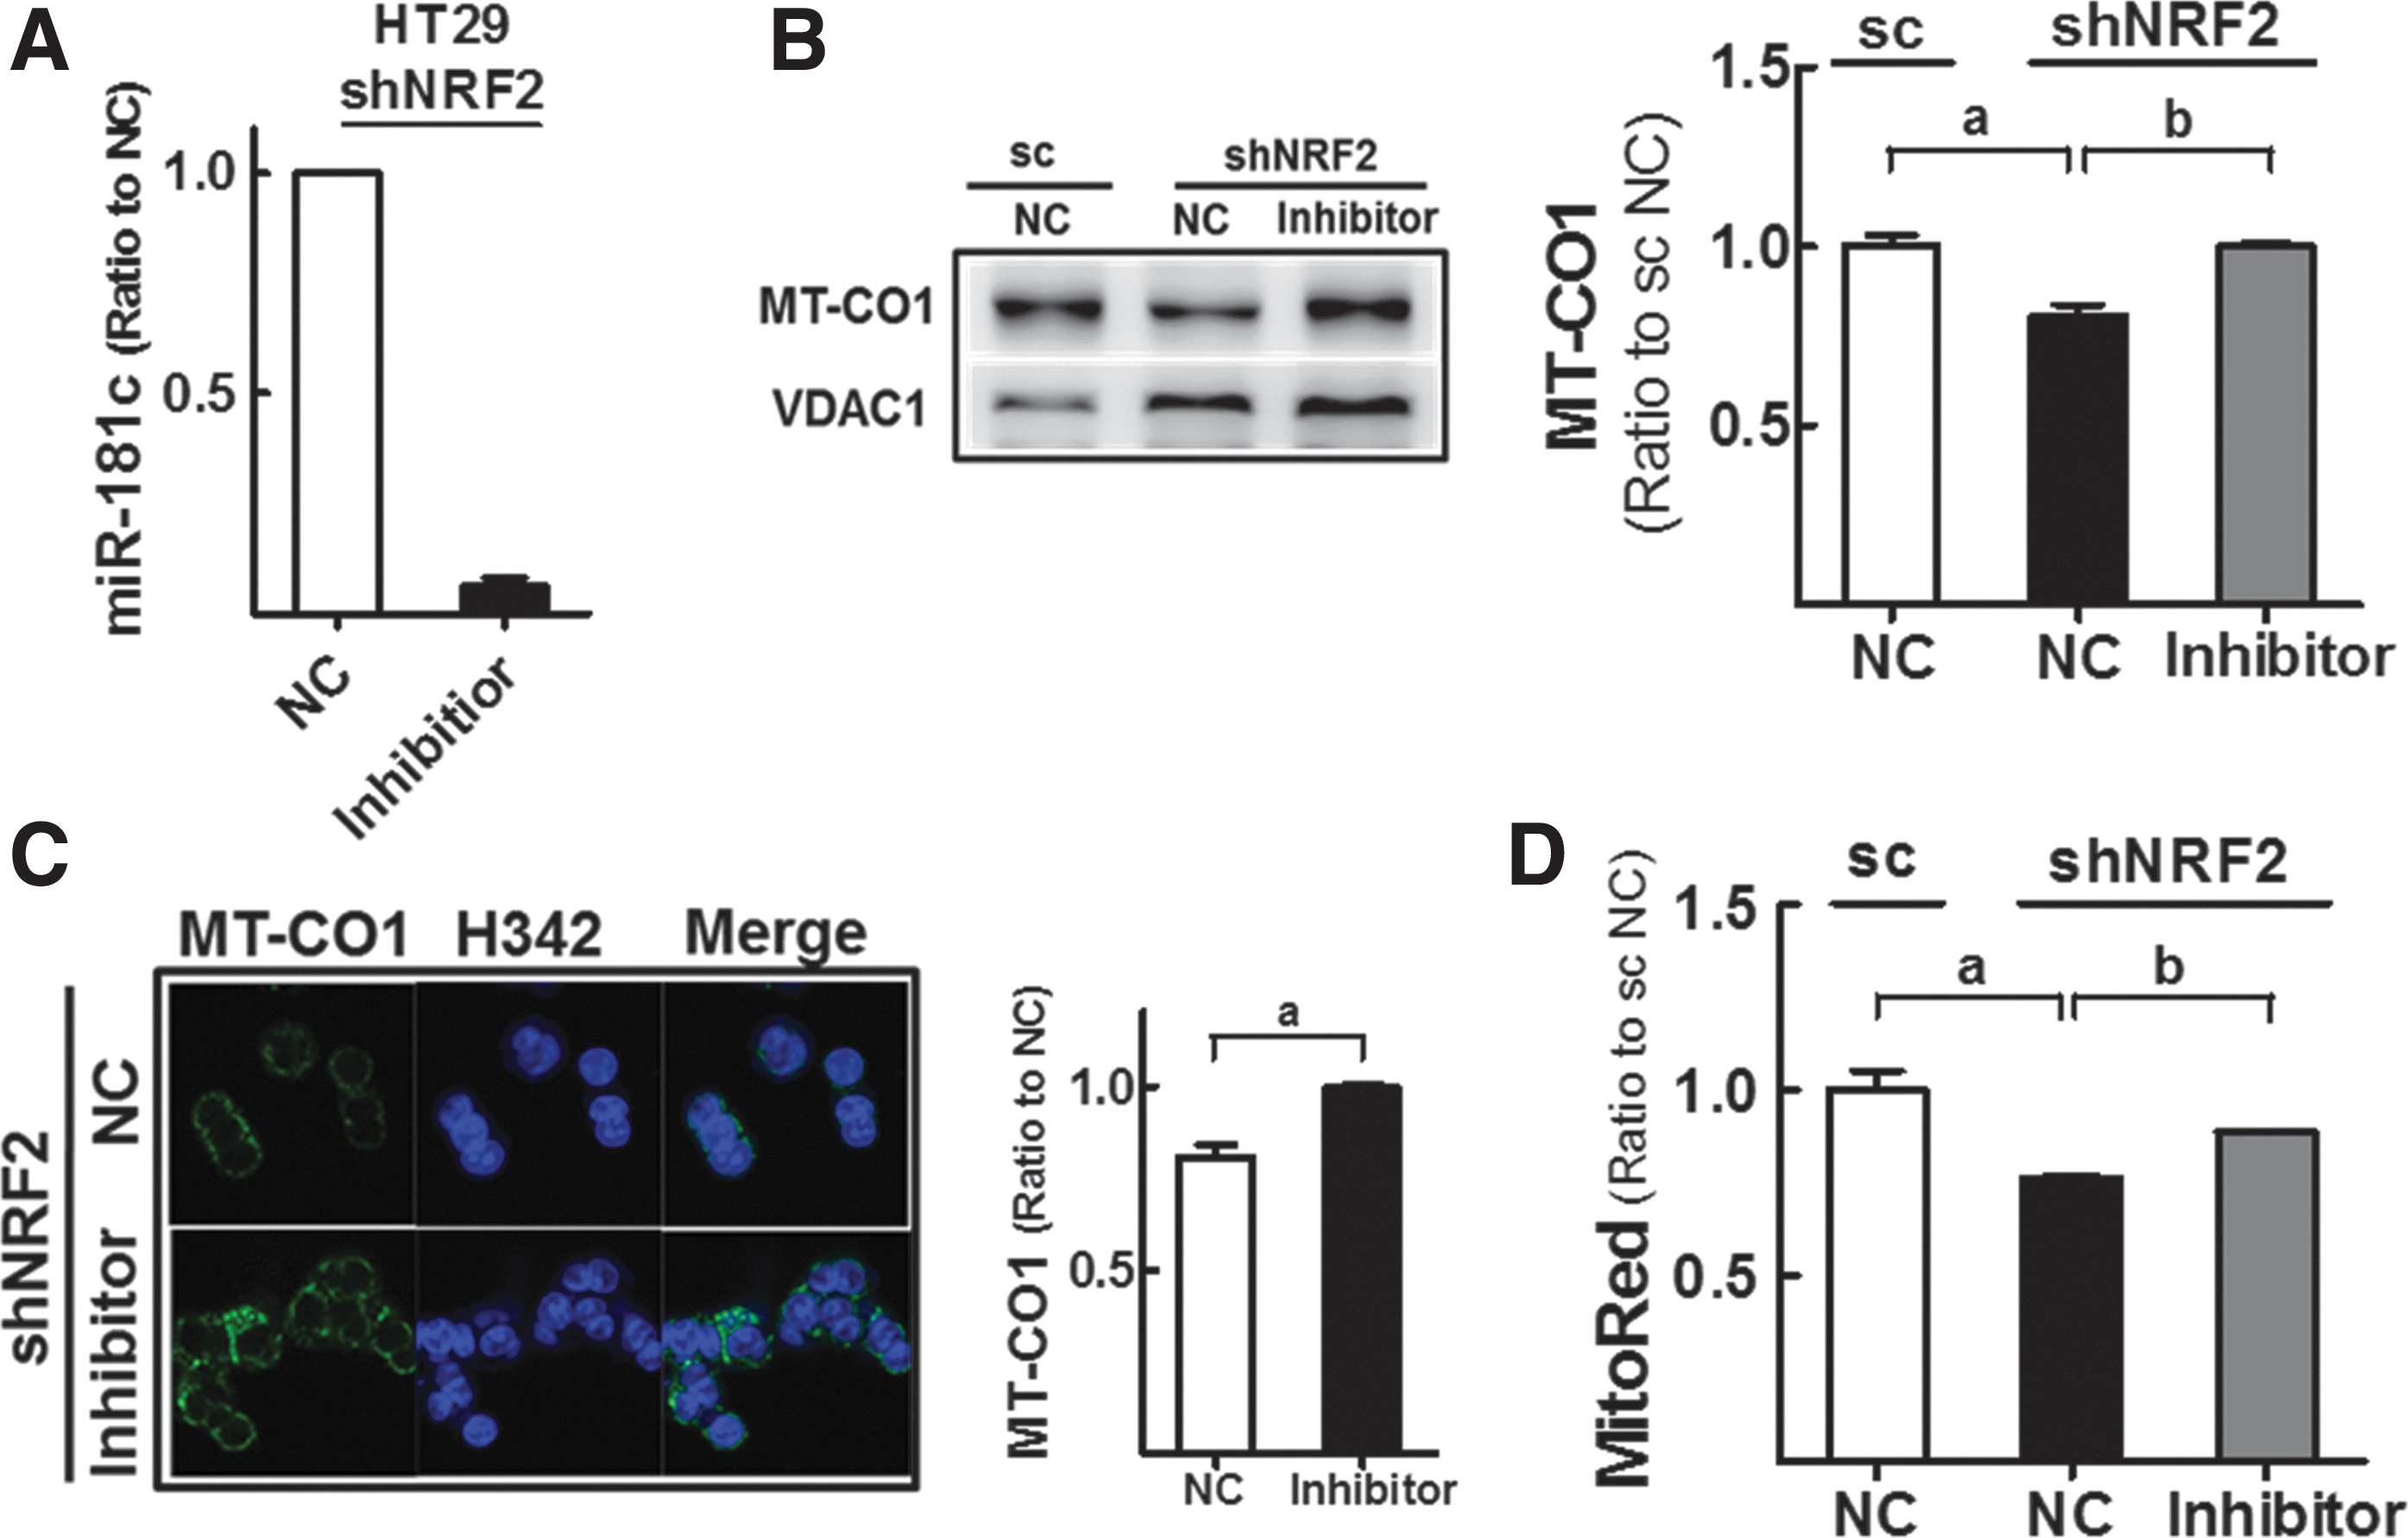
Then, shNRF2-HT cells were transfected with miR-181c inhibitor to confirm the role of miR-181c in NFE2L2/NRF2-silencing-induced MMP reduction (Fig. 4A). Western blot and immunocytochemical analyses showed that MT-CO1 levels in shNFE2L2/NRF2 cells were recovered to the levels in control cells after miR-181c inhibition (Fig. 4B, C). Similarly, MMP levels in knockdown cells were enhanced by miR-181c inhibition (Fig. 4D), supporting the regulation of MT-CO1 and MMP by miR-181c in NFE2L2/NRF2-knockdown cells.
In the human miR-181 family, miR-181a-5p and miR-181c share common core sequences for binding to the 3′ untranslated region of the MT-CO1 gene (Supplementary Fig. S5A). Microarray analyses showed that miR-181a-5p levels were 1.45- and 1.90-fold higher in NFE2L2/NRF2-knockdown HT29 and HCT116 cells, respectively (data not shown), and real-time RT-PCR confirmed that miR181a-5p levels were higher in shNRF2-HT cells (Supplementary Fig. S5B). However, MT-CO1 expression was not repressed after transfection with miR-181a mimic (miR-181a-1 or miR-181a-2; Supplementary Fig. S5C), indicating that miR-181a was not involved in MT-CO1 regulation.
Association of nuclear factor-κB signaling with the miR-181c increase
Next, we investigated the molecular mechanism underlying miR-181c upregulation. First, in KEAP1-knockdown HT29 cells, which exhibit constitutive NFE2L2/NRF2 activation, MT-CO1 level was not altered (Supplementary Fig. S6 and Fig. 5A), excluding the direct association of NFE2L2/NRF2 with miR-181c regulation. In line with the effect of ROS on MMP (Fig. 3B, D), treatment of cells with H2O2 (400 μM, 6 h) or NAC (1 mM, 24 h) did not affect miR-181c levels (Fig. 5B, C).
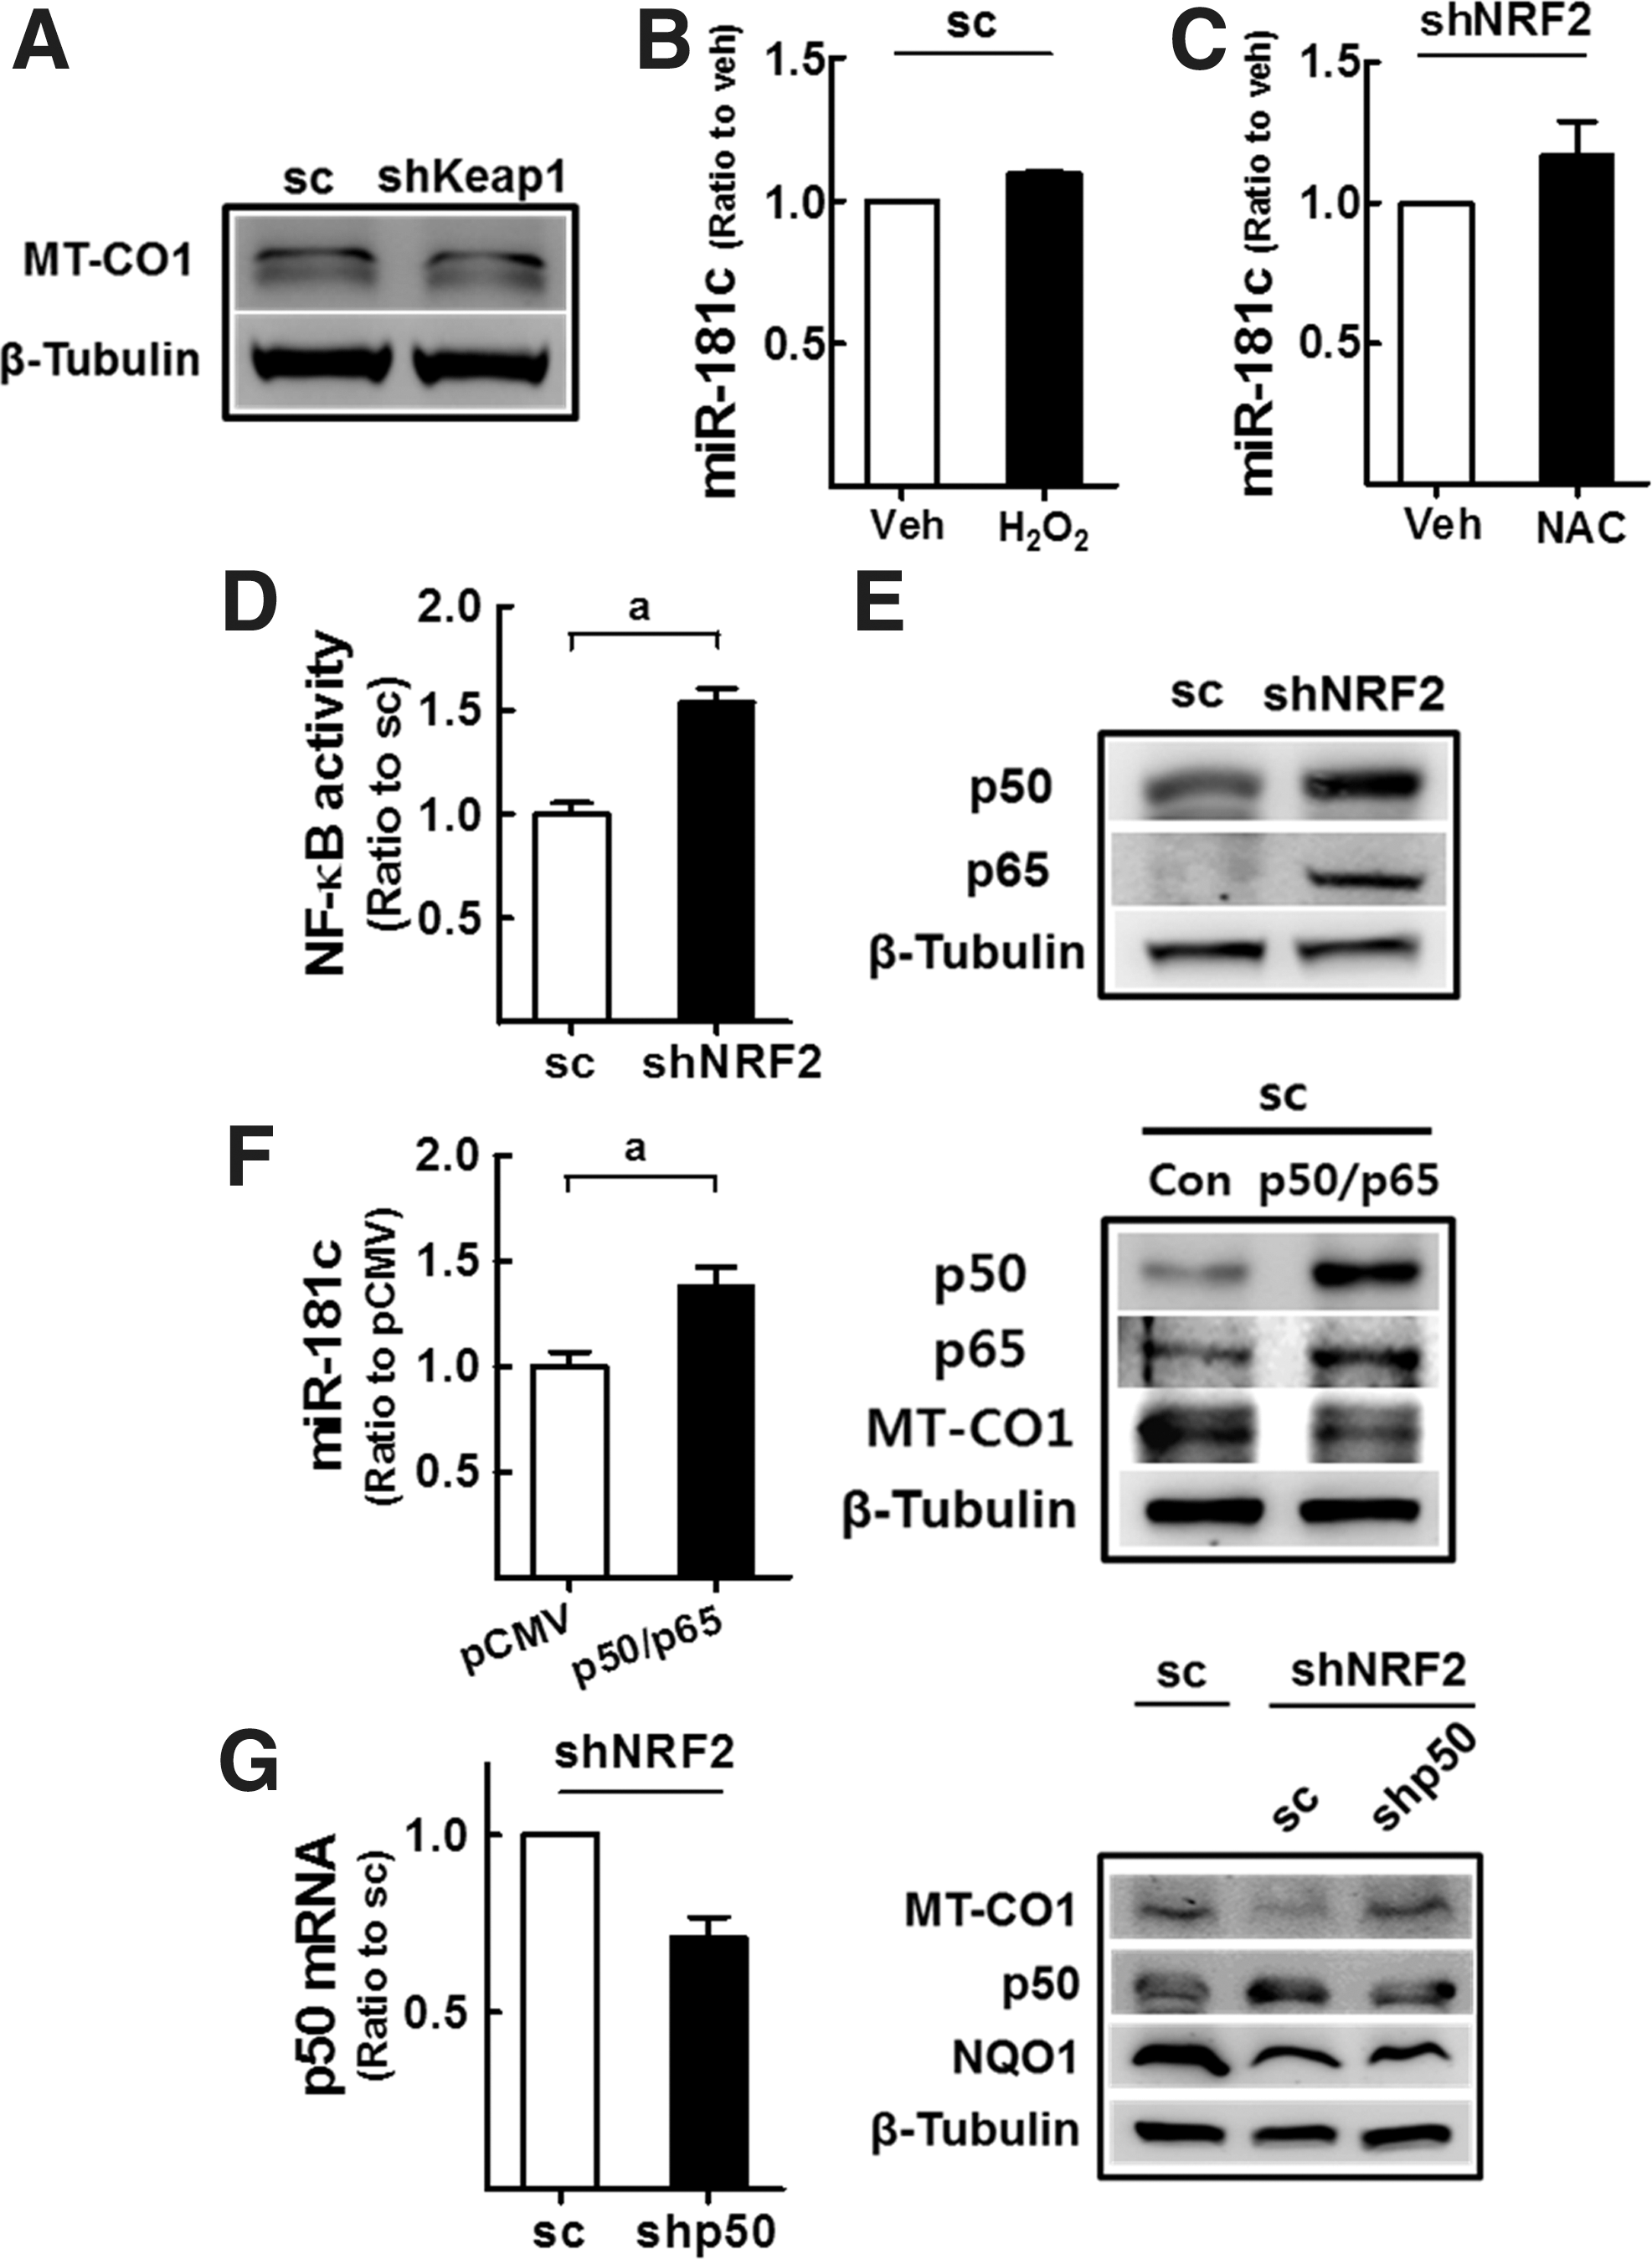
Several reports have indicated that miR-181c is associated with inflammatory diseases (21, 55). Therefore, we hypothesized that shNRF2-HT cells may retain altered nuclear factor (NF)-κB activity, which could be related to the upregulation of miR-181c. Indeed, NF-κB reporter activity was higher in shNRF2-HT cells (Fig. 5D), and p65 and p50 proteins were upregulated in these cells (Fig. 5E). Crucially, forced expression of p65 and p50 in sc-HT elevated miR-181c levels (Fig. 5F), and p50-silencing in shNRF2-HT enhanced MT-CO1 levels to a level comparable to that of the sc control (Fig. 5G). These results suggest that NFE2L2/NRF2 knockdown-induced NF-κB activation is associated with miR-181c/MT-CO1 repression.
Activation of AMPKα signaling in NFE2L2/NRF2-silenced cancer cells through miR-181c
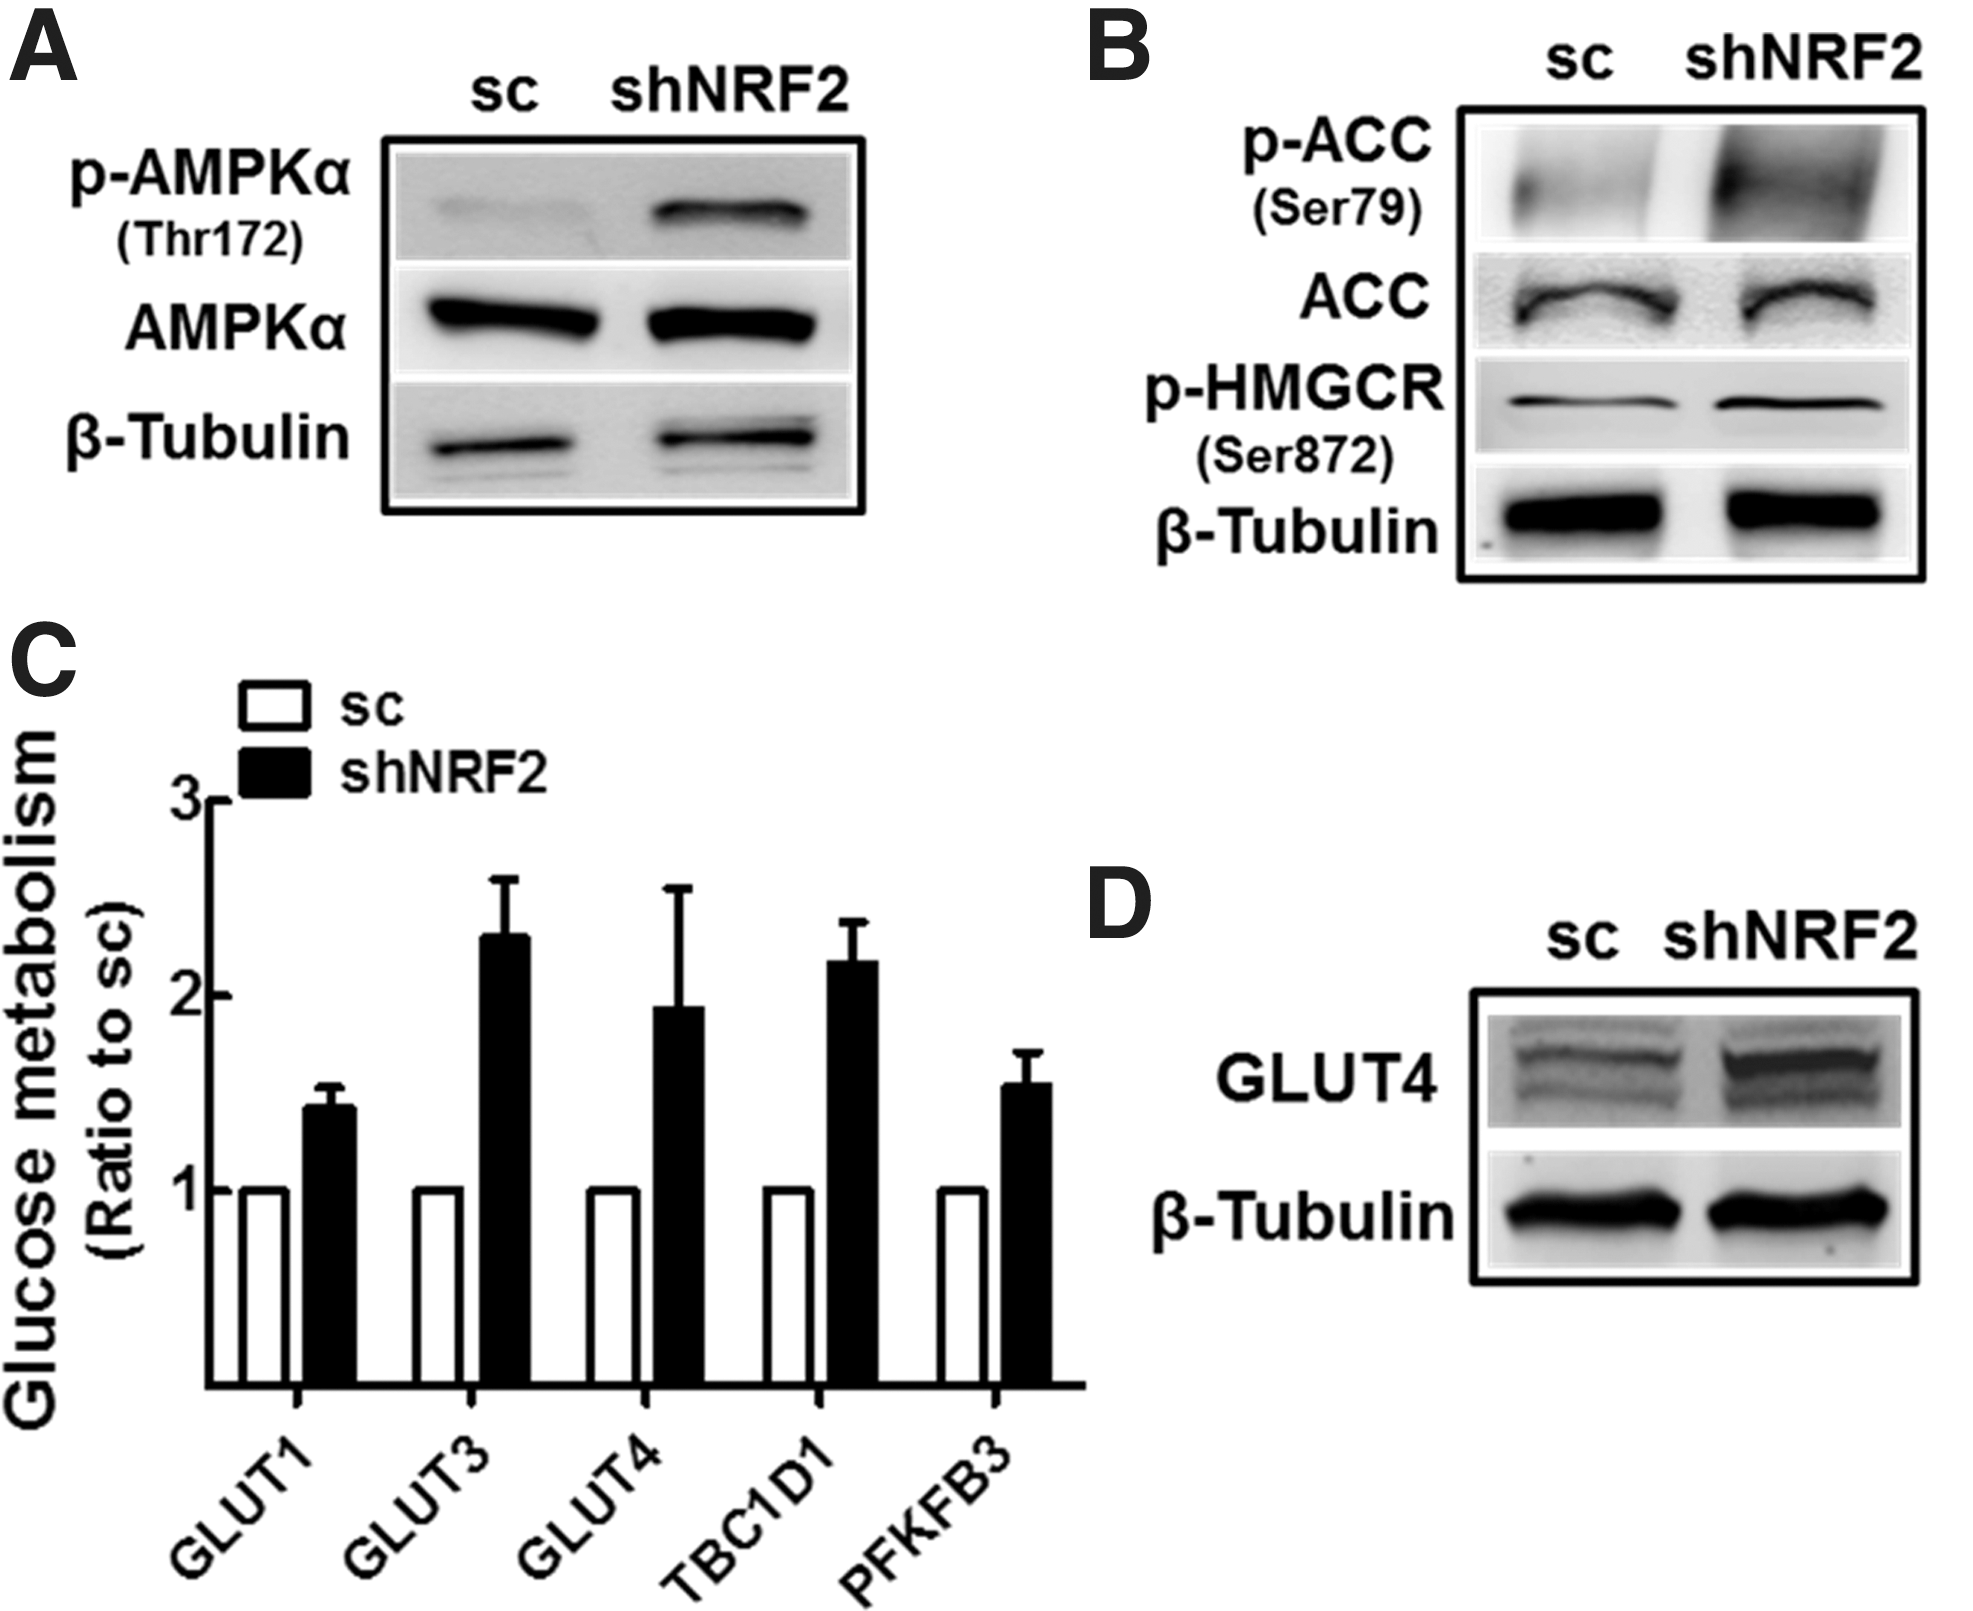
Since the proliferation of colon cancer cells was not affected by NFE2L2/NRF2-silencing (Fig. 2J, K), cellular adaptation to ETC dysfunction and ATP reduction can be hypothesized. Particularly, selective inhibition of cancer NFE2L2/NRF2 has been recognized as a promising strategy to control drug resistance (52) and therefore, elucidation of the molecular basis of cancer adaptation is crucial to develop this anticancer strategy. As a hypothetical adaptive pathway, AMPKα signaling can be activated in response to lower cellular ATP contents. Indeed, shNRF2-HT cells exhibited higher p-AMPKα/AMPKα levels compared with that in scHT cells (Fig. 6A). As a consequence of AMPK activation, NFE2L2/NRF2-knockdown cells exhibited changes in metabolic proteins. First, p-ACC/ACC ratio was increased in these cells, indicating the inhibition of fatty acid synthesis and the promotion of fatty acid oxidation (Fig. 6B). Moreover, p-HMGCR levels were higher in knockdown cells, suggesting repression of the sterol biosynthetic pathway. Second, as the glucose metabolism pathway, marginal increases were observed in GLUT1, GLUT3, GLUT4, (Tre-2/USP6, BUB2, Cdc16) domain-1 (TBC1D1), and 6-phosphofructo-2-kinase/fructose-26-biphosphatase 3 (PFKFB3) transcripts in knockdown cells (Fig. 6C). In accord with these, GLUT4 protein expression was higher in shNRF2-HT cells (Fig. 6D), implying enhanced glucose utilization.
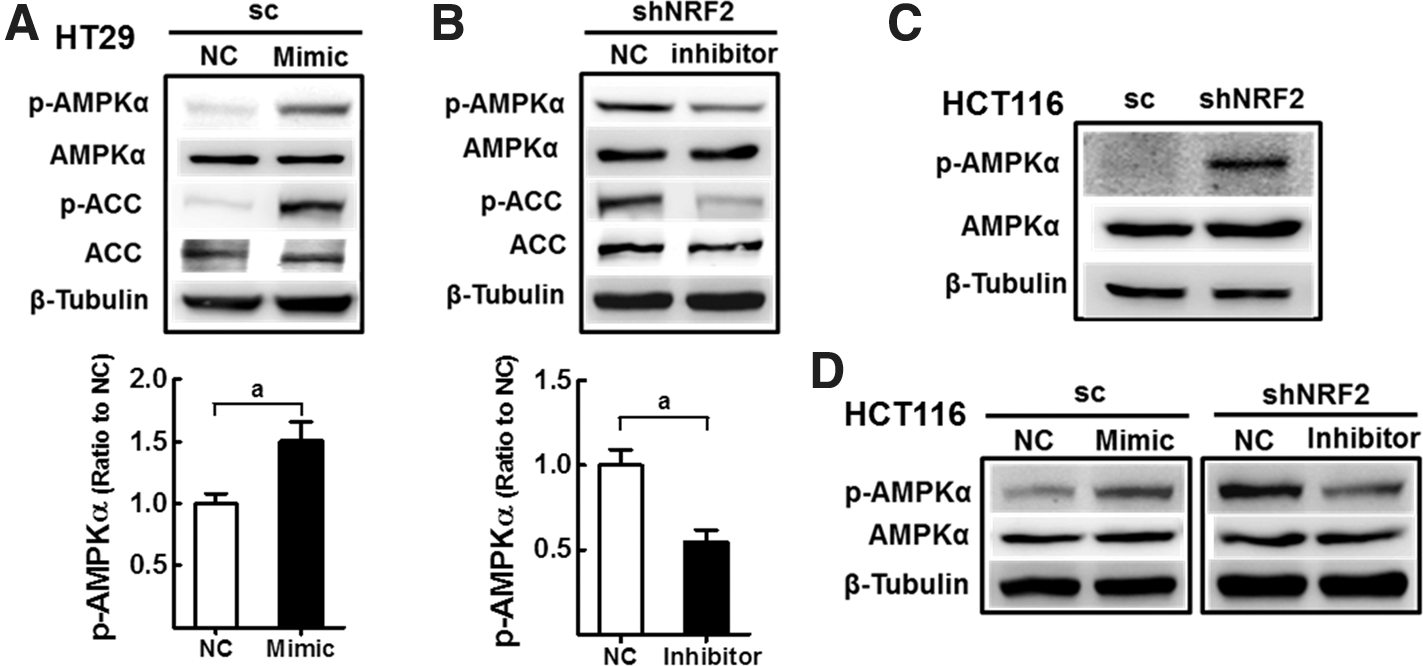
To confirm whether miR-181c is a molecular mediator for AMPK activation in NFE2L2/NRF2-silenced cancer, effects of miR-181c mimic or inhibitor treatment on AMPK have been examined. The introduction of miR-181c mimic into scHT cells increased AMPKα and ACC phosphorylation (Fig. 7A); conversely, miR-181c inhibitor transfection in shNFE2L2/NRF2-HT29 cells reduced AMPKα and ACC phosphorylation (Fig. 7B). Similarly, AMPKα activation was also observed in NFE2L2/NRF2-knockdown HCT116 cells (Fig. 7C), and this activation was blocked by miR-181c inhibitor (Fig. 7D). All together, these results showed that AMPKα signaling is stimulated in NFE2L2/NRF2-silenced cancer cells via miR-181c/MT-CO1 axis.
Sensitization of NFE2L2/NRF2-silenced cells to AMPK inhibition
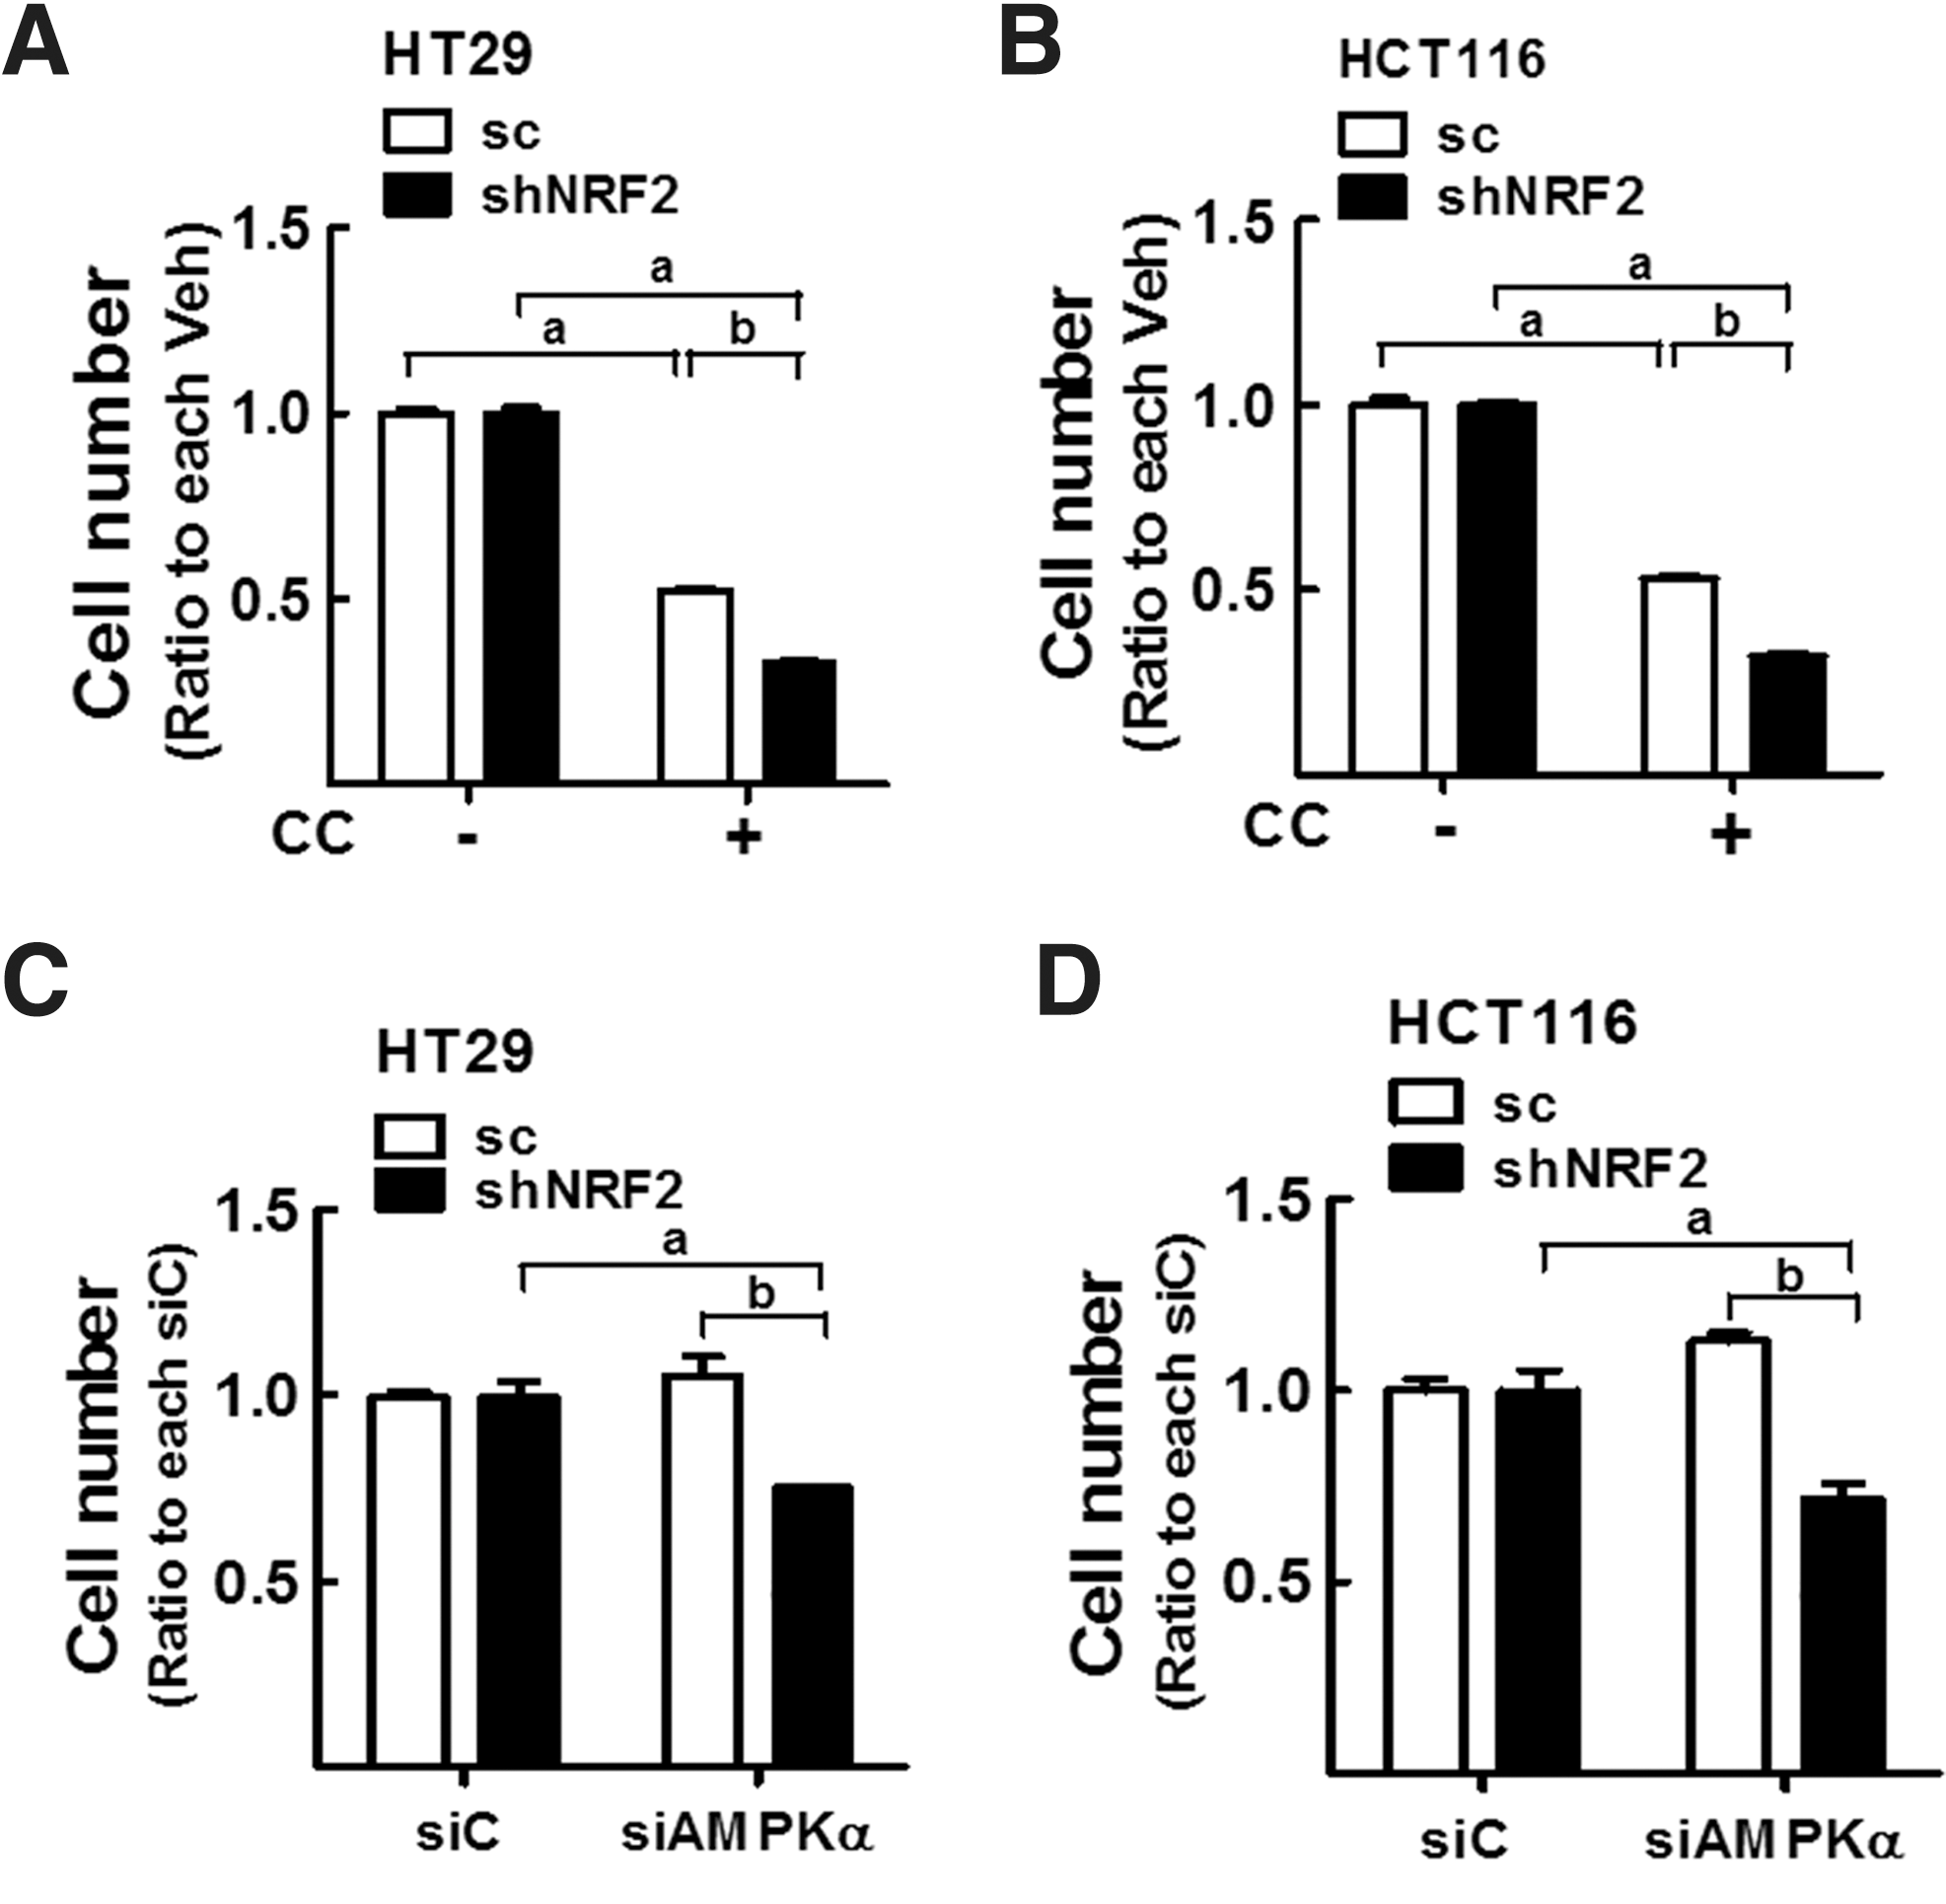
The physiological implication of activated AMPKα in NFE2L2/NRF2-silenced cells could be supported by the effects of the potent AMPK inhibitor compound C. After treatment with compound C (5 μM), p-ACC levels were completely abolished in both scHT and shNRF2-HT cells, indicating the effective inhibition of AMPKα by compound C (Supplementary Fig. S7A). In this condition, the viable cell number was significantly lower in shNRF2-HT and shNRF2-HCT cells than in the control cells (Fig. 8A, B). As recent findings indicated nonspecific effects of compound C other than AMPK inhibition (3, 35), genetic inhibition of AMPKα was adopted as well. The administration of AMPKα1/2-specific siRNA repressed viable cell numbers in NFE2L2/NRF2 knockdown HT29 and HCT116 cells but not in all control cells (Fig. 8C, D). These results suggest that NFE2L2/NRF2-knockdown cells were more dependent on AMPK signaling to promote survival than control cells.
Altered MT-CO1/AMPKα in NFE2L2/NRF2-silenced tumors and effects of AMPK inhibition
As tumor cells are located within a specific environment with hypoxic stress and nutrient deficiency, our in vitro observation might differ from an in vivo system. To ask this possibility, sc-HT and shNRF2-HT cells were inoculated into nude mice to investigate the role of NFE2L2/NRF2 in MT-CO1/AMPK within the tumor environment. At the same time, the effect of dual inhibition of NFE2L2/NRF2 and AMPK was evaluated by treating mice with compound C. In the scHT group, tumors developed 7 days after inoculation, and the tumor volume increased continuously till 30 days (Fig. 9A). Compound C treatment (5 mg/kg, intraperitoneal injection) was started on day 11 after inoculation and continued till 28 days (Fig. 9A). After termination of the experiment on day 31, we found that the growth of shNRF2-HT-derived tumors, which was assessed by tumor volume and tumor weight, was significantly retarded compared with that of scHT cell-derived tumors (Fig. 9A, B), confirming our previous observations (31). In agreement with the in vitro results, compound C treatment suppressed the growth of NFE2L2/NRF2-knockdown tumors; compound C induced significant reductions in tumor weights in the shNRF2-HT group, but not in the scHT group (Fig. 9B).
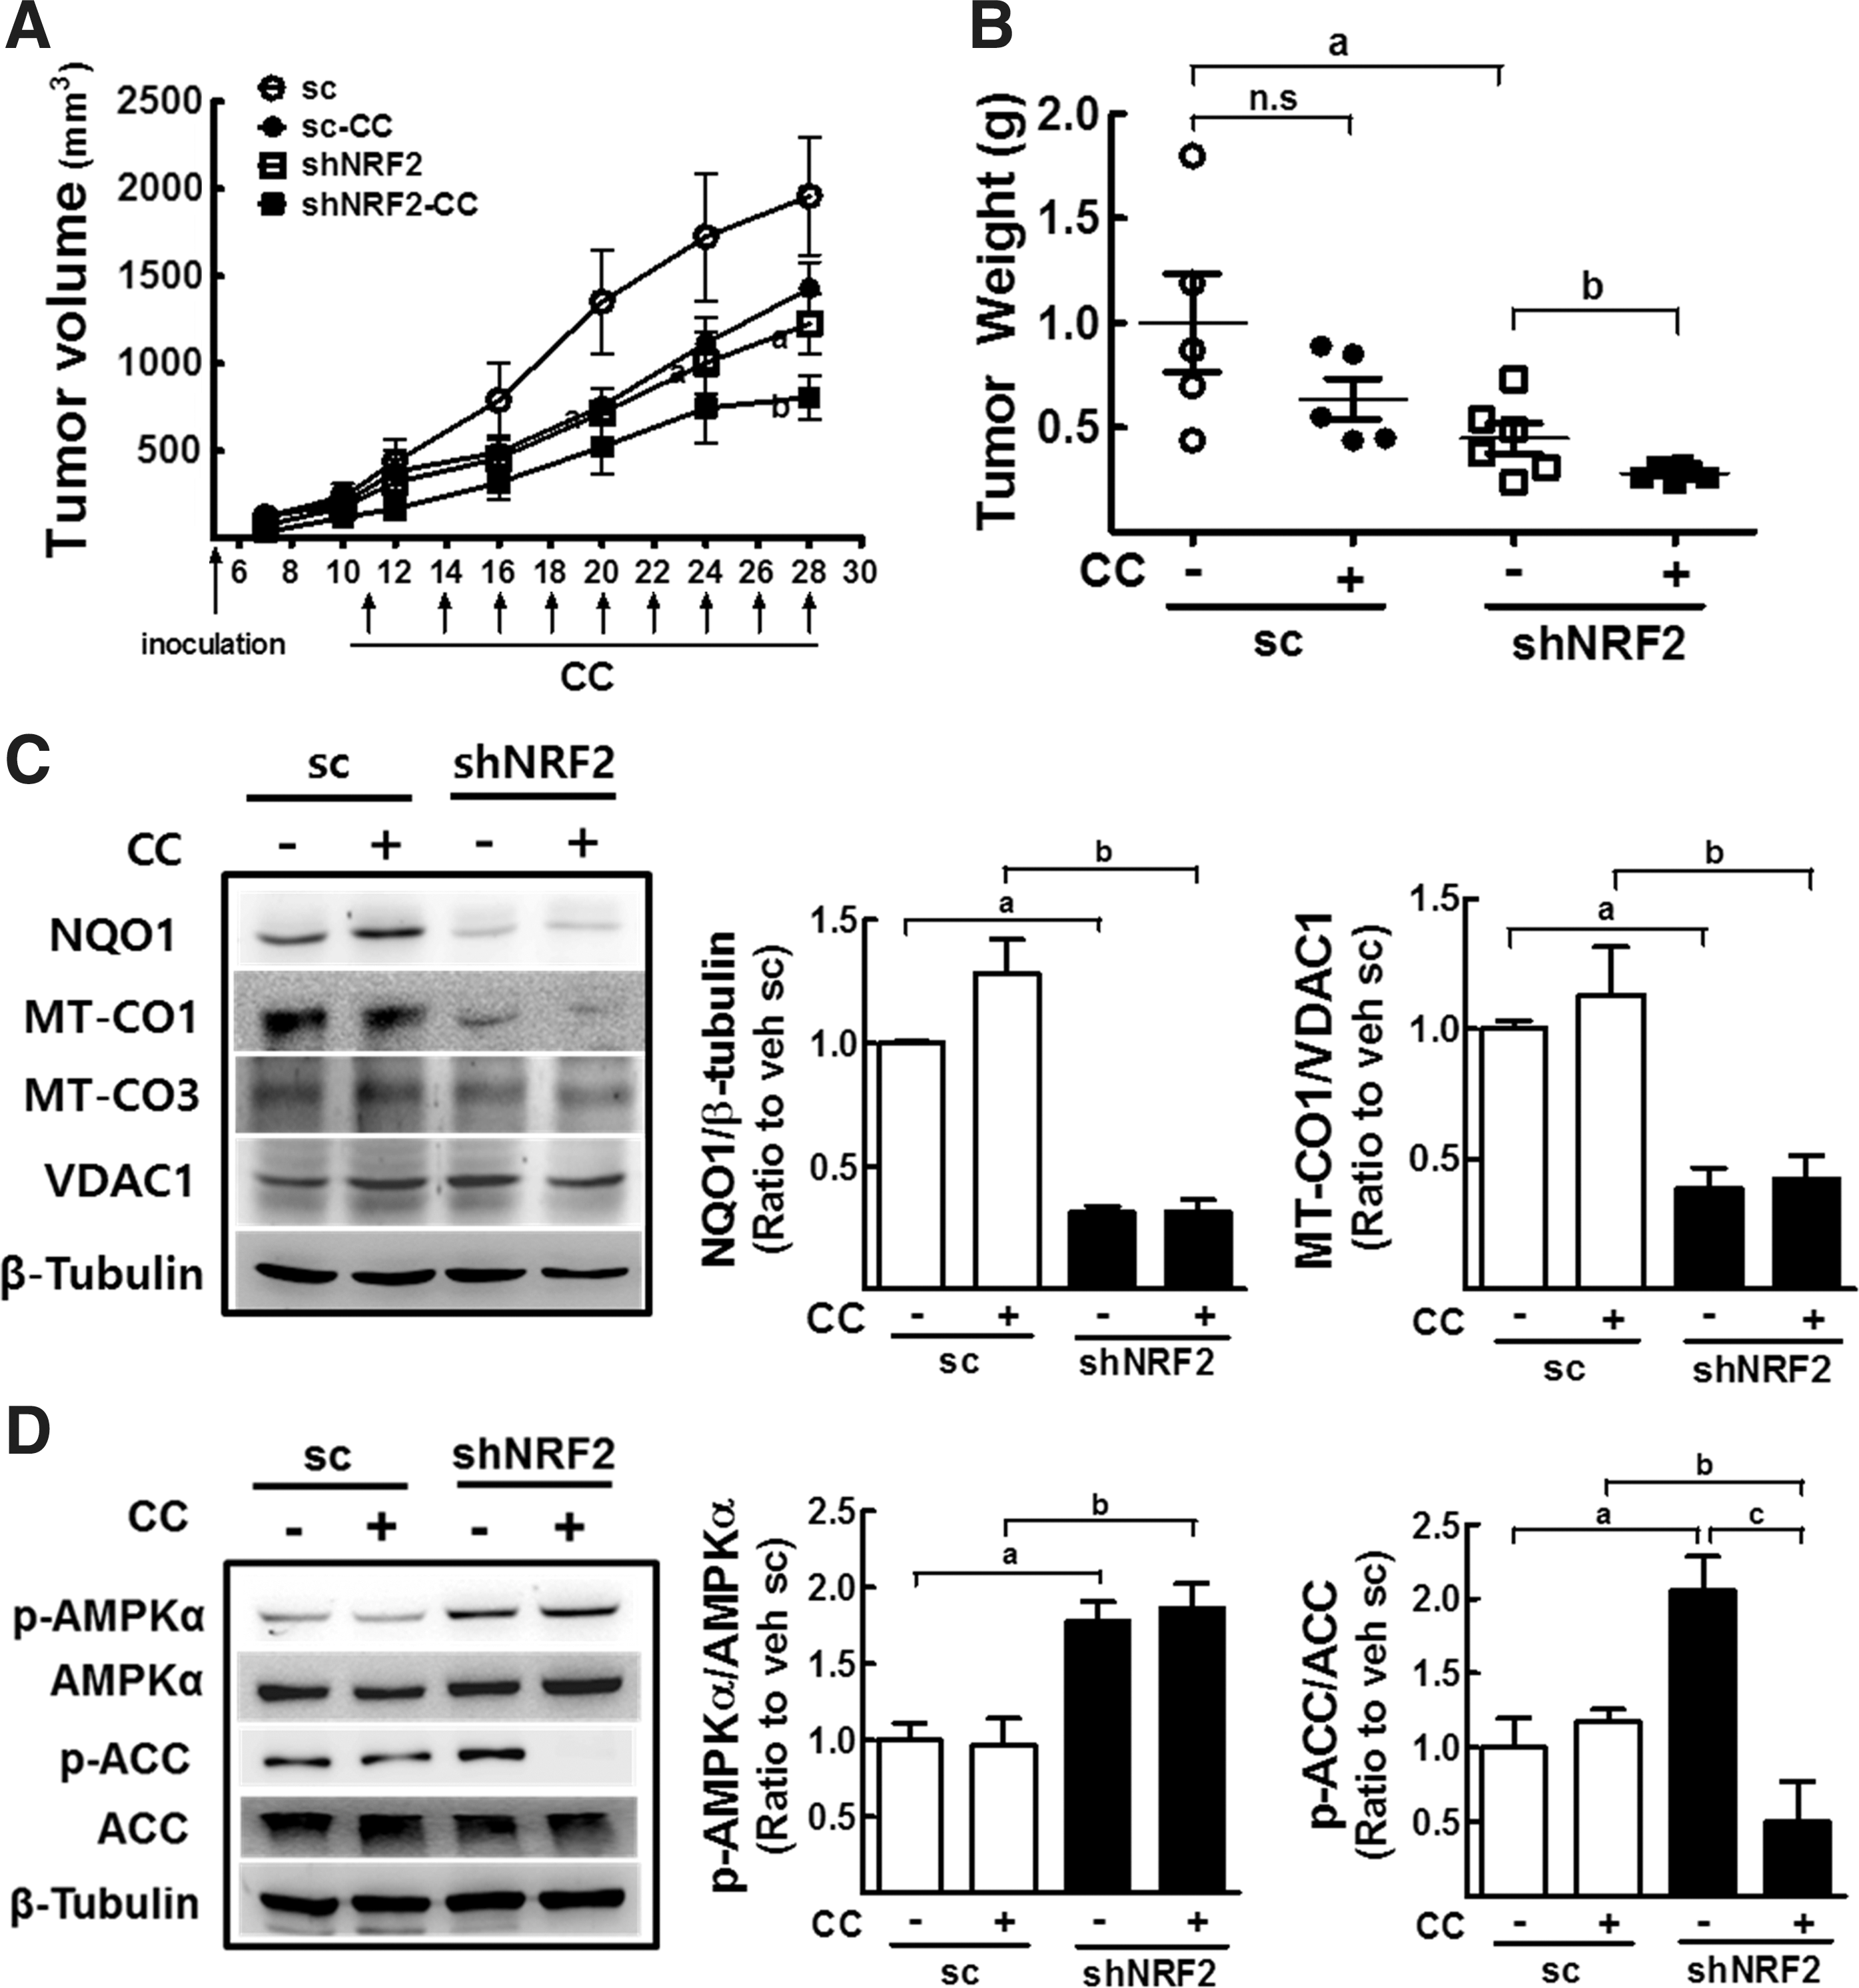
Notably, within the tumor environment, the link between NFE2L2/NRF2 and MT-CO1/AMPK axis was retained. MT-CO1 levels were lower in shNRF2-HT cell-derived tumors (Fig. 9C), and the levels of p-AMPKα/AMPKα ratio were significantly higher in shNFE2L2/NRF2 tumors (Fig. 9D). Accordantly, NFE2L2/NRF2-knockdown tumors retained increased p-ACC/ACC ratio, p-HMGCR, and GLUT4 levels compared with control tumors. These results confirmed the association of NFE2L2/NRF2 with MT-CO1/AMPK signaling in an in vivo environment. In addition, obtained data demonstrated the advantageous antitumor effect of dual inhibition of NFE2L2/NRF2 and AMPK.
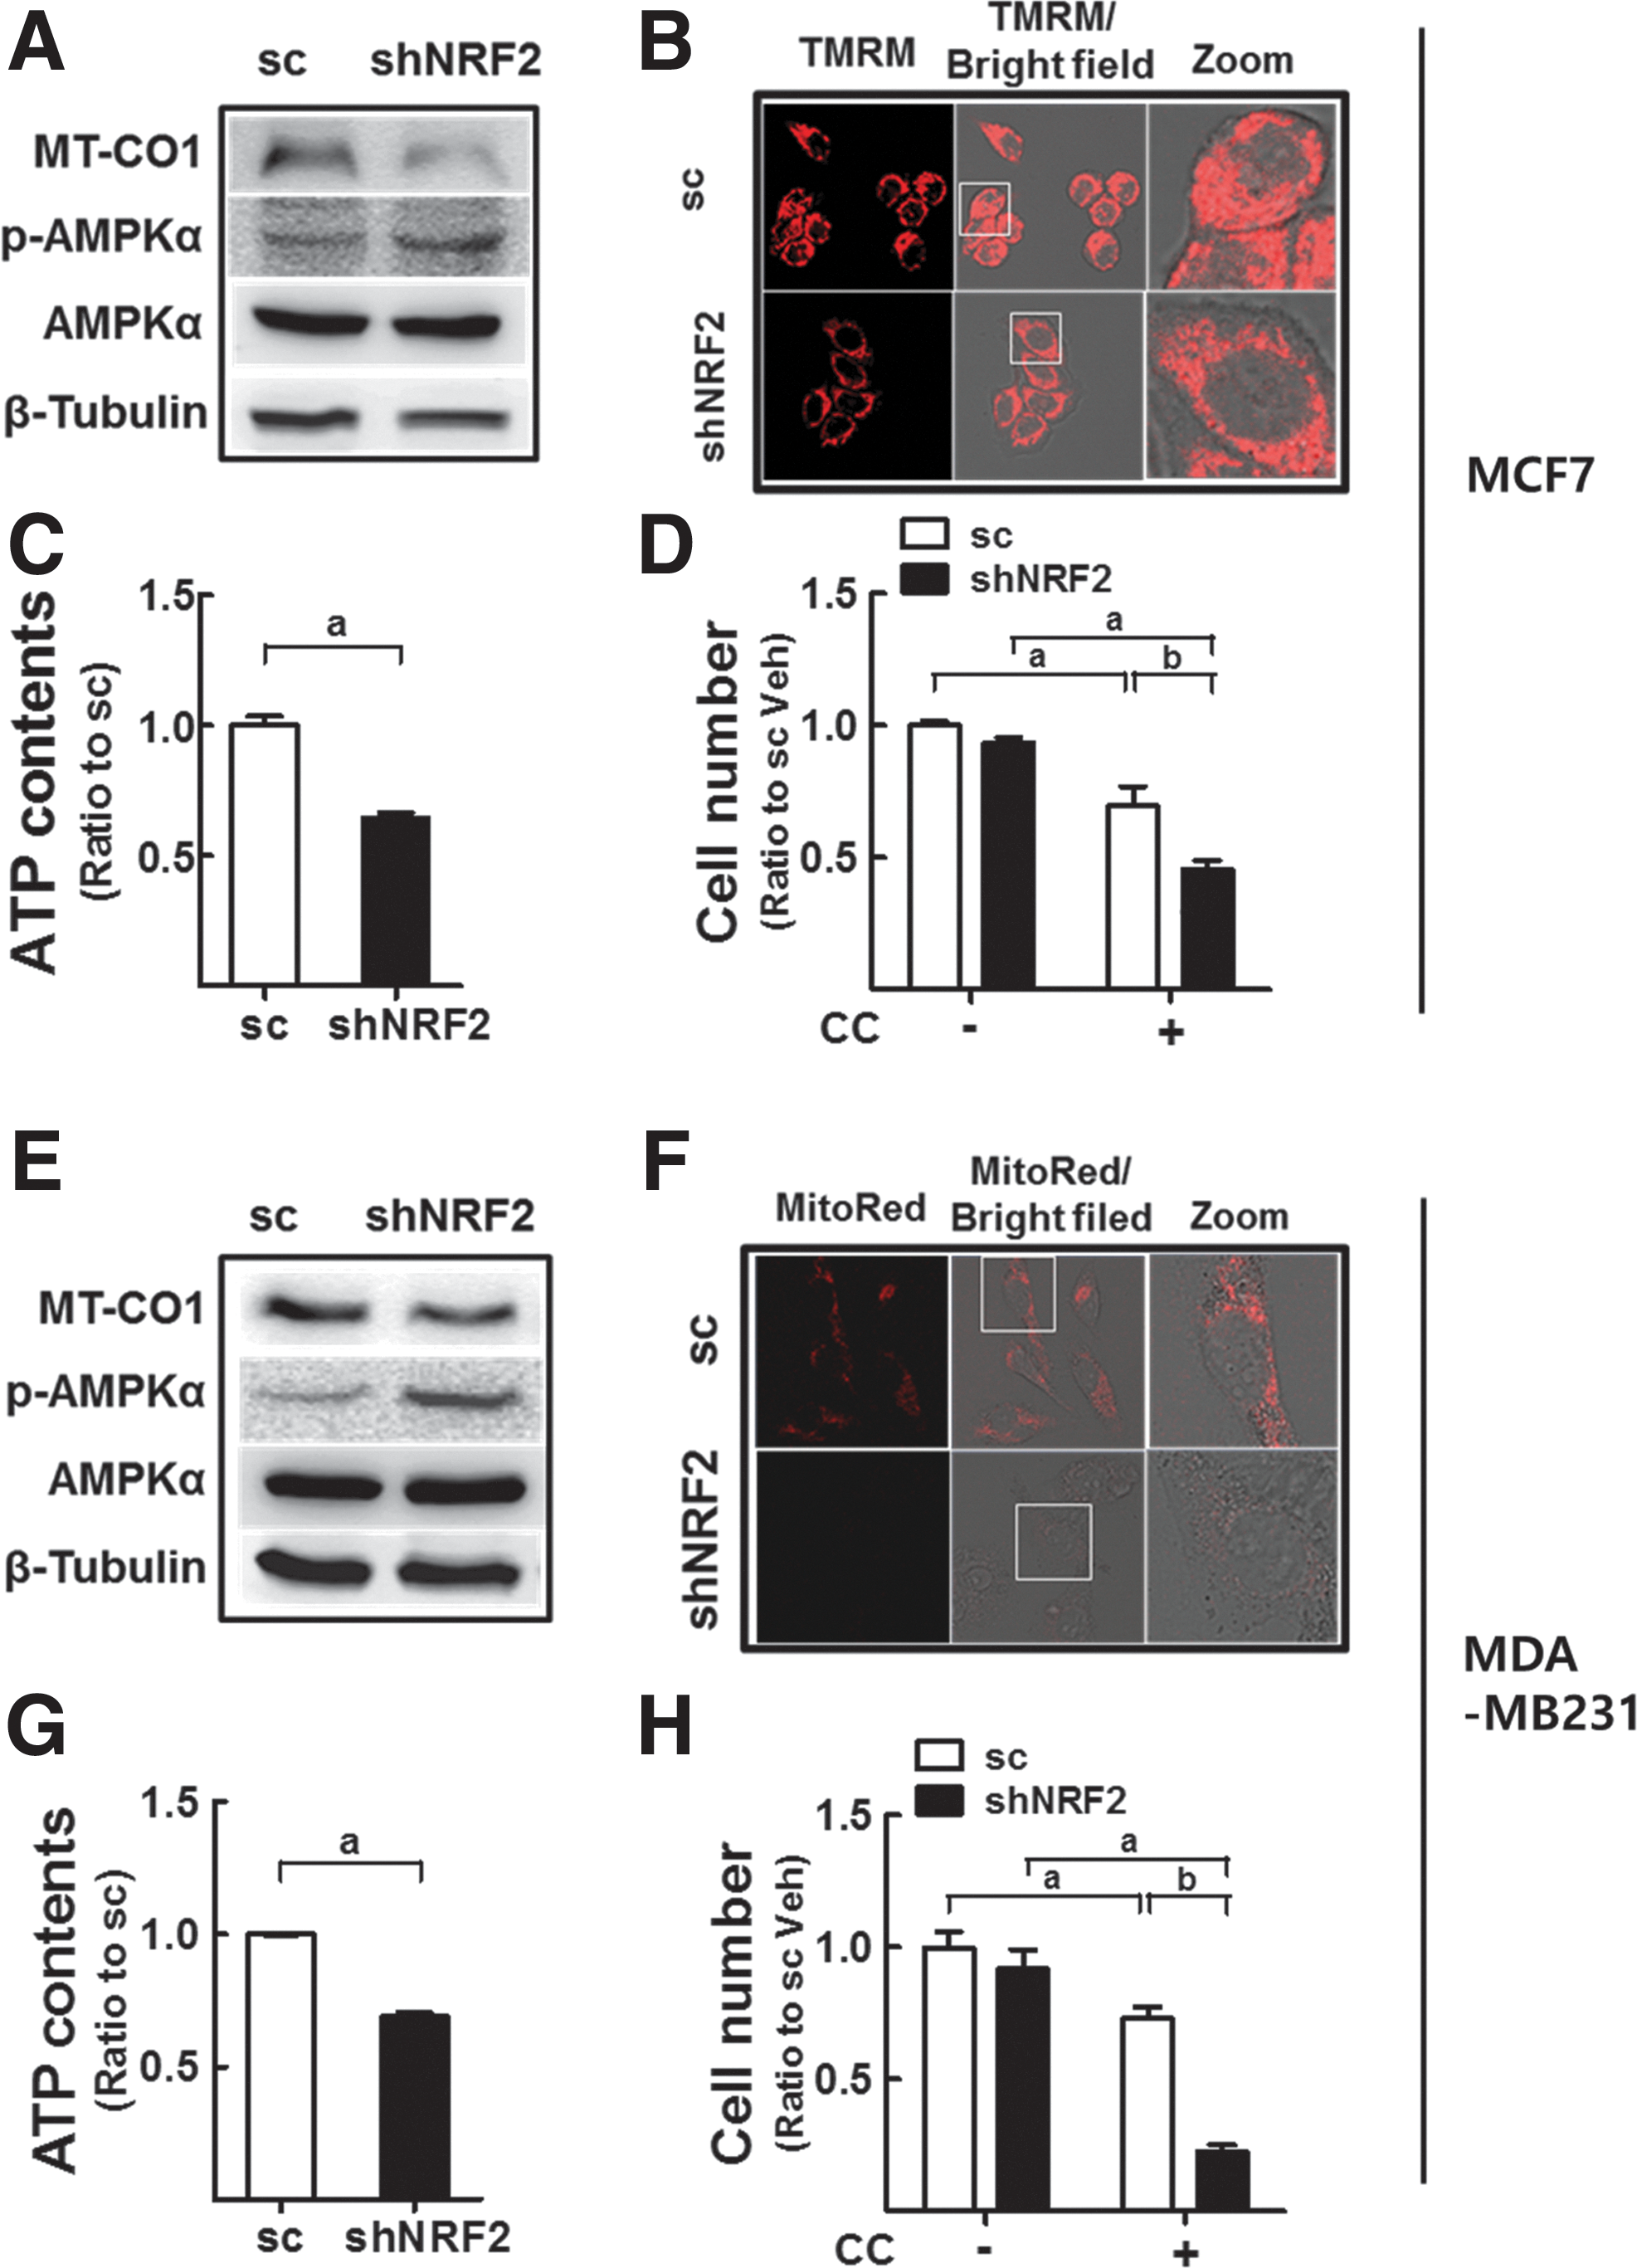
MT-CO1 repression and AMPK activation in NFE2L2/NRF2-knockdown breast cancer cells
Next, we examined this mechanism in other types of cancer cells. NFE2L2/NRF2-knockdown MCF7 breast cancer cells (shNRF2-MCF) showed decreased levels of MT-CO1 and increased levels of p-AMPKα (Fig. 10A). MMP levels and cellular ATP content were diminished in shNRF2-MCF (Fig. 10B, C). Similar to colon cancer cells, shNRF2-MCF cells were more sensitive to compound C-induced growth inhibition, indicating the beneficial antitumor effect of dual inhibition of NFE2L2/NRF2 and AMPK (Fig. 10D). Similar results were obtained in NFE2L2/NRF2-knockdown MDA-MB-231 breast cancer cells (Fig. 10E–H).
Discussion
Cancer cells can evolve to acquire adaptive phenotypes in response to stressful tumor microenvironments. This adaptive behavior is often associated with chemotherapy resistance, tumor relapse, and invasion/metastasis. In this context, oxidative stress, which is one of the characteristic features of the tumor microenvironment, may act as a selective pressure for constitutive activation of NFE2L2/NRF2. Indeed, it was estimated that NFE2L2/NRF2 is upregulated by 25–35% in lung cancers, and the genetic alterations in the KEAP1 gene for NFE2L2/NRF2 activation were found to be the second most prevalent somatic mutations in lung adenoma carcinoma (56). Based on these findings, the development of NFE2L2/NRF2 inhibitors is gaining attention as a potential therapy to control tumor growth and to enhance sensitivity to chemotherapy (52). In this study, we demonstrated that NFE2L2/NRF2 activity was directly linked to cancer mitochondria through the regulation of the miR-181c/MT-CO1 pathway (Supplementary Fig. S8). In addition, we showed that AMPKα signaling, which is another player that endows cancer cells with adaptive ability, was activated as a result of altered mitochondrial function by using NFE2L2/NRF2-silenced cells from colon and breast cancers. These results provide insights into the molecular networks linking NFE2L2/NRF2 and AMPKα signaling and therefore, the dual inhibition of NFE2L2/NRF2 and AMPKα may be effective in overcoming adaptive behaviors of cancer.
MiR-181c has been identified as a nucleus-encoded miRNA that regulates the mitochondrial genome in rat cardiomyocytes (11). The levels of miR-181c were twofold higher in the mitochondrial fraction than in whole cell lysates of cardiomyocytes. Within the mitochondria, miR-181c was shown to react with the 3′-untranslated region of the rat MT-CO1 gene and to inhibit its translation (10, 11). Our results confirmed the regulatory role of miR-181c in MT-CO1 expression in cancer cells, and as a functional implication, we demonstrated that the miR-181c-mediated MT-CO1 reduction was associated with MMP disruption, ATP reduction, and AMPKα activation. Particularly, NFE2L2/NRF2-silenced colon cancer cells, which express higher levels of miR-181c, exhibited lower mitochondrial OCR: The basal respiration as well as spare respiratory capacity was diminished in NFE2L2/NRF2-knockdown cells. As direct evidence of the link between miR-181c and MMP, transfection of colon cancer cells with miR-181c mimic repressed MT-CO1 and MMP levels and stimulated AMPKα, whereas miR-181c inhibitor transfection in NFE2L2/NRF2-silenced cells resulted in the recovery of MT-CO1 and MMP levels and the inhibition of AMPKα. Unlike our observations, Das et al. (11) demonstrated that miR-181c overexpression elevated oxygen consumption and MMP levels in cardiocytes. This discrepancy cannot be fully explained; however, cell-type difference can be surmised to be involved in this. Our observations were based on the cancer cell system, which may have different mitochondrial capacity and dependence from normal cells. The impact of miR-181c on one of the ETC subunits may have disparate outcomes depending on cell types.
It is also noteworthy that MT-CO1 reduction was not mediated by miR-181a, although miR-181a and miR-181c are the same miRNA gene family with a high sequence homology. As supportive evidence of the distinctive role of these two miRNAs, it has been shown that miR-181a, but not miR-181c, promoted T cell development through a unique pre-miRNA loop nucleotide that is different from miR-181c (34). This suggests that different activity of miR-181c to MT-CO1 expression can be determined by pre-miRNA loop nucleotides.
Regarding the underlying molecular events of miR-181c upregulation in NFE2L2/NRF2-silenced cells, it was apparent that ROS or NFE2L2/NRF2 is not the direct cause. Although NFE2L2/NRF2-silenced cancer cells retained higher levels of ROS, treatments with H2O2 or NAC did not affect the miR-181c levels (Fig. 5B, C). Moreover, levels of MT-CO1 were not influenced by KEAP1 knockdown (Fig. 5A), indicating that miR-181c regulation is indirectly linked to NFE2L2/NRF2. Instead, although additional future studies are required at this time point, NF-κB was involved in miR-181c regulation. NF-κB was activated in NFE2L2/NRF2-silenced cancer cells, presumably as a compensatory mechanism, and overexpression of NF-κB increased miR-181c level in the control HT29 (Fig. 5F). However, knockdown of NF-κB restored MT-CO1 level in NFE2L2/NRF2-silenced HT29 (Fig. 5G).
The significance of ETC alteration in MMP maintenance and ATP production has been demonstrated in multiple experimental systems. The treatment of cells with nitric oxide (NO) resulted in the MMP drop by competing with oxygen for MT-CO1 binding (17, 38). Genetic inhibition of ETC subunits affected ETC function. The mitochondrial specific delivery of antisense RNA, which targets cytochrome c oxidase subunit II, depolarized MMP (15). Knockdown of cytochrome c oxidase subunit VB in breast cancer cells resulted in ATP downregulation and MMP disturbances (16). The genetic silencing of the subunit-4 of cytochrome c oxidase in mouse myoblasts led to the metabolic shift to glycolysis through ETC modulation (14). Moreover, the relationship between ETC function and AMPK activity has been well characterized in studies with biguanide metformin. Metformin binds to the ETC complex I and, therefore, activates AMPKα via ATP reduction, which can induce beneficial metabolic changes in diabetic patients (44). The role of mitochondrial ETC in cancer biology can be more critical in nutrient stress conditions. Since a recent study showed that cancer cell lines that are the most vulnerable to low glucose retained genetic defects in ETC (5), NFE2L2/NRF2-silenced cells may have differential responses to glucose-restricted conditions. Indeed, NFE2L2/NRF2 silencing did not affect cell proliferation within nutrient-rich normal medium, and enhanced growth inhibition was only observed under glucose-limited conditions. Notably, because tumor cells are usually located in a microenvironment that is characterized by limited nutrient supply, NFE2L2/NRF2-silencing may affect intratumoral cells. As NFE2L2/NRF2-knockdown tumors showed an MT-CO1 reduction, along with suppression of angiogenesis in NFE2L2/NRF2-deficient tumors (31), ETC dysfucntion may also contribute to inhibition of tumor growth in NFE2L2/NRF2-silenced tumors.
The effects of NFE2L2/NRF2 on mitochondrial function have been proposed in recent studies (13). Similar to our observations, MMP and ATP production was low in NFE2L2/NRF2-null murine embryonic fibroblasts and neurons from NFE2L2/NRF2-null mice when compared with those in wild-type cells. In these NFE2L2/NRF2-null cells, cellular respiration was also impaired, although there were no changes in ETC enzyme activities (20, 37). In these previous reports, reduced substrate availability for OXPHOS, such as NADH, has been suggested to be the cause of low respiration levels in NFE2L2/NRF2-knockout cells (20). The NFE2L2/NRF2-dependent alterations in metabolic gene expression resulted in the decrease in the supply of acetyl co-A and oxaloacetate to the TCA cycle in NFE2L2/NRF2-silenced cancer cells (49). As an additional explanation, NFE2L2/NRF2 was involved in mitochondrial biogenesis through transcription factors such as peroxisome proliferator-activated receptor-γ coactivator-1α (13, 25). Together with these reports, our study confirms the reduced mitochondrial function in NFE2L2/NRF2-inhibited cells, and it provides novel evidence showing the direct link of NFE2L2/NRF2 to mitochondria by identifying miR-181c/MT-CO1 as a molecular pathway.
Based on the contextual role of AMPKα in cancer biology, AMPKα activation and consequent changes in metabolic proteins can bring about two outcomes in our NFE2L2/NRF2 knockdown cancer. First, because AMPKα functions to suppress biosynthetic pathways in response to ATP scarceness condition (39), NFE2L2/NRF2 silencing might be involved in the inhibition of cancer proliferation through AMPKα signaling. Indeed, in glucose-free condition, AMPKα was highly activated in NFE2L2/NRF2-silenced cancer cells (Supplementary Fig. S7B) and viable cell number was greatly lower in these cells when compared with the control group (Fig. 2J, K). Second, AMPKα signaling can provide cancer cells with adaptive flexibility in metabolism, and it finally confers resistance to adverse microenvironments. AMPKα-driven phosphorylation of ACC promotes mitochondrial fatty acid uptake and β-oxidation, resulting in facilitated fatty acid utilization for ATP production (47). In addition, because of reduced fatty acid synthesis and increased β-oxidation, cellular levels of NADPH, a major reducing power, are elevated and this can induce resistance to apoptotic signaling (33). Cancer cells lacking AMPKα could not maintain bioenergetic homeostasis on stress conditions; therefore, these cells were prone to undergo apoptotic responses (6, 22). In this context, activation of AMPKα signaling to a moderate level can be an adaptive response of NFE2L2/NRF2 knockdown cells for the maintenance of energy homeostasis. As supportive evidence, these cells showed a greater inhibitory effect on cell proliferation after treatment with the pharmacological or genetic inhibitor of AMPKα. Similarly, the growth of NFE2L2/NRF2-knockdown cell-derived tumors could be significantly suppressed by AMPKα inhibitor treatment. These results suggest that the inhibition of cancer NFE2L2/NRF2 may act as another selective pressure for AMPKα activation; therefore, the consideration of strategic dual inhibition of NFE2L2/NRF2 and AMPKα may provide potential benefits to overcome adaptive cancer behaviors such as drug resistance. In addition to our observation, lines of evidence indicate the cross-talk between NFE2L2/NRF2 and AMPKα. The treatment of human endothelial cells with pharmacological AMPKα activator increased nuclear NFE2L2/NRF2 levels and HO-1 expression (36). Recently, it was shown that AMPKα facilitates nuclear translocation of NFE2L2/NRF2 through direct phosphorylation at Ser550 residue (26).
Collectively, our results provided novel insights into the molecular event linking NFE2L2/NRF2 and mitochondria and also showed the adaptive interplay between NFE2L2/NRF2 and AMPKα signaling in cancer. Based on these, we propose that NFE2L2/NRF2 and the miR-181c/MT-CO1/AMPKα pathway may be considered novel signaling targets to control cancer cell growth in the context of the stressful tumor microenvironment. Furthermore, the combinatorial inhibition of NFE2L2/NRF2 and AMPKα may provide additional benefits for tumor inhibition by suppressing the metabolic adaptation response of cancer cells.
Materials and Methods
Materials
Carbonyl cyanide 3-chlorophenyl hydrazone, Compound C,
Cell culture
HT29 (No. HTB-38) and HCT116 cells (No. CCL-247) (American Type Culture Collection [ATCC], Manassas, VA) were maintained in RPMI 1640 (GE Healthcare Life Sciences, Logan, UT) and Dulbecco's modified Eagle's medium (DMEM; GE Healthcare Life Sciences), respectively, with 10% fetal bovine serum (FBS; GE Healthcare Life Sciences) and penicillin/streptomycin (WelGene, Inc., Daegu, Republic of Korea). MCF-7 (No. HTB-22) and MDA-MB-231 (No. HTB-26) human breast cancer cells (ATCC) were maintained in DMEM with 10% FBS.
NFE2L2/NRF2-knockdown cancer cells
NFE2L2/NRF2-knockdown cancer cell lines were previously established (9, 31, 45) as shNRF2-HT, shNRF2-HCT, shNRF2-MDA, and shNRF2-MCF cells by using NFE2L2/NRF2-specific shRNA No. 1 (Supplementary Table S1); the corresponding scrambled RNA (scRNA)-transfected control cell lines were scHT, scHCT, scMDA, and scMCF cells, respectively.
Transient transduction with lentiviral particles containing shRNA
For transient silencing of NFE2L2/NRF2 or p50, the HEK 293T cells were transfected with pLKO.1-NFE2L2/NRF2 shRNA (Nos. 2, 3, and 4), pLKO.1-p50 shRNA, or pLKO.1-scrambled RNA (scRNA) with the Mission Lentiviral Packaging Mix (Sigma-Aldrich Co. LLC), and lentiviral particles were obtained for transient transduction. The shRNA sequences are indicated in Supplementary Table S1.
miRNA isolation and real-time RT-polymerase chain reaction
Small RNA-rich samples were isolated from cells with a mirVana miRNA Isolation kit (Thermo Fisher Scientific, Inc.). Briefly, cell lysates were extracted with acid phenol:chloroform and purified over a glass-fiber filter to yield miRNA-enriched fractions. cDNA was synthesized with an miScript RT kit (Qiagen GmbH, Hilden, Germany), and PCR was performed with an miScript SYBR green PCR kit (Qiagen GmbH) and LC480 LightCycler (Roche Diagnostics Deutschland GmbH, Mannheim, Germany). Forward primers were synthesized by Bioneer Corporation (Daejeon, Republic of Korea). The sequences for miR-181a, miR-181c, and U6 snRNA are described in Supplementary Table S2.
Total RNA isolation and real-time RT-PCR
Total RNA was isolated from cells with TRIzol reagent (Thermo Fisher Scientific, Inc.). After cDNA synthesis, PCR was performed with an LC480 LightCycler and a TaKaRa SYBR Premix ExTaq system (TaKaRa Bio, Inc., Shiga, Japan) as previously described (28). Primer sequences are shown in Supplementary Table S2.
MMP measurement
Cellular MMP levels were determined by using MitoRed and TMRM. Briefly, cells on cover glass (SPL Life Sciences Co., Ltd., Gyeonggi-do, Republic of Korea) were incubated with MitoRed (1 μM) or TMRM (0.5 nM) for 20 min at 37°C. After washing, fluorescent images were analyzed immediately with an LSM 710 confocal microscope (Carl Zeiss AG, Jena, Germany). MitoRed- or TMRM-derived fluorescence was excited at 579 or 514 nm, respectively, and emission was detected at 548–685 nm. The intensities were quantified with ZEN2011 software (Carl Zeiss AG). To analyze cellular fluorescent images with a Cell Insight Personal Cell Imager (Thermo Fisher Scientific, Inc.), cells were seeded in 96-well plates and incubated with MitoRed (0.5 nM) for 20 min. The fluorescent images were quantified after nuclear staining with H342 (2 μg/ml, 350/461 nm).
Mitochondrial OCR measurement
Cells (3 × 10⁴/well) were cultured on XF-24 plates (Seahorse Bioscience, Billerica, MA) in a CO2 incubator at 37°C. After a 24 h incubation, growth medium from each well was exchanged with the pre-warmed pH 7.4 XF-base medium (Seahorse Bioscience) that was supplemented with
ROS measurements
Total ROS levels were measured by staining with DCF-DA (20 μM) for 30 min at 37°C (46). DCF-DA fluorescence was determined with a Cell Insight Personal Imager (485/521 nm) after nuclear staining with H342. Mitochondrial superoxide levels were determined by using MitoSOX. Briefly, cells on cover glass (SPL Life Sciences Co.) were incubated with MitoSOX (5 μM) for 10 min at 37°C. After washing, the fluorescent images were analyzed immediately with an LSM 710 confocal microscope (Carl Zeiss AG) after nuclear staining with H342. MitoSOX-derived fluorescence was excited at 510 nm, and emission was detected at 580 nm.
Measurement of NADH-ubiquinone oxidoreductase (complex I) activity
Complex I activity was determined by using a colorimetric assay kit (BioVision, CA). In accordance to the manufacturer's introduction, isolated mitochondria samples were added to each well containing complex I assay mixture, which included complex I dye and decylubiquinone. Next, freshly prepared NADH solution was added to each well, and the decrease in optical density (600 nm) was immediately recorded for as long as 5 min with a 30-s interval by using a SPECTRO starNano (BMG LABTECH GmbH, Ortenberg, Germany). The complex I activity was calculated in mU/μg as Δ [reduced complex I dye concentration]/[(t2 − t1) × mitochondria protein (μg)] × dilution factor, where Δ [reduced complex I dye concentration] is obtained by inserting OD values to a standard curve in the time point.
Measurement of cytochrome c oxidase (complex IV) activity
Complex IV activity was measured by using a cytochrome c oxidase assay kit (BioVision). Briefly, cytochrome c mixture was added to cell lysates, and the decrease in optical density (550 nm) was immediately recorded for 30 min with a 30-s interval by using a SPECTRO starNano. The complex IV activity was calculated in U/mg as [(OD1 − OD2)/(t1 − t2)]/(ɛ × mg protein), where ɛ is the molar extinction coefficient of cytochrome c at 550 nm (7.04 mM −1cm−1).
ATP content measurement
Cells were incubated in 24-well plates with trichloroacetic acid (0.5%, 200 μl) for 30 min on ice, centrifuged, and neutralized by using 250 mM Tris-acetate (pH 7.8) buffer. ATP levels in the obtained supernatants were determined with ENLITEN ATP assay kits (Promega Corporation) with a luminometer and normalized to the protein content.
Cell number count
Viable cell numbers were determined with a TC10 Automated Cell Counter (Bio-Rad Laboratories, Inc., Hercules, CA) after the addition of trypan blue.
Immunocytochemical analysis
Cells on cover glass were fixed in cold methanol for 10 min and then incubated with the anti-NFE2L2/NRF2 (1:200) or anti-MT-CO1 (1:200) antibody at 4°C overnight. Cells were then incubated with the Alexa Fluor 488 or 549 goat anti-rabbit antibodies (1:500) for 1 h. For nuclear staining, cells were incubated with PI (1:500) or H342 (2 μg/ml) for 10 min. Fluorescent images were obtained with an LSM 710 confocal microscope, and fluorescence intensities were quantified with ZEN2011 software (27).
Western blotting
Cells were lysed as previously described (31), and protein concentrations were determined with bicinchoninic acid kits (Thermo Fisher Scientific, Inc.). Electrophoresed protein samples were transferred to nitrocellulose membranes (GE Healthcare Bio-Sciences, Pittsburgh, PA), and membranes were incubated with primary and secondary antibodies. Chemoluminescent images were obtained with an ImageQuant LAS 4000 Mini (GE Healthcare Bio-Sciences). Mitochondria were isolated with a mitochondria isolation kit (Thermo Fisher Scientific, Inc.). Briefly, cells were lysed after the serial addition of reagents A, B, and C, and supernatants were obtained by centrifugation at 700 g for 10 min. The supernatants were then centrifuged at 12,000 g for 15 min, and mitochondria-containing pellets were prepared.
Luciferase reporter assay for NF-κB and 3′UTR of MT-CO1
The cells were incubated with a mixture of NF-κB-luciferase plasmid (Affymetrix, Inc.), pRLtk control plasmid (Promega Corporation, Madison, WI), and Lipofectamine 2000 for 18 h. After a 24 h recovery, cells were lysed and luciferase activities were measured with a 20/20n luminometer (Promega Corporation). For, 3′UTR-luciferase activity, the cells were incubated with a mixture of the 3′UTR-MT-CO1-luciferase plasmid (Genecopoeia, Inc., Rockville, MD) and Lipofectamine 2000 for 18 h.
Overexpression of p50 and p65
For NF-κB overexpression, pCMV4-p50 and pCMV4-p65 (Addgene, Cambridge, MA) were transfected in cells by using Lipofectamine 2000.
Transfection with miR-181c mimic, miR-181c inhibitor, or AMPKα siRNA
AccuTarget human miRNA mimics for miR-181c, miR-181a-1, miR-181a-2, the miR-181c inhibitor, and negative controls were obtained from the Bioneer Corporation. To silence AMPKα, siRNAs for AMPKα1 and AMPKα2 (Bioneer Corporation) were transfected into cells. Transfections were performed with Lipofectamine 2000.
Tumor xenografts in mice
A suspension of 3 × 10⁶ cells in 0.2 ml serum-free medium was injected subcutaneously into the flanks of 5-week-old BABLc (nu/nu) mice (Orient Bio, Inc., Gyeonggi-do, Republic of Korea). Mice were maintained in a specific pathogen-free environment, and the animal experiment was approved by the Institutional Ethics Committee on Animal Care and Experimentation at The Catholic University of Korea (Approval No. 2014-032-01). When tumor formation was observed, compound C (5 mg/kg) or saline was injected intraperitoneally into the mice 2–3 times a week for a total of 10 times. The tumor growth was monitored twice a week by measuring two diameters of tumors with calipers. The tumor volume was calculated by the formula V = (a 2 × b)/2, where a and b are the width and the length of tumors in mm, respectively. Thirty-one days after inoculation, the mice were euthanized with carbon dioxide (CO2) in an appropriate chamber, and the collected tumors were weighed and frozen. Tumor tissues in the lysis buffer were homogenized on ice with an IKA homogenizer (IKA-Werke GmbH & Co. KG, Staufen, Germany). The homogenates were centrifuged twice at 12,000 g for 20 min at 4°C, and supernatants were obtained.
Statistical analysis
Statistical significance was determined with Student's unpaired t-tests or one-way analyses of variance, followed by Student-Newman-Keuls tests for multiple comparisons. These analyses were conducted with GraphPad Prism software (GraphPad Software, Inc., La Jolla, CA).
Footnotes
Acknowledgments
This study was financially supported by a grant from the National Research Foundation of Korea (NRF) funded by the Korea government (MSIP) (NRF-2015R1A2A1A10054384 and NRF-2013R1A2A2A01015497; M.-K.K.). This study was also supported by the BK21 Plus Creative Leader Program for Pharmacomics-based Future Pharmacy. The authors are grateful to In-geun Ryoo for providing the NFE2L2/NRF2-knockdown breast cancer cell lines; Sang-Tae Kim, Seoul National University Bundang Hospital, for technical advice on miRNA isolation; Sang Geon Kim, Seoul National University, for providing antibodies; and Hyo-Jeong Kuh, The Catholic University of Korea, for kind help for OCR measurements.
Author Disclosure Statement
No competing financial interests exist.
Abbreviations Used
References
Supplementary Material
Please find the following supplemental material available below.
For Open Access articles published under a Creative Commons License, all supplemental material carries the same license as the article it is associated with.
For non-Open Access articles published, all supplemental material carries a non-exclusive license, and permission requests for re-use of supplemental material or any part of supplemental material shall be sent directly to the copyright owner as specified in the copyright notice associated with the article.