
Abstract
Aims:
Asthma, characterized by airway obstruction and hyper-responsiveness, is more severe and less responsive to treatment in obese subjects. While alterations in mitochondrial function and redox signaling have been implicated in asthma pathogenesis, it is unclear whether these mechanisms differ in lean versus obese asthmatics. In addition, we previously demonstrated that circulating platelets from asthmatic individuals have altered bioenergetics; however, it is unknown whether platelet mitochondrial changes reflect those observed in airway epithelial cells. Herein we hypothesized that lean and obese asthmatics show differential bioenergetics and redox signaling in airway cells and that these alterations could be measured in platelets from the same individual.
Results:
Using freshly isolated bronchial airway epithelial cells and platelets from lean and obese asthmatics and healthy individuals, we show that both cell types from obese asthmatics have significantly increased glycolysis, basal and maximal respiration, and oxidative stress compared with lean asthmatics and healthy controls. This increased respiration was associated with enhanced arginine metabolism by arginase, which has previously been shown to drive respiration. Inducible nitric oxide synthase (iNOS) was also upregulated in cells from all asthmatics. However, due to nitric oxide synthase uncoupling in obese asthmatics, overall nitric oxide (NO) bioavailability was decreased, preventing NO-dependent inhibition in obese asthmatic cells that was observed in lean asthmatics.
Innovation and Conclusion:
These data demonstrate bioenergetic differences between lean and obese asthmatics that are, in part, due to differences in NO signaling. They also suggest that the platelet may serve as a useful surrogate to understand redox, oxidative stress and bioenergetic changes in the asthmatic airway.
Introduction
Asthma is one of the most common chronic diseases in the United States and is characterized by reversible airflow limitation, bronchial hyper-responsiveness, and recruitment and activation of inflammatory cells, ultimately leading to airway remodeling. Over the last decade, it has been realized that asthma is a heterogeneous disease with variability among patients in characteristics, including lung function, weight, steroid responsiveness, and inflammatory markers (28, 37). Cluster analyses have advanced our understanding of how to treat various groups of asthmatics, including a subset of obese asthmatics (body mass index [BMI] above 30 kg/m2) who report increased asthma severity, increased exacerbations and hospital stays, and are generally refractory to steroid therapy as they do not display common T2 inflammatory markers associated with atopic inflammation (15, 42).
Innovation
This study begins to elucidate bioenergetic and redox mechanisms unique to obese versus lean asthmatics, which may contribute to differential pathogenesis of these two clinical phenotypes. Furthermore, data demonstrating that platelet bioenergetics reflect airway epithelial bioenergetics raise the possibility of utilizing platelets as a surrogate to measure and study airway bioenergetics more easily and less invasively in human asthma cohorts.
On a molecular level, pathogenesis of asthma is multifaceted, but studies of both lean and obese asthmatics show exacerbated production of reactive oxygen species (ROS) in airway cells accompanied by decreased activity of antioxidants (13, 17, 44), and increased metabolism of arginine to ornithine due to the upregulation of arginase (5, 16, 52). Airway inflammation is also characterized by increased expression of inducible nitric oxide synthase (iNOS), which results in enhanced fractional exhaled nitric oxide (NO) (FENO) in lean asthmatics (20, 36, 51). However, FENO has been observed to be much lower in some asthmatic phenotypes despite iNOS upregulation, and this is thought to be due to deficiency of
Accumulating studies also demonstrate that alterations in mitochondrial structure and function are present in asthmatic patients and have been implicated in disease development and progression. For example, changes in mitochondrial shape and increased number have been observed in the airways of asthmatic subjects (6, 25, 26, 45, 52). In addition, airway epithelial cells from asthmatic subjects show increased mitochondrial respiration (45, 52). This increase in respiration has been attributed to enhanced arginine metabolism to ornithine by upregulated arginase, which ultimately generates glutamate (through catalysis by ornithine amino transferase) to drive the production of substrates for the tricarboxylic acid (TCA) cycle (52). These studies and others link altered mitochondrial function to enhanced arginine metabolism as well as changes in NO signaling in the asthmatic airway. However, it remains unclear whether bioenergetics is different in lean versus obese asthmatics.
Notably, mitochondrial and metabolic changes do not appear to be confined to the airways of asthmatics, but instead present systemically. For example, studies investigating whole-body metabolism with control of dietary intake suggest mild asthmatics are metabolically more efficient than healthy subjects (34), and childhood asthma has been linked with abnormal lipid and glucose metabolism (9). At the cellular level, we have previously shown that circulating platelets from asthmatics show less reliance on glycolysis and greater TCA cycle activity than platelets from healthy subjects (50). While these data suggest that measurement of bioenergetics in a circulating cell type, such as the platelet, may provide information about metabolic changes in the airways, it remains unknown whether platelets accurately reflect bioenergetic changes in airway cells.
We hypothesized that obese and lean asthmatics have differential systemic cellular bioenergetics and that these mitochondrial alterations can be detected in the airway epithelium as well as circulating platelets. Here we show that airway epithelial cells from obese asthmatics show higher rates of glycolysis and oxidative phosphorylation in comparison with lean asthmatics. Our data demonstrate that iNOS uncoupling and decreased NO bioavailability in obese asthmatics contribute to increased ROS production and enhanced maximal respiratory capacity, respectively. Notably, these bioenergetic and redox changes are present in both platelets and airway epithelial cells from the same subjects. These data further demonstrate that mitochondrial alterations are present in obese asthmatics and suggest that platelets may serve as a surrogate to measure bioenergetic and redox alterations in asthmatic subjects.
Results
Obese asthmatics show greater glycolytic and respiratory rate than lean asthmatics
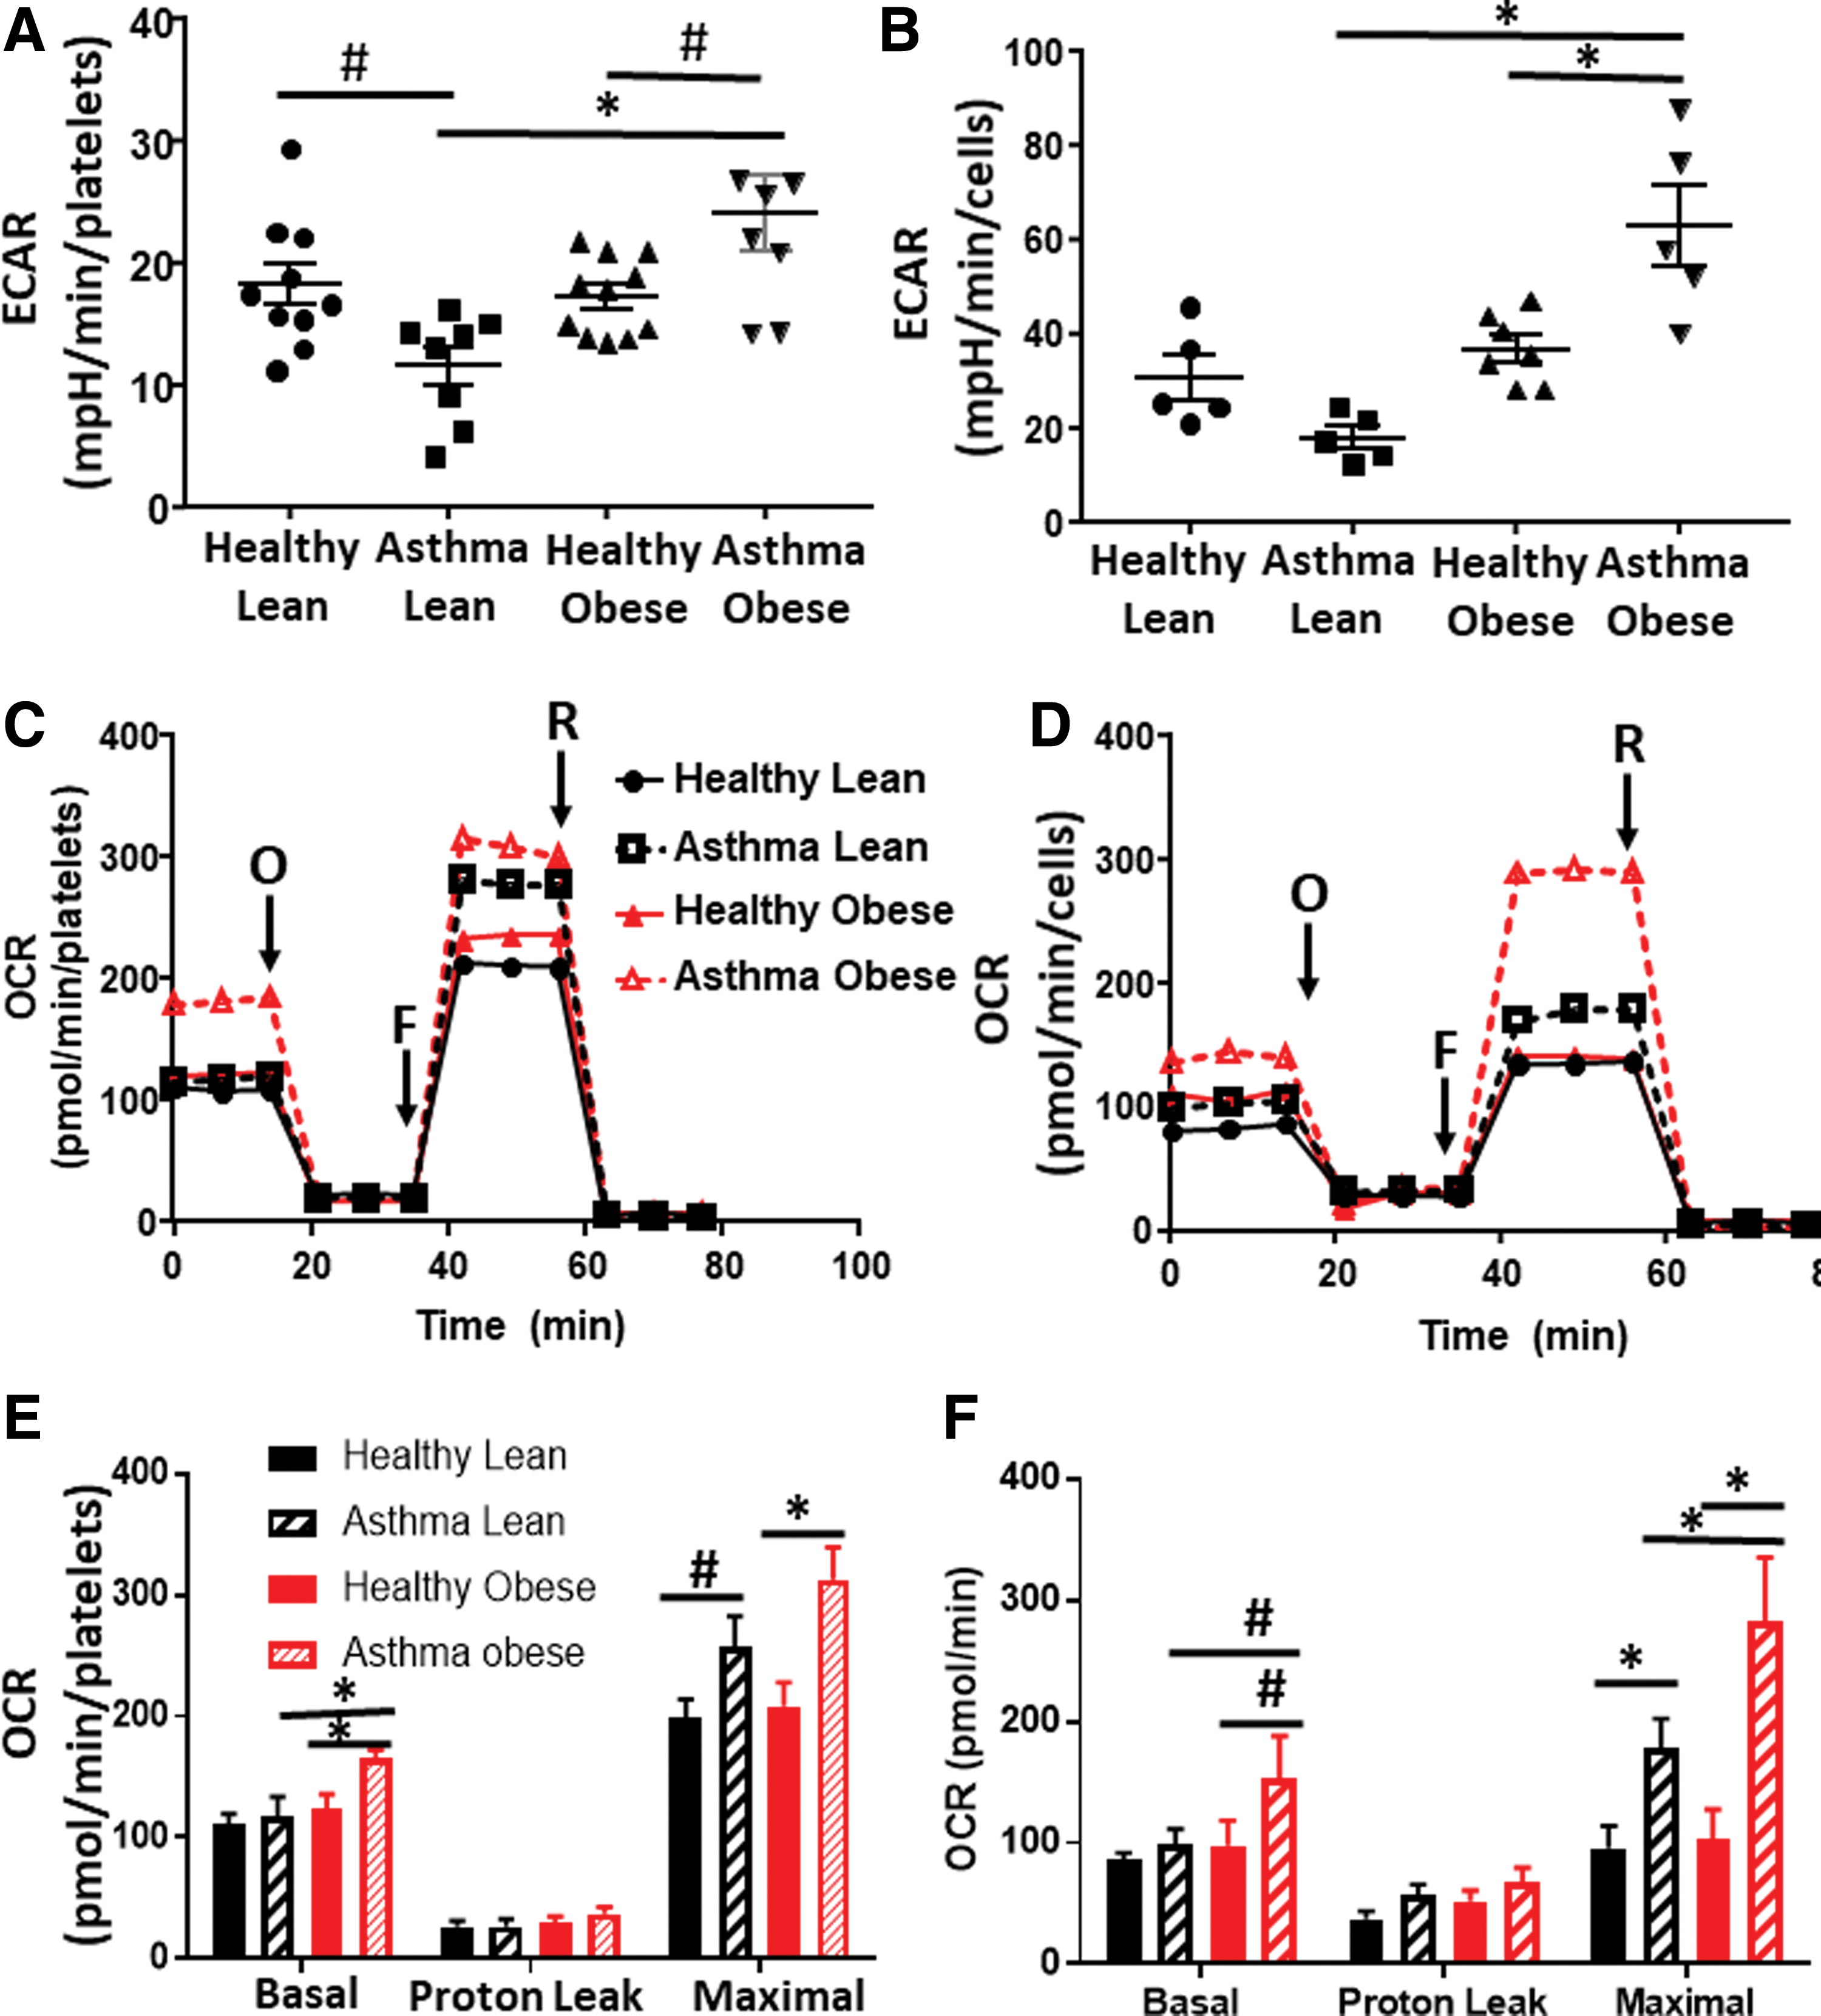
In the first series of experiments, we measured cellular bioenergetics in freshly isolated intact platelets from lean asthmatics, obese asthmatics, healthy lean subjects, and healthy obese subjects (see Table 1 for demographics). Fresh airway epithelial cells were obtained from a subgroup of subjects in each of these cohorts and bioenergetic measurements were made in parallel. Levels of basal platelet activation were measured and found not to differ between groups (Supplementary Fig. S1). Basal glycolytic rate was assessed in both cell types by measuring the extracellular acidification rate (ECAR) that was sensitive to the glycolytic inhibitor 2-deoxyglucose (2-DG) using extracellular flux analysis. Consistent with prior studies (50), platelets from lean asthmatics showed a significant decrease in the basal glycolytic rate compared with healthy subjects (Fig. 1A) and this effect was paralleled in airway epithelial cells (Fig. 1B). While there was no significant change in the glycolytic rate of platelets and airway epithelial cells from healthy obese subjects compared with healthy lean subjects, platelets and epithelial cells from obese asthmatics showed a significant increase in glycolysis in comparison with all other groups (Fig. 1A, B).
Demographics
BMI, body mass index; eNO, exhaled nitric oxide; FEV1%, forced exhalation percent predicted; FVC, forced vital capacity; ICS%, percent inhaled corticosteroids.
To test whether rates of oxidative phosphorylation were also altered, we next measured oxygen consumption rates (OCRs) of the platelets and epithelial cells (Fig. 1C, D). Basal OCR did not differ between platelets from lean healthy and lean asthmatic subjects, although maximal OCR was increased in lean asthmatic platelets (Fig. 1E). This increase in maximal OCR was also significant in epithelial cells from lean asthmatics (Fig. 1F). Notably, in both cell types, cells from obese asthmatic subjects showed an even greater increase in both basal and maximal OCRs, significant compared with all healthy controls and lean asthmatic cells (Fig. 1E, F). Measurement of basal ATP production rate showed that both airway epithelial cells and platelets from lean and obese asthmatics showed increased rates of ATP production compared with healthy controls, consistent with prior studies (50, 52). While cells from obese asthmatics showed a trend to even greater ATP production compared with lean asthmatic cells, this did not reach statistical significance (Table 2).
ATP Production
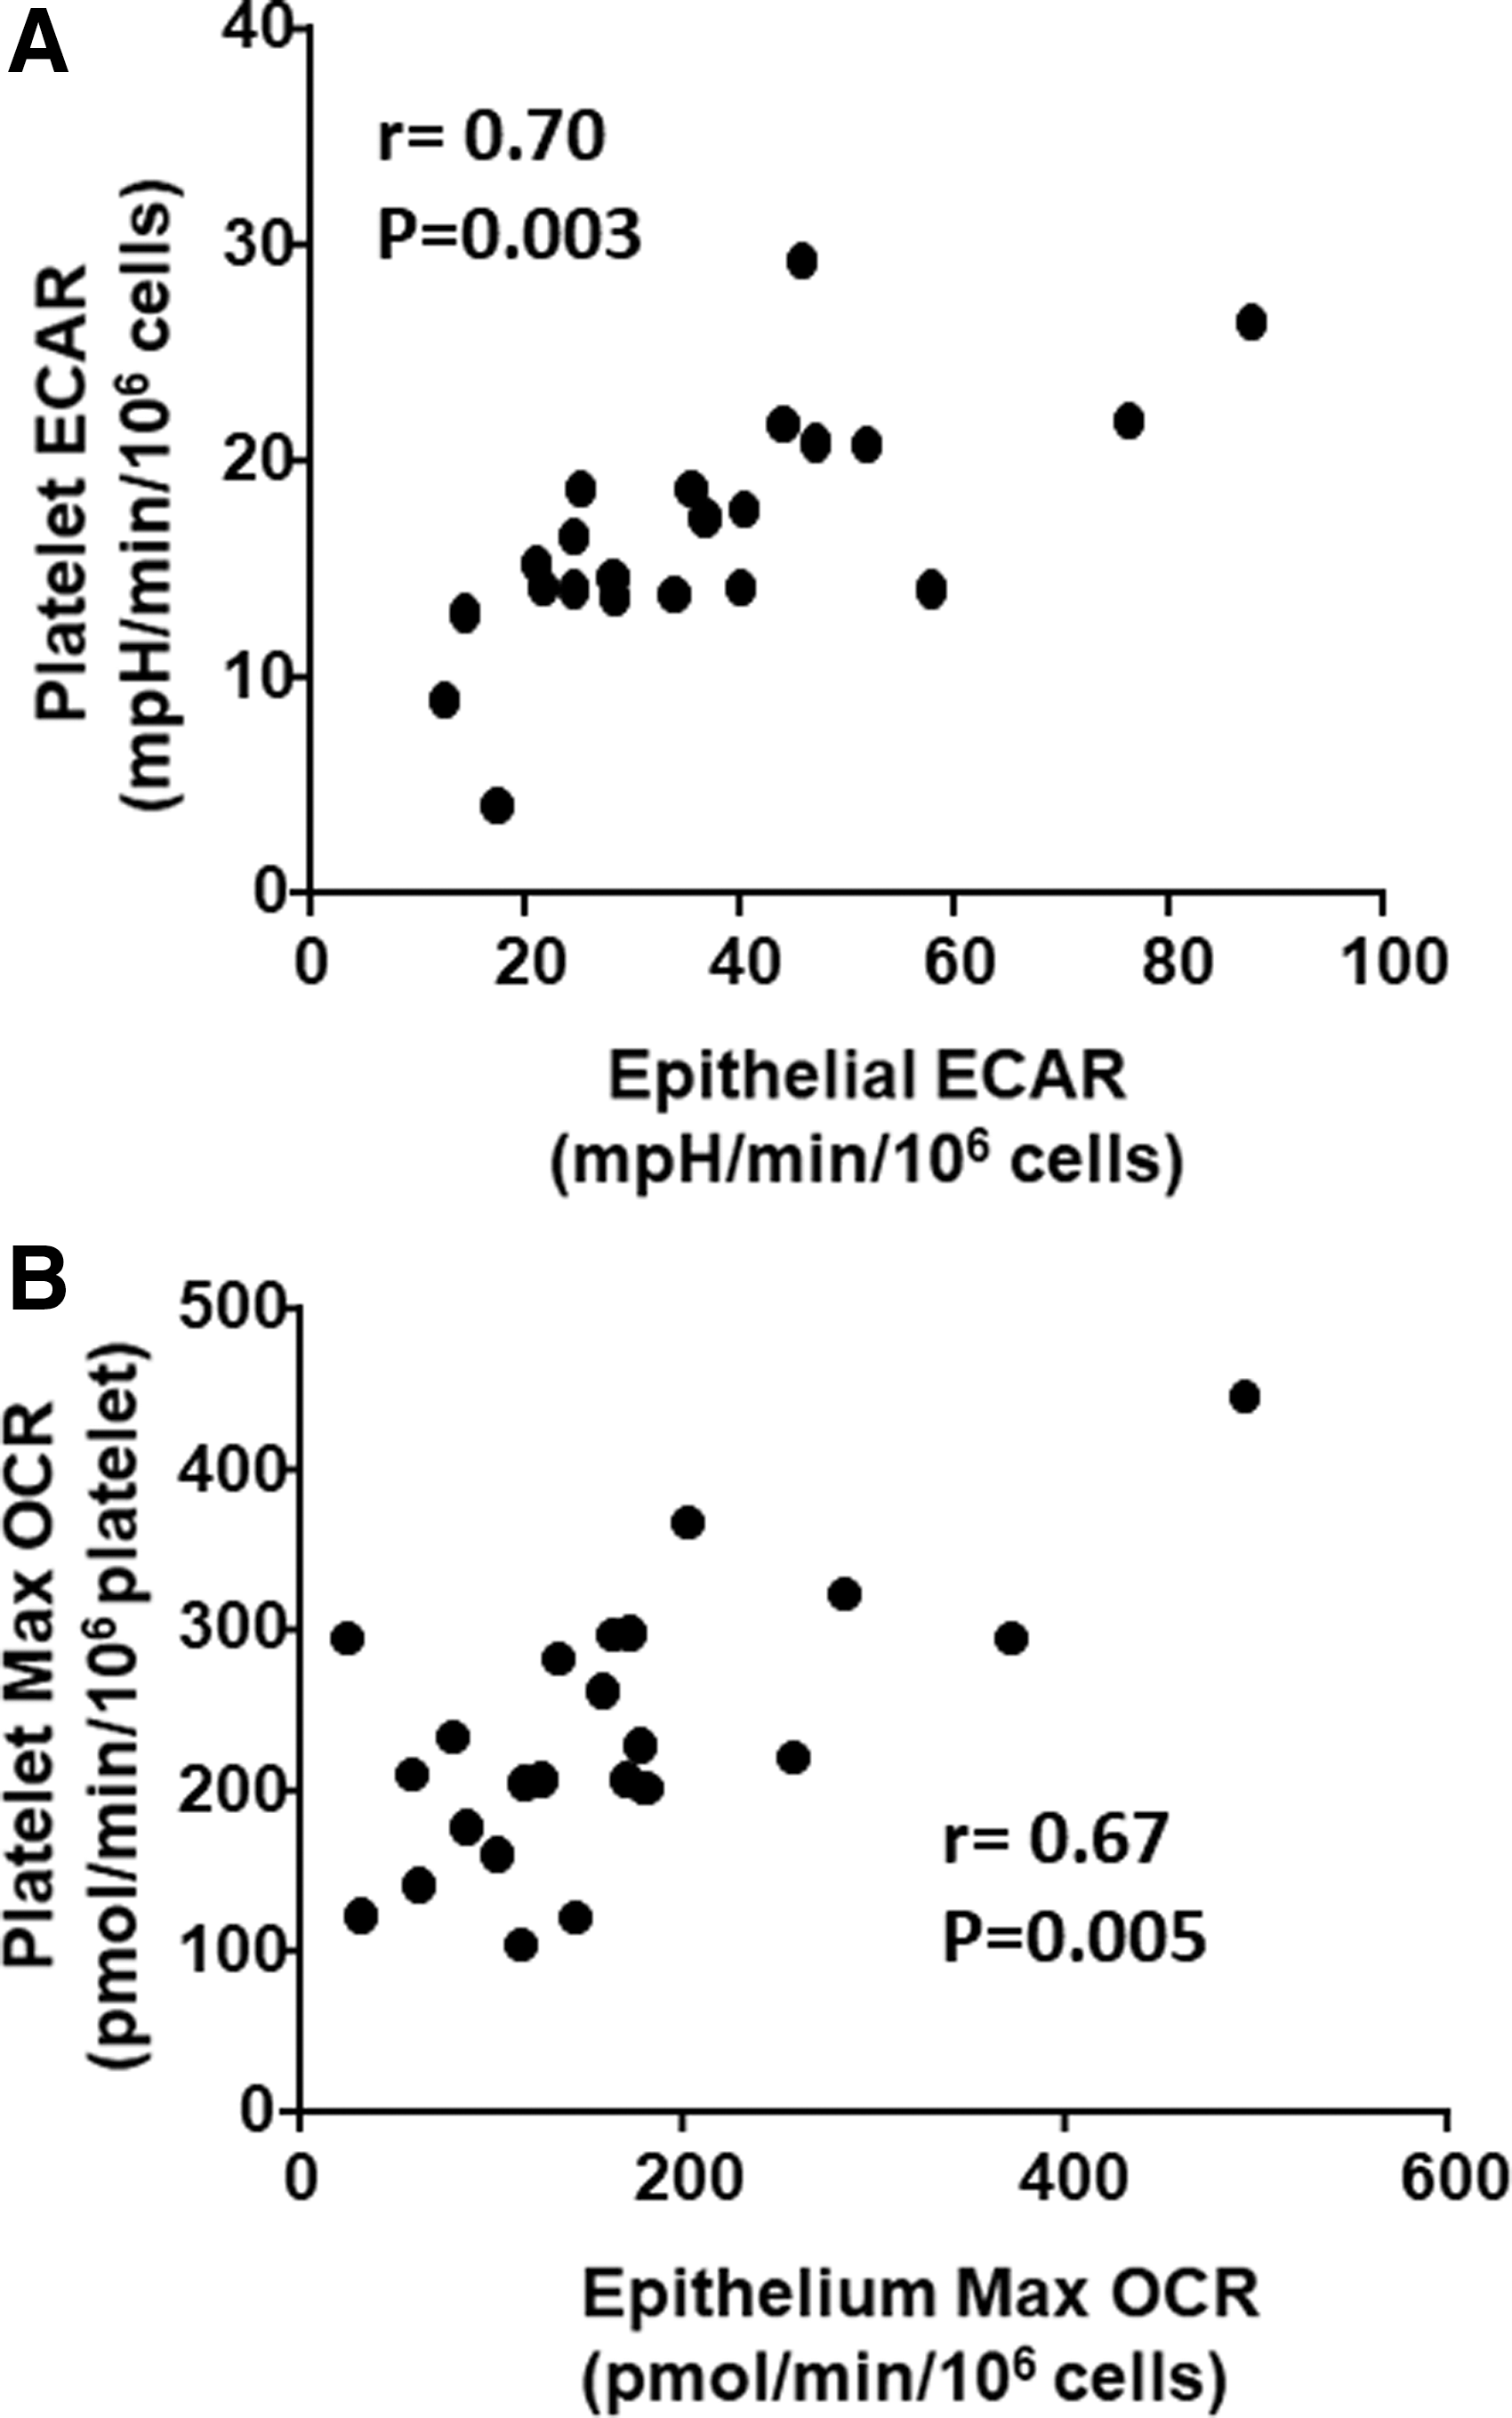
Given that bioenergetic parameters showed similar effects in both platelets and epithelial cells, we next sought to assess whether platelet bioenergetics accurately reflects airway epithelial bioenergetics. We performed a correlation between platelet and airway epithelial cell basal ECAR (Fig. 2A) and maximal OCR (Fig. 2B) in each subject. We found a significant correlation between ECAR (r = 0.70; p = 0.03) and maximal OCR (r = 0.67; p = 0.005) in these two cell types, demonstrating that circulating platelet bioenergetics reflects airway epithelial bioenergetics in healthy and asthmatic humans.
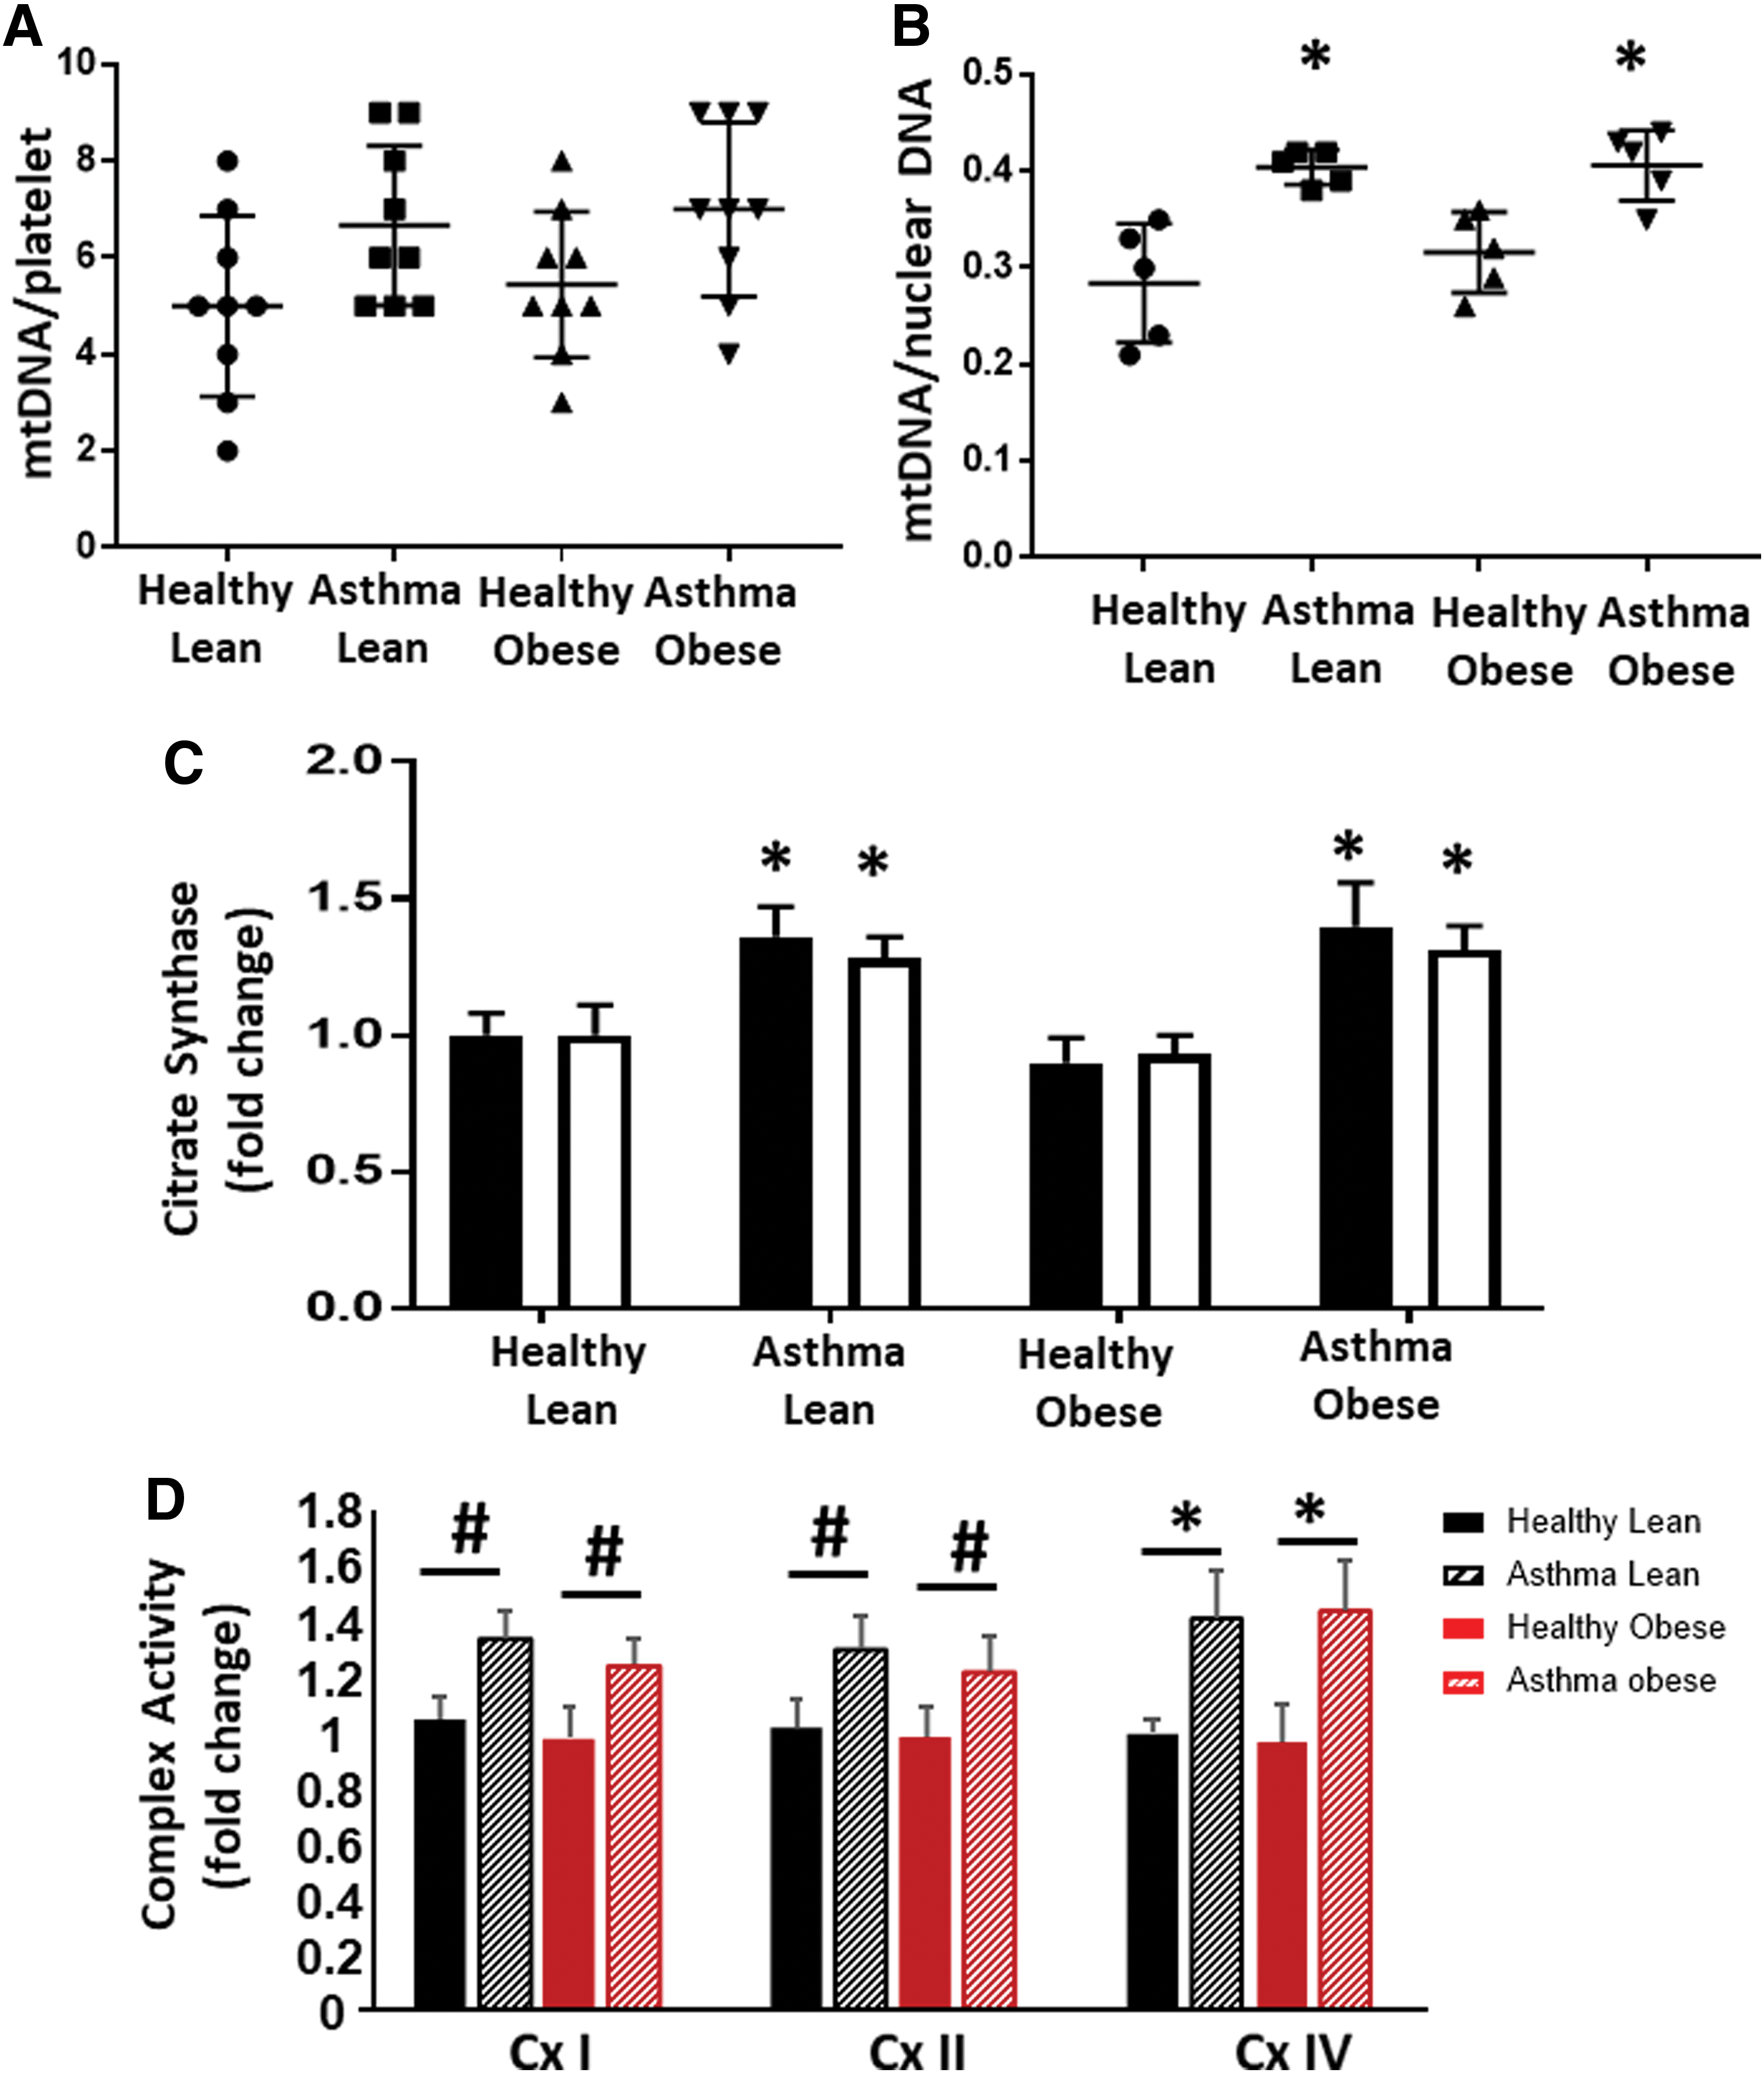
To determine whether the difference between obese and lean asthmatic bioenergetics was due to changes in mitochondrial number, we next measured mitochondrial DNA as a measure of mitochondrial number. Platelets from lean and obese asthmatic subjects showed a small increase in mitochondrial number that did not reach significance compared with platelets from lean and obese healthy subjects (Fig. 3A). Airway epithelial cells isolated from lean and obese asthmatics also showed an ∼25% increase in mitochondrial DNA copy number, and this reached statistical significance compared with healthy controls (Fig. 3B). Both platelets and airway epithelial cells from lean and obese asthmatics had significantly increased activity of the matrix TCA cycle enzyme citrate synthase, consistent with an increase in mitochondrial number as well as increased TCA cycle activity (Fig. 3C). The specific activities of electron transport chain complexes I, II, and IV were increased in airway epithelial cells from lean and obese asthmatics compared with healthy controls, consistent with previous studies (Fig. 3D).
Platelet and airway epithelium from obese asthmatics show increased oxidant production
Mitochondrial superoxide production is regulated by the activity of the electron transport chain. To determine whether the observed alterations in bioenergetics change mitochondrial oxidant production in asthmatics, we next used MitoSOX to measure mitochondrial superoxide production in both platelets and airway epithelial cells. There was no statistically significant difference in mitochondrial oxidant production between lean and obese healthy subjects in platelet or epithelial cells (Fig. 4A, B). In contrast, lean asthmatics showed a significant increase in mitochondrial superoxide production in platelets (Fig. 4A) and this increase was recapitulated in airway epithelial cells (Fig. 4B). Obese asthmatics also showed increases in mitochondrial oxidant production in both platelets and airway epithelial cells (Fig. 4A, B).
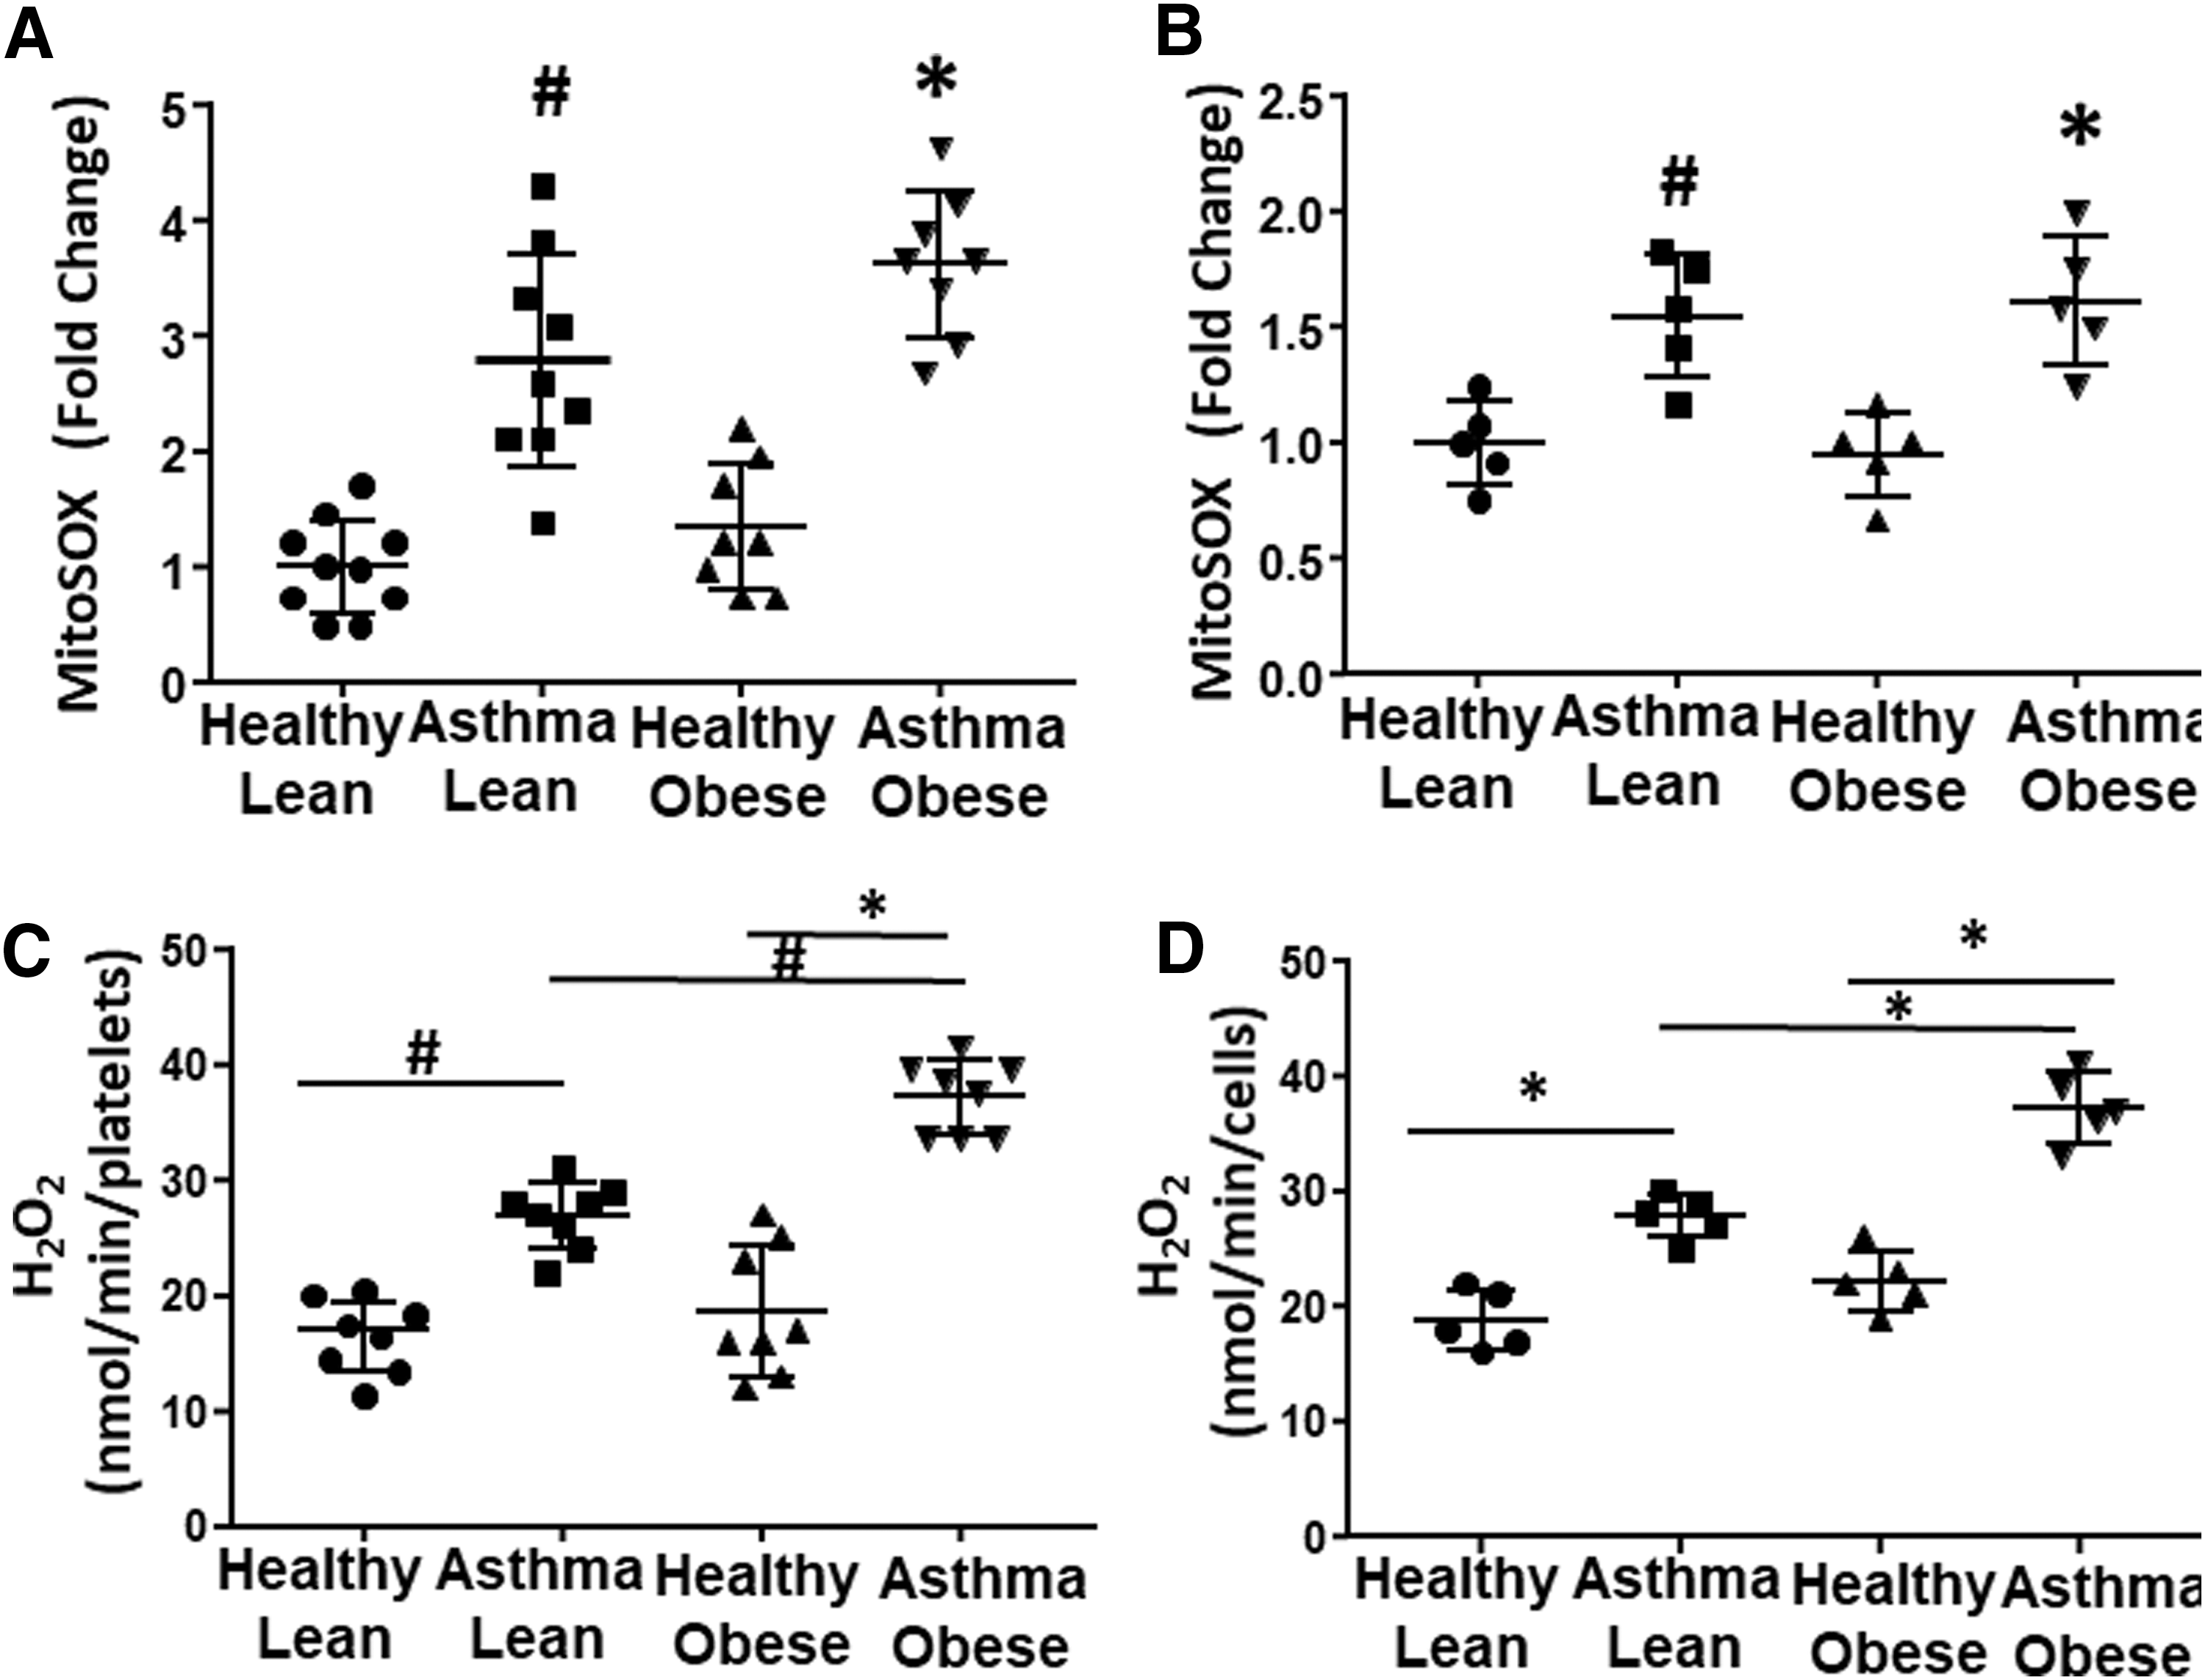
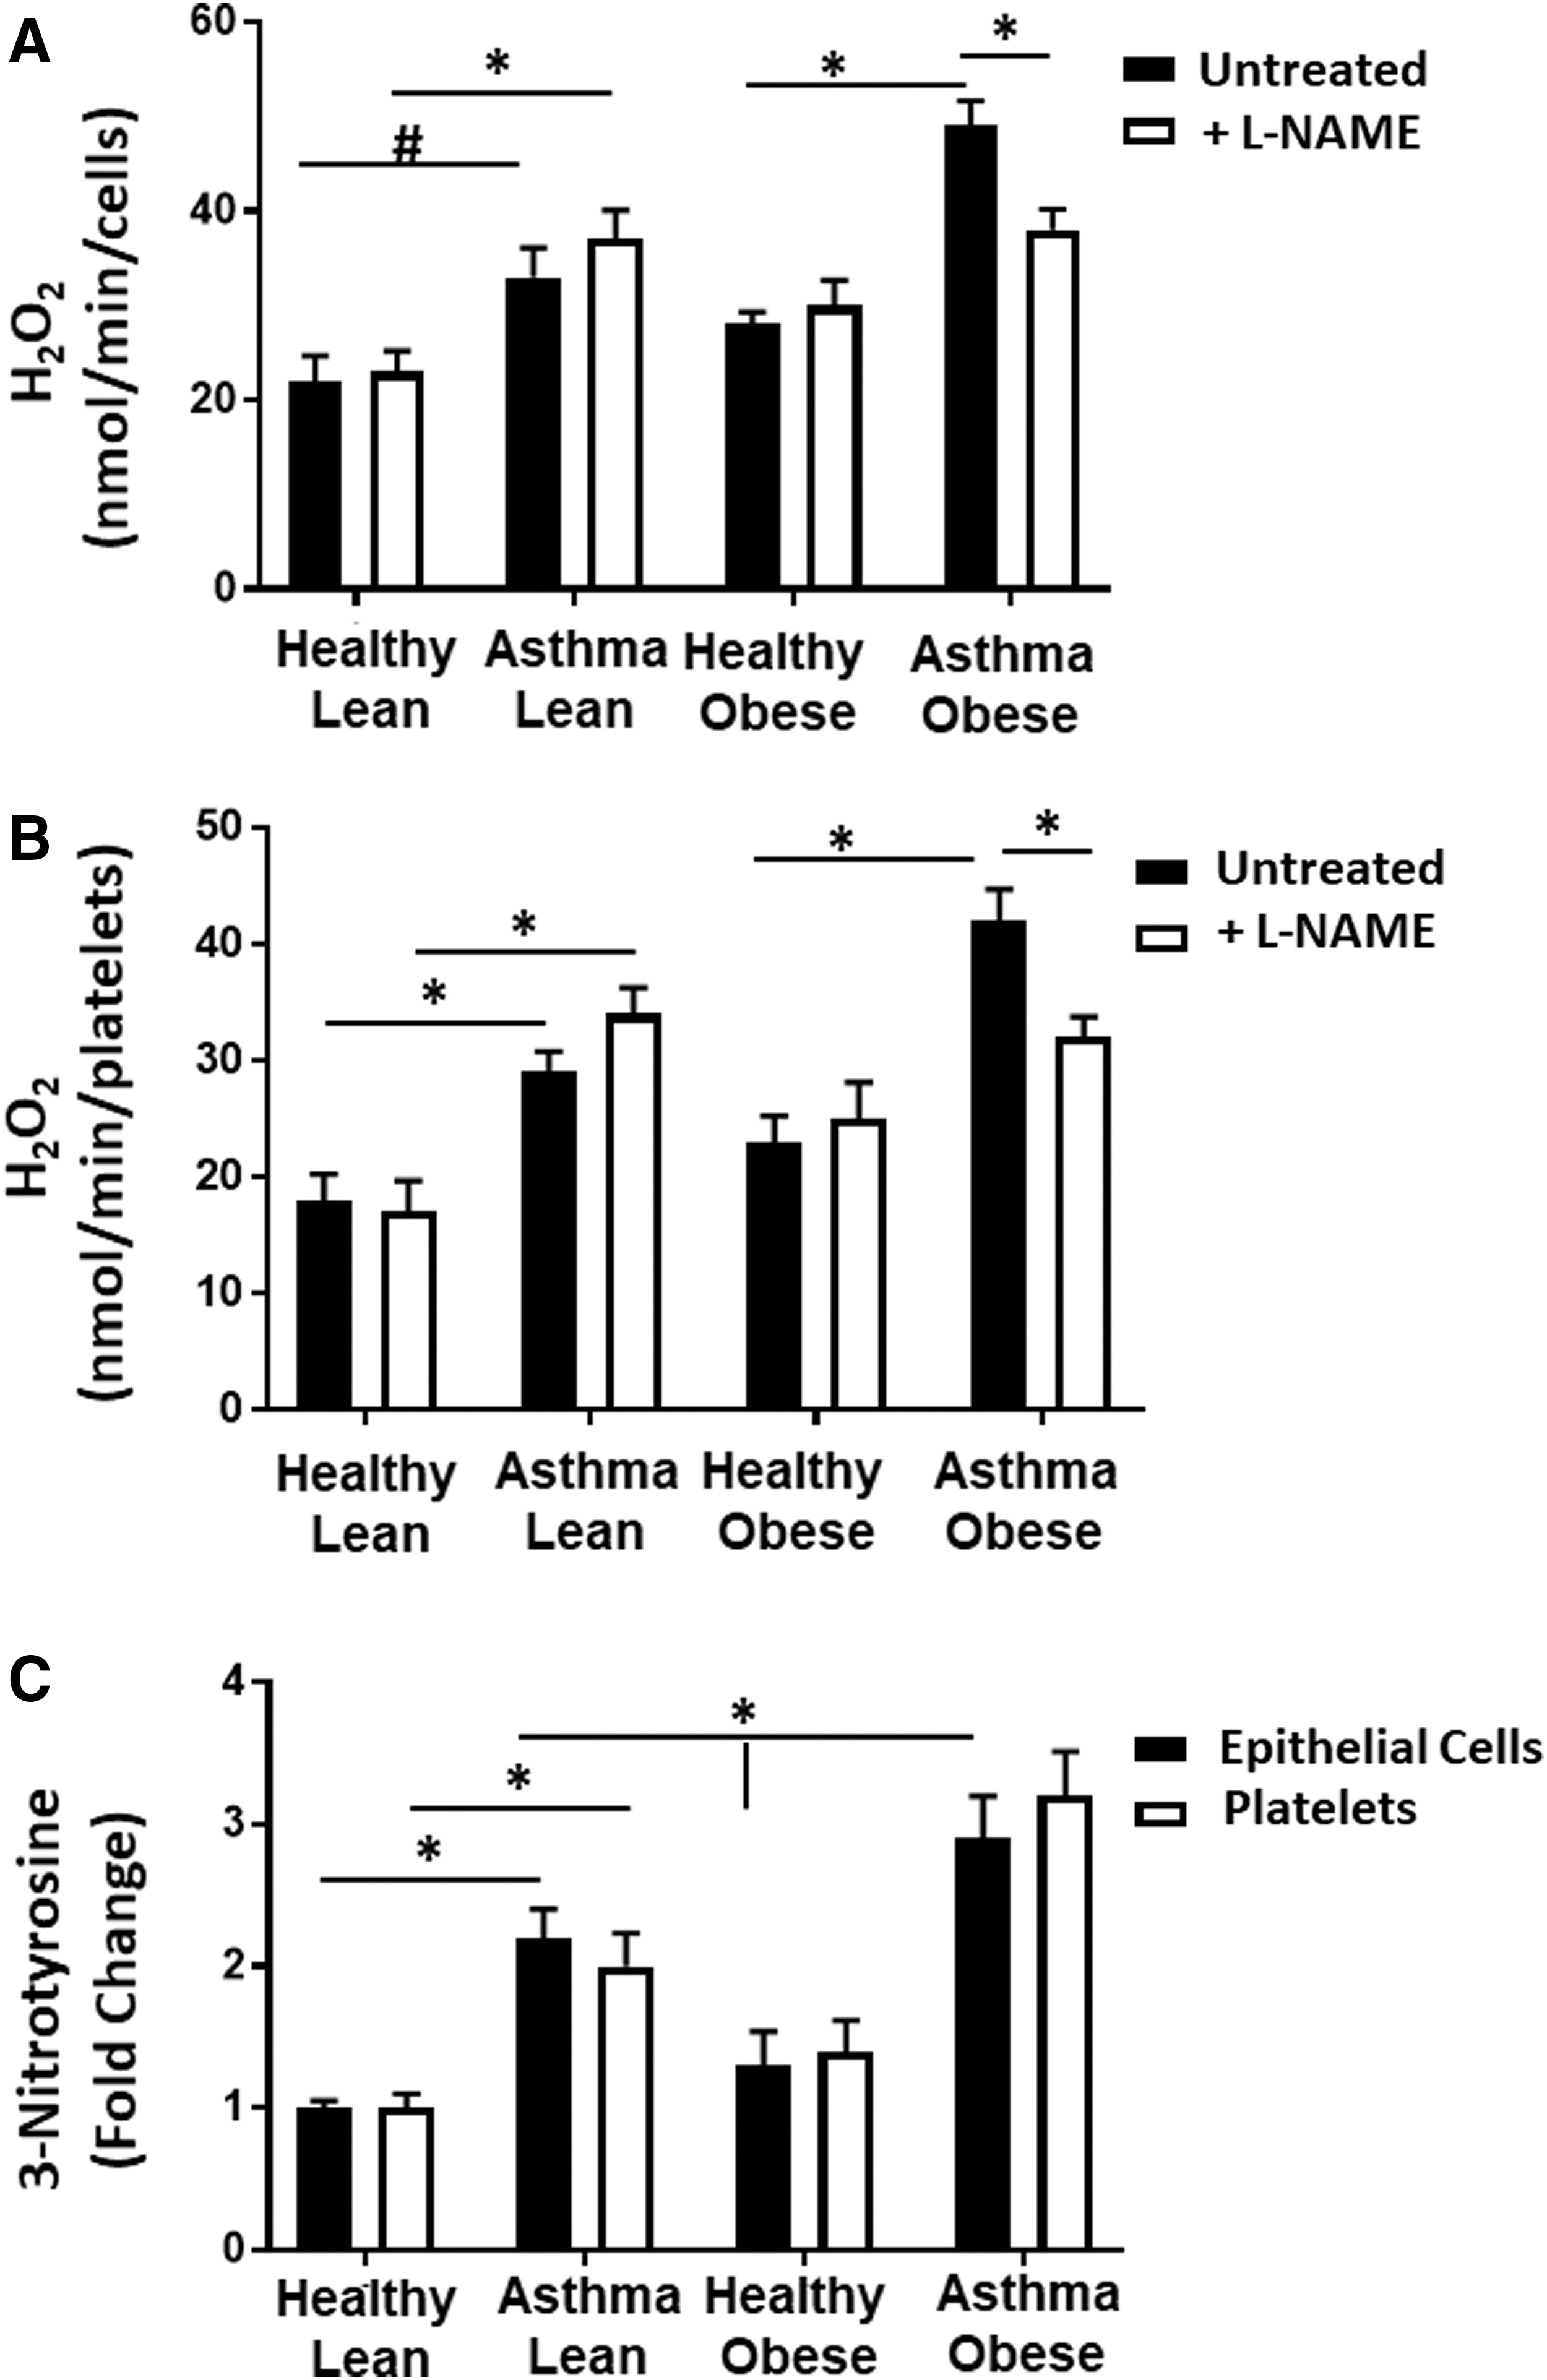
Prior studies have established that antioxidant defenses are inactivated in asthmatics and that cellular sources of ROS beyond the mitochondrion are increased in asthmatic airway cells (13, 17, 22). Thus, we next measured total cellular hydrogen peroxide (H2O2) generation in both platelets and airway epithelial cells. Both platelets and airway epithelial cells from lean asthmatics showed a significant increase in H2O2 production compared with lean and obese healthy controls. In addition, both cell types isolated from obese asthmatics showed a significantly greater increase in H2O2 compared with lean asthmatics (Fig. 4C, D).
NOS and arginase activities are increased in cells from asthmatics
Alterations in arginine metabolism through the upregulation of arginase and iNOS have been shown to modulate both bioenergetics and oxidant production in airway epithelial cells from asthmatics (5, 51, 52). Measurement of arginase activity in the airway epithelial cells showed that cells isolated from lean asthmatics had significantly increased arginase activity compared with lean and obese healthy controls, consistent with prior studies (16, 52). In addition, arginase activity was further increased in cells isolated from obese asthmatics (Fig. 5A). Notably, although absolute arginase activity was much lower in platelets than epithelial cells, a similar increase in activity was also observed in platelets from lean and obese asthmatics compared with lean and obese healthy subjects (Fig. 5B). Arginase catalyzes the conversion of arginine to ornithine, and consistent with an upregulation of cellular arginase, plasma levels of
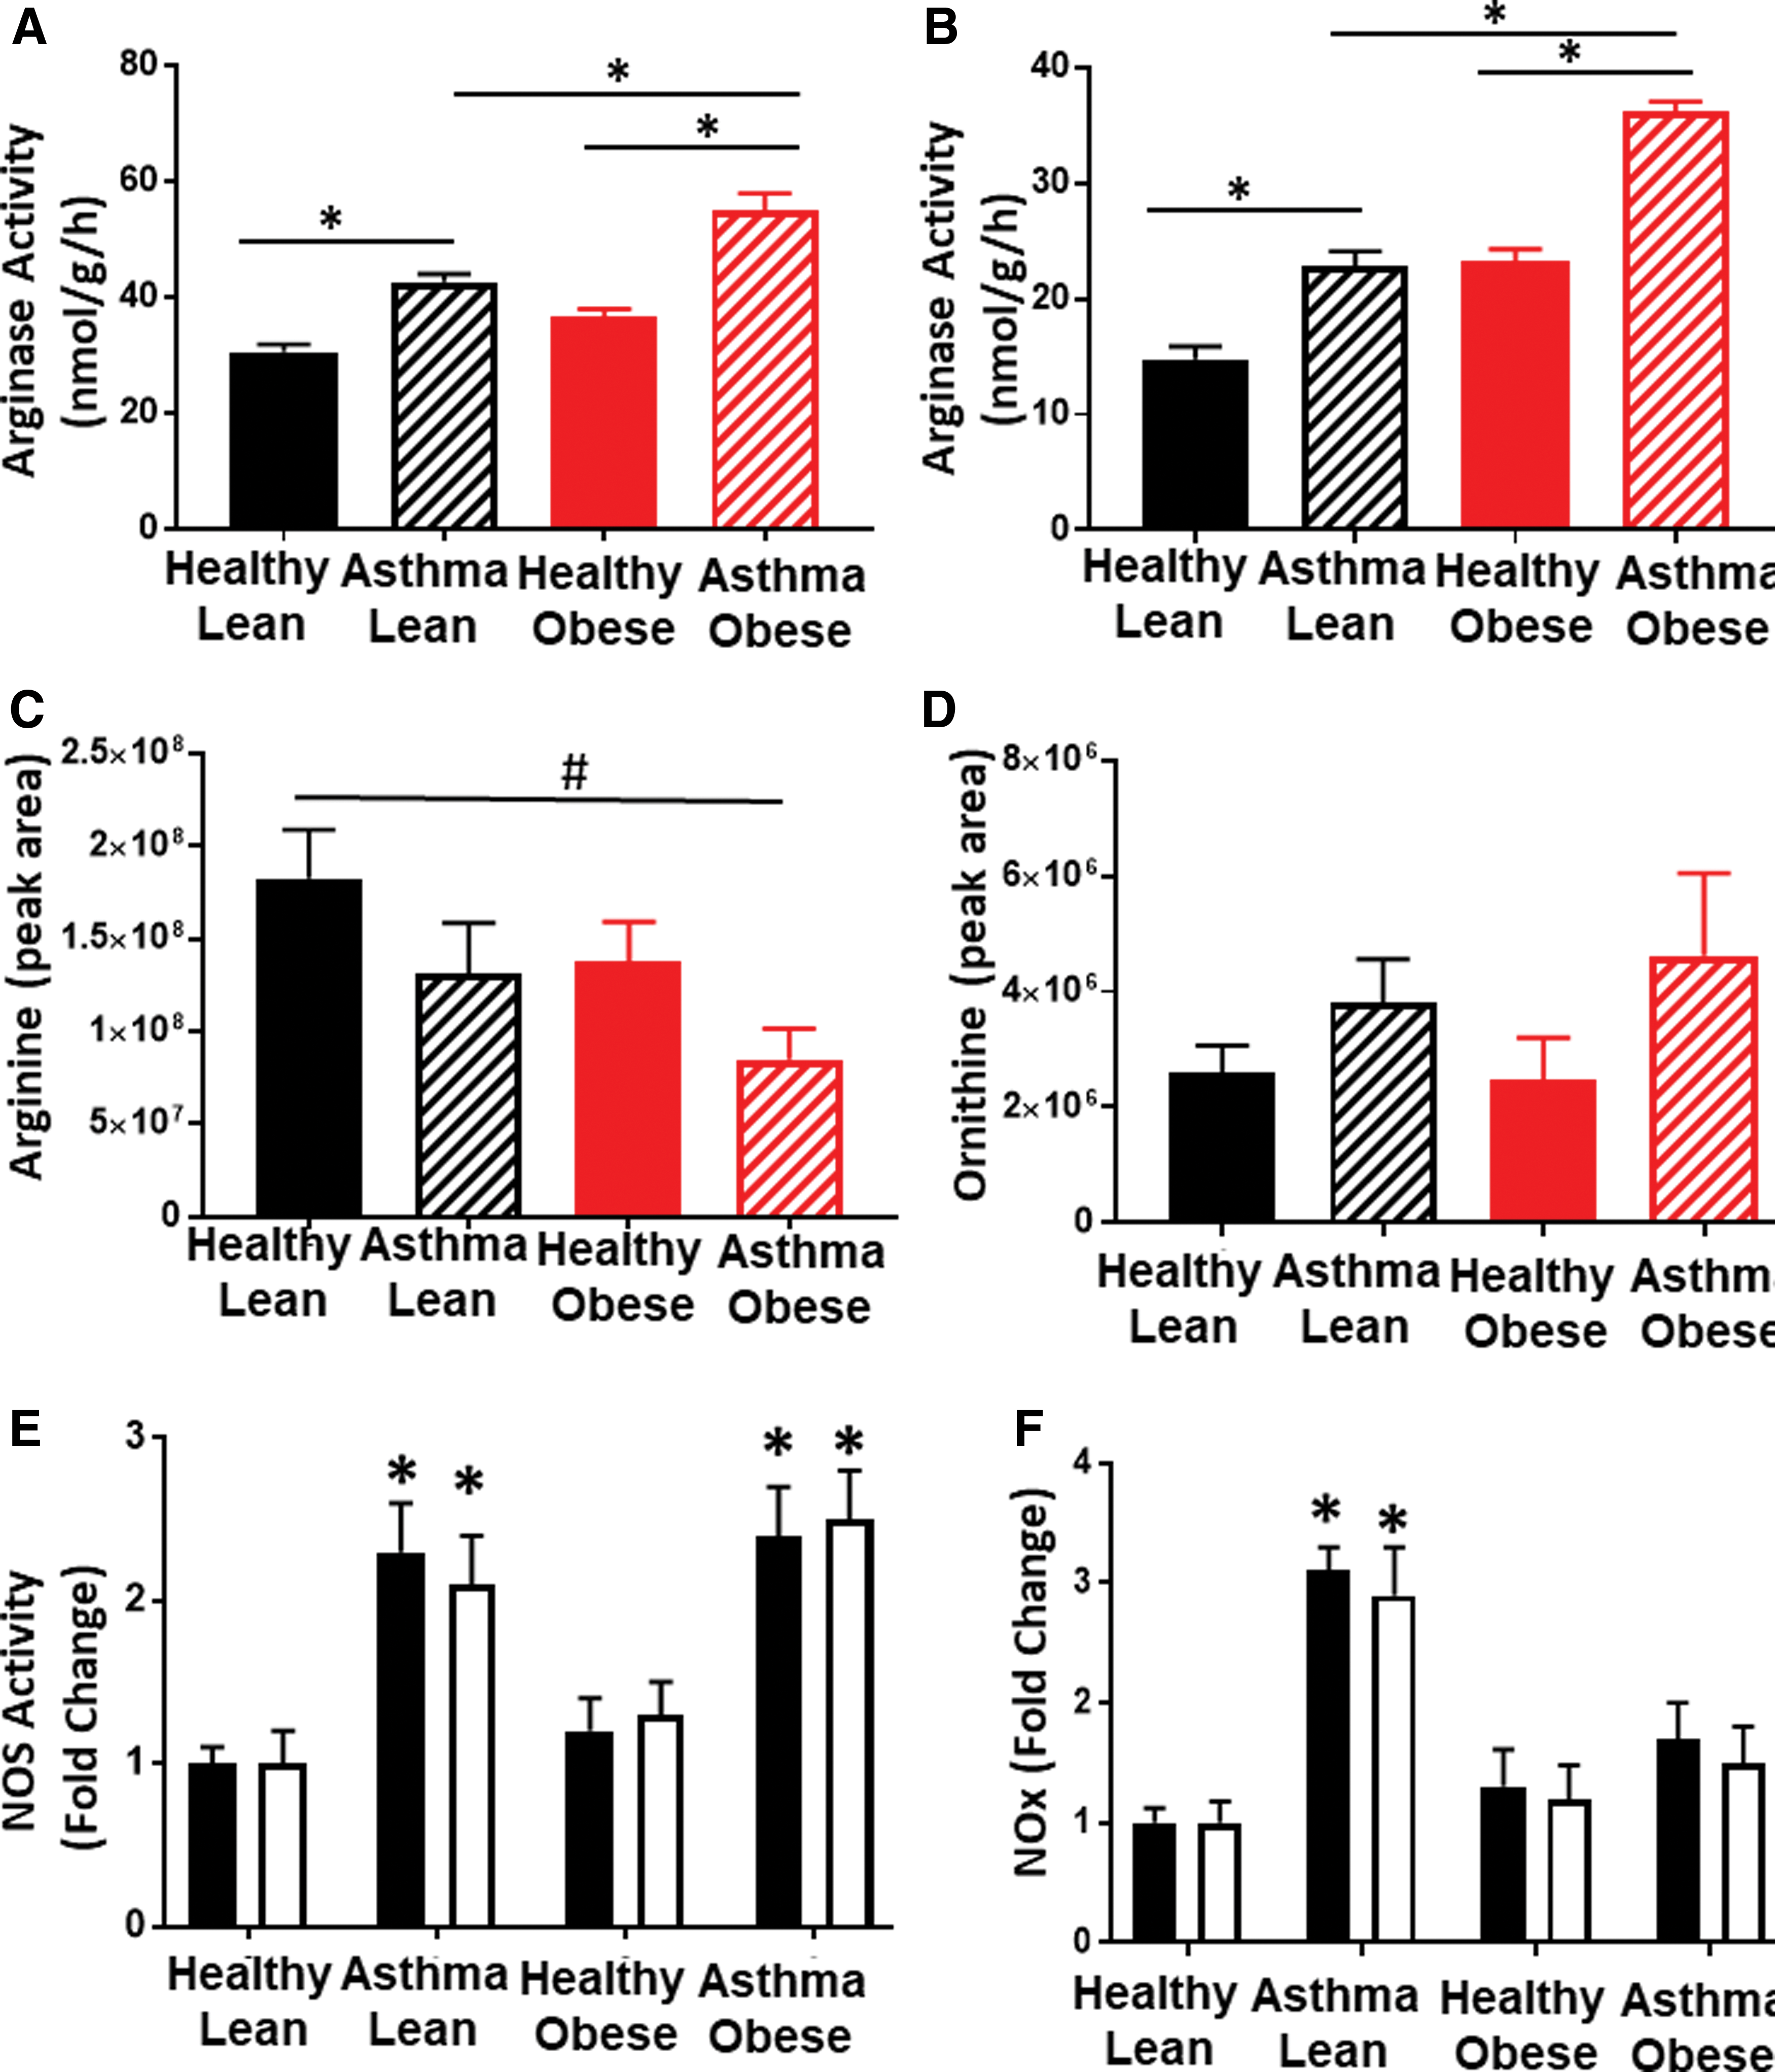
NOS contributes to oxidant production in cells from obese asthmatics
Decreases in
Decreased NO bioavailability regulates respiration in obese asthmatic cells
Prior studies demonstrate that increased arginine metabolism, resulting in elevated ornithine levels, enhances mitochondrial respiration in airway epithelial cells from subjects with asthma (52). Conversely, NO is a potent inhibitor of mitochondrial oxygen consumption through its reversible binding to cytochrome c oxidase (complex IV) (29, 40, 41). Given the increase in ornithine in both asthmatic groups, but difference in NO production, we next tested whether differences in respiratory rate between cells isolated from lean and obese asthmatics were due to increased NO bioavailability in the lean asthmatic group. Respiration was measured in airway epithelial cells isolated from lean and obese asthmatics in the presence and absence of the NO scavenger 2-phenyl-4,4,5,5,-tetramethylimidazoline-1-oxyl 3-oxide (c-PTIO) (100 μM; Fig. 7A). While no significant change in respiration was observed in cells from obese asthmatics, epithelial cells from lean asthmatics showed an increased rate of both basal and maximal respiration on exposure to c-PTIO (Fig. 7A). Similar results were observed in platelets from lean and obese asthmatics (Fig. 7B). These data are consistent with NO-dependent inhibition of respiration, which is absent in obese asthmatic epithelial cells. Notably, no change in basal ECAR was observed in either obese or lean platelets or airway epithelial cells in the presence of c-PTIO (Fig. 7C).
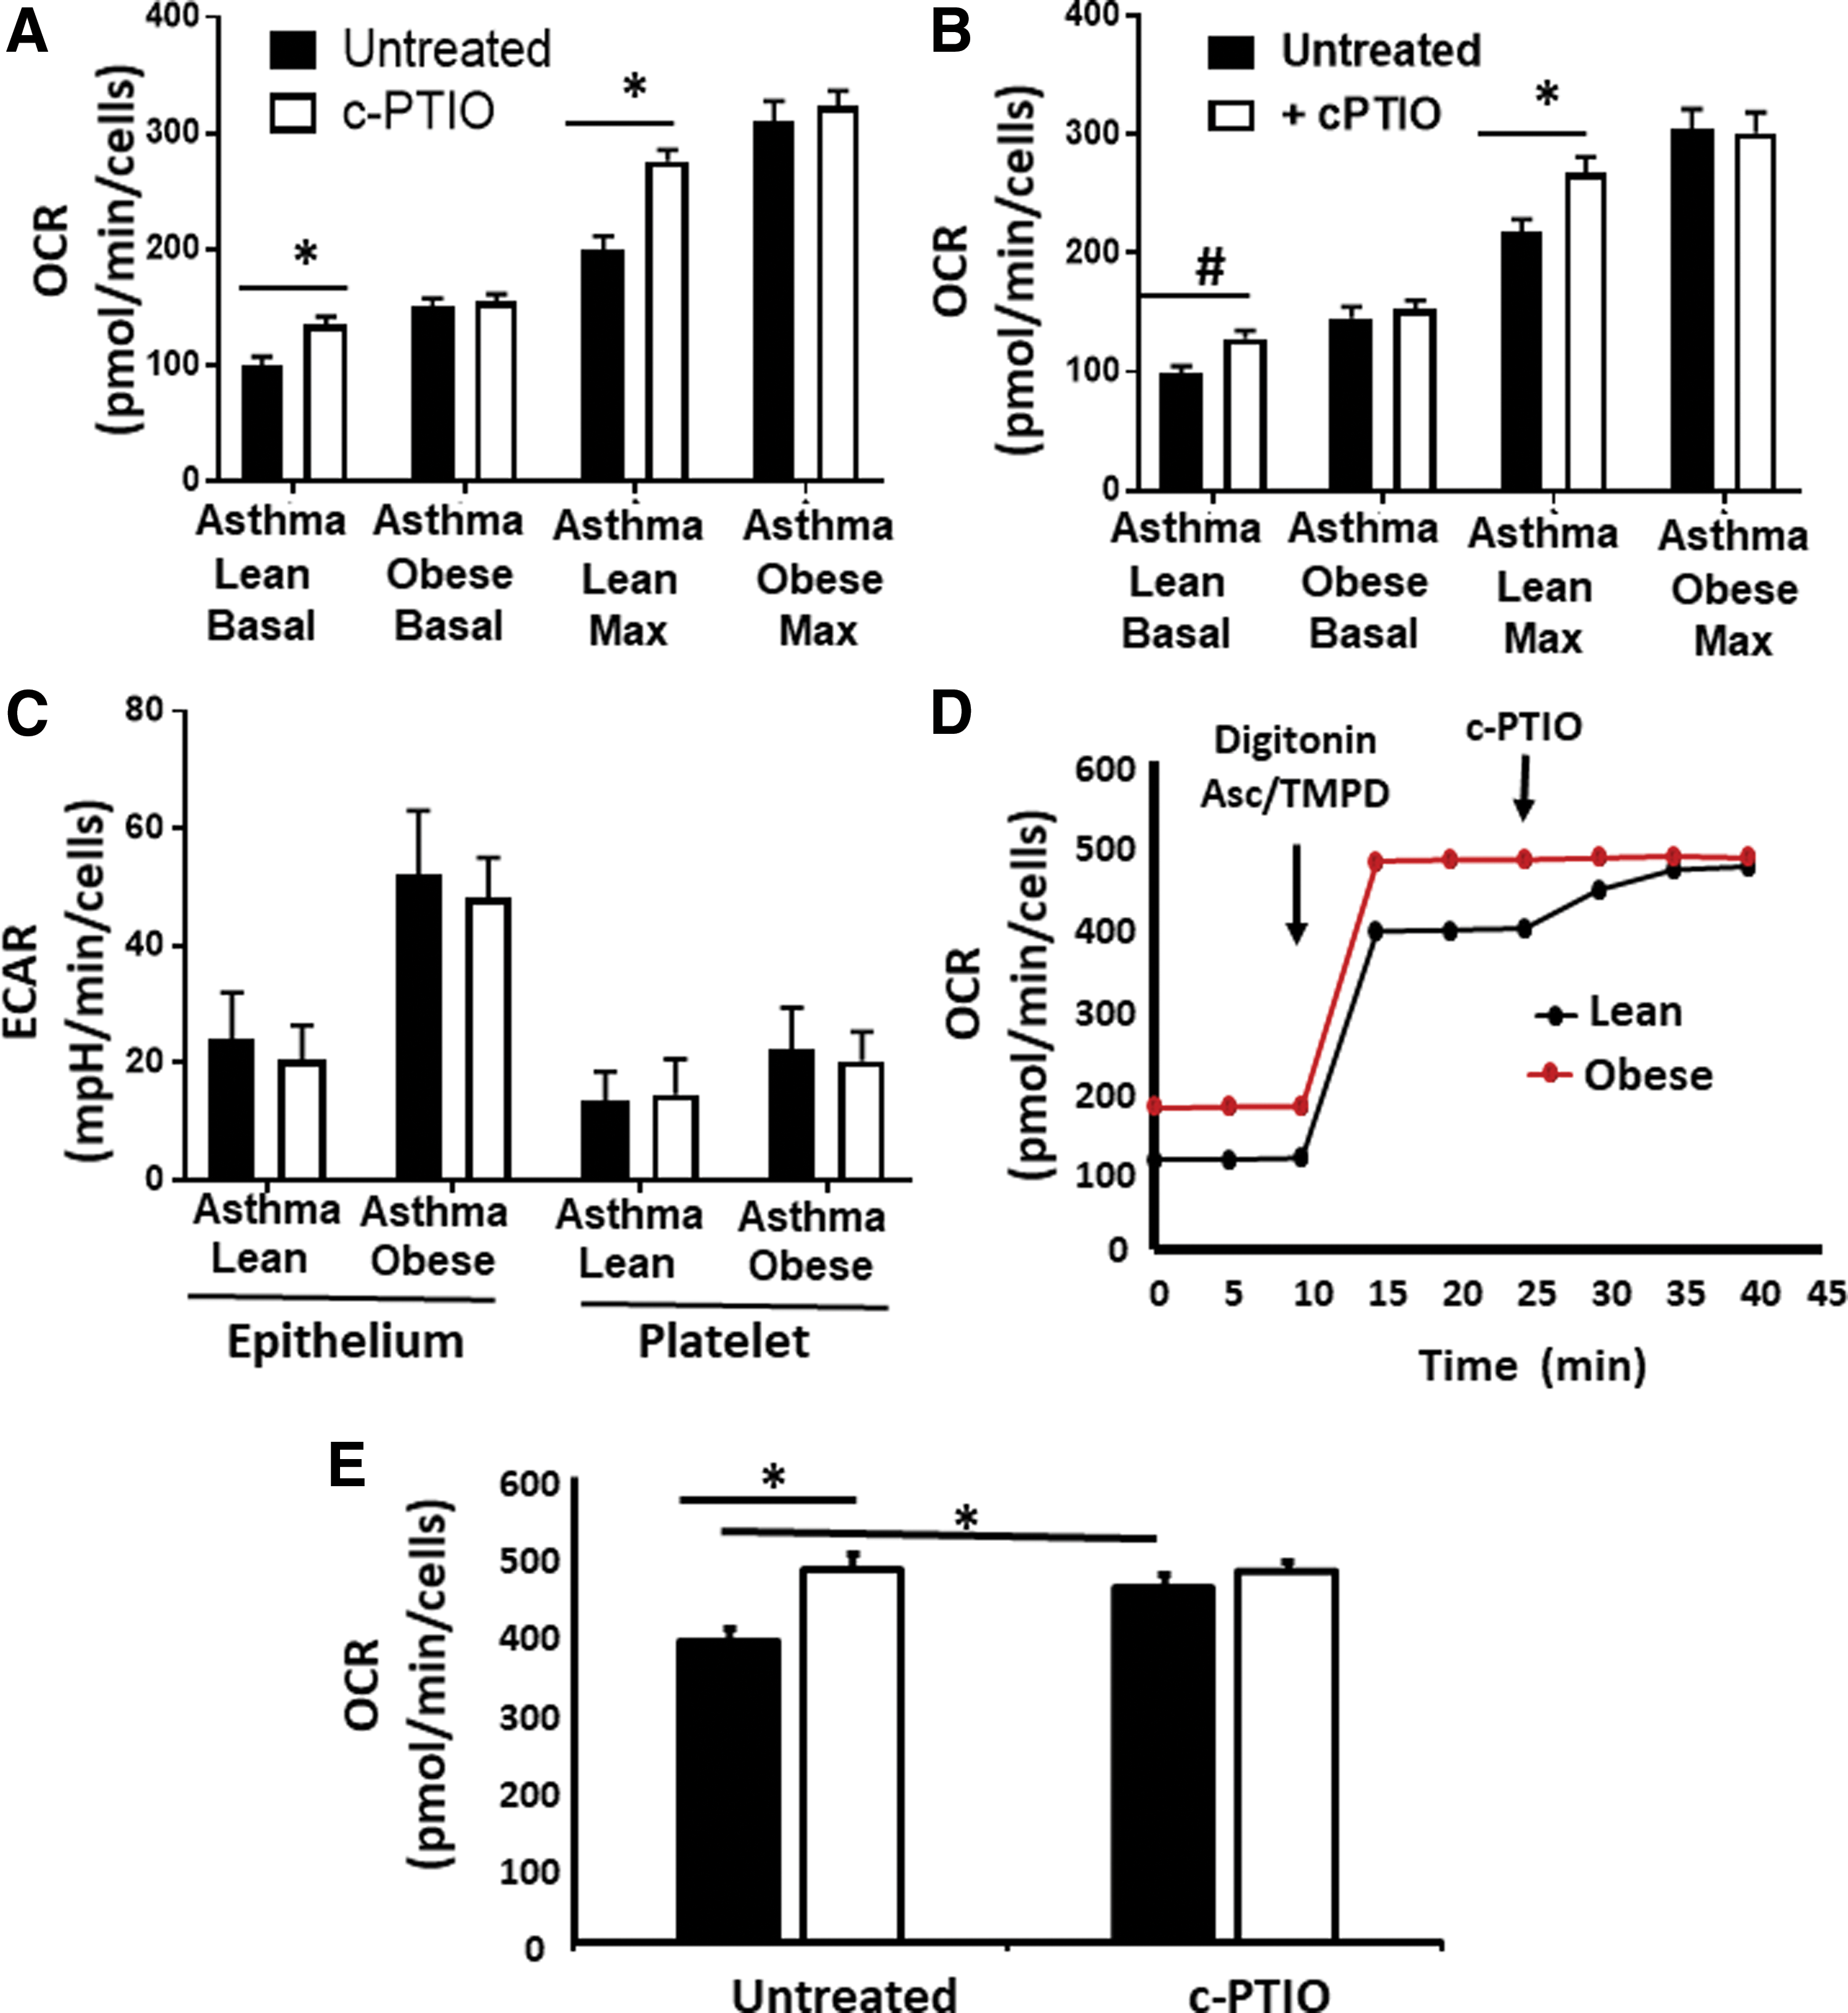
To determine whether the difference in respiration observed between lean and obese cells was due to inhibition of complex IV, we next directly measured complex IV activity in platelets from obese and lean asthmatic individuals. Although our data showed increased complex IV enzymatic activity in both lean and obese cells compared with healthy controls (Fig. 3D), spectrophotometric measurement of this activity was performed in lysed cells, and reversible posttranslational modifications that may be present in the environment of the cell were not taken into account. To take into account the cellular milieu, the plasma membrane of platelets was permeabilized with digitonin such that the cytoskeletal structure and mitochondrial membranes remained intact. Electrons were then directly passed to complex IV by the addition of tetramethyl-p-phenylenediamine (TMPD) and ascorbate, and then, the OCR was measured. In these conditions, complex IV activity was significantly lower in platelets from lean asthmatic individuals and this activity was increased to the rate of platelets from obese asthmatics by the addition of c-PTIO to scavenge NO (Fig. 7D, E). These data confirm that NO-dependent inhibition of complex IV accounts for the decreased respiration rate observed in platelets from lean asthmatics compared with obese asthmatics.
Discussion
The major finding of this study is that lean and obese asthmatics display differential bioenergetics in both their airway epithelial cells and platelets. These data confirm prior studies demonstrating that platelets from lean asthmatics have a lower basal glycolytic rate compared with healthy lean subjects (50). We have now extended these observations to show that cells from obese asthmatics have significantly enhanced basal glycolysis, as well as basal and maximal respiratory rates compared with lean asthmatics and healthy individuals. Recent studies report that the upregulation of arginase 2 within the mitochondrion, resulting in greater ornithine levels, drives the production of TCA cycle intermediates to increase mitochondrial respiration in airway epithelial cells from asthmatic subjects (52). The data presented herein, showing increased respiration associated with upregulation of arginase and increased ornithine levels, are consistent with this pathway, but further elucidate an NO-dependent mechanism that contributes to the enhanced respiratory rate observed in cells from obese asthmatics compared with their lean counterparts.
While it is well established that iNOS is upregulated in the airways of asthmatics, increasing BMI has been associated in some studies with decreased NO bioavailability as measured by FENO (4, 22). Consistent with this, we show equivalent upregulation of NOS activity in lean and obese asthmatic subjects, but decreased NO bioavailability in cells from obese asthmatic subjects in this study. This difference in bioavailability appears to be at least partially due to NOS uncoupling and is evidenced by increased oxidant production in cells from obese asthmatics that is attenuated by NOS inhibition. Nitric oxide potently inhibits mitochondrial respiration through its reversible binding to cytochrome c oxidase (29, 40, 41). Our data suggest that while both lean and obese asthmatics show increased respiratory rate compared with healthy controls, respiration in lean asthmatics is significantly suppressed by NO. This inhibition plays a lesser role in obese asthmatics since NO bioavailability is decreased, and thus leads to the apparent increased respiration rate observed in obese asthmatic cells compared with those from lean asthmatics.
It is unclear what role NO-dependent inhibition of respiration plays in airway inflammation and hyper-responsiveness. The inhibition of cytochrome c oxidase has been implicated in numerous signaling pathways (7). For example, NO-dependent inhibition of respiration has been shown to redirect oxygen signaling within the cell, preventing the stabilization of hypoxia-inducible factor 1 alpha (HIF-1α) (14, 27). Notably, HIF-1α is stabilized in several cell types from animal models of asthma and propagates the inflammatory response (1, 11). Similarly, cytochrome c oxidase inhibition can also enhance mitochondrial superoxide production, leading to downstream signaling, including the activation of the proinflammatory transcription factor NF-κB (13, 33). Interestingly, Hüttemann et al. showed that mice deficient in cytochrome c oxidase activity in the lung demonstrated airway hypo-responsiveness (18), raising the question of whether the lack of NO-mediated inhibition in airway cells from obese asthmatics contributes to the exacerbated hyper-responsiveness observed in some of these subjects, compared with lean asthmatics. Further study is required to determine which downstream inflammatory pathways are initiated by NO-dependent inhibition of respiration, and whether this inhibition contributes to the differences in pathogenesis observed between lean and obese asthmatics.
Beyond differences in NO bioavailability, our data demonstrate that NOS uncoupling contributes to enhanced oxidant production observed in cells from obese asthmatics. Prior studies have observed that ADMA levels are increased in asthma (16, 30, 38), and decreases in the ratio of
In addition to oxidant production by uncoupled NOS, our data demonstrate an increase in mitochondrial oxidant production in cells from asthmatics compared with healthy controls. While we did not elucidate the exact source of mitochondrial oxidant production in this study, complexes I and III of the electron transport chain likely contribute. A limitation of this study is that the mitochondrial membrane potential was not measured. Measurement of this parameter would be important in understanding whether increased membrane potential contributes to electron transport chain-dependent oxidant production. Another limitation of the study is the lack of measurement of mitochondrial biogenesis, which could also contribute to increases in respiration and oxidant production observed in obese asthmatics.
Our data demonstrate a significant increase in glycolysis in both platelets and airway epithelial cells from obese asthmatics, while glycolysis is decreased (compared with healthy controls) in lean asthmatic cells. Prior studies have reported both decreased and increased lactate levels and glycolysis in patients with asthma (32, 35, 50). Xu et al. reported a wide range of lactate levels in the bronchial alveolar lavage from asthmatics, with the highest lactate concentration present in severe asthmatics (compared with mild and moderate asthmatics) (51). Notably, in that study, BMI was highest (>30) in the severe asthmatic group, making this effect consistent with the results, we report here, of increased glycolytic rate in obese versus lean asthmatics. However, in our cohort, obese asthmatics had lower FENO than lean asthmatics, which is in contrast to Xu et al. data showing that glycolysis was highest in patients with the highest FENO (51). The reason for this discrepancy is unclear but suggests that perhaps NO is not the predominant mechanistic regulator of glycolytic rate in these patients. Our data showing no change in ECAR with c-PTIO treatment confirm that the acute, reversible actions of NO are not responsible for the enhanced glycolytic rate observed, although longer term studies with NOS inhibition are required to rule out the role of NO completely. Deeper mechanistic studies are required to investigate the mechanism of upregulated glycolysis, including the roles of glycolytic enzyme expression, changes in substrate utility, or increased oxidant production that has previously been shown to enhance glycolysis through HIF-1α (39, 53).
Our data demonstrating a significant correlation between platelet and airway epithelial bioenergetics are novel. The correlation between respiration and glycolytic rate of these two cell types in healthy individuals is consistent with the growing concept that bioenergetic profiling of circulating cells can serve as a marker of systemic mitochondrial function, and potentially as a surrogate for these measures in other cell types. Molina and colleagues recently showed in nonhuman primates that monocytes and platelets reflect respiratory patterns of skeletal and cardiac muscle (46) and that platelets mimic glucose metabolism measured in the brain by positron emission tomography imaging (47). Furthermore, we and others have shown changes in bioenergetics in circulating cells from individuals with different pathologies and these changes can be correlated with clinical and mechanistic parameters of disease progression (3, 8, 23, 31, 47, 48, 50). Notably, the data herein also demonstrate that redox changes within the platelet, particularly iNOS upregulation and uncoupling as well as enhanced arginase activity, reflect those observed in the airway epithelial cell. These data support accumulating studies suggesting that metabolic and redox dysfunction in asthma is systemic rather than confined to the airway (34, 50). More study is required to determine whether the reflection of airway epithelial bioenergetics is unique to the platelet or common to all circulating cells. This relationship may be unique to platelets as they have been shown to play a role in asthma pathogenesis through their secretion of mitogenic factors, modulation of leukocyte chemotactic factors, and the formation of eosinophil complexes (12, 19, 21). In addition, a recent study showing that platelets are produced in the lung raises the possibility that these cells uniquely reflect lung physiology more closely than other circulating cell types (24). Whether or not these systemic alterations are confined to platelets, our data suggest that platelets could serve as a useful and readily measurable surrogate to assess and understand changes in airway epithelial metabolism with the progression and/or treatment of asthma.
Materials and Methods
Human subjects
All studies were performed in accordance with the University of Pittsburgh Medical Center Institutional Review Board and measurements were performed only after informed consent. All asthmatics had mild to moderate disease, were previously diagnosed by a physician, and had either a significant (>12%) bronchodilator response or a ≥20% drop from baseline in the forced exhalation volume in the first second (FEV1) after a methacholine challenge. Participants were recruited from the Asthma Institute Registry, advertising, other research studies, and the general population. Demographics of human subjects are shown in Table 1.
Human airway epithelial cell isolation
Human airway epithelial cell samples were obtained during bronchoscopies (in subjects described in Table 1), using a standard sterile single-sheathed nylon cytology brush (ConMed, REF 129R; ConMed Corporation, New York). A total of four to six brushings were obtained from each subject and cells were placed into 10 mL of ice-cold phosphate-buffered saline (PBS), centrifuged 10 min at 600gmax room temperature, washed, and resuspended in serum-free hormonally supplemented bronchial epithelial growth medium (Clonetics, San Diego, CA) containing 50 μg of gentamicin and 50 μg of amphotericin. After counting, cell density was adjusted at 1.0 × 10⁶ cells/mL in bronchial epithelial growth medium. For Seahorse experiments, cells were immediately plated on Seahorse plates. After 48 h in submerged conditions, the cells were measured by Seahorse extracellular flux analysis as described below. Cells used for other analyses were also primary cells measured 2 days after isolation and plating.
Human platelet isolation
Platelets were isolated by differential centrifugation from human venous blood collected in citrate containing tubes as previously described (8). Briefly, whole blood was centrifuged (150 g, 10 min) in the presence of prostaglandin I2 (PGI2, 1 μg/mL; Sigma-Aldrich, St. Louis, MO) to obtain platelet-rich plasma. Platelets were subsequently pelleted from the platelet-rich plasma by centrifugation at 1500 g for 10 min. The platelet pellets were washed with erythrocyte lysis buffer (Qiagen, Valencia, CA) and PGI2. The final samples were resuspended in modified Tyrode's buffer (20 mM HEPES, 128 mM NaCl, 12 mM bicarbonate, 0.4 mM NaH2PO4, 5 mM glucose, 1 mM MgCl2, 2.8 mM KCl, pH 7.4) before study.
Measurement of platelet activation
Isolated platelets were incubated with phycoerythrin-labeled mouse anti-human CD41a antibody and APC-labeled mouse anti-human CD62P antibody (30 min; 25°C) to measure surface p-selectin expression by flow cytometry (LSRFortessa with FACSDiva software; Becton Dickinson). Platelets were identified by their characteristic light scatter and CD41a antibody binding. Activated platelets are reported as the percentage of 10,000 CD41+ platelets exhibiting APC-CD62P fluorescence.
Measurement of OCR and ECAR in platelets and epithelial cells
OCR and ECAR were measured in isolated platelets and epithelial cells using the Seahorse Extracellular Flux (XF96) Analyzer (Seahorse Bioscience, Inc., North Billerica, MA) as previously described (8, 50). Isolated platelets were diluted in unbuffered Dulbecco's modified Eagle's media (pH 7.4 at 37°C) to 50 × 106 cells/mL and 500 μL of sample loaded per well in standard XF24 plates. Epithelial cells (once isolated) were seeded and grown overnight at the density of 5 × 10⁴ cells/well. Once in the XF24, the platelets or epithelial cells were consecutively treated with oligomycin A (2.5 μM), carbonyl cyanide-ρ-trifluoromethoxyphenylhydrazone (FCCP) (0.7 μM), 2-DG (100 μM), and rotenone (2 μM). Three measurements of OCR and ECAR were made over 1.5 min after addition of the agents and a 3-min mix step. OCR and ECAR readings were normalized to cell number.
Measurement of complex IV activity in permeabilized cells
Platelets (50 × 106) were seeded and equilibrated in standard XF24 plates as described above. Once a stable baseline rate was established, cells were treated with digitonin (20 μg/mL) and TMPD (500 μM). Ascorbate (2 mM) was also injected to maintain TMPD in its reduced form. OCR was measured by extracellular flux analysis as described above.
Measurement of electron transport complex and TCA cycle enzyme activities
All enzymatic activities were measured as previously described (8, 50) in cells (50–100 μg of protein) after undergoing three cycles of freeze/thaw. Briefly, citrate synthase activity was measured by monitoring the rate of conversion of acetyl coenzyme A (CoA) (100 μM) and oxaloacetate (200 μM) to citrate spectrophotometrically at 412 nm by coupling CoA production with the colorimetric indicator dithionitrobenzoic acid (200 μM). Complex I activity was measured using NADH (100 μM) and ubiquinone (100 μM) as substrates and monitoring the rotenone (10 μM)-sensitive decrease in absorbance of NADH at 340 nm. Complex II activity was measured using succinate (1.2 mM) and ubiquinone (50 μM) as substrates, coupling the (i) complex II catalyzed transfer of an electron from succinate to ubiquinone and the (ii) ubiquinol reduction of the dye 2,6-dichlorophenolindophenol (150 μM), which is monitored by a decrease in its absorbance at 600 nm and inhibited by thenoyltrifluoroacetone (50 μM). Complex IV activity was measured using reduced cytochrome c (50 μM) as the substrate and monitoring the oxidation of cytochrome c at 550 nm that was inhibitable by potassium cyanide (50 μM). All complex activities were normalized to protein concentration as determined by the Bradford protein assay method.
Measurement of ATP production
ATP production was measured by using a luciferase-based luminescence assay kit (PerkinElmer, Waltham, MA) and measuring the linear rate of luminescence over 5 min as previously described (8, 50). ATP content was normalized to platelet or airway epithelial cell number.
Measurement of mtDNA
Mitochondrial DNA was isolated from airway epithelial cells and platelets and DNA copy number quantified by real time-PCR (RT-PCR) using the primer for ND1 (R: 5′ GGC GTC TGC AAA TGG TTG TAA; F: 5′ AAT CGC CAT AGC CTT CCT AAC AT). These results were expressed as a ratio of nuclear DNA quantified by RT-PCR using the primer for histone 19 (F: 5′ GTA CCC ACC TGT CGT CC; R: 5′ GTC CAC GAG ACC AAT GAC TG) in airway epithelial cells. Since platelets do not contain nuclear DNA, mtDNA was normalized to platelet number.
Measurement of ROS production
Mitochondrial superoxide production was measured by MitoSOX as previously described (8). Briefly, cells were incubated with MitoSOX reagent (5 μM, 10 min; Invitrogen, Carlsbad, CA) and washed with PBS. Fluorescent intensity (510/580 nm) was measured kinetically for 10 min and normalized to cell number. Total H2O2 production was measured by spectrophotometrically monitoring the oxidation of Amplex Red by platelets or epithelial cells over 10 min to calculate the rate of H2O2 production. Rates are normalized for cell number.
Nitrotyrosine content
Nitrotyrosine concentration was assessed in platelets and airway epithelial cells by enzyme-linked immunosorbent assay as per the manufacturer's instructions (Ab113848; Abcam).
NOS activity
Total cellular NOS activity was assessed in lysed platelet or airway epithelial cells by quantifying the conversion of [3H]-arginine to citrulline in the presence and absence of
NOx measurement
NOx encompasses total NO species, including nitrite and nitrate. NOx was measured by vanadium chloride-based reductive chemiluminescence as previously described (10). Briefly, cells were placed in fresh PBS for 10 min, and then, the PBS was removed and injected into a solution of vanadium chloride kept at 90°C. The vessel was purged with helium gas and connected inline to a nitric oxide analyzer (Seivers). The area under the curve of the resulting signal was measured and compared with known concentrations of nitrite/nitrate to calculate NOx concentration. NOx concentration was normalized to cell number.
Arginase activity
Total cellular arginase activity was quantified in frozen/thawed airway epithelial cells or platelets utilizing a colorimetric arginase activity kit (MAK 112; Sigma-Aldrich). Arginase activity yields ornithine and urea. In this assay, urea reacts with kit components to generate a colored compound, which was measured at 430 nm.
High-resolution liquid chromatography mass spectrometry to measure arginine and ornithine
Sample preparation
One hundred microliters of plasma was spiked with an isotopically labeled standard (Taurine-1,1,2,2-d4; Sigma-Aldrich, St. Louis, MO) to a final concentration of 100 nM. Simultaneous protein precipitation and polar amino acid extraction were performed using 300 μL ice-cold 1:1 (v:v) methanol:ethanol as previously described (1). Briefly, samples were cleared by centrifugation at 16,000 g and the supernatant dried under nitrogen gas. Samples were resuspended in 5% ACN in water and 5 μL subjected to online liquid chromatography tandem mass spectrometry (LC-MS/MS) analysis.
LC-MS/MS method
Analyses were performed by untargeted LC-MS/MS. Briefly, samples were separated over a reversed-phase Phenomenex Kinetex C18+ column (2.1 × 100 mm, 1.7 μm particle size) maintained at 40°C. For the 20-min LC gradient, the mobile phase consisted of the following: solvent A (1.5 mM ammonium fluoride) and solvent B (100% acetonitrile). The gradient was the following: 0–12.0 min 5% B to 1000% B, 12.0–15.0 min hold at 100% B, 15.0–15.1 100% to 5% B, 15.1–20.0 min 5% B. The Q Exactive mass spectrometer was operated in positive ion mode, scanning in full MS mode (2 microscans) from 66.7 to 1000 m/z at 70,000 resolution with an AGC target of 3e6, dd-ms2 fragmentation was selected for the top 4 ions per full scan using an AGC target of 1e5, NCE of 35, using an isolation window of 1 AMU. Source settings were 4.5 kV spray voltage, 20 sheath gas, 10 auxiliary gas at 320°C, and 4 sweep gas. Calibration was performed before analysis using the Pierce™ negative ion calibration solutions (Thermo Fisher Scientific). Integrated peak areas were then extracted manually using Quan Browser (Thermo Fisher Xcalibur version 2.7). Graphs and statistical analyses (either t-test or ANOVA) were prepared with GraphPad Prism 7.0 (GraphPad Software, Inc., La Jolla, CA).
NO2-cLA sample preparation and LC-MS/MS
Plasma (0.5 mL) samples containing 10 nM [13C18]-NO2-OA internal standard were incubated with 10 mM HgCl2 for 30 min at 37°C to release adducted NO2-cLA before extraction with 1 mL hexane:isopropanol:1 M formic acid (30:20:2) and an additional 1 mL of hexanes. The samples were vortexed and centrifuged at 2800 rpm for 10 min at 4°C and the organic phase was transferred to a new glass vial and dried under N2. Samples were stored at −80°C until analysis.
A CTC PAL autosampler (Leap Technologies, Carrboro, NC) and a Shimadzu LC-20AD pump (Columbia, MD) coupled to a Sciex 5000 triple quadrupole mass spectrometer (Framingham, MA) were used for the quantification of NO2-cLA. Samples were reconstituted in 100 μL of methanol and 10 μL was injected onto a reversed-phase column [Phenomenex Luna C18(2), 2 × 100 mm] at a flow rate of 0.75 mL/min. The gradient used for separation consisted of solvent A: water and 0.1% acetic acid and solvent B: acetonitrile and 0.1% acetic acid. The 15-min method started at 40% B and increased to 100% B over 10 min and was held for 2 min, following 3 min of equilibration at initial conditions. MS analyses was conducted using negative ion mode electrospray ionization with the following source parameters: collision gas 5 units, curtain gas 50 units, ion source gas (ISG)#1 55 units and ISG#2 50 units, ion spray voltage −4500 V, and source temperature 650°C. The declustering potential was set at −60, entrance potential −10, collision energy −35, and the collision exit potential −3. NO2-cLA was monitored at m/z 324→46 (loss of nitro group) and the internal standard [13C18]-NO2-OA at m/z 344→46. Endogenous NO2-cLA was quantified using a standard curve developed with synthetic NO2-cLA and [13C18]-NO2-OA internal standard.
Statistical analyses
Data are shown as mean ± standard error. All statistical comparisons are performed using the Student's t-test or one-way ANOVA as appropriate. The level of significance for p was chosen at 0.05. All data were analyzed with statistical program JMP Pro 10 (SAS Institute, Cary, NC).
Footnotes
Acknowledgments
This work was supported by the Hemophilia Center of Western Pennsylvania and NIH grant 1 R01 HL133003-01A1 to S.S.
Author Disclosure Statement
No competing financial interests exist.
Supplementary Material
Supplementary Figure S1
Abbreviations Used
References
Supplementary Material
Please find the following supplemental material available below.
For Open Access articles published under a Creative Commons License, all supplemental material carries the same license as the article it is associated with.
For non-Open Access articles published, all supplemental material carries a non-exclusive license, and permission requests for re-use of supplemental material or any part of supplemental material shall be sent directly to the copyright owner as specified in the copyright notice associated with the article.