
Abstract
Aims:
The nuclear factor erythroid 2-related factor 2-Kelch-like ECH-associated protein 1 (NRF2-KEAP1) pathway plays an important role in the cellular response to oxidative stress but may also contribute to metabolic changes and drug resistance in cancer. However, despite its pervasiveness and important role, most of nuclear factor erythroid 2-related factor 2 (NRF2) target genes are defined in context-specific experiments and analysis, making it difficult to translate from one situation to another. Our study investigates whether a core NRF2 gene signature can be derived and used to represent NRF2 activation in various contexts, allowing better reproducibility and understanding of NRF2.
Results:
We define a core set of 14 upregulated NRF2 target genes from 7 RNA-sequencing datasets that we generated and analyzed. This NRF2 gene signature was validated using analyses of published datasets and gene sets. An NRF2 activity score based on expression of these core target genes correlates with resistance to drugs such as PX-12 and necrosulfonamide but not to paclitaxel or bardoxolone methyl. We validated these findings in our Kelch-like ECH-associated protein 1 (KEAP1) knockout cancer cell lines. Finally, our NRF2 score is prognostic for cancer survival and validated in additional independent cohorts for lung adenocarcinoma and also novel cancer types not associated with NRF2-KEAP1 mutations such as clear cell renal carcinoma, hepatocellular carcinoma, and acute myeloid leukemia.
Innovation and Conclusions:
These analyses define a core NRF2 gene signature that is robust, versatile, and useful for evaluating NRF2 activity and for predicting drug resistance and cancer prognosis. Using this gene signature, we uncovered novel selective drug resistance and cancer prognosis associated with NRF2 activation. Antioxid. Redox Signal. 41, 1031–1050.
Innovations
Our study establishes a core NRF2 gene signature of 14 genes, derived from seven RNA-sequencing datasets, that serves as a universal marker for NRF2 activation across different tissues and activation methods. Unlike previous context-specific analyses, this signature provides consistent and reproducible insights into NRF2's role in drug resistance and cancer prognosis. We have validated the signature's predictive value in previous NRF2 datasets and cancer types. Finally, our signature also reveals new cancers with NRF2-dependent prognoses and identifies drug responses that were not affected by NRF2 activation.
Introduction
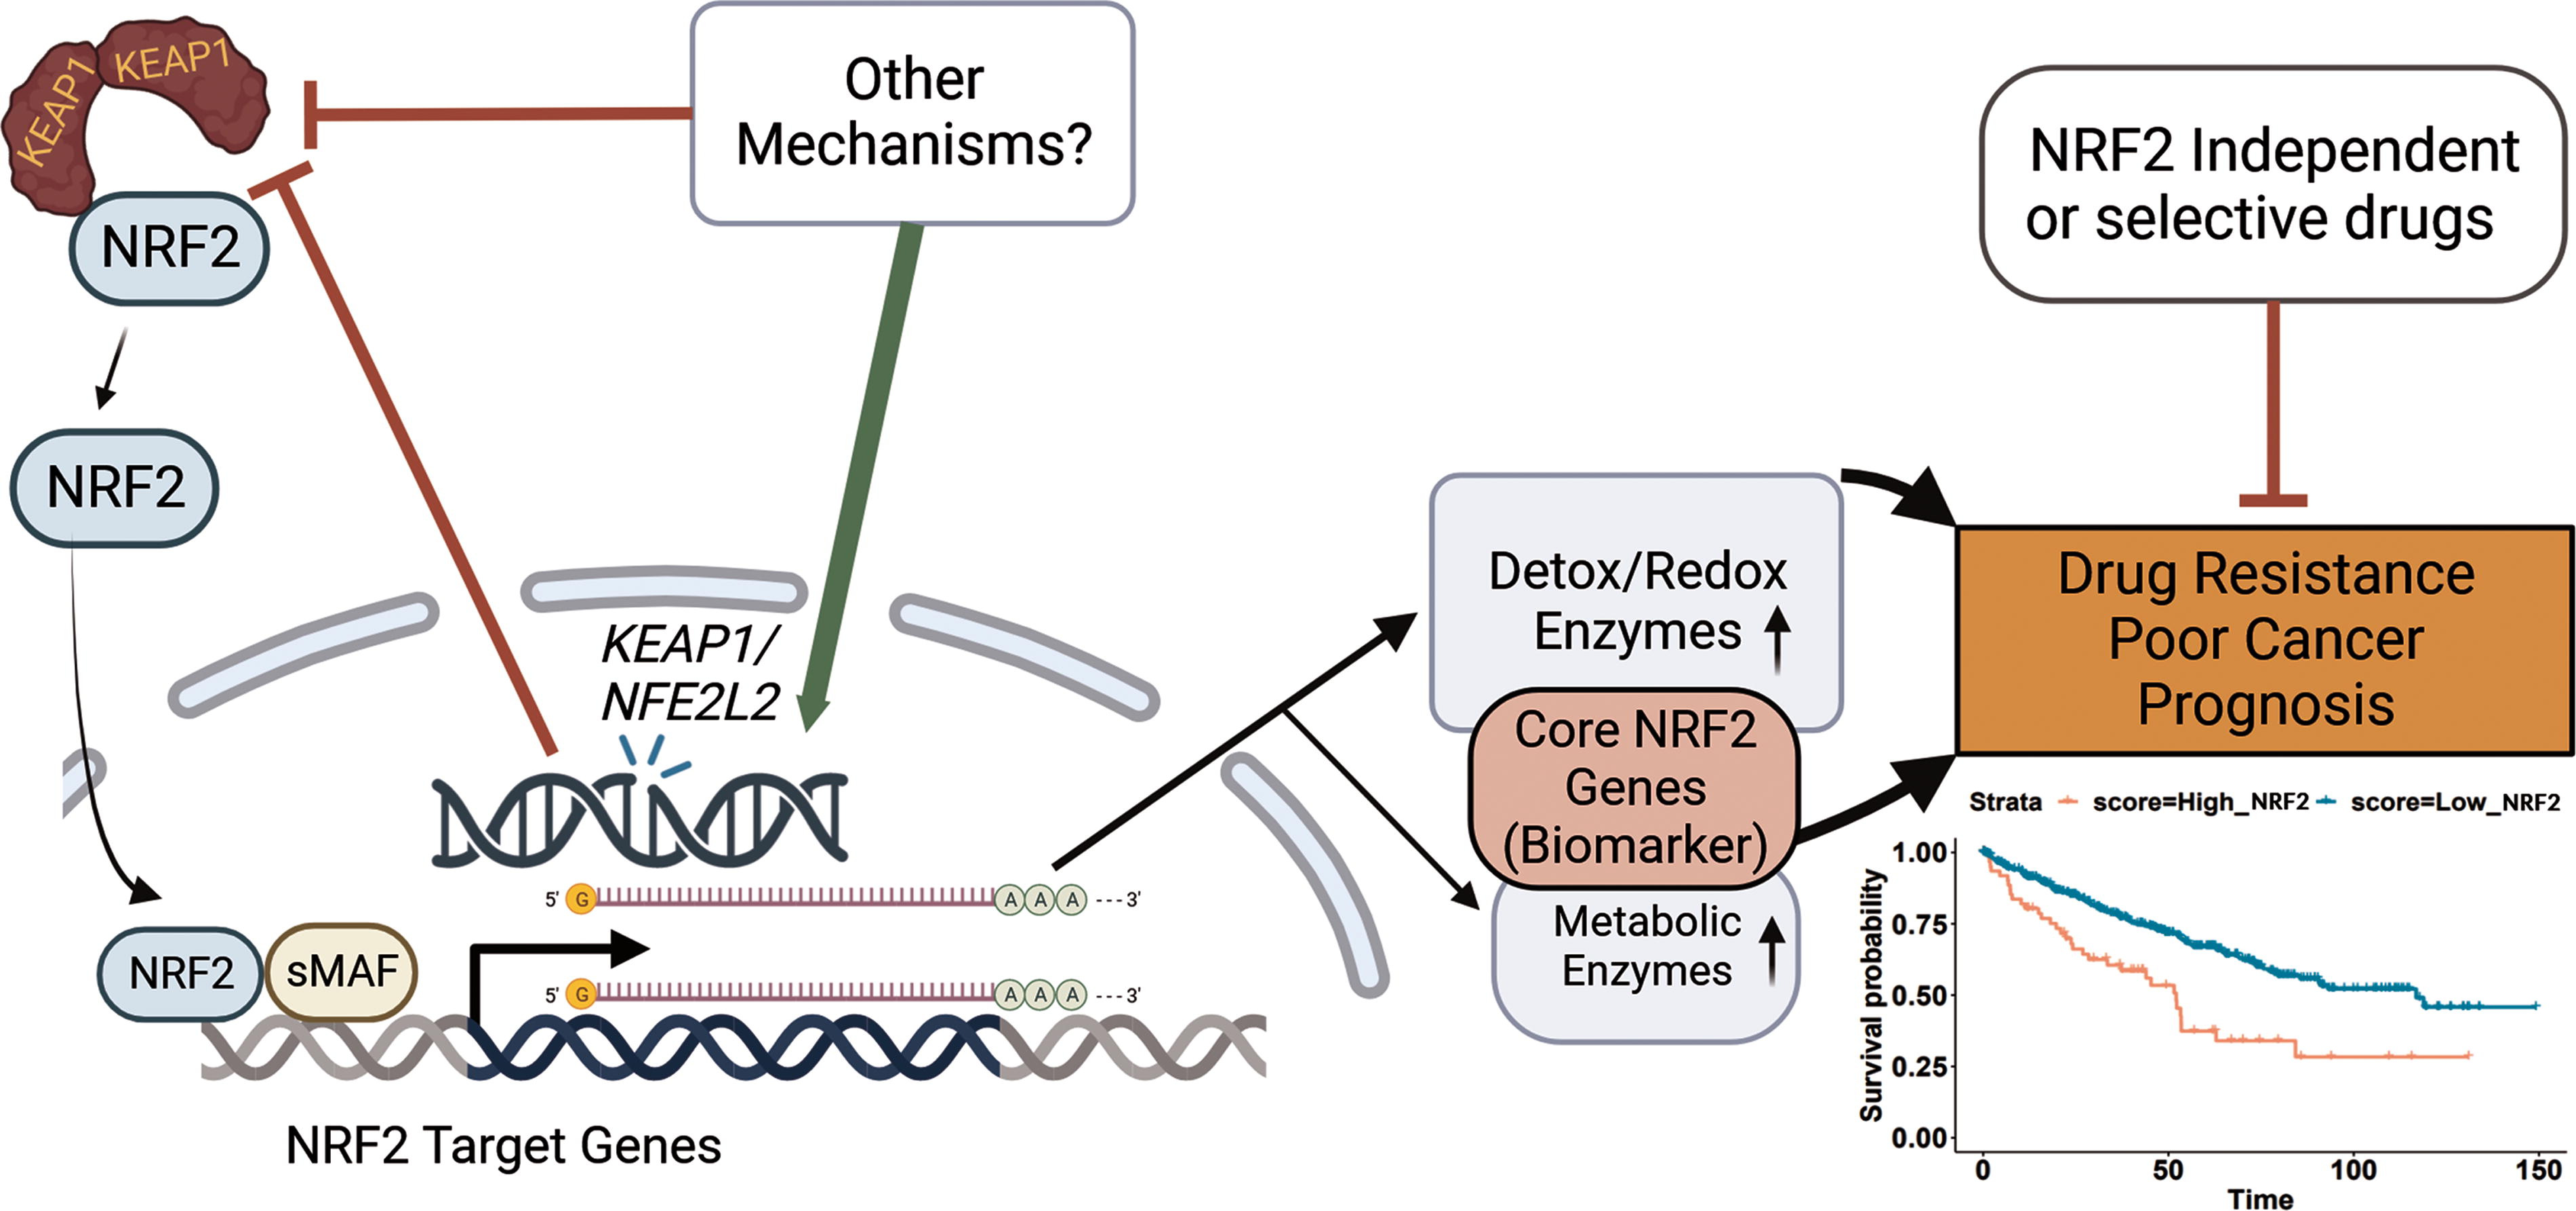
Nuclear factor-erythroid 2-related factor 2 (NFE2L2, NRF2) is a transcription factor that plays a key role in the regulation of cellular defense mechanisms against oxidative stress and other forms of cellular damage (Ma, 2013). NRF2 is responsible for the activation of a wide range of antioxidant and detoxifying enzymes, which help to protect cells from damage caused by reactive oxygen species (ROS) and other toxic molecules (Ma, 2013). Kelch-like ECH-associated protein 1 (KEAP1) is an adaptor protein that acts as a negative regulator of NRF2 by targeting it for ubiquitination and degradation (Ma, 2013; Taguchi and Yamamoto, 2017). In normal cells, KEAP1 acts to prevent NRF2 from becoming overactive and inducing excessive oxidative stress (Ma, 2013; Taguchi and Yamamoto, 2017). However, in cancer cells and other disease states, the NRF2-KEAP1 pathway can become dysregulated, leading to the activation of NRF2 and the increased expression of its NRF2 target genes (Singh et al., 2006; Taguchi and Yamamoto, 2017). The consequences of constitutive NRF2 activation in cancer include increased chemoresistance and a poor overall prognosis (Shibata et al., 2008; Shibata et al., 2008; Singh et al., 2006; Taguchi and Yamamoto, 2017).
The nuclear factor erythroid 2-related factor 2-Kelch-like ECH-associated protein 1 (NRF2-KEAP1) pathway is therefore a crucial component of cellular defense mechanisms, and its dysregulation can play a major role in the development of diseases such as cancer, neurodegeneration, and inflammation (Dinkova-Kostova et al., 2018; Pillai et al., 2022; Saha et al., 2020; Shibata et al., 2008). In recent years, the NRF2-KEAP1 pathway has become a target for the development of new drugs for the treatment of these and other diseases (Cuadrado et al., 2018; Cuadrado et al., 2019). Two examples of therapeutics that directly target the NRF2-KEAP1 pathway include dimethyl fumarate for multiple sclerosis and omevaloxolone for Frederich’s ataxia (Dayalan Naidu and Dinkova-Kostova, 2023; Gopal et al., 2017; Hammer et al., 2018). Thus, a deeper understanding of the NRF2-KEAP1 pathway and its role in cellular biology is of significant interest to both basic science and clinical researchers. However, despite the interest and attention, there are few reliable biomarkers to measure NRF2 activity for the wide range of research contexts (Dinkova-Kostova and Copple, 2023; Yagishita et al., 2020).
For biomarkers of NRF2 activity, researchers have used various genes to evaluate NRF2 activity but there is little consensus despite decades of research on NRF2 signaling and target genes (Dinkova-Kostova and Copple, 2023; Gopal et al., 2017; Hammer et al., 2018; Riedl et al., 2009; Yagishita et al., 2020). Yagishita et al. and Kopacz et al. both report the common usage of NAD(P)H dehydrogenase [quinone] 1 (NQO1) as a proxy for NRF2 signaling in research and clinical trials but secondary options vary from HMOX1, AKR1C1, GSTM1, and GSTP1 (Dinkova-Kostova and Copple, 2023; Gopal et al., 2017; Hammer et al., 2018; Kopacz et al., 2022; Riedl et al., 2009; Yagishita et al., 2020). Although NQO1 may be a great first option, it would be wise to have other confirmatory options to use as well as know analytically what are the most representative NRF2 target gene that be used under any context. Kopacz et al. details caveats of sole use of NQO1 or HMOX1 as NRF2 biomarkers (Kopacz et al., 2022). Even NQO1 may not be the best representative of NRF2 activity in all cases as TP53 may play a role in its specific expression (Beinse et al., 2019; Eriksson et al., 2019). Likewise, GCLC and GCLM may be affected pathways outside of NRF2 such as mammalian target of rapamycin complex 1 (mTORC1) (Torrence et al., 2021; Wang et al., 2017). After all, many genes may be regulated by various factors so by having multiple genes, the result is less likely to be affected by other signals and noise (Raser and O’Shea, 2005).
Here we first address this issue by defining a core set of NRF2 target genes which faithfully represents NRF2 activation in a wide array of contexts through analyses of a variety of cancer cell types and normal cells, as well as both pharmacological and genetic activation of NRF2. Generating these datasets allowed us to find the most universally upregulated target genes of NRF2 while also enabling us to compare differences between the activation of NRF2 in these various contexts. We define a list of 14 core upregulated target genes of NRF2 which are present in every dataset that we generated, which we validate with published NRF2 datasets and compare with prior publications. This analysis allowed us to create a core gene signature that is representative of NRF2 activity (Fig. 1).
Using these core target genes, we generate a NRF2 change score (N2CS) which is useful for identifying both which and to what degree specific genetic modifications and drugs activate NRF2. A similar but distinct NRF2 activity score (N2AS) can predict which drugs are affected by NRF2 activation and which cell lines are most resistant to these drugs. We validate the modeling of selective drug resistance in our own cell lines. Finally, we investigated whether this N2AS is associated with prognosis in a variety of cancers. We trained the N2AS in 22 The Cancer Genome Atlas (TCGA) cancers (Liu et al., 2018), and were able to validate in four cancers that the N2AS have significantly poorer prognosis associated with NRF2 activity in an external cohorts. Overall, we identify a robust and reliable NRF2 signature that can be used in a wide range of contexts including predicting NRF2-associated drug resistance and as a gene signature of a poor cancer prognosis.
Results
Generation of seven transcriptomic datasets of NRF2 activation
To determine the core target genes of NRF2, we investigated gene expression changes from both genetic and pharmacological targeting of the NRF2/KEAP1 pathway (Fig. 2A). We treated myeloma (RPMI-8226), ovarian (OVCAR-8), glioma (SF8628), and primary dermal fibroblast cells with an NRF2 activator (Cao et al., 2015), the synthetic oleanane triterpenoid CDDO-2P-Im (1-[2-Cyano-3,12-dioxooleana-1,9 (11)-dien-28-oyl]−4(-pyridin-2-yl)−1H-imidazole), for 6 h before extracting RNA for RNA-sequencing. We then confirmed activation of NRF2 through upregulation of NQO1, a well-established target of NRF2 (Ma, 2013; Taguchi and Yamamoto, 2017), in each of these cells (Fig. 2B–E). We also used CRISPR-Cas9 to knock out KEAP1 in ARH-77, a B-cell lymphoblastic cell line, and verified the KEAP1 deletion at the DNA, RNA, and protein levels (Fig. 2F–H). Furthermore, NQO1 was upregulated at baseline compared to the wild-type (WT) ARH-77 cells (Fig. 2I and J).
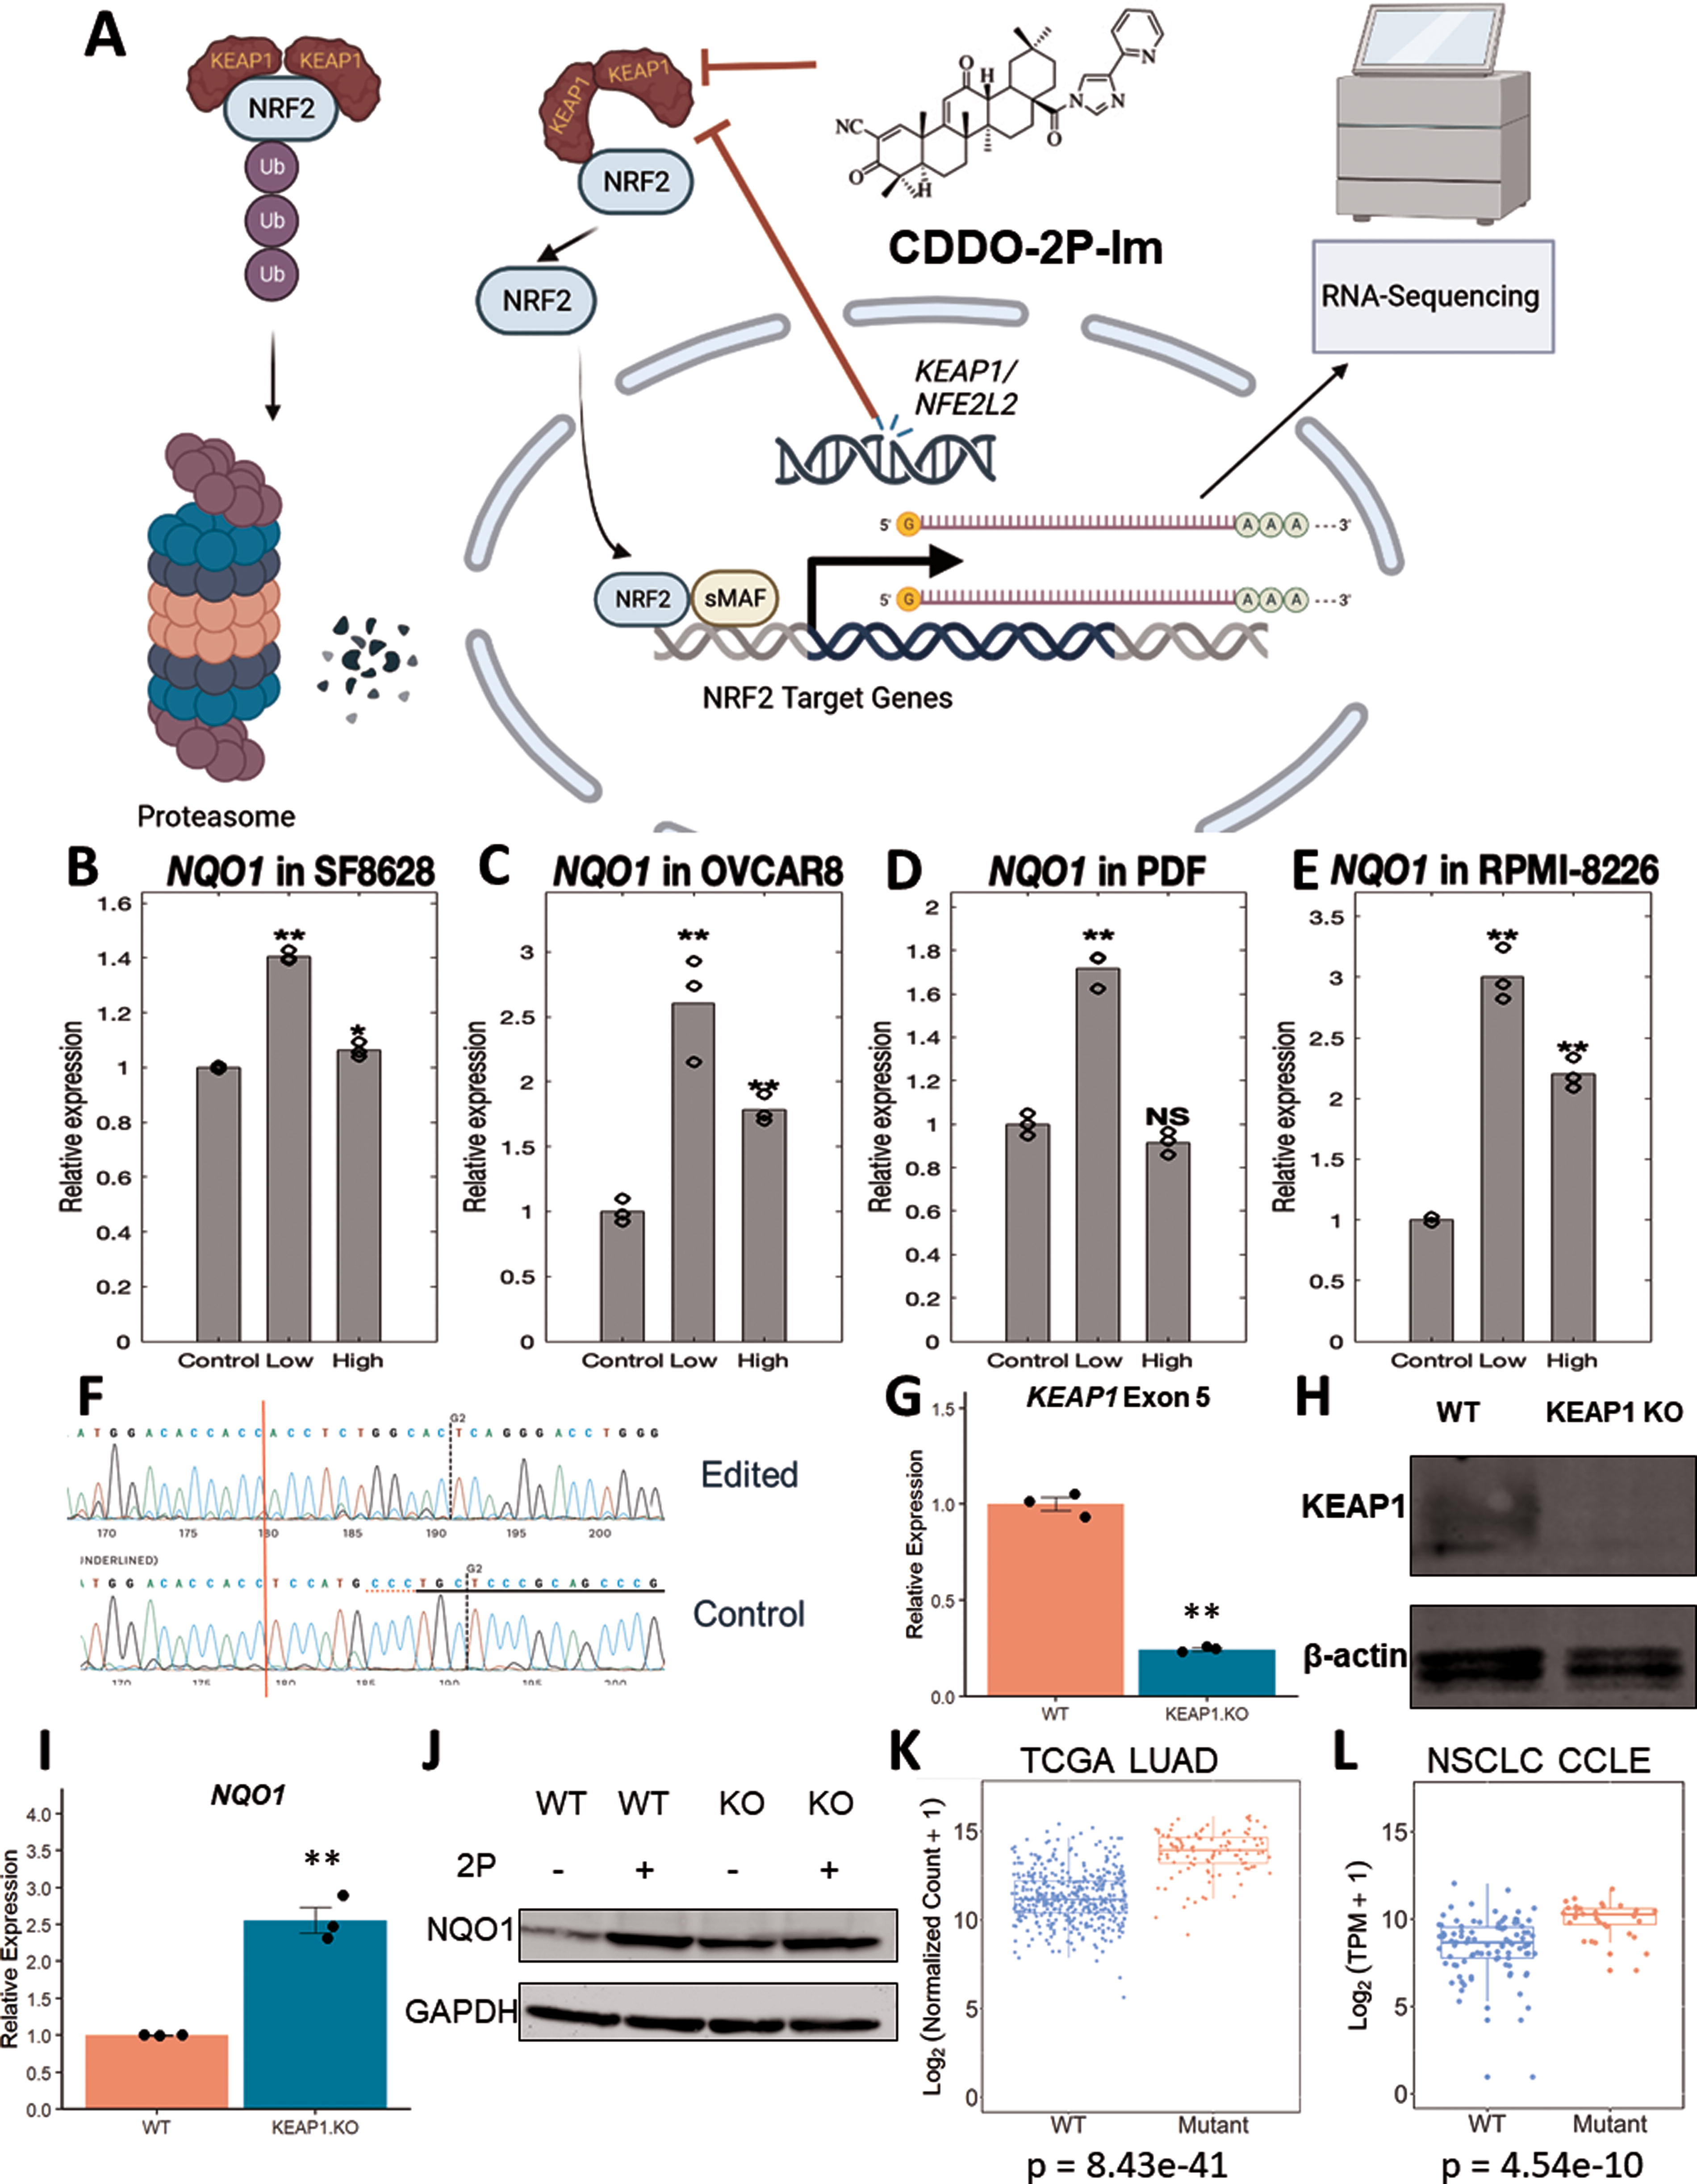
We also leveraged the available public databases of the Cancer Cell Line Encyclopedia (CCLE) (Cancer Cell Line Encyclopedia Consortium. Genomics of Drug Sensitivity in Cancer Consortium, 2015) and TCGA tumor samples (Liu et al., 2018) to explore activation of NRF2. Approximately, 20% of non-small lung cancer cells (NSCLC) have mutations in KEAP1 or NFE2L2 (Shibata et al., 2008), which was also true in these datasets. After separating TCGA lung adenocarcinoma (LUAD) into WT and KEAP1/NRF2 mutated samples, we investigated the top differentially expressed genes (DEGs) of which NQO1 was among the top genes identified (Fig. 2K). We repeated the analysis for NSCLC cell lines found in the CCLE on DepMap (Tsherniak et al., 2017) and verified NQO1 was upregulated in the KEAP1/NRF2-mutated group (Fig. 2L). Furthermore, we confirmed ROS pathway activation, a key NRF2-related pathway, through gene set enrichment analysis (GSEA) for our RNA-Sequencing generated datasets (Supplementary Fig. S1). These datasets all demonstrate NRF2 activation in different cellular and molecular contexts which enables us to develop a more accurate and comprehensive perspective of NRF2 activation.
A core NRF2 transcriptional signature is present after NRF2 activation
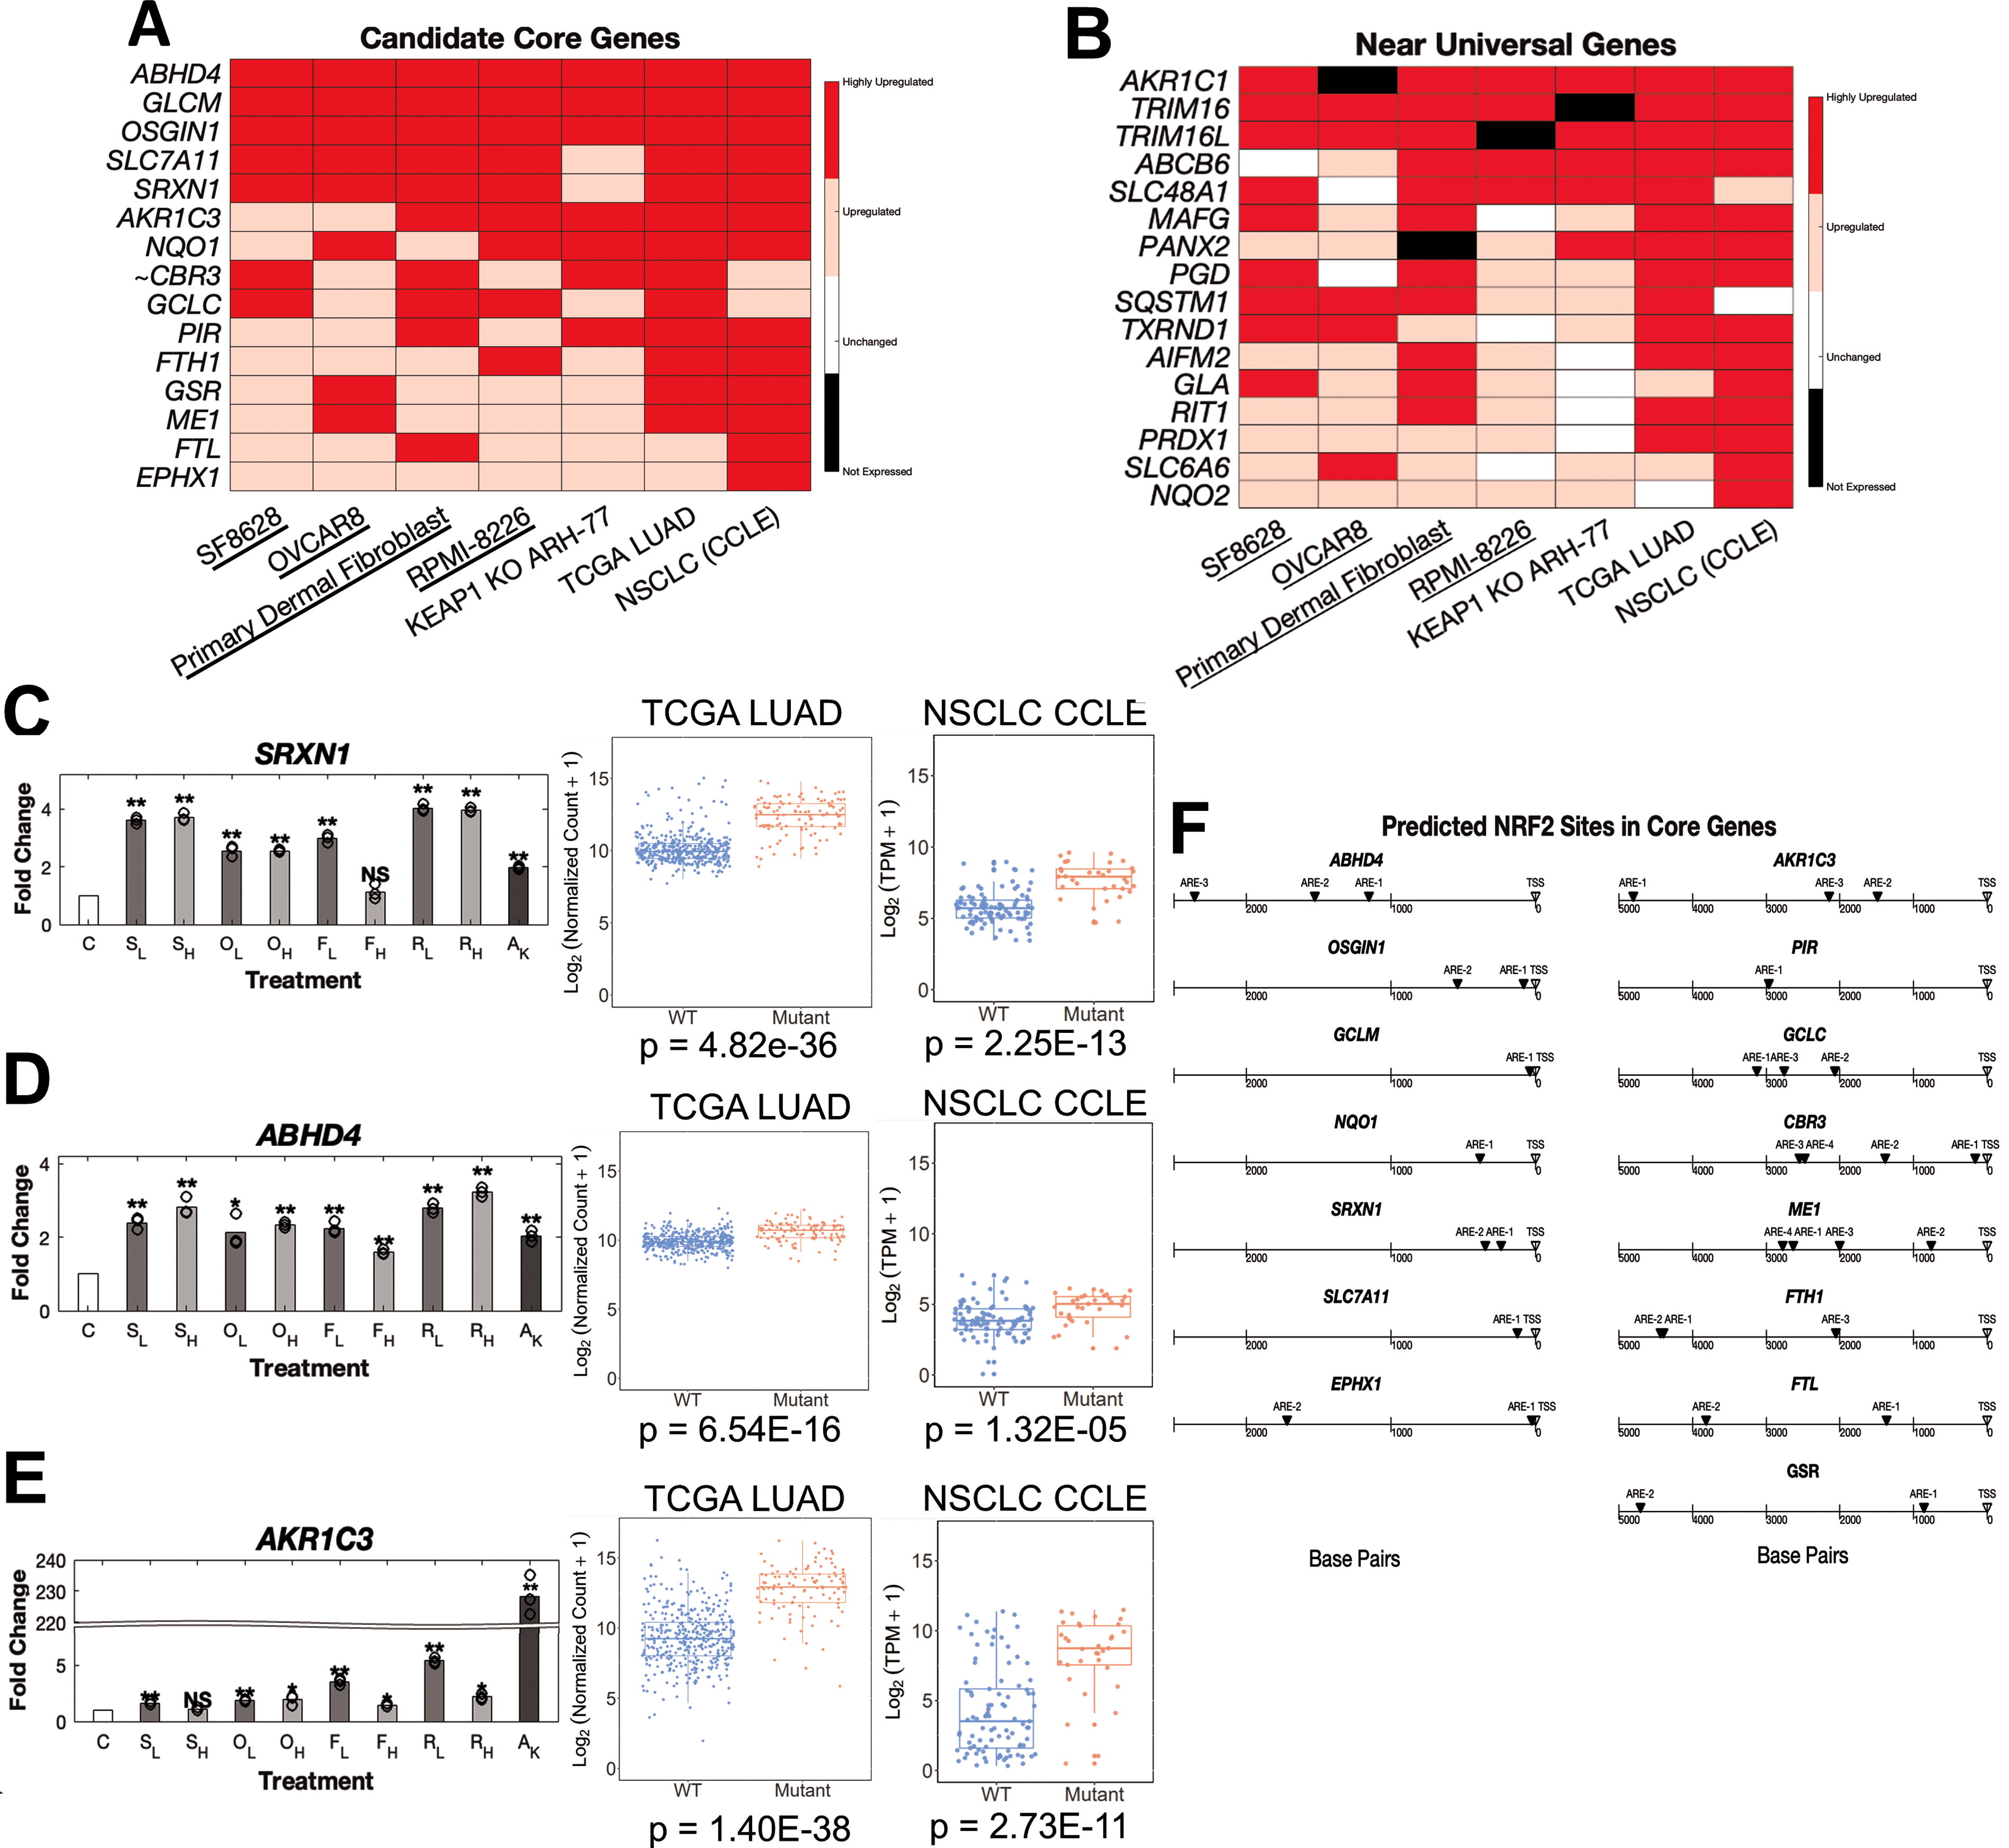
After we created different datasets of NRF2 activation, we investigated the most frequently upregulated targets of NRF2 activation, a list of 15 candidate core NRF2 genes (Fig. 3A and Supplementary Table S1). In addition, many other genes were upregulated in most scenarios of NRF2 activation (Fig. 3B and Supplementary Tables S2–S10). These candidate core NRF2 genes such as NQO1, GCLC, GCLM, and SRXN1 have been well-documented as NRF2 target genes in the literature and CHIP-Seq datasets (Supplementary Fig. S2). Interestingly, we noticed most of these core genes, such as ABHD4 and SRXN1, showed similar upregulation across all cell types and methods of NRF2 activation (Fig. 3C–D and Supplementary Fig. S3). However, AKR1C3 and other members of the AKR1C family displayed considerably higher activation in genetic models of NRF2 activation compared to short-term drug-induced activation (Fig. 3E, Supplementary Fig. S4, and Supplementary Tables S1–S3). Another interesting observation is that higher concentrations of drug does not always equal higher activation of NRF2 target genes. This appears to be somewhat cell line dependent and gene specific as other core NRF2 genes show elevated upregulation at high doses (Supplemental Fig. S3J–S3K). We also used an in silico model of motif binding, LASAGNA-Search 2.0, to identify NRF2-ARE (Antioxidant Response Element) sequences near the promoters of these core and nearly universal NRF2 genes (Fig. 3F and Supplementary Fig. S5A). This analysis combined with previously published NRF2 CHIP-Seq datasets suggests that NRF2 directly binds to promoters of these core genes and directly upregulated transcription, supporting their positions within an initial list of candidate core NRF2 target genes (Supplementary Fig. S2).
Defining conditionally upregulated and novels target genes of NRF2 activation
Besides finding the most frequently upregulated genes, we examined if certain genes were specifically activated in one condition or another (Fig. 4A). We found certain genes such as HMOX1 and AKIRIN2 which are primarily upregulated in drug-induced NRF2 activation but not present in either the TCGA LUAD or NSCLC cell lines (Fig. 4B and C), consistent with the literature (Chorley et al., 2012; Rooney et al., 2020). On the other hand, genes related to enzymes in the pentose phosphate pathway (G6PD, TKT, TALDO1, and PGD) were consistently upregulated in the genetically activated NRF2 models but infrequently in the drug-induced models (Fig. 4D–G). However, this may be owing to the relatively short duration of drug exposure. The pentose phosphate pathway is of particular importance as it is thought to help protect cells from oxidative stress and apoptosis (Patra and Hay, 2014).
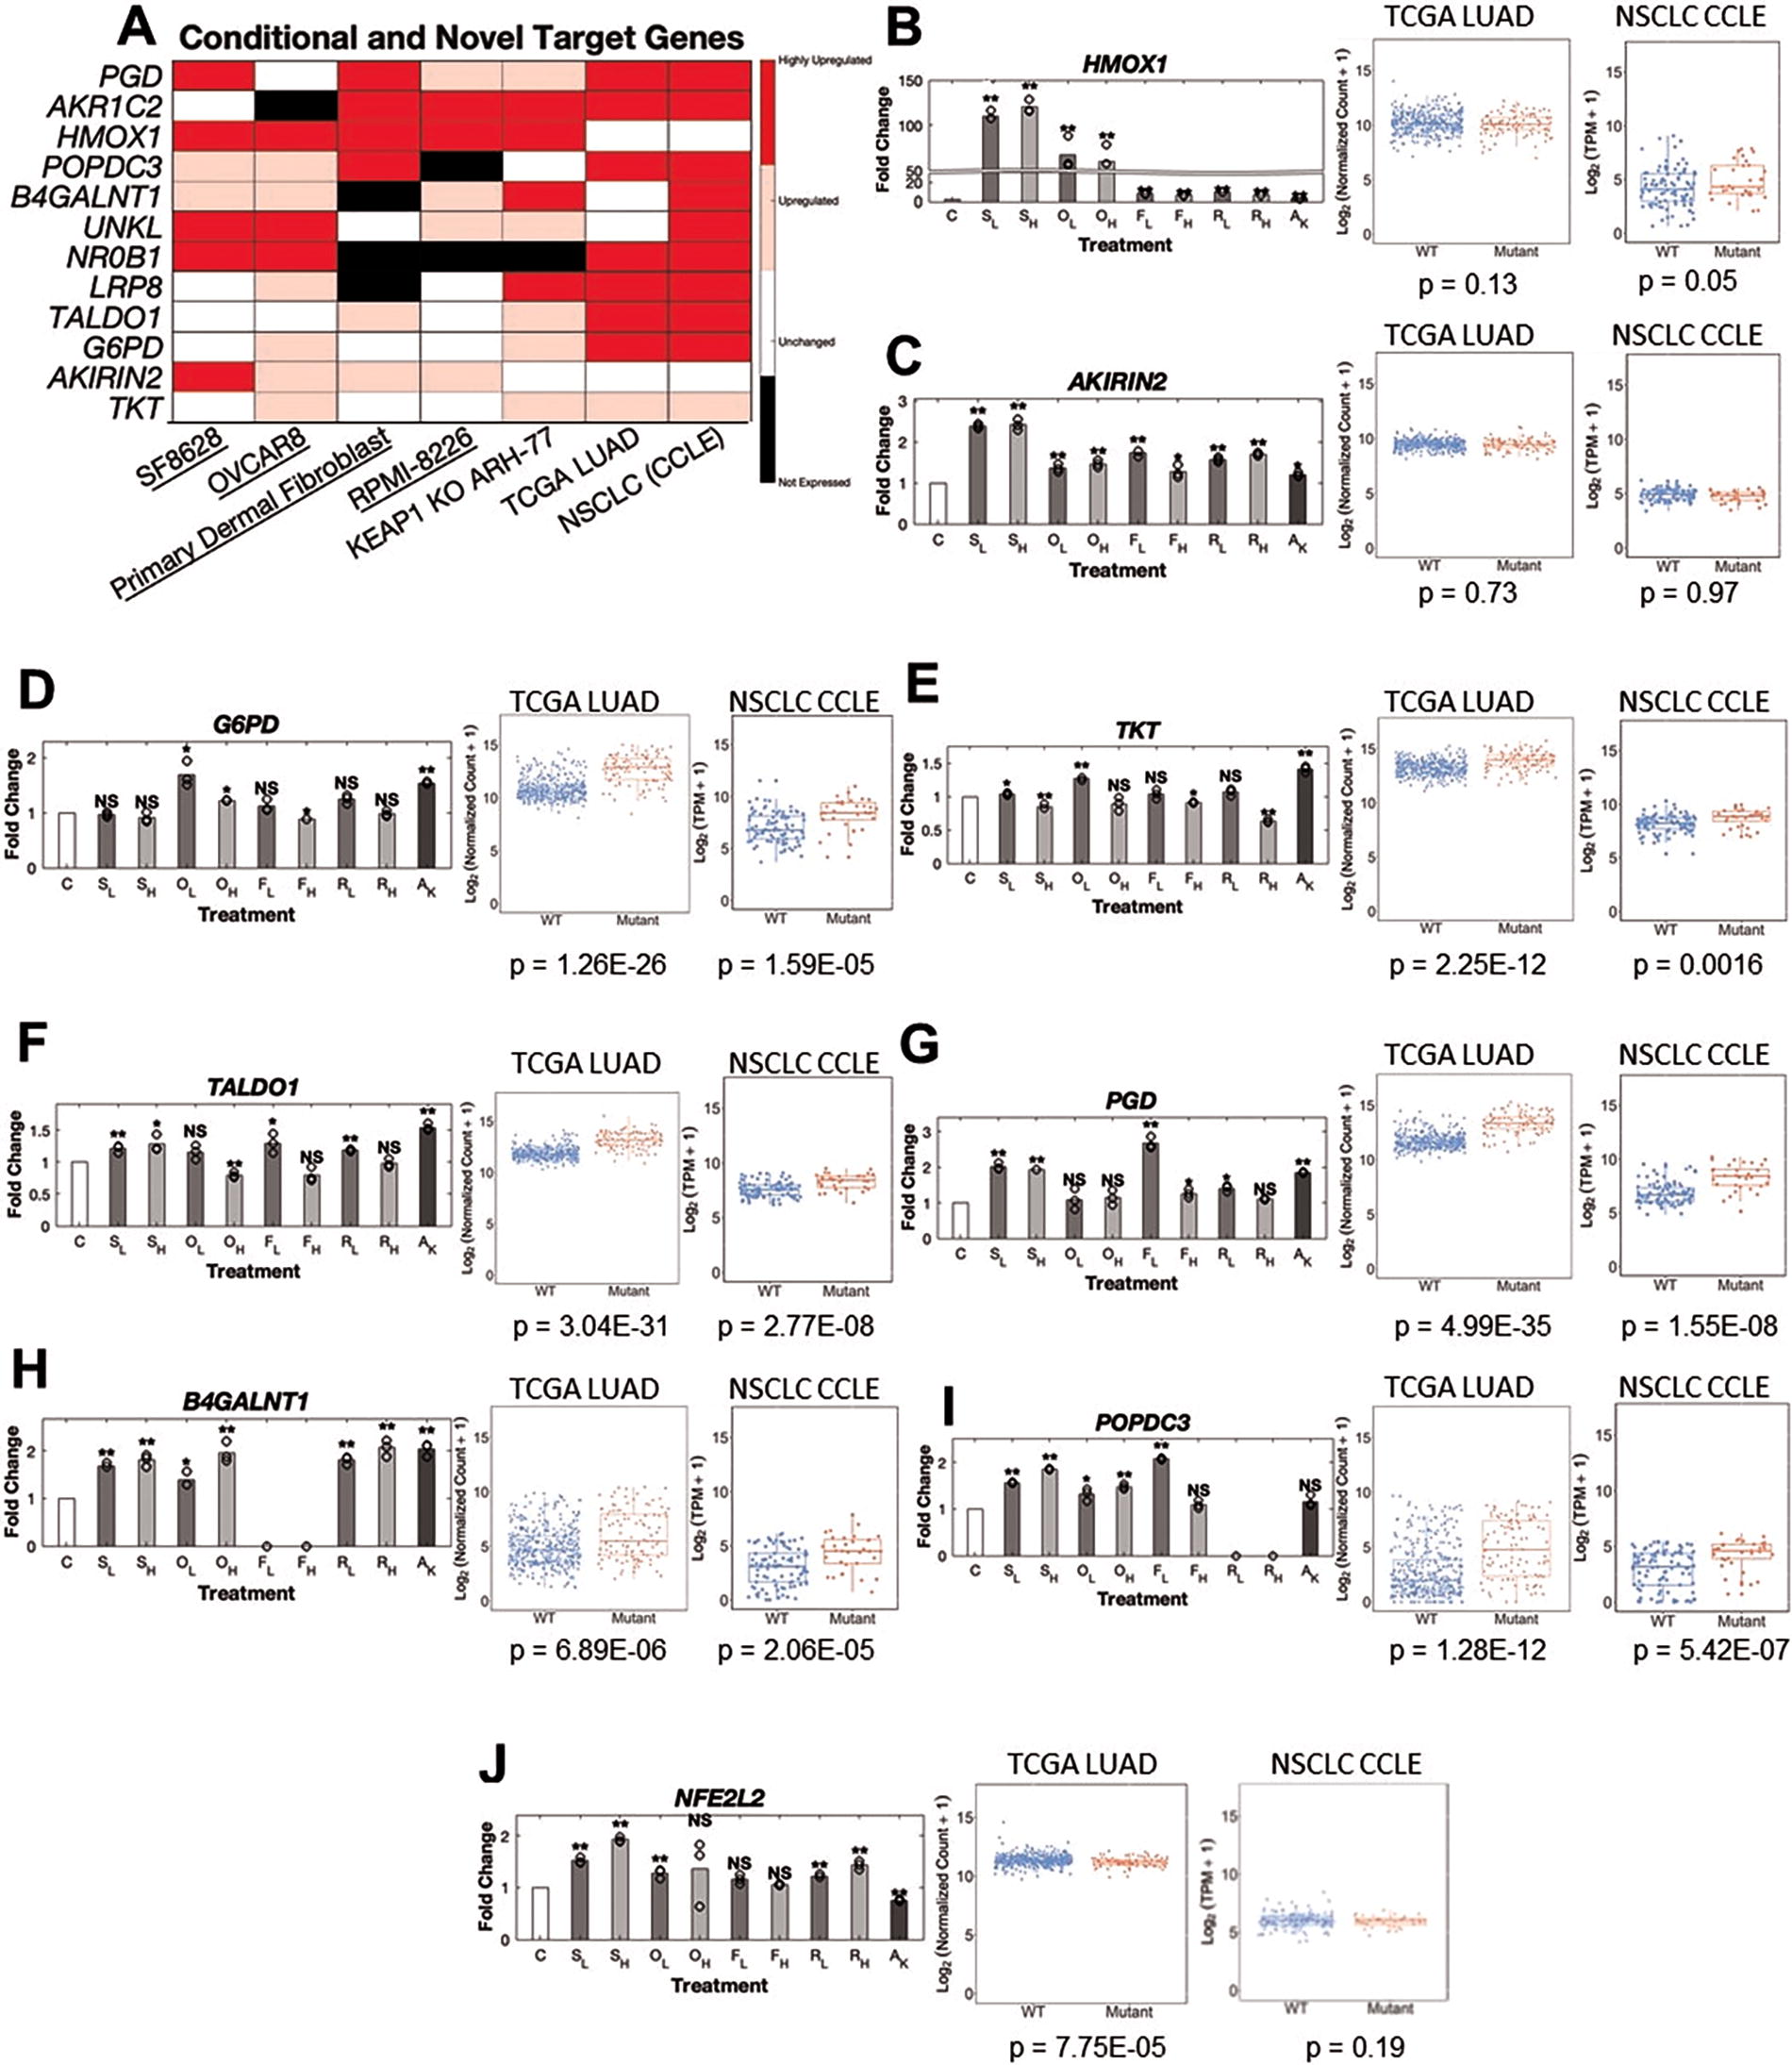
We also uncovered two putative novel NRF2 target genes that are upregulated in most of our models, B4GALNT1 and POPDC3 (Fig. 4H–1). We found a putative NRF2/ARE motif near the promoter of B4GALNT1 though not for POPDC3 (Supplementary Fig. S6E). Although some reports suggested NFE2L2 gene expression is elevated by NRF2 activity (Kwak et al., 2002), we find that NFE2L2 expression is not consistently representative of NRF2 activity (Fig. 4J). Finally, we also found novel downregulated genes (PLAT, CDC42EP1, EVA1A) in our models of NRF2 activation but these genes were not always downregulated or expressed (Supplementary Fig. S6B–S6D). NRF2 has been reported to interfere with transcriptional regulation of proinflammatory cytokines such as IL-6 and IL-1B (Kobayashi et al., 2016), but we did not investigate immune cells in these experiments. Nevertheless, we observed decreased expression of immune-related genes such as CXCL6 and CXCL1 in TCGA LUAD and KEAP1 knockout ARH-77 cells supporting the anti-inflammatory effects of NRF2 activation (Supplemental Fig. S7A–S7D). Because synthetic triterpenoids such as CDDO-2P-Im also inhibit NF-κB (Ahmad et al., 2006), it is difficult to comment on the effects of drug-induced NRF2 activation on inflammation, although suppression of inflammatory markers is observed.
Validation of the core NRF2 gene set in other published datasets
Although we believe our core NRF2 gene set can faithfully represent NRF2 activity, we needed to validate its utility in other contexts of NRF2 activation. For this, we tested other TCGA cancers which had considerable NRF2/KEAP1 mutations. We found lung squamous cell carcinoma (LUSC), head and neck squamous cell carcinoma (HNSC), and liver hepatocellular carcinoma (LIHC) to have significant numbers of mutations in NRF2/KEAP1. We found that both LUSC and HNSC validated all our core and nearly universal NRF2 gene set (Fig. 5A–B and Supplementary Fig. S8A–S8B). However, LIHC only validated 12/15 core NRF2 genes and 10/16 of the nearly universal NRF2 gene set (Fig. 5C and Supplementary Fig. S8C), likely owing to a lower number of NRF2/KEAP1 mutations.
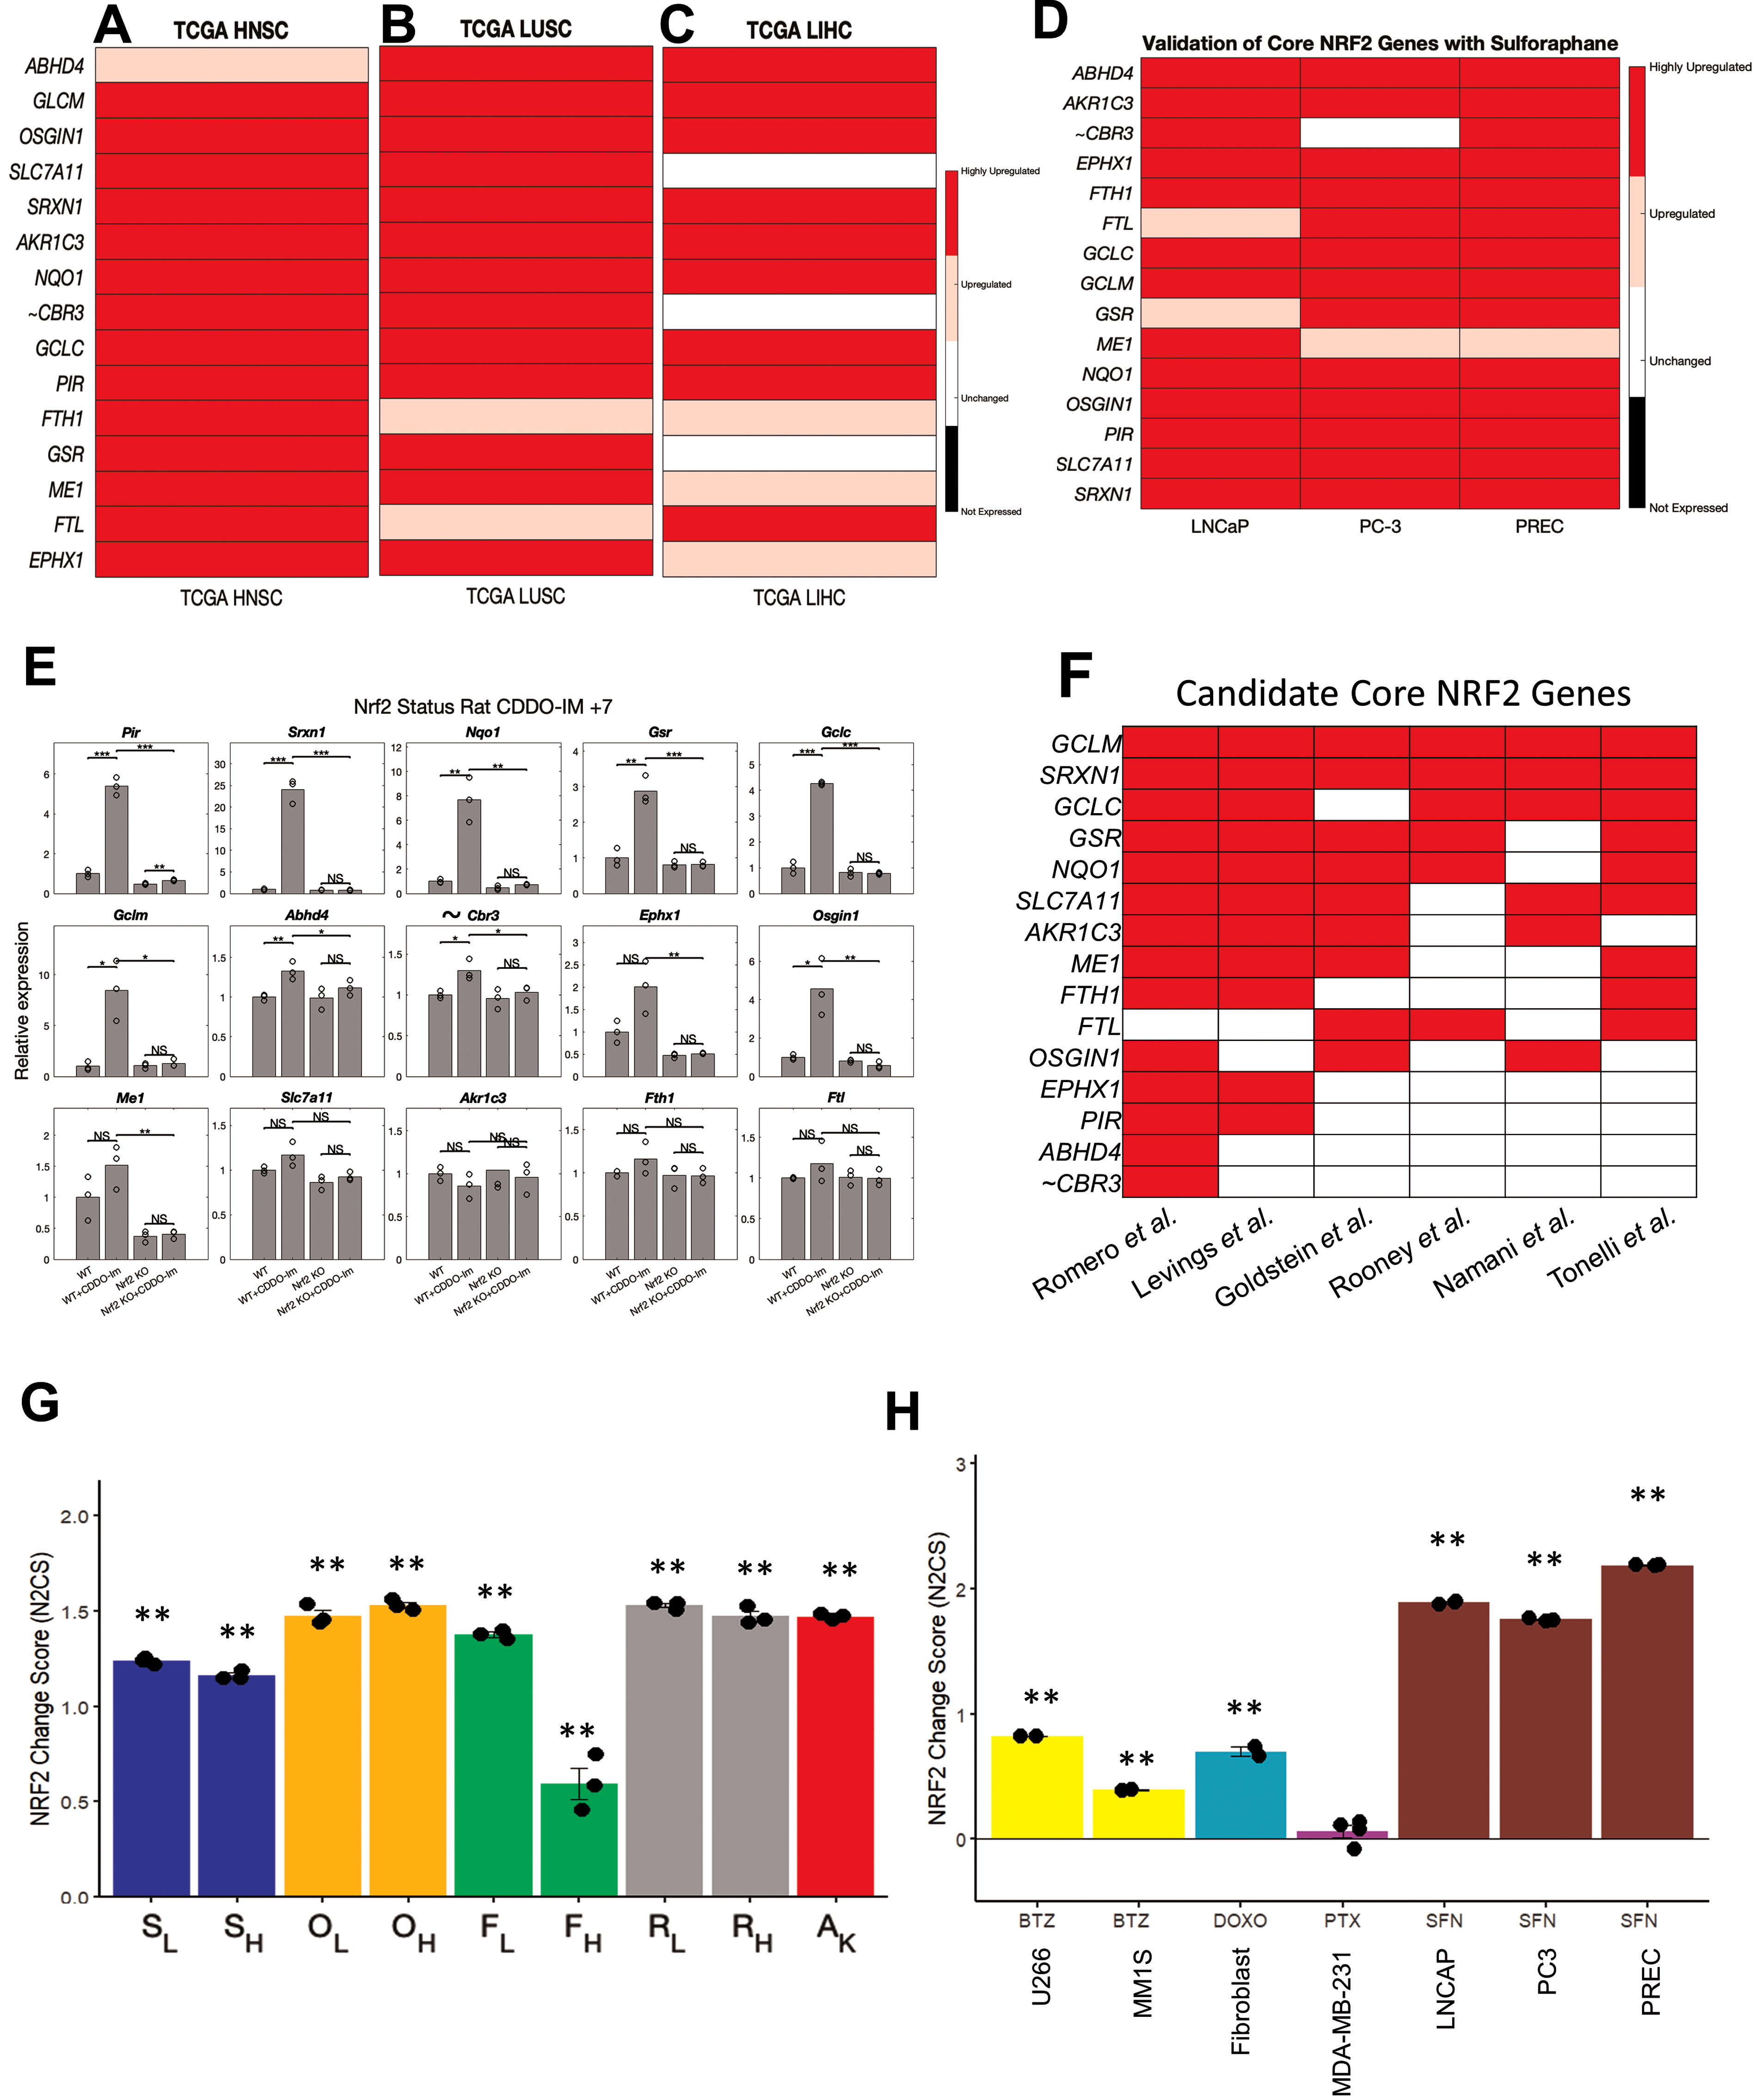
We selected two published studies (Beaver et al., 2014; Taguchi et al., 2016) to investigate the validity our NRF2 gene set in other datasets and publications. First, in three different prostate cell lines treated with sulforaphane by Beaver et al., we found upregulation of 14/15 of the candidate core NRF2 gene and 10/16 of nearly universal NRF2 genes (Fig. 5D and Supplementary Fig. S8D). carbonyl reductase 3 (CBR3) was the only NRF2 gene in our initial core set that did not pass multiple validation sets, so we chose to omit CBR3 from the final core NRF2 gene signature. Overall, these two different validations strongly demonstrate the validity and versatility of our 14 core NRF2 gene set in human tissues.
In the rat model of NRF2 gene deletion by Taguki et al., two different germline NRF2 KO mutations were generated and used to investigate NRF2-dependent gene expression changes (Taguchi et al., 2016). Mice were divided into the following groups and treated with vehicle or NRF2 activator, CDDO-Im: WT + vehicle, WT + CDDO-IM, NRF2 KO + vehicle, NRF2 KO + CDDO-Im. We found that the majority of core NRF2 target genes were upregulated by CDDO-Im treatment but unchanged in the setting of NRF2 gene deletion (Fig. 5E and Supplementary Fig. S8E). However, other genes (OSGIN1, SLC7A11, ME1, FTH1, FTL) showed a similar trend of activation following CDDO-Im treatment but did not reach significance in every case. Finally, we observed that AKR1C3 did not display any trend suggesting NRF2 dependency which is similar to literature reports that AKR1C genes are not homologous between human and mice (Veliça et al., 2009). We also performed analysis with the nearly universal NRF2 gene set, finding most exhibited a trend suggesting NRF2 dependency (Supplementary Fig. S8F and S8G). Therefore, we believe our core NRF2 gene set can also work for rodent models, with a few adjustments for genes known to be nonhomologous.
Finally, we compared our core NRF2 gene set with previously published gene sets from six studies (Goldstein et al., 2016; Levings et al., 2018; Namani et al., 2018; Romero et al., 2017; Rooney et al., 2020; Tonelli et al., 2018). Overall, every single core NRF2 gene was a part of previous NRF2 gene sets with eight genes (GCLM, SRXN1, GCLC, GSR, NQO1, SLC7A11, AKR1C3, ME1) that were a part of four of more out of the six NRF2 gene sets examined (Fig. 5F). Despite our core gene set having the fewest number of genes of these gene set, the majority of overlapping genes from at least four of six previous NRF2 gene sets were present in our core gene set (Supplementary Table S11). Our nearly universal NRF2 gene set contain a mix of genes that were present in multiple previous gene sets, only one previous gene set, or not found in any of these previous gene sets (Supplementary Fig. S8H). Thus, our core NRF2 gene set contains most of the common features of previous NRF2 gene sets while being fewer but still applicable to the many settings examined. We also use the STRING database of protein-protein association (Szklarczyk et al., 2023) to analyze our NRF2 gene set to understand the relevant networks of biological processes and functions (Supplementary Fig. S8I). We found a significant number of interactions between the NRF2 core genes supporting their biological connection. In particular, the strongest enrichments were response to oxidative stress and oxidoreductase activity, consistent with the function of NRF2 pathway.
Next, we introduce the N2CS, which is a useful measure of drug or genetic effects on NRF2 activity. Using gene expression changes of the 14 core NRF2 genes (ABHD4, AKR1C3, EPHX1, FTH1, FTL, GCLC, GCLM, GSR, ME1, NQO1, OSGIN1, PIR, SLC7A11, SRXN1), we can approximate the degree to which NRF2 is changed with scores above 1 suggesting high activation with a score of 0 as the baseline (See Methods for calculations). We demonstrate the utility of the N2CS in the various conditions in which we examined the response to CDDO-2P-Im in our study, in the KEAP1 knockout, in the response to sulforaphane from validation studies, as well as in the response to other anti-cancer agents from published datasets (Fig. 5G and H). Interestingly, we also noticed that higher concentrations of CDDO-2P-Im do not further activate NRF2 which is also the case with other NRF2 activators (Copple et al., 2014). We found that both bortezomib and doxorubicin induce NRF2 activation (Fig. 5H), consistent with literature (Songbo et al., 2019; Weniger et al., 2011), but paclitaxel does not significantly affect NRF2 activity. Thus, the N2CS can be used to screen or check RNA-Sequencing data for modulators of NRF2 activity.
NRF2 activity score correlates with resistance to radiation and certain drugs
Using the final core NRF2 target genes, we can also generate N2AS to represent the degree of NRF2 activation for individual cell lines and tumor samples. The N2AS is useful for comparing cells or samples of the same group for differences in NRF2 activation. In the following experiments, we demonstrate the utility of the N2AS.
The N2AS can be used to find whether specific non-conservative mutations in NRF2/KEAP1 affect NRF2 activity. We first used N2AS to rank all CCLE NSCLC cell lines in DepMap and investigated how mutation status of NRF2/KEAP1 was related to N2AS (Fig. 6A). While most mutations are associated with higher N2AS, we do observe several mutations are associated with medium or low N2AS, suggesting these mutations do not activate NRF2. Furthermore, we correlated N2AS with a functional output, sensitivity of oxidative stress-mediated drugs from the DepMap database (106). We found N2AS significantly correlated positively with resistance to 1-methyl propyl 2-imidazolyl disulfide (PX-12) and necrosulfonamide in NSCLC cells (Fig. 6B and C). Unsurprisingly, PX-12 has been previously demonstrated to induce apoptosis in an oxidative stress dependent manner (You et al., 2015) whereas necrosulfonamide has been linked to reacting with cysteines previously (Sun et al., 2012). These two drugs were among the top drug correlations with N2AS and we further validated this observation in our KEAP1 knockout cell line (Fig. 6D and E and Supplementary Table S12). We also tested correlation with individual NRF2 core genes and our gene set had a higher correlation than any single gene and as high correlation as other published NRF2 gene sets (Supplementary Fig. S9A–S9B). Although radiation is not in the database, we also tested if NRF2 activation would lead to resistance against radiation (Fig. 6F). Our findings confirmed radio resistance associated with NRF2 activation, and other studies report similar findings (Guan et al., 2023). Interestingly, we also observe enhanced colony formation with KEAP1 knockout in ARH-77 cells (Supplementary Fig. S9C–S9E), a cell line with poor colony formation efficiency (Drewinko et al., 1984).
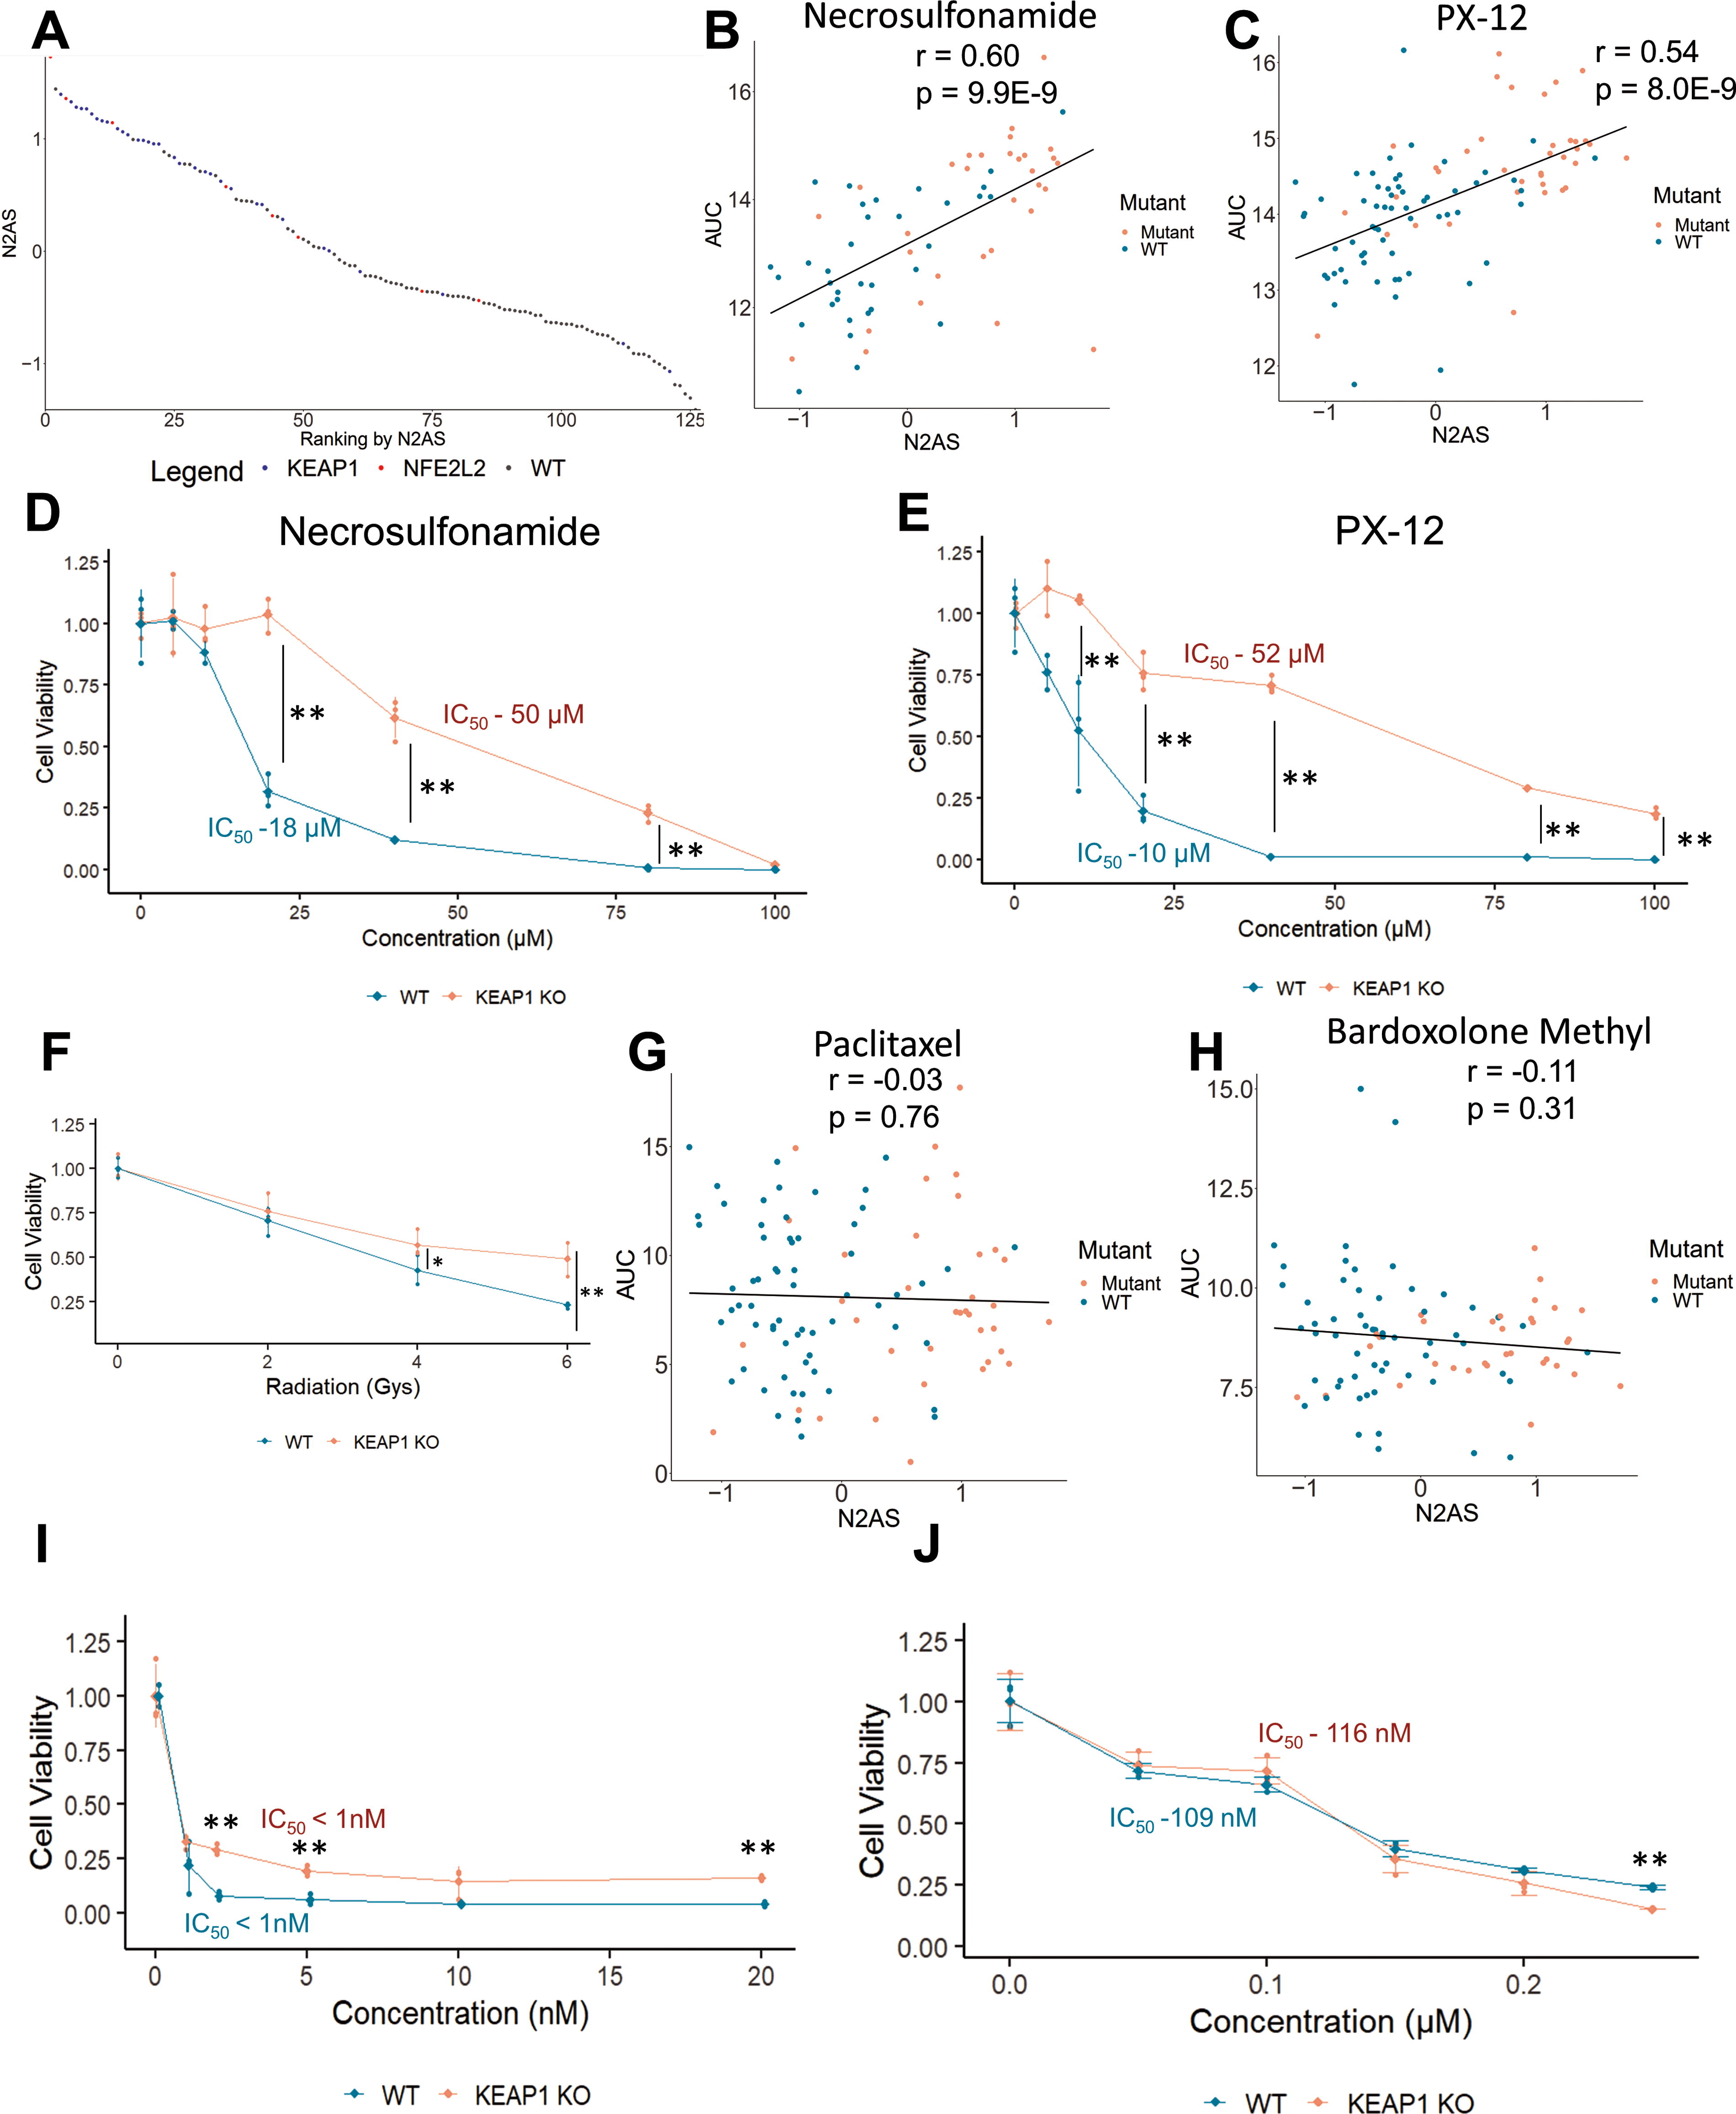
We also investigated drugs that were not correlated with the N2AS (Supplementary Table S12). We found both paclitaxel and bardoxolone methyl, a synthetic oleanane triterpenoid, to have little correlation with N2AS (Fig. 6G and H). We then tested both drugs in our cell lines and found the resistance of KEAP1 knockout cells to paclitaxel and bardoxolone methyl was absent in comparison to resistance to both PX-12 and necrosulfonamide (Fig. 6I and J). This suggests that our modeling of NRF2 activity and drug resistance is appropriate and can predict relative resistance mediated by NRF2 for drugs in the DepMap Cancer Therapeutics Response Portal (CTRP2) database.
NRF2 activity is associated with poor prognosis in a variety of cancers
Although there have been many studies linking mutations causing NRF2 activations to chemoresistance and poor clinical outcomes, many of these previous studies were concentrated on advanced stage patients with small sample sizes (Solis et al., 2010; Takahashi et al., 2010). Recently, a large study found KEAP1 mutations were associated with a worse prognosis, confirming the clinical importance of NRF2 activation in NSCLC (Saleh et al., 2022). However, despite this finding, mutation stratification alone is not significantly associated with prognosis difference in TCGA LUAD or LUSC datasets (Supplementary Fig. S10A and S10B). We believe this observation can be in part explained by our analyses of cell lines that not all mutations of NRF2/KEAP1 are equal and should be evaluated individually.
By using the N2AS to help categorize patients, we investigated whether our N2AS had prognostic significance in 22 different TCGA cancers (Fig. 7A). During the training, we focused on finding an appropriate N2AS cutoff for each cancer and a highly significant p value (p < 0.01). We found 12 cancers passed training and 10 cancers did not pass training which suggests these 10 cancers do not have significant prognosis associated with NRF2 (Supplementary Fig. S11). Of the 12 cancers that have potential prognosis significance associated with NRF2 activity, 10 had a poor prognosis associated with higher N2AS while Uterine Corpus Endometrial (UCEC) and Ovarian cancers had favorable prognosis associated with higher NRF2 activity (Fig. 7B and Supplementary Fig. S12A–S12D). Under further examination, PTEN mutation is a common feature in UCEC and is associated with both NRF2 activation and a favorable prognosis (Supplemental Fig. S12C) (Risinger et al., 1998; Rojo et al., 2014). PTEN inactivation can directly lead to higher NRF2 activation and thus may be simultaneously driving both NRF2 activity and a favorable prognosis.
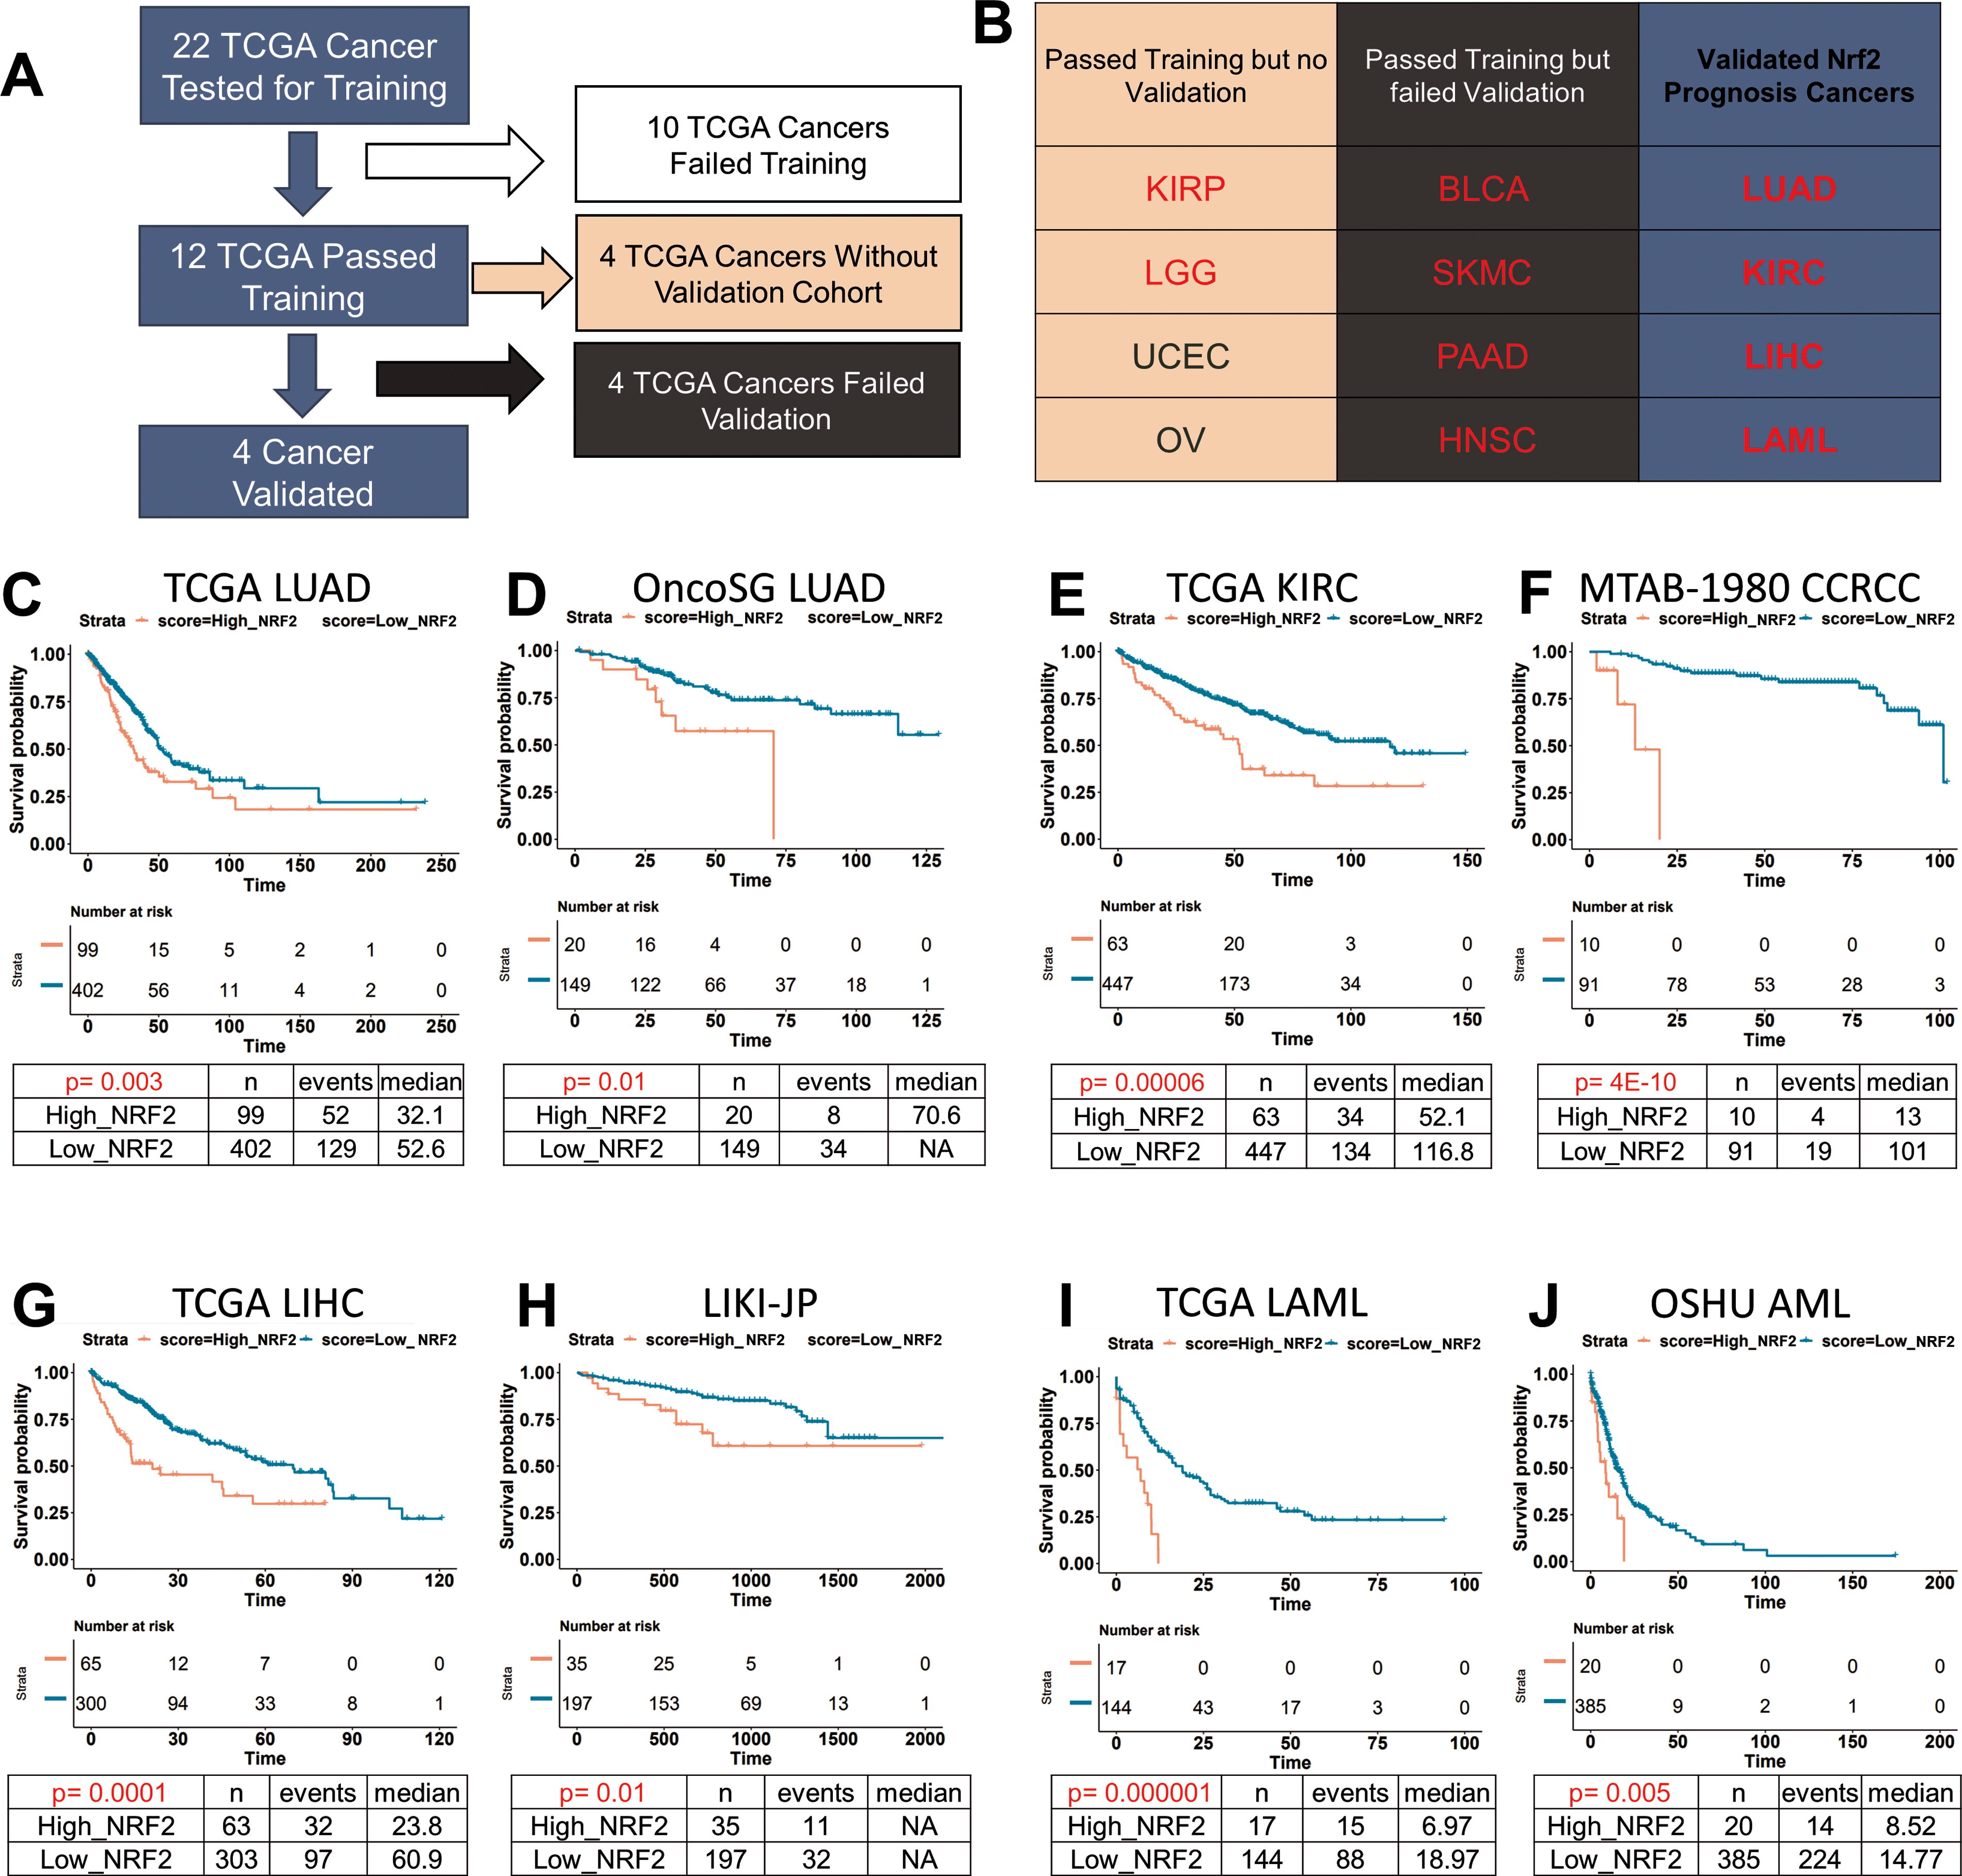
To help analyze the categorization and significance of the N2AS in training and validation, we developed LOCC (Luo’s Optimization Categorization Curve) which visualizes all hazard ratios (HR) and p values of all possible cutoffs (Luo and Letterio, 2023). This method allows us to understand the selection of the cutoff while also understanding if there are other possible windows for categorization. Using this method on LUAD, we first locate cutoffs that are highly significant, where the yellow line, representing the –log (p value), is above the red line (representing a p value of 0.01) (Supplementary Fig. S13A). At this cutoff, the black line reveals the HR (the red line simultaneously represents an HR of 1). The x-axes of both graphs are lined up such that the sample distribution of N2AS can be visualized. The highest yellow peak is the most significant p value and is in most cases, the ideal cutoff point. After choosing a N2AS cutoff of 0.463 for LUAD, the N2AS is finalized for the training and a Kaplan–Meier Curve can be generated with appropriate additional calculations (HR: 1.63, p < 0.01, Fig. 7C).
Using published East Asian cohort of LUAD (OncoSG) (Chen et al., 2020), we applied the previous N2AS cutoff to test if it can stratify patients into prognostic significant groups (Supplementary Fig. S13B). Indeed, we found higher NRF2 activity was associated with a worse prognosis (HR: 2.60, p: 0.01, Fig. 7D). Using LOCC, we observed the cutoff was highly significant and that the cutoff was appropriate despite using a very different patient population as well as a drastically lower percentage of patients with NRF2/KEAP1 mutation (Supplementary Fig. S10E). These results demonstrate that N2AS could be used as a prognostic gene signature for LUAD in various cohorts even in the absence of NRF2/KEAP1 mutations.
Following the validation for LUAD, we used other public databases to validate N2AS prognostic values for other cancers (Supplementary Fig. S13C–S13H). Through the same methods of optimizing cutoffs, we were able to successfully validate N2AS prognostic value in renal clear cell carcinoma (KIRC, Fig. 7E and F), LIHC (Fig. 7G and H), and acute myeloid leukemia (LAML, Fig. 7I and J). For all three cancers, we found high NRF2 activity was associated with lower overall survival (KIRC HR – 2.12, p < 0.001, LIHC – 2.16, p < 0.001, LAML – HR 3.87, p-0.001). Previous studies in small cohorts have found high NRF2 levels is associated with poor prognosis in liver and renal cancers but have not been validated in larger cohorts using gene expression data (Yuki et al., 2018; Zhang et al., 2015).
We also tested validation in HNSC, pancreatic adenocarcinoma, melanoma, and bladder carcinoma. Although these cancers passed training, they showed no significant poor prognosis correlated with N2AS in the validation cohort (Supplementary Fig. S14). For other TCGA cancers that passed training without validation, there was not a large suitable publicly available cohort to test. Finally, we used other NRF2 gene sets to compare if we would obtain similar prognostic results. We found that other NRF2 gene sets could obtain similar results in LUAD but not LAML (Supplementary Fig. S15), showing that our core NRF2 gene set is better suited toward a broader range of applications than those selected gene markers of NRF2 activity found in the existing literature.
Discussion
The KEAP1/NRF2 pathway plays essential but complex roles in the maintenance of metabolic homeostasis, regulation of the cellular redox state and in the modulation of the inflammatory response (Dinkova-Kostova et al., 2018; Ma, 2013; Saha et al., 2020). These activities contribute to neuroprotection in the context of neurodegenerative disease (Uruno and Yamamoto, 2023), and to the suppression of other chronic diseases affecting multiple organs including the liver and lung (Rangasamy et al., 2005; Tang et al., 2014). Many of NRF2 target genes play a role in the cell defense system against oxidative stress and disease and overlap with other networks such as vitagenes, a group of genes involved in preserving cellular homeostasis during stressful conditions (Calabrese et al., 2010; Concetta Scuto et al., 2019). Future research may investigate which specific NRF2 target genes are vitagenes and which are not directly involved in mitigating cellular stress (Scuto et al., 2021).
Increasing evidence linking constitutive NRF2 activity to therapy resistance in cancer highlight the challenges that have influenced the clinical development of activators of this pathway (Dinkova-Kostova and Copple, 2023). In our study, we define a core NRF2 target gene set as well as several databases of NRF2 activations that will aid preclinical efforts designed to clarify the context-dependent roles of NRF2 in health and disease and to define appropriate clinical indications for therapeutics targeting the KEAP1/NRF2 complex. We rigorously applied our core NRF2 gene set through NRF2 activation validation studies, drug resistance modeling with further validation, and finally cancer prognosis with validation in multiple patient cohorts. During this process, we also utilized other published gene sets for comparison and found that while some could perform in certain situations, none were as useful for clinical prognosis. This discrepancy is likely because of the high noise from conditional or non-NRF2 target genes. While our core NRF2 gene set may not be perfect for all applications, it is a solid foundation as a gene signature that can be used in a variety of settings for the assessment of NRF2 activity.
While cancer research has become increasingly focused on defining the unique genetic alterations that characterize distinct and often rare tumor histology, we believe it is imperative to understand the commonality between groups as the latter may be informative regarding therapeutic resistance. Although NRF2 has been studied in many cancer contexts, particularly in NSCLC (Romero et al., 2017; Singh et al., 2006) and HNSC (Guan et al., 2023; Namani et al., 2018), we observe the same principal target genes are upregulated in nearly all human cancer cells and that drug resistance modeled in NSCLC can be validated in a B cell model. Furthermore, our investigation of cancer prognosis demonstrates that in our successful training and validation, the trend is that high NRF2 activity is associated with a poor prognosis. As such, our understanding of NRF2 targets and drug resistance may not be limited to the cancers we validated but to many others which may have a larger impact on our understanding of therapeutic efficacy and resistance. Furthermore, the literature of chemoresistance mediated by NRF2 not only directly applies to cancer resistance but also to prevention of toxicities by these agents (Sharma et al., 2020). Therefore, a broad application of precision medicine and NRF2 targeting can be investigated in the future.
The literature has described many instances of chemoresistance by NRF2 (Sporn and Liby, 2012; Wang et al., 2008), but we demonstrate that not all chemoresistance by NRF2 activation is comparable. Furthermore, strategies designed to repress, knock down, or completely delete NRF2 gene expression may have very different effects on drug resistance when compared to activation of NRF2. Moreover, if NRF2 acts to protect both normal and transformed cells, it will be imperative to design strategies that obviate the effect of NRF2 specifically in tumor cells, as global repression of NRF2 will most certainly increase side effects and toxicities associated with chemotherapy and. radiation therapy. Interestingly, the pentose phosphate pathway activated by constitutive NRF2 activation may be a targetable option. Multiple studies have demonstrated CB-839 (Telaglenastat), a glutaminase inhibitor, can inhibit cancer cells with high NRF2 activity better than those without high NRF2 activity (Ding et al., 2021; Galan-Cobo et al., 2019; LeBoeuf et al., 2020; Wang et al., 2008). Although this may represent an exploitable “flaw in the protective armor” that NRF2 provides cancer cells, in the absence of a clear NRF2 biomarker, this may not have a large clinical benefit. Thus, it is not shocking that CB-839 recently failed a clinical trial in renal cell carcinoma, a cancer in which NRF2 activation may play a significant role in prognosis, given the lack of a clear biomarker to select patients for whom the drug would have potential clinical benefit (Brown, 2022; Tannir et al., 2022).
There are still many important questions to address before an N2AS can be used as an indicator for therapy. Many anticancer drugs can activate NRF2 through ROS generation, but this acute NRF2 activation is clearly different from the constitutive NRF2 activation observed with genetic mutations. We showed a short-term exposure to NRF2 activators will upregulate many core NRF2 targets similarly but other genes such as AKR1C3, G6PD, PGD, TKT, TALDO1 exhibit much stronger upregulation in the genetic models. Furthermore, synthetic oleaneane triterpenoids (SOTs), which activate NRF2 but also have anticancer properties (Liby and Sporn, 2012), synergize with several anticancer agents (Chauhan et al., 2004; Luo et al., 2023). The latter likely reflects the fact that these SOTs are multi-targeted agents, modulating the activity of NFκB, STAT3, mTOR and other key regulators of cancer cell growth and viability (Liby and Sporn, 2012). Given the likelihood that individual NRF2 target genes may exhibit time-dependent and bi-modal regulation, it is conceivable that therapy might be tailored such that different drugs regimens that exploit low NRF2 activity with oxidative stress-mediated therapy (drugs that have resistance correlated with N2AS) may be followed by therapeutics that are less affected by N2AS. Furthermore, we evaluated NRF2 solely as a transcription factor, to the degree in which gene expression was modified (Wang et al., 2015). We did not confirm or evaluate the protein levels of these upregulated genes in our models which may be affect by post-transcriptional modulators such as microRNA (Baek et al., 2008). As such, future research may investigate the degree and timing in which these transcriptional changes affect protein levels.
Our N2AS is a simple unweighted average of the z-scores of the core NRF2 target genes, which is both foundational and imperfect. We tried to be as comprehensive and unbiased in our searching for core NRF2 target genes and modeling of N2AS activity to find results. Even though we did not optimize the N2AS for any application, we were still able to find and validate significant results from drug resistance to cancer prognosis, suggesting that this pathway is critical for these outcomes. With a clear direction, we can optimize the analyses for each cancer with slightly different NRF2 target genes and used weighted scoring knowing that our fundamental goal is still the quantitation of NRF2 activation, which is validated. If we optimize using machine learning without knowing whether NRF2 activation is important, we may find significant differences, yet it may not be directly related to NRF2 activity, as many genes exhibit complicated transcriptional regulation orchestrated by distinct activators and repressors. Therefore, our simplistic N2AS is important though future research may investigate appropriate optimization with regards to each cancer’s context including population differences and multivariate analysis.
Finally, we ponder why a universal pathway that directly affects chemoresistance such as NRF2/KEAP1 is prognostic in only some cancers and not others. Even though our results are novel in finding NRF2 is prognostic for large cohorts of AML, LIHC, KIRC, and possibly other cancers, there are still many questions as to why we observed this effect in these cancers specifically. For most cancers which were either validated or promising candidates, we found a skewed distribution in which NRF2 activity was very high in certain patient samples. This also correlated with high numbers of mutations in those cancers related to NRF2/KEAP1. Yet, for LUSC, we do not observe any prognostic significance, similar to what has been shown in other studies investigating NRF2 in TCGA LUSC (Liu et al., 2020). Furthermore, while not all cancers rely on oxidative stress-dependent mechanisms, if therapy is dependent on oxidative stress or impaired by NRF2 activity, then surviving cancer cells would likely have a selection pressure favoring NRF2 activation. However, such an escape mechanism may not be found using bulk RNA-seq and even be difficult to discern with single cell RNA-seq. It may be discovered through sequential RNA-Sequencing of initial and relapsed tumor samples in therapies that significantly favor NRF2 activation, a phenomenon which has been demonstrated in breast cancer (Fox et al., 2020). As such, there is still a need for research to be done in many cancers regarding the potential role of NRF2 in affecting outcomes.
Methods
Electronic lab notebook
Electronic laboratory notebook was not used.
Cell lines
SF8628 (RRID:CVCL_IT46), OVCAR-8 (RRID:CVCL_1629), RPMI-8226 (RRID:CVCL_0014), ARH-77(RRID:CVCL_1072), and primary dermal fibroblast cells were all purchased from American Type Culture Collection (ATCC). Cells were tested negative for mycoplasma with ABM Mycoplasma PCR detection kit (catalog # G238) in February 2023. Cancer cell lines were authenticated using short tandem repeat profiling at the Case Western Reserve University genomic facility.
Cell treatment for RNA analysis
Cells were treated either with a control of media plus DMSO (1%) or with CDDO-2P-Im (gift from Dr. Michael Sporn, 96.3% purity by HPLC) for 6 h in 6 well plates before RNA extraction (PureLink™ RNA Mini Kit, #12183018A, Thermo Fisher Scientific, Waltham, MA) at concentrations indicated in Supplementary Table S13. RNA was measured by Nanodrop (Thermo Fisher Scientific) and then sent to LC Sciences for RNA-Sequencing services.
RNA-Sequencing and qRT-PCR
A poly(A) RNA sequencing library was prepared following Illumina’s TruSeq-stranded-mRNA sample preparation protocol as previously described (Luo et al., 2023). RNA integrity was checked with Agilent Technologies 2100 Bioanalyzer. Poly(A) tail-containing mRNAs were purified using oligo-(dT) magnetic beads with two rounds of purification. After purification, poly(A) RNA was fragmented using divalent cation buffer in elevated temperature. Quality control analysis and quantification of the sequencing library were performed using Agilent Technologies 2100 Bioanalyzer High Sensitivity DNA Chip. Paired-ended sequencing was performed on Illumina’s NovaSeq 6000 sequencing system.
Cutadapt was used to remove the reads that contained contamination, low quality and undetermined bases (Kechin et al., 2017). Then sequence quality was verified with FastQC (RRID:SCR_014583). HISAT2 was used to map reads to the genome of ftp://ftp.ensembl.org/pub/release-96/fasta/homo_sapiens/dna/ (Kim et al., 2015). The mapped reads were assembled using StringTie (Pertea et al., 2015). The transcriptomes were merged to reconstruct a comprehensive transcriptome using perl scripts and gffcompare. After the final transcriptome was generated, StringTie and edgeR were used to estimate the expression levels of all transcripts (Pertea et al., 2015; Robinson et al., 2010). Additional RNA-Sequencing analysis was performed using GSEA (RRID:SCR_003199). RNA-Sequencing has been deposited to GEO (GSE228434, GSE221526, GSE229914, GSE229704, GSE229652).
Immunoblotting
Cells were lysed with cell lysis solution (#9803, Cell Signaling, MA) with protease and phosphatase inhibitor (A32961, Thermo Fisher Scientific) as previously published (Luo et al., 2023). Cell lysates were measured using bicinchoninic acid assay to measure protein concentrations and equal amounts of proteins were mixed with Nupage LDS sample buffer (NP0007, Thermo Fisher Scientific) according to manufacturer’s instructions. Samples were loaded into sodium dodecyl sulfate polyacrylamide gel electrophoresis gel, and then transferred to Polyvinylidene fluoride or polyvinylidene difluoride (PVDF) membranes (Catalog #IPFL00010 Millipore, MA), and incubated with blocking buffer (927–60001, Li-cor). Membranes were incubated with primary antibodies overnight at 4°C, washed three times with Tris-buffered saline with 0.05% Tween-20, and then with the corresponding secondary antibody for 1 hour at room temperature. Membranes were washed 3 times with Tris-buffered saline with 0.05% Tween-20. Finally, membranes were visualized with Li-Cor Odyssey DLx using Image Studio. Antibodies against KEAP1 (Thermo Fisher Scientific, #10503-2-AP, RRID: AB_2132625), NQO1 (Thermo Fisher Scientific, #11451-1-AP, RRID:AB_2298729), β-actin (66009-1-Ig, Proteintech, RRID:AB_2687938), and GAPDH (sc-32233, Santa Cruz Biotechnology, RRID:AB_627679) were used.
KEAP1 knockout generation and evaluation
ARH-77 with deletion of the genes encoding KEAP1 was generated through CRISPR-Cas9 deletion. Cells were electroporated in R Buffer (Thermo Fisher Scientific, BR5) containing 150 ng/µL sgRNA and 500 ng/µL recombinant TrueCut Cas9 protein (Thermo Fisher, A36496) using Invitrogen Neon Electroporator with 2 pulses of 1200V, 2 ms duration. Three sgRNA sequences, 5′ CCGUGUAGGCGAAUUCAAUG 3′, 5′ ACCAACGGGCUGCGGGAGCA 3′, and 5′ UGGGCCAUGAACUGGGCGGC 3′, were used for electroporation. Cells were then seeded at a density of one cell per well in 96 well plates and grown until colonies were established. Colonies were tested for DNA changes through PCR using KEAP1 primers, 5′-AGGTGCTGGCCCAGTCCCAA-3′ and 5′-GCCGATGGCATTGCTGGGGT-3′. For RT-qPCR, RNA was extracted from cells and prepared for cDNA synthesis (#4368813, Thermo Fisher Scientific). After cDNA synthesis, samples were evaluated using qRT-PCR by C1000 Biorad Thermal Cycler with qPCR kit (#4444556, Thermo Fisher Scientific). RNA was tested for NQO1 (Thermo Fisher Scientific, Hs01045993_g1) and KEAP1 (Thermo Fisher Scientific, Hs00202227_m1) expression with GAPDH normalization (Hs02758991_g1). Full uncropped western blots are available in Supplementary Data S1.
RNA-Seq dataset analysis
RNA-Sequencing data for each sample in each cell line was analyzed in Matlab (RRID:SCR_001622). Data were processed such that any genes with average expression values less than 1 fragments per kilobase of exon per million mapped fragments (FPKM) for all concentrations were removed. Mattest was used to conduct an unpaired t-test. PCA (principal component analysis) helped generate principal component coefficients to quantify the two most important principal components, which could then be visualized. The visualization helped determine the exclusion of sample 1 in control RPMI-8226, and sample 3 in the wildtype ARH-77 (Supplementary Fig. S16). Validation data from 24 hour treatment of sulforaphane was used from GSE48812. Raw data was processed into FPKM as previously described and then Transcripts Per Millions (TPMs) for analysis (Luo et al., 2023). NSCLCs data from Depmap and cancer patient TCGA data from cBioportal, (Cerami et al., 2012), were analyzed in R. Expression of cell lines from Depmap were processed in log2(Transcripts Per Million + 1) while TCGA expression used log2(normalized counts + 1). Normalized counts were calculated using RSEM (batch normalized) and downloaded from cbioportal. Cell lines and tumor samples were classified as NRF2/KEAP1 wildtype or mutant if non-conservative mutations were present in the DNA sequencing data. RNA expression was compared between wildtype and knockout samples for differential expression. GSEA (Broad Institute Software) was performed on RNA-sequencing data from cell lines.
NRF2 target genes identification
After processing, genes that were upregulated more than 25% on average from DMSO to low CDDO-2P-Im dose were identified as candidate NRF2 upregulated genes. A two-way student t-test using unpaired unequal variance was used to calculate a p value for each comparison. Genes that had upregulation and a p value of less than 0.1 (one way t-test of 0.05) were considered candidate NRF2 target genes for each cell line. A similar classification was used for the KEAP1 KO ARH-77 model between WT and KO samples. Data from sulforaphane validation was evaluated with the same criteria of upregulation of more than 25% on average and a t-test p value of less than 0.1.
NRF2-induced genes in LUAD TCGA samples, LUSC TCGA samples, HNSC TCGA samples, LIHC TCGA samples, from the cBioportal, and the NSCLC CCLE samples, from the DepMap, were also found by selecting the top 500 upregulated genes in each sample, ordered by lowest p value. Bar graphs were generated for individual cell line RNA-Sequencing data while box plots using quartiles were generated for comparison of multiple cell lines or tumor samples.
These lists of candidate NRF2 target genes were compared to each other to determine which genes that were induced across cell lines. Genes were determined to be highly upregulated if their expression level increased twofold after drug treatment, following genetic modification, or if they were part of the top 100 most significant upregulated genes by p value in the TCGA or CCLE databases. A similar analysis was repeated for downregulated genes for each cell line, in which all genes with a significant (p value < 0.1) reduction in expression were compared with no minimum threshold for downregulation. In the TCGA and CCLE datasets, the top 250 downregulated genes were chosen as targets.
For the individual NRF2 target genes, LASAGNA-search 2.0 tool (Lee and Huang, 2014) was used to predict NFE2L2/ARE binding sites. For each gene, a distance of 0 to −5000 of the transcription start site was selected and a cutoff of 0.0005 p value was used. Binding sites were numbered according to lowest estimated p value.
Validation of NRF2 genes in rat models
Gene expression data was used from GSE77377 to investigate changes in NRF2 related genes (Taguchi et al., 2016). Gene expression data were averaged for each treatment group and normalized to WT with vehicle treatment. P values for gene expression changes were calculated using student t-test.
N2CS and N2AS calculation
To calculate the N2CS and N2AS, the 14 core NRF2 gene expressions were used. Gene expression was standardized using FPKM for each set of calculations. For the N2CS, the control is set as the baseline and all gene expression changes were expressed as Log2 Fold Change relative to the baseline. The fold changes of the 14 core NRF2 genes are used to calculate the N2CS.
In this calculation, FCN
is the individual fold changes for each core NRF2 gene, and n is the number of core NRF2 genes which is 14 in our case. For N2AS, a baseline expression must be established from the group of samples. The mean expression for each gene from the control is set as the baseline and the standard deviation is used to help calculate a z-score for each gene expression.
Thus, the z-score is calculated by the taking the difference of the expression value, x, and the mean, µ, and divide the difference by σ, the standard deviation of this gene expression. The final N2AS is the average of the z-scores of the 14 core NRF2 genes.
The ZN is the individual z-scores for each gene which is summed up and divided by the total number of genes in the gene set, n. When evaluating other NRF2 gene sets, instead of the 14 core genes, other genes were substituted to calculate a new N2AS.
Protein–Protein interaction network model
The STRING database was used to investigate the protein-protein interaction network and functional enrichment of pathways associated with the NRF2 core gene set (Szklarczyk et al., 2023). The NRF2 core gene set was inputted to the database and analyzed for interactions and enrichments. The network was exported and the top enrichments were featured as relevant pathways associated with the gene set.
Drug resistance modeling
Data from Depmap of gene expression and CTRP2 experimental data was downloaded and analyzed in R 4.0.3 (Rees et al., 2016). Information about gene expression and drug sensitivity (Area Under the Curve) NSCLC lines data were collected and merged in R. Cell line expression data was paired for each cell and the N2AS score was calculated for each cell line. A Pearson correlation was performed for every gene or gene set and the drug AUC. The graphs of the area under the curve and N2AS score was plotted for all cell lines using ggplot in R. For analysis of other drugs, the datasets (GSE41929, GSE48812, GSE135842, GSE199779) were used for analysis.
Cell viability assay
KEAP1 knockout and wildtype ARH-77 cells were plated in 96 well plates with 2.5 × 10⁴ cells per well. 1% DMSO or various concentrations of drugs were added the well. After 48 h, CellTiter-Glo™ (Promega Corp, Madison, WI) was used to investigate cell viability according to manufacturer’s instructions. Necrosulfonamide (#34702, Cayman Chemical), PX-12 (#14192, Cayman Chemical), Paclitaxel (#10461, Cayman Chemical), and bardoxolone methyl (SMB00376, Sigma Aldrich) Experiments were done in triplicates and repeated twice. IC50 was calculated using CompuSyn software (Chou and Martin, 2005).
Colony forming assay
KEAP1 knockout and wildtype ARH-77 cells were plated in six-well plates with 1000 cells per well. Cells were mixed in MethoCult™ H4434 Classical media (StemCell Technologies). Cells were allowed to grow for 14 days before they were imaged using Keyence BZ-X810. Colonies of more than 10 cells were counted on 10 different views at ×20 focus for each well. Experiments were done in triplicates and repeated twice.
Cancer prognosis modeling
TCGA Data from cBioportal was collected and analyzed in R (Cerami et al., 2012). Additional data from GEO, Biostudies (Sarkans et al., 2018), and International Cancer Genome Consortium was also collected and processed as needed (Supplementary Table S15). RNA-Seq data was processed to TPM while microarray array data was used as is. R packages Survival and Cutpointr were used to help analyze survival data.
Information about patients’ clinical outcomes and N2AS gene expression profiles were combined in R. Z scores for gene expression was used when present or calculated using TPM or microarray data as needed. Patients were subsequently ranked based on their N2AS and corresponding HRs and ranked log p values were calculated for every cutoff using survival. These numbers were graphed onto a LOCC graph as previously explained (Luo and Letterio, 2023).
For training, the optimal cutoff consisting of at least 10% of the cohort was selected by Cutpointr (lowest p value) and manually verified to be appropriate by LOCC visualization. This N2AS cutoff was selected for this cancer and used in the subsequent validation. For a cancer to pass training, the p value must be lower than p = 0.01 for at least one cutoff. For validation, instead of using the optimal cutoff, the previous N2AS activity score was used to separate groups. For validation, a p value of 0.05 was considered significant. Kaplan–Meier plots were generated at each cutoff and calculations for HR and p value were performed using survival. LOCC graphs were generated according to the previous study (Luo and Letterio, 2023).
Footnotes
Acknowledgements
The authors would like to acknowledge Dr. Michael Sporn for his donation of CDDO-2P-Im and contribution to the field of NRF2 and synthetic triterpenoids. Dr. Sporn passed away in late 2022. Graphics were made with the aid of Biorender.
Authors’ Contributions
G.L. and J.J.L.: Conceptualization; G.L., J.J.L., H.K., E.J., and E.R.C.: Methodology; G.L., H.K., E.J., and K.A.: Formal Analysis; G.L., H.K., K.A., E.J., S.R., and E.H.: Investigation, G.L., K.A., S.R, A.S., H.M., and E.H.: Resources; G.L., J.L., and H.K.: Writing—Original Draft; G.L., J.L., and K.A.: Writing—Review and Editing; G.L. and J.J.L.: Supervision; J.J.L. and H.M.: Funding Acquisition.
Data Availability Statement
All RNA-Sequencing data is online through GEO (GSE228434, GSE221526, GSE229914, GSE229704, GSE229652). Other published datasets used in this study are listed in Supplementary Tables S14 and S15. Code for analysis is available on https://github.com/hkumar2907/NFE2L2_Paper and ![]() .
.
Author Disclosure Statement
The authors declare no potential conflicts of interest.
Funding Information
G.L. is supported by NIH MSTP training grant 5T32GM007250. J.J.L. is supported by the Jane and Lee Seidman Chair in Pediatric Cancer Innovation.
Supplementary Material
Supplementary Figure S1
Supplementary Figure S2
Supplementary Figure S3
Supplementary Figure S4
Supplementary Figure S5
Supplementary Figure S6
Supplementary Figure S7
Supplementary Figure S8
Supplementary Figure S9
Supplementary Figure S10
Supplementary Figure S11
Supplementary Figure S12
Supplementary Figure S13
Supplementary Figure S14
Supplementary Figure S15
Supplementary Figure S16
Supplementary Data S1
Supplementary Table S1
Supplementary Table S2
Supplementary Table S3
Supplementary Table S4
Supplementary Table S5
Supplementary Table S6
Supplementary Table S7
Supplementary Table S8
Supplementary Table S9
Supplementary Table S10
Supplementary Table S11
Supplementary Table S12
Supplementary Table S13
Supplementary Table S14
Supplementary Table S15
Abbreviations Used
References
Supplementary Material
Please find the following supplemental material available below.
For Open Access articles published under a Creative Commons License, all supplemental material carries the same license as the article it is associated with.
For non-Open Access articles published, all supplemental material carries a non-exclusive license, and permission requests for re-use of supplemental material or any part of supplemental material shall be sent directly to the copyright owner as specified in the copyright notice associated with the article.