
Abstract
Aims:
Metabolic dysfunction-associated steatotic liver disease (MASLD) is a prevalent hepatic disorder worldwide. Arachidonic acid 15-lipoxygenase (ALOX15), an enzyme catalyzing the peroxidation of polyunsaturated fatty acids, plays a crucial role in various diseases. Here, we sought to investigate the involvement of ALOX15 in MASLD.
Results:
In this study, we observed upregulation of ALOX15 in the liver of high-fat diet (HFD)- and streptozotocin (STZ)-induced mice. Metabolomic analysis revealed elevated levels of ALOX15 metabolites, 12(S)-hydroperoxyeicosatetraenoic acid and 15(S)-hydroperoxyeicosatetraenoic acid. Transcriptomic analysis showed that the increased fatty acid uptake regulated by the PPARγ/CD36 pathway predominated in lipid accumulation. To elucidate the mechanism underlying ALOX15-induced lipid accumulation, HepG2 cells were transfected with a lentivirus expressing ALOX15 or small interfering RNA targeting ALOX15 and exposed to palmitic acid (PA). Both ALOX15 overexpression and PA exposure led to increased intracellular free fatty acid and triglyceride, resulting in lipotoxicity. ALOX15 overexpression aggravated the effect of PA, while the knockdown of ALOX15 attenuated PA-induced lipotoxicity. Moreover, the treatment with PPARγ antagonist GW9662 or CD36 inhibitor sulfosuccinimidyl oleate sodium effectively reduced lipid accumulation and lipotoxicity resulting from ALOX15 overexpression and PA exposure, indicating the involvement of the PPARγ/CD36 pathway in ALOX15-mediated lipid accumulation. Furthermore, liraglutide, a widely used glucagon-like peptide 1 receptor (GLP-1R) agonist (GLP-1RA), improved hepatic lipid accumulation in HFD/STZ-induced mice by suppressing the ALOX15/PPARγ/CD36 pathway.
Innovation and Conclusion:
Our study underscores the potential of ALOX15 as an emerging therapeutic target for MASLD. In addition, the GLP-1RA may confer hepatoprotection by regulating ALOX15, enhancing our comprehension of the mechanisms underpinning their protection on MASLD. Antioxid. Redox Signal. 43, 37–55.
Introduction
Metabolic dysfunction-associated steatotic liver disease (MASLD), formerly known as nonalcoholic fatty liver disease, is a prevalent chronic liver disease that affects more than 25% of the global population (Younossi et al., 2016). It encompasses various hepatic disorders ranging from simple steatosis to metabolic-associated steatohepatitis (MASH), cirrhosis, and eventually hepatocellular carcinoma. Metabolic syndrome diseases such as obesity, type 2 diabetes mellitus (T2DM), and insulin resistance are closely linked with MASLD. In fact, MASLD frequently coexists with T2DM, and approximately 56% of T2DM patients worldwide have MASLD (Younossi et al., 2019). This comorbidity heightens the risk for developing chronic complications, such as cardiovascular disorders, chronic kidney disease, and diabetic microvascular complications. In addition, T2DM also promotes the progression of MASLD, and the mechanism may be related to insulin resistance, inflammatory response, and chemokine-mediated oxidative stress (Vetrano et al., 2023). Due to the close correlation between MASLD and T2DM, increasing attention has been focused on the impact of novel antidiabetic agents on MASLD. Currently, three classes of hypoglycemic agents have exhibited promising results in the treatment of MASLD, including glucagon-like peptide 1 receptor (GLP-1R) agonists (GLP-1RAs) (liraglutide and semaglutide) (Mantovani et al., 2022). However, there is still a lack of comprehensive understanding regarding the mechanisms underlying the improvements in MASLD achieved by GLP-1RAs.
A major hallmark of MASLD is the lipid accumulation (predominantly triglycerides or TGs) in the liver, which results from excessive lipid influx or impaired lipid efflux. Hepatic lipid accumulation promotes lipotoxicity, resulting in oxidative stress, inflammation, and ultimately liver injury (Schwarzler et al., 2024). The etiology of MASLD is complex, and its pathogenesis remains unclear. Therapeutic strategies for MASLD mainly focus on bile acid signaling, insulin resistance, and reduction of lipid deposition. In March 2024, the Food and Drug Administration (FDA) approved Rezdiffra (resmetirom, an oral thyroid hormone receptor beta agonist) as the first drug to treat MASH. The development of innovative drugs for MASLD has long been a challenging endeavor. The approval of resmetirom therefore serves as a strong motivation for us to pursue new targets and effective medications in this field.
Arachidonic acid 15-lipoxygenase (ALOX15) is a nonheme iron-containing dioxygenase that catalyzes the lipid peroxidation of polyunsaturated fatty acids (PUFAs). ALOX15 and its PUFA-derived metabolites are widely distributed in human tissues, playing a role in regulating cell differentiation, ferroptosis, oxidative stress, and inflammatory responses (He et al., 2023; Ivanov et al., 2015). They are implicated in various pathological processes, such as cancer, atherosclerosis, diabetes mellitus, and neurodegeneration (Singh and Rao, 2019). In normal or PUFA-enriched H9C2 cells, ALOX15 inhibition provided protection against cell death and lipid peroxidation and increased the content of glutathione (GSH), while ALOX15 overexpression exacerbated cell death induced by hypoxia and PUFA; ALOX15 knockout (KO) provides protection against ischemia-induced myocardial damage (Ma et al., 2022). ALOX15 expression is upregulated in cerebral ischemia-reperfusion (I/R) animals and cell model, and inhibition of ALOX15 alleviates ferroptosis and inflammation caused by cerebral I/R injury (Lei et al., 2024). It has been reported that inhibiting the expression of ALOX15 can reduce the occurrence of diabetes mellitus and its complications. Genetic inhibition of ALOX15 reduces profibrotic gene expression and improves diabetic nephropathy in vivo and in vitro (Yuan et al., 2016). The essential roles of ALOX15 and its metabolites render this enzyme a target for pharmacological research. In a previous published study, the authors found that the disruption of ALOX15 reduced hepatic steatosis, insulin resistance, and inflammation in apolipoprotein E-deficient (ApoE-/-) mice, which spontaneously develop MASLD. While this study has preliminarily established the role of ALOX15 in MASLD, the underlying mechanisms remain elusive, and the upstream and downstream molecules of ALOX15 that influence MASLD continue to be unidentified (Martinez-Clemente et al., 2010). Based on the finding that ALOX15 is significantly upregulated in the liver of mice with T2DM and MASLD, we attempt to further explore whether ALOX15 participates in the lipid accumulation process that contributes to the development of MASLD in an experimental T2DM mouse model and explore its mechanisms. Furthermore, we want to know if liraglutide, a widely used GLP-1RA, could have a beneficial effect by regulating ALOX15 expression. Our study may reveal the potential of ALOX15 as a target for MASLD and provide new strategies for its treatment.
Results
ALOX15 is upregulated in the liver of mice induced with HFD/STZ
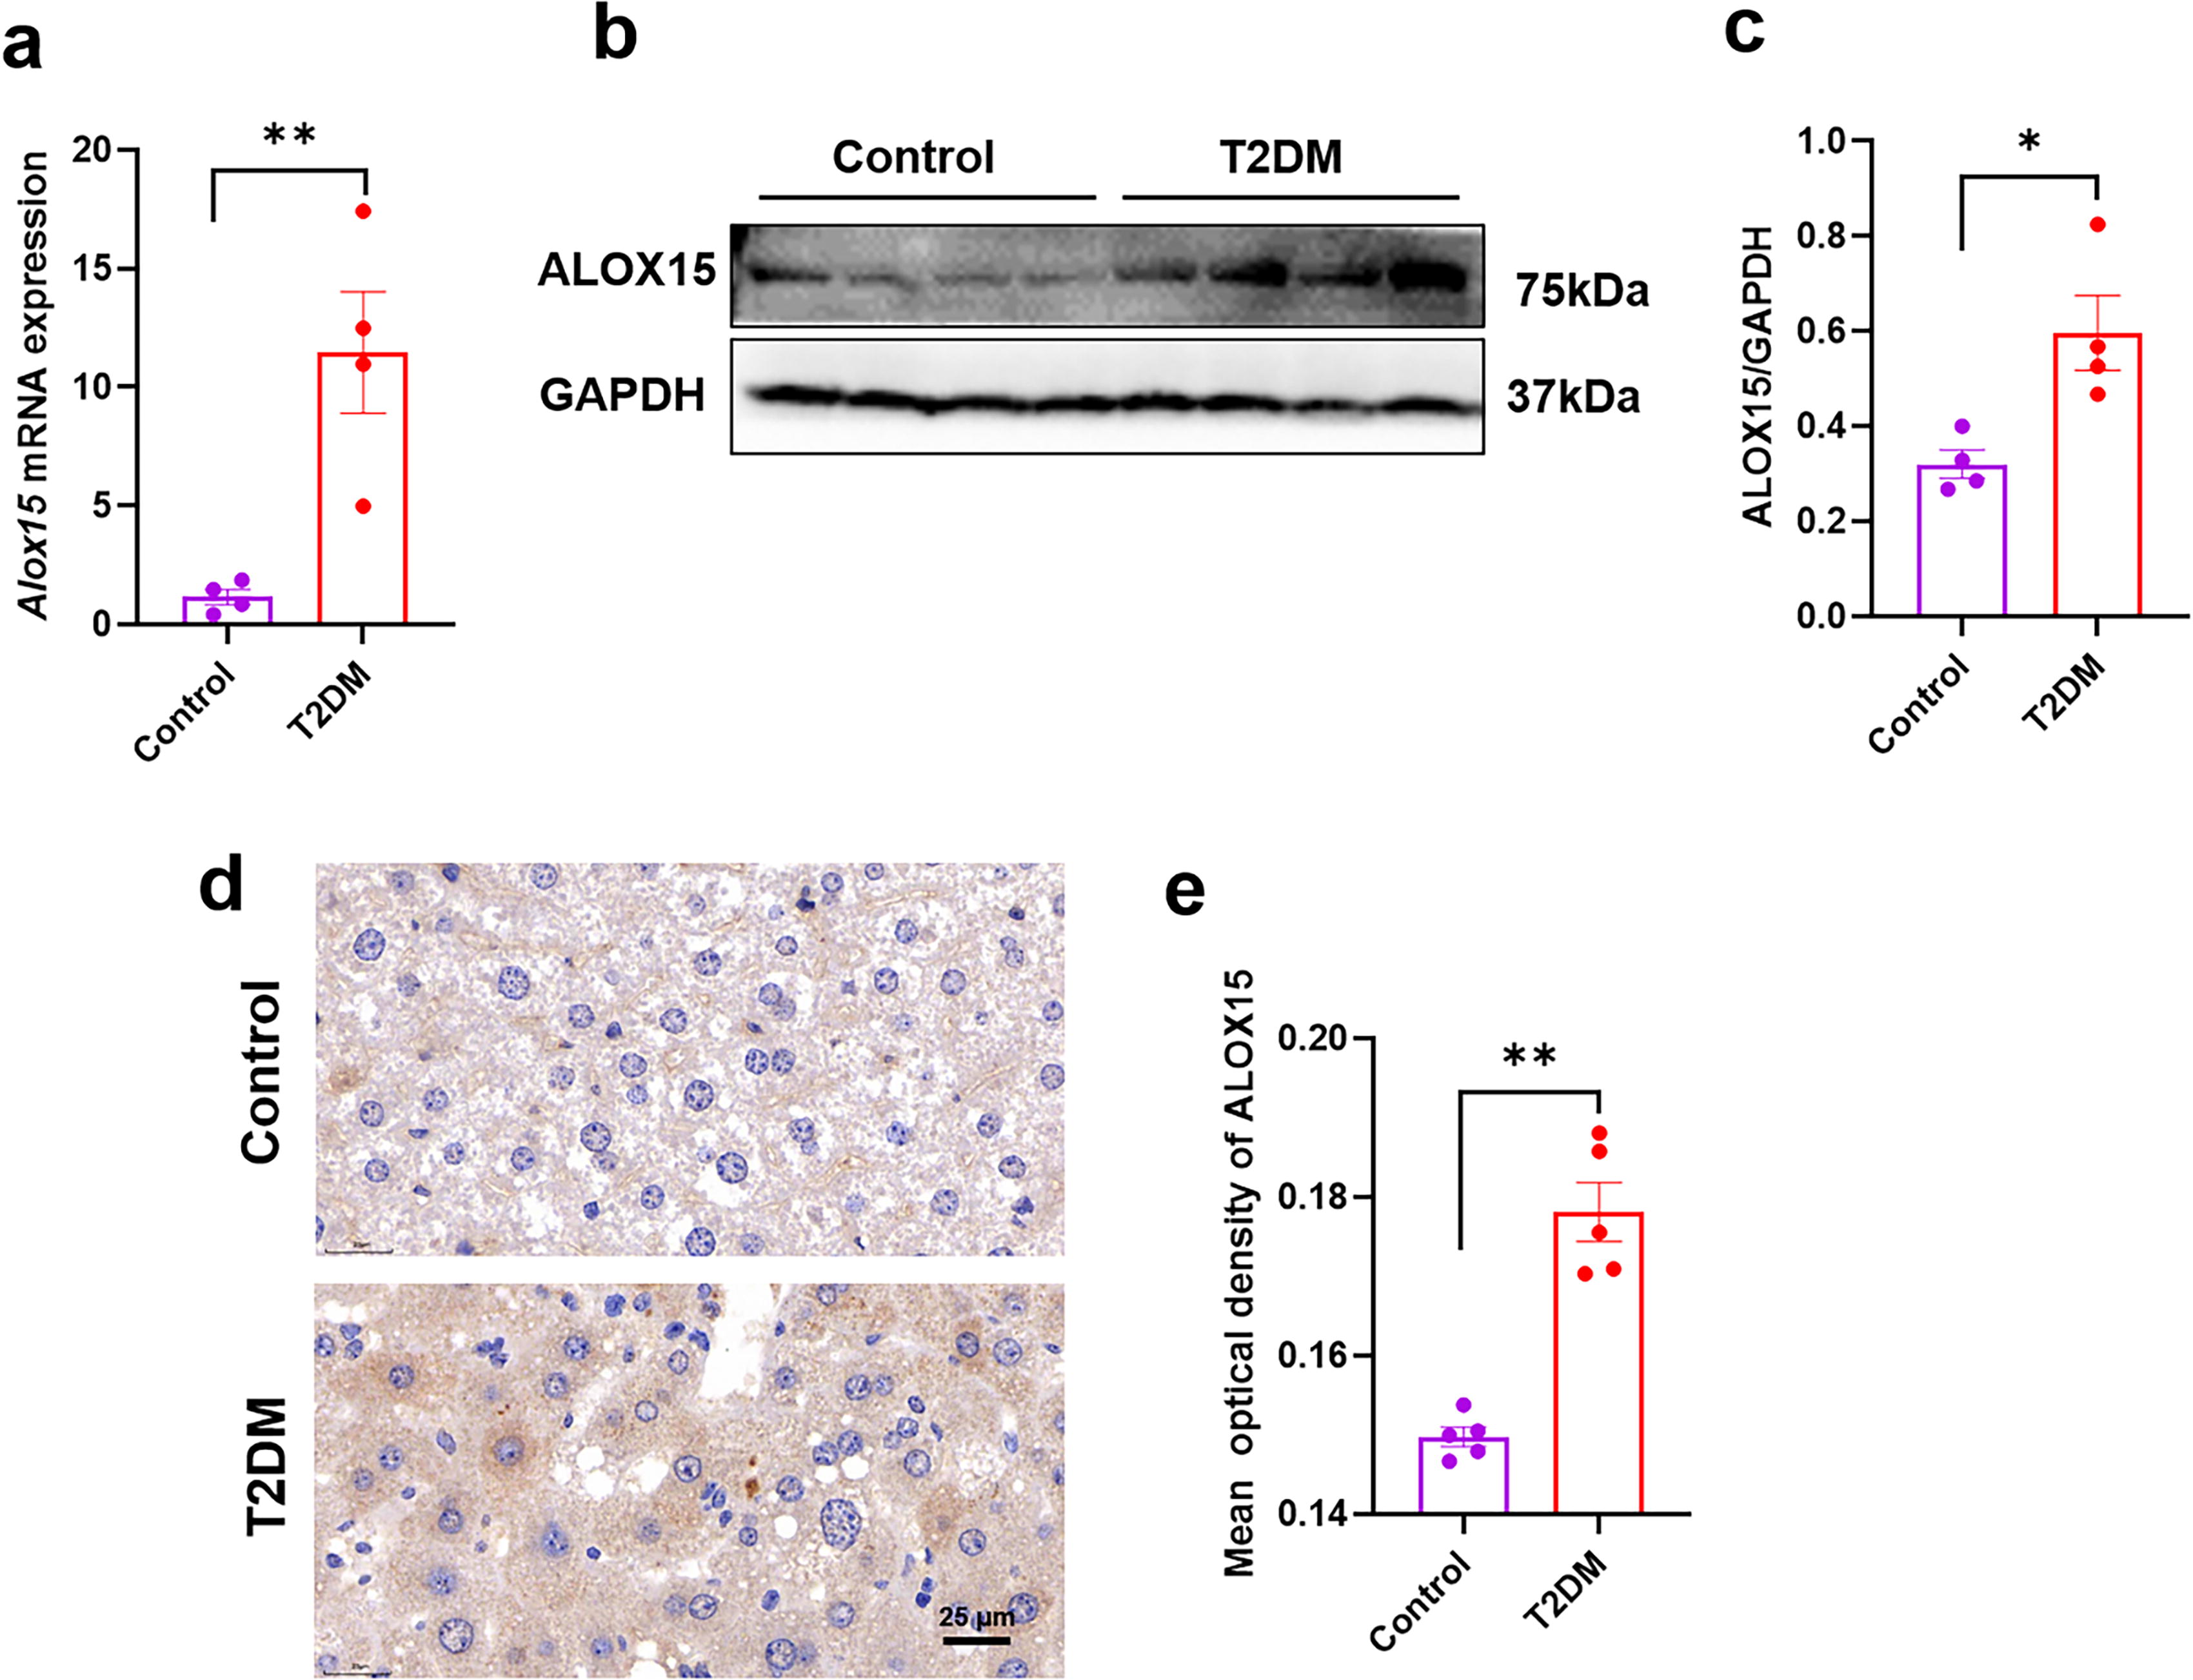
It is widely recognized that MASLD is a very common complication of T2DM. This association was also demonstrated in our previous study, in which high-fat diet (HFD)- and streptozotocin (STZ)-induced T2DM mice exhibited significantly elevated levels of alanine transaminase (ALT) and aspartate transaminase, hepatocyte ballooning, and abnormal hepatic lipid accumulation (Guo et al., 2023). To investigate the role of ALOX15 in the pathogenesis of MASLD secondary to T2DM, we used real-time polymerase chain reaction (PCR), Western blotting (WB), and immunohistochemistry to verify ALOX15 expression in the liver of T2DM mice. First, we examined Alox15 transcript levels in the liver of control and T2DM mice. Real-time PCR analysis showed that the mRNA expressions of Alox15 were significantly increased in the T2DM group compared with the control group (p < 0.01, Fig. 1A). WB analysis revealed a significant increase in ALOX15 expression in the T2DM group compared with the control group (p < 0.05, Fig. 1B, C). The expression trend of ALOX15 in immunohistochemistry was consistent with that obtained from real-time PCR and WB analysis (p < 0.01, Fig. 1D, E). These results suggest that ALOX15 upregulation may be involved in the formation of fatty liver in T2DM mice.
Increased fatty acid uptake due to activation of ALOX15/PPARγ/CD36 pathway may contribute to liver fat accumulation in HFD/STZ-induced T2DM mice
The physiological substrates for ALOX15 enzyme include linoleic acid, arachidonic acid, eicosapentaenoic acid, and docosahexaenoic acid (Singh and Rao, 2019). As shown in Figure 2A, there was no significant difference in the levels of ALOX15 substrates between the control and T2DM group, as determined by serum untargeted metabolomics. The principal component analysis (PCA) plots and volcano plots for metabolomics are shown in Supplementary Figure S1. We found that arachidonic acid and linoleic acid were the dominant PUFAs. ALOX15 metabolizes arachidonic acid to form 15(S)-hydroperoxyeicosatetraenoic acid [15(S)-HPETE] and 12(S)-hydroperoxyeicosatetraenoic acid [12(S)-HPETE]. They are further reduced by cellular GSH peroxidase to their corresponding hydroxy analogs, 15(S)-hydroxy eicosatetraenoic acid [15(S)-HETE] and 12(S)-hydroxy eicosatetraenoic acid [12(S)-HETE], respectively; ALOX15 metabolizes linoleic acid to 13(S)-hydroperoxyoctadecadienoic acid [13(S)-HPODE], which is further reduced to 13(S)-hydroxyoctadecadienoic acid [13(S)-HODE] (Snodgrass RG and Brune B, 2019). As exhibited in Figure 2B, a dramatic rise in the serum levels of 12(S)-HPETE (p < 0.01) and 15(S)-HETE (p < 0.01), derived from arachidonic acid, was observed in the T2DM group compared with the control group. Surprisingly, a significant decline in the levels of 13(S)-HODE (Fig. 2B, p < 0.05), derived from linoleic acid, was observed in the T2DM group compared with the control group, suggesting that abnormal arachidonic acid metabolism rather than linoleic acid plays a major role in MASLD.
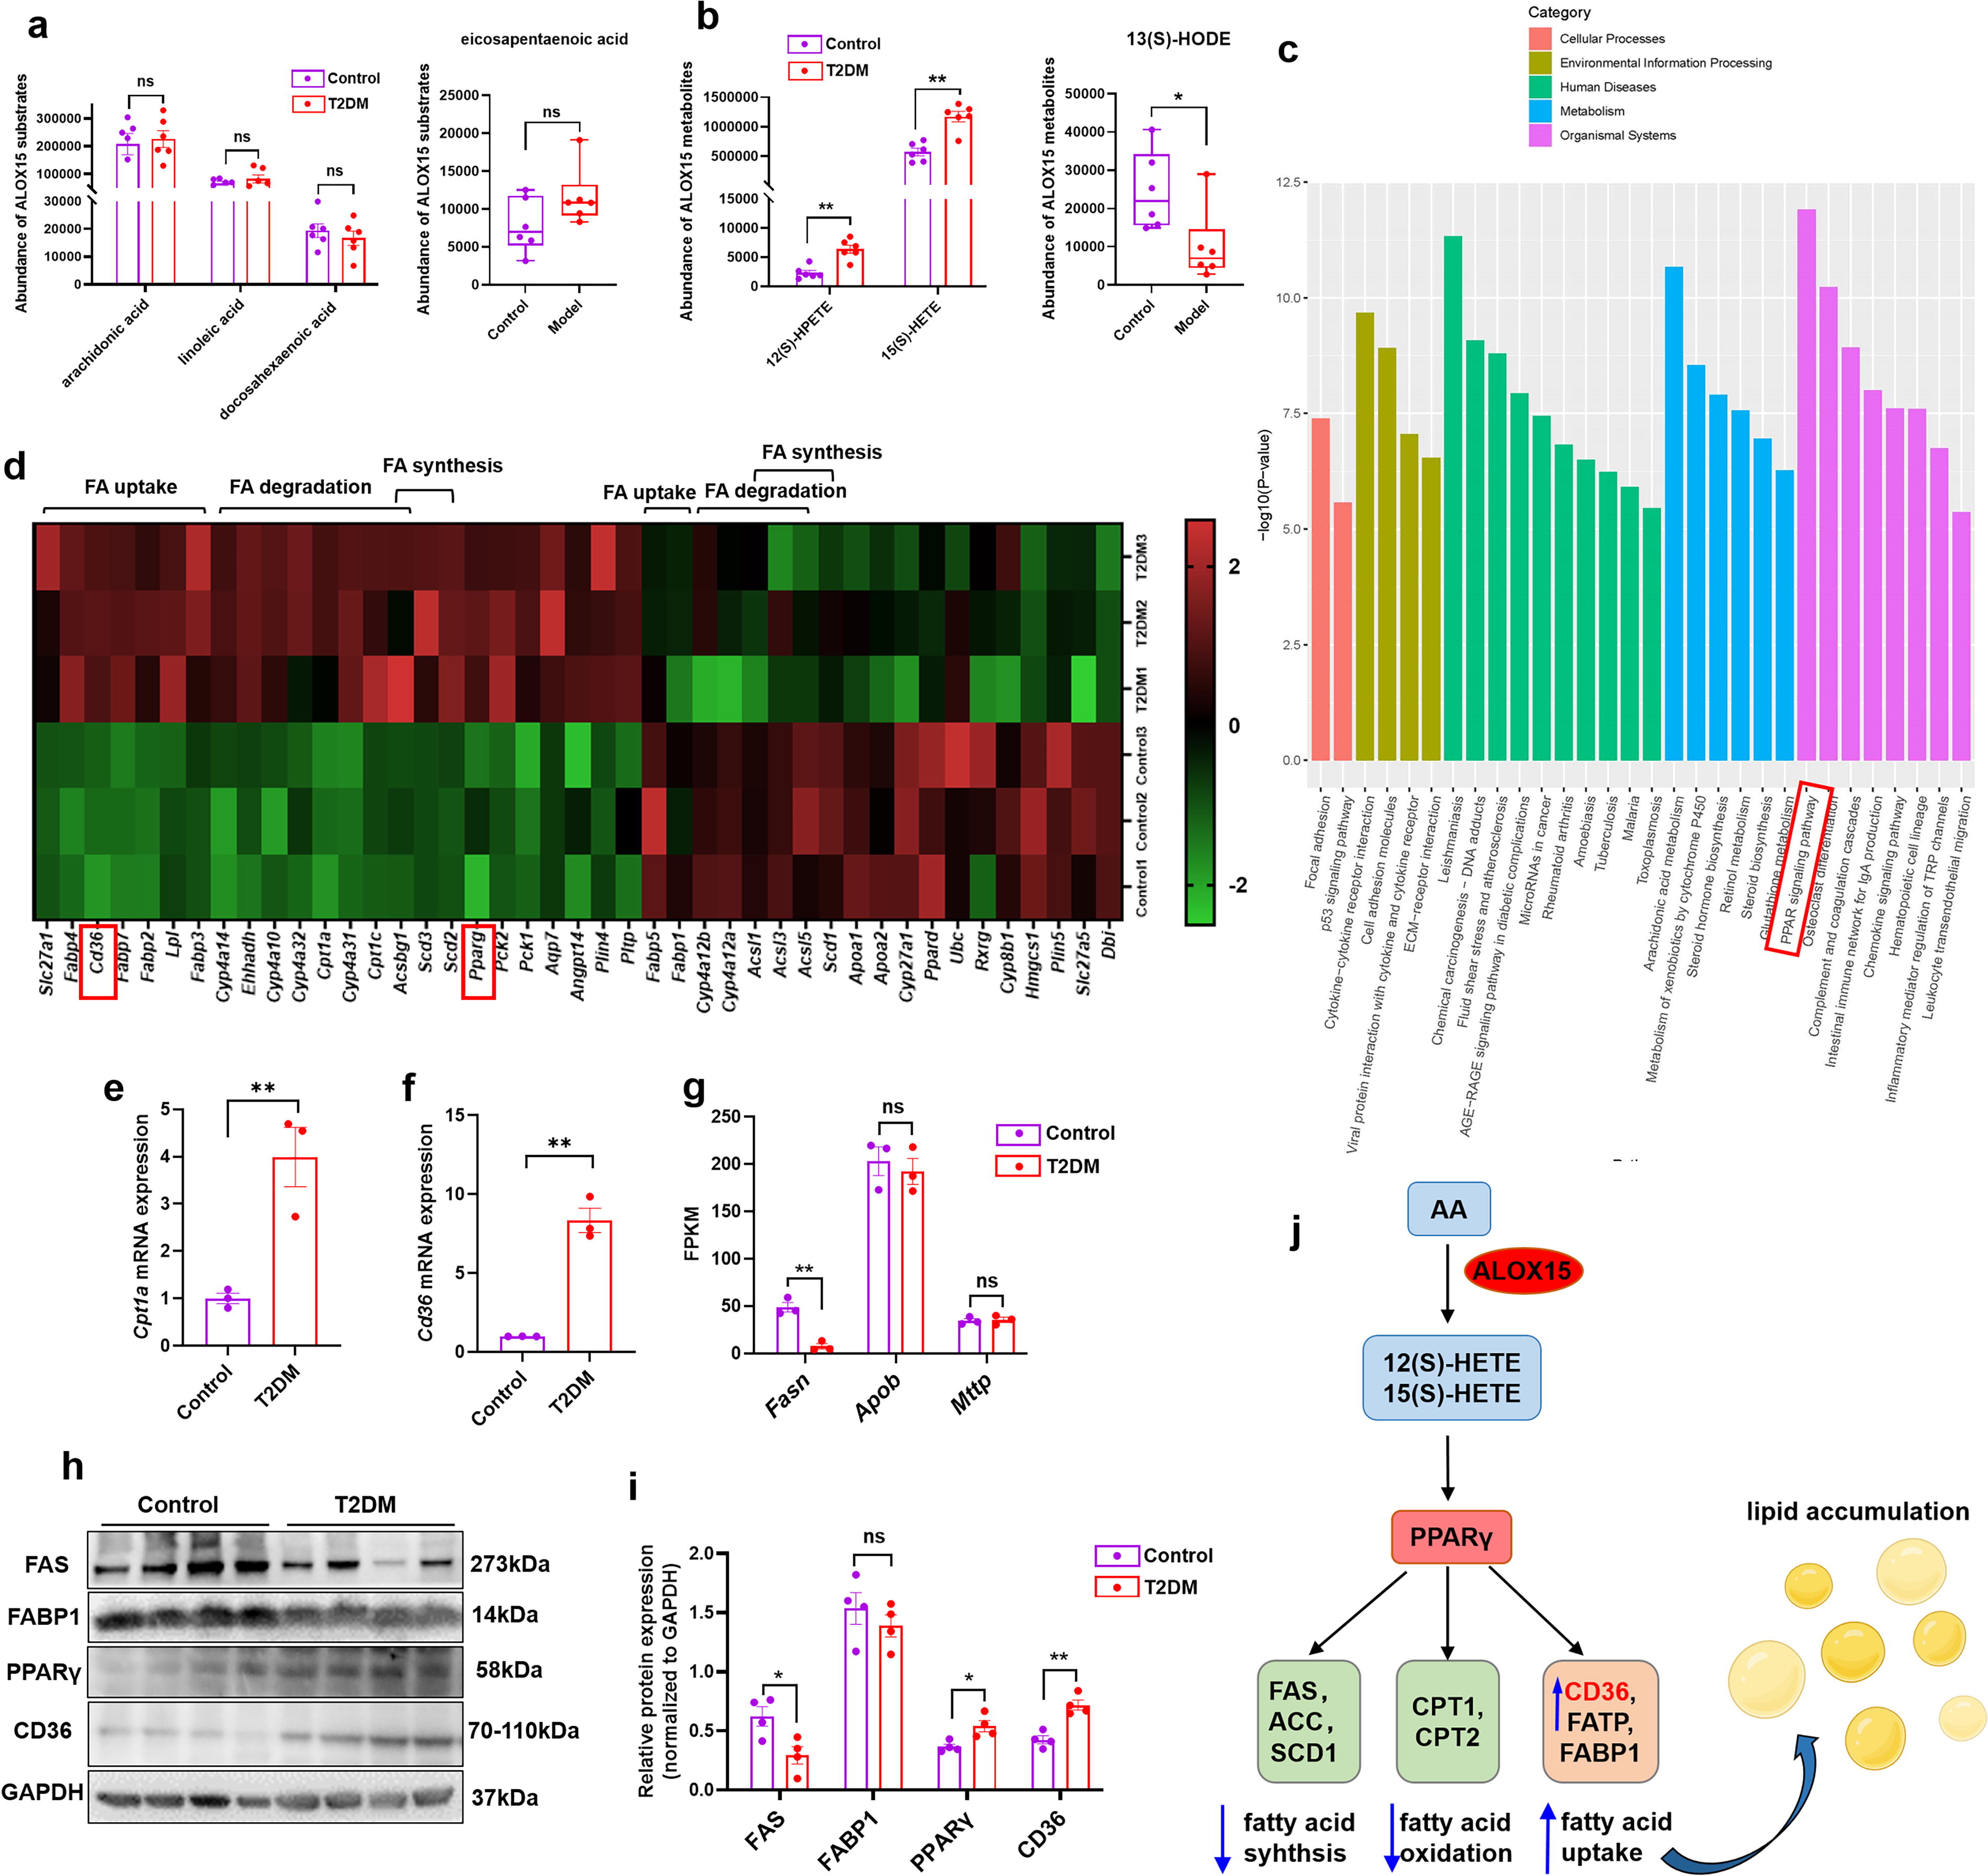
RNA sequencing analysis of liver samples from control and T2DM mice was performed to uncover the pathogenesis of fatty liver in T2DM. The PCA plot and volcano plot are shown in Supplementary Figure S2. Through the Kyoto Encyclopedia of Genes and Genomes (KEGG) enrichment analysis, the top 30 pathways include peroxisome proliferator-activated receptor (PPAR) signaling pathway, arachidonic acid metabolism, p53 signaling pathway, etc. (Fig. 2C). As shown in Figure 2D, the differentially expressed genes in PPAR signaling pathway included Pparg, Ppard, fatty acid uptake-related genes (Slc27a1, Cd36, Fabp1, etc.), fatty acid degradation-related genes (Cpt1a, Cpt1c, Cyp4a14, etc.), and fatty acid synthesis genes (Scd1-3, Acsbg1, etc.). The increment in the hepatic expression of PPARγ was further validated by WB analysis (Fig. 2H, I, p < 0.05). Several studies have shown that ALOX15 metabolites 15(S)-HETE and 12(S)-HETE can act as a PPARγ ligand (Singh and Rao, 2019; Sun et al., 2015), so ALOX15 may affect lipid metabolism through the activation of PPARγ.
Four independent mechanisms of hepatic lipid accumulation have been summarized, including (1) extended fatty acid uptake, (2) increased fatty acid synthesis, (3) decreased fatty acid β-oxidation, and (4) diminished secretion of very low-density lipoproteins (VLDLs) from the liver (Geisler and Renquist, 2017). In our study, hepatic expression of CD36, a fatty acid transporter, was increased in mice with T2DM and MASLD as manifested by RNA sequencing (Fig. 2D, p < 0.01), real-time PCR (Fig. 2F, p < 0.01), and WB (Fig. 2H, I, p < 0.01). FABP1, which is mainly expressed in the liver, is responsible for the transport and oxidation of fatty acid. WB analysis showed that there was no difference in the expression of FABP1 between the livers of the control and T2DM group (Fig. 2H, I). β-oxidation is the predominant form of fatty acid degradation, and carnitine acyltransferase-1 (CPT1) is the rate-limiting enzyme of β-oxidation. Cpt1a and Cpt1c are subunits of Cpt1, both of which exhibited an increased hepatic expression in the T2DM mice assessed by RNA sequencing (Fig. 2D). CPT1a is mainly expressed in the muscle and liver, while CPT1c is only expressed in the brain and tumor tissue (Casals et al., 2016). Therefore, we used real-time PCR to verify the expression of Cpt1a in the liver (Fig. 2E, p < 0.01), and the results were consistent with RNA sequencing, indicating increased β-oxidation in the liver of T2DM mice. Acetyl-CoA carboxylase (ACC), fatty acid synthase (FAS, encoded by Fasn), and stearoyl CoA desaturase 1 (SCD1) are key enzymes in the process of fatty acid synthesis and elongation. ACC protein expression and phosphorylation levels have been demonstrated by our previous study (Guo et al., 2023) to be reduced in the liver of T2DM mice. In the present study, RNA sequencing analysis showed that the expression of Fasn (Fig. 2G, p < 0.01) and Scd1 (Fig. 2D) was significantly descended in the liver of T2DM mice compared with control mice. The verification of FAS expression by WB (Fig. 2H, I, p < 0.05) was similar to that by RNA sequencing. Overall, these results reflected a decline in hepatic fatty acid synthesis in the model group compared with the control group. In addition, the expression of apolipoprotein B (ApoB) and microsmal triglyceride transfer protein (MTTP), which are related to VLDL secretion, did not change significantly (Fig. 2G). Taken together, we conclude that increased fatty acid uptake predominates in hepatic lipid accumulation, thus promoting fatty liver formation in HFD- and STZ-induced T2DM mice. Moreover, the increased fatty acid uptake may be related to the activation of the ALOX15/PPARγ/CD36 pathway (Fig. 2J).
ALOX15 is upregulated in palmitic acid-stimulated HepG2 cells
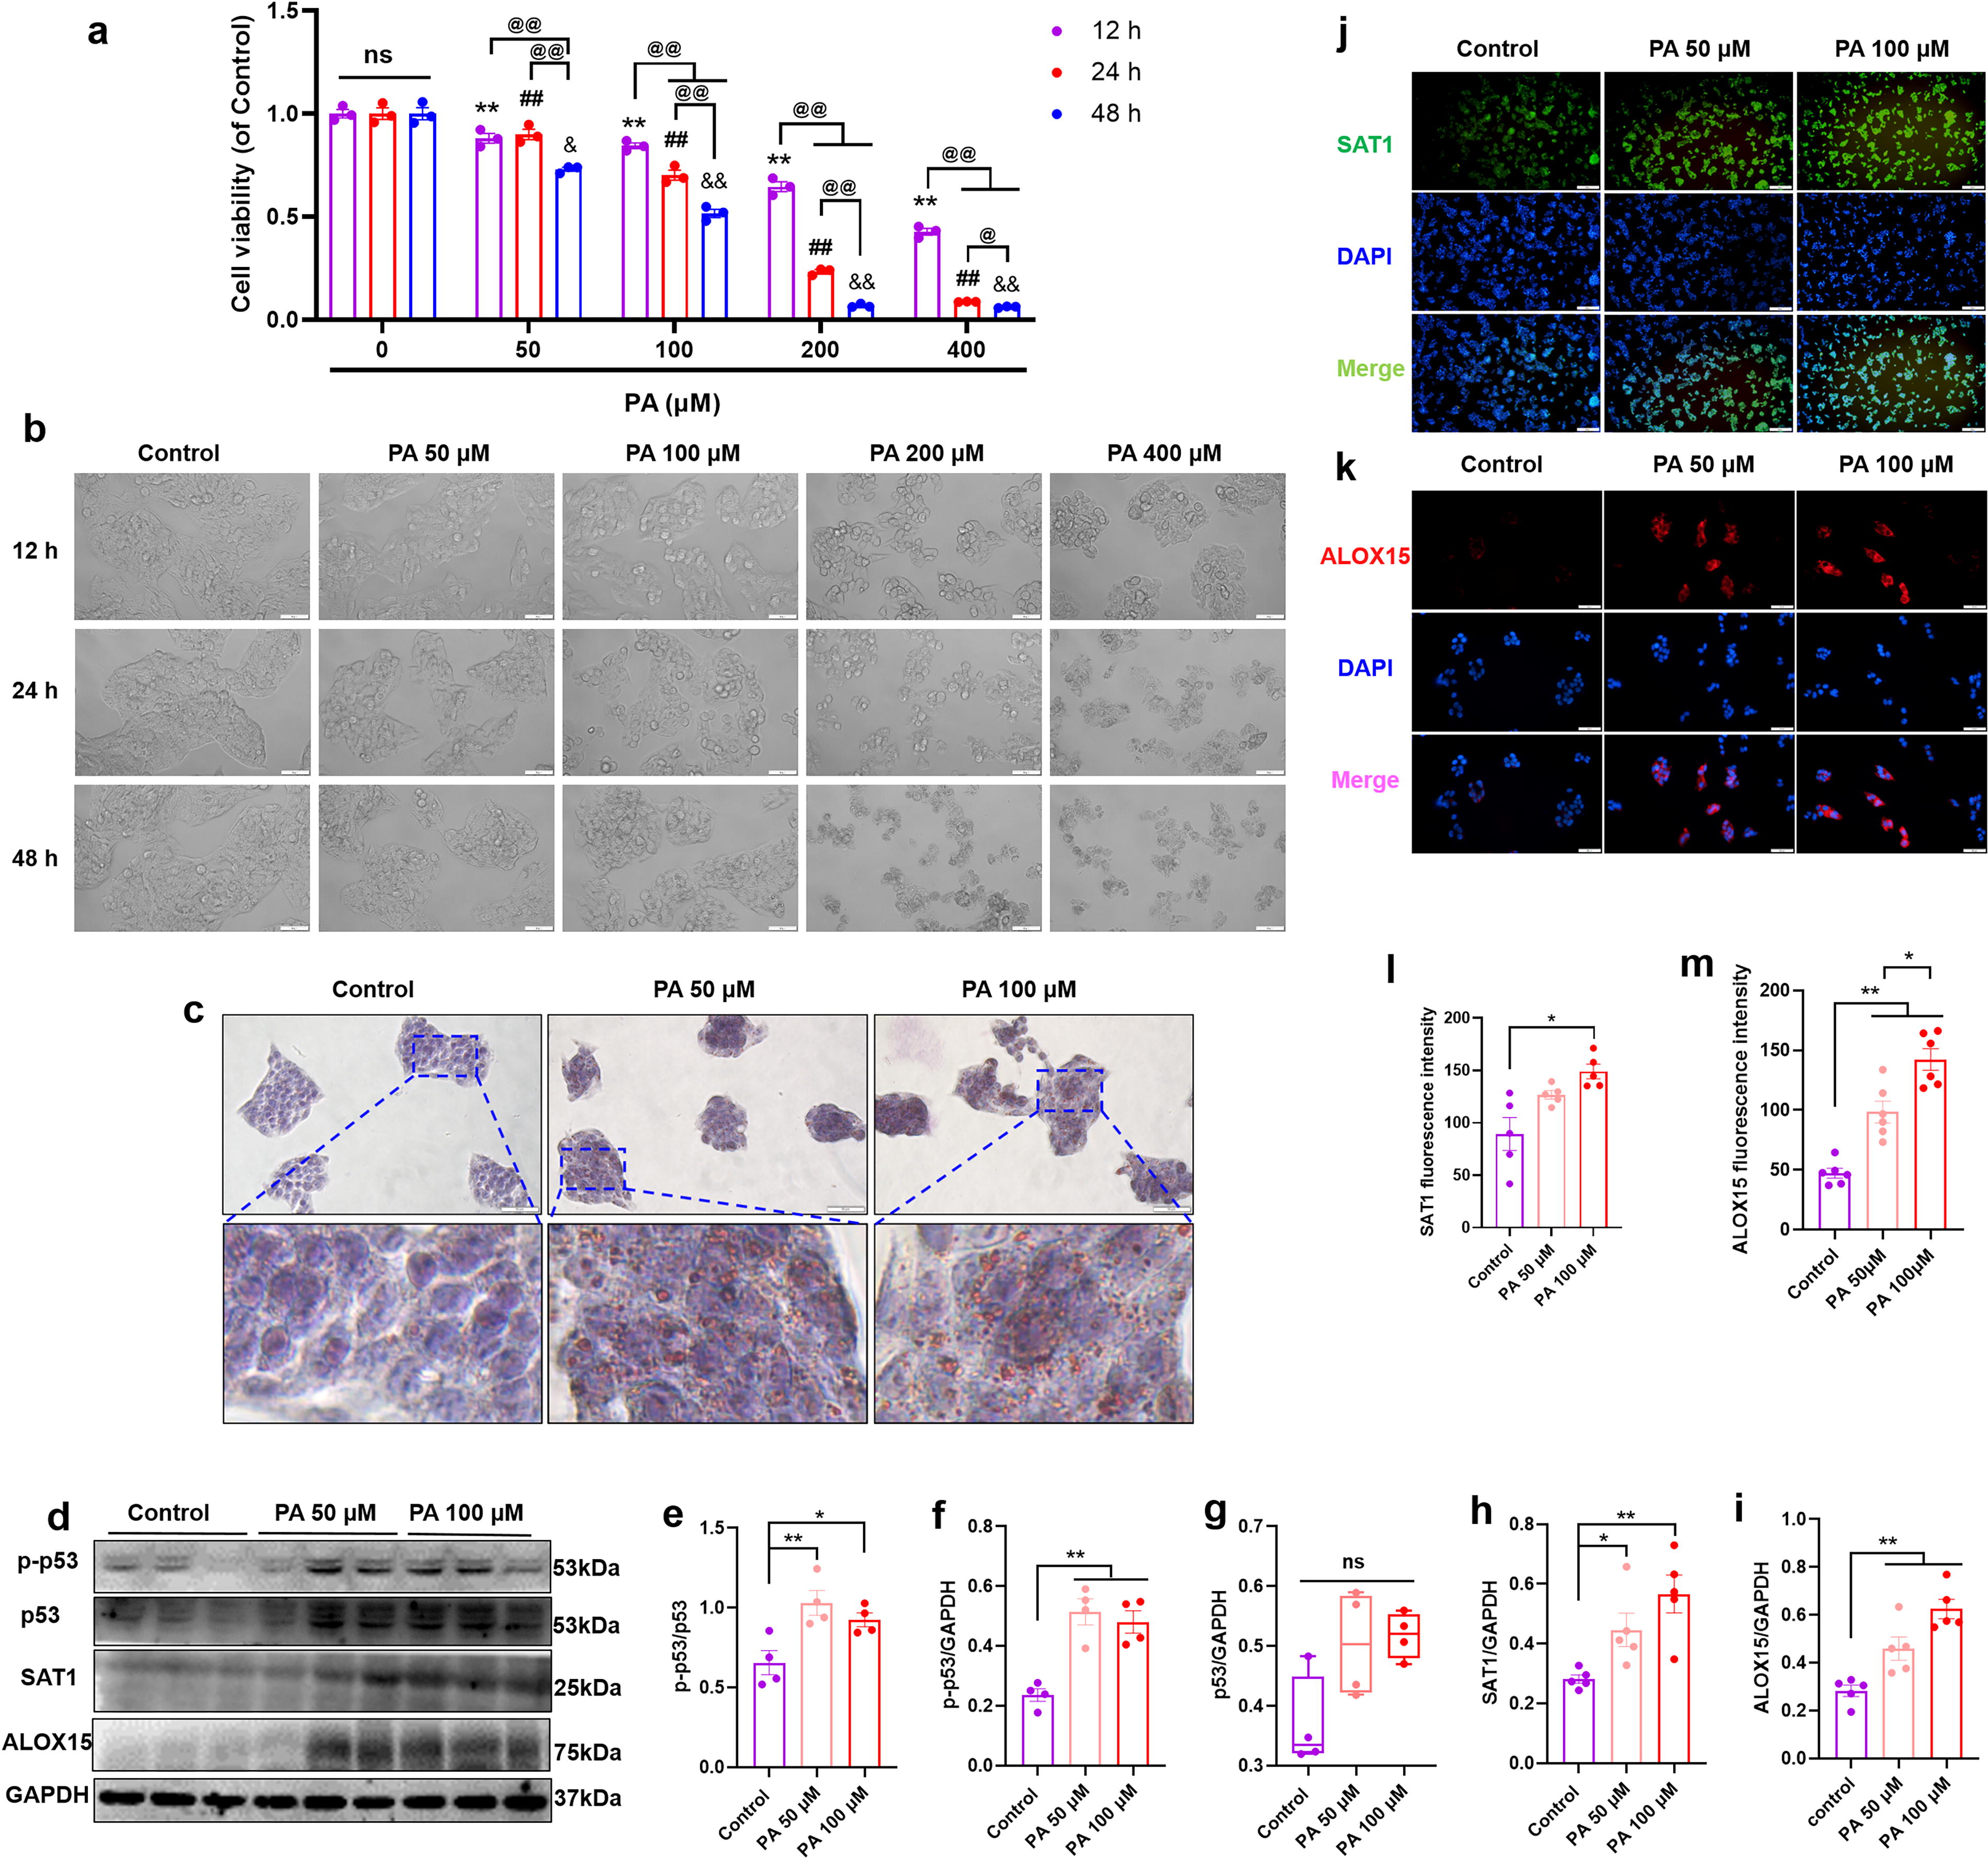
To gain insight into the molecular mechanism underlying ALOX15-mediated lipid accumulation, a palmitic acid (PA)-induced HepG2 cell model was used. The HepG2 cells were exposed to different concentrations (50, 100, 200, 400 μmol/L) of PA for 12, 24, and 48 h. Subsequently, cell viability was detected using methylthiazolyldiphenyl tetrazolium (MTT) assay. As shown in Figure 3A, PA-induced lipotoxicity was increased with the concentration and incubation time. The HepG2 cells were observed under a brightfield microscope, and we found that PA significantly affect the number and morphology of the HepG2 cells (Fig. 3B). As shown by oil red O staining, more lipid droplet accumulation was noted when HepG2 cells were treated with PA (Fig. 3C). WB assay was performed to measure the expression of ALOX15 and its upstream regulators p53 and SAT1, the results showed that an increased expression of phosphorylated p53 (p-p53, Fig. 3D–F, p < 0.05), SAT1 (Fig. 3D and H, p < 0.05), and ALOX15 (Fig. 3D and I, p < 0.01) was observed in PA-treated HepG2 cells. Similarly, immunocytochemistry revealed that PA stimulation increased the fluorescence intensity of SAT1 (Fig. 3J and L, p < 0.05) and ALOX15 (Fig. 3K and M, p < 0.01).
Overexpression of ALOX15 induces the activation of PPARγ/CD36 pathway and aggravates lipid accumulation in PA-stimulated HepG2 cells
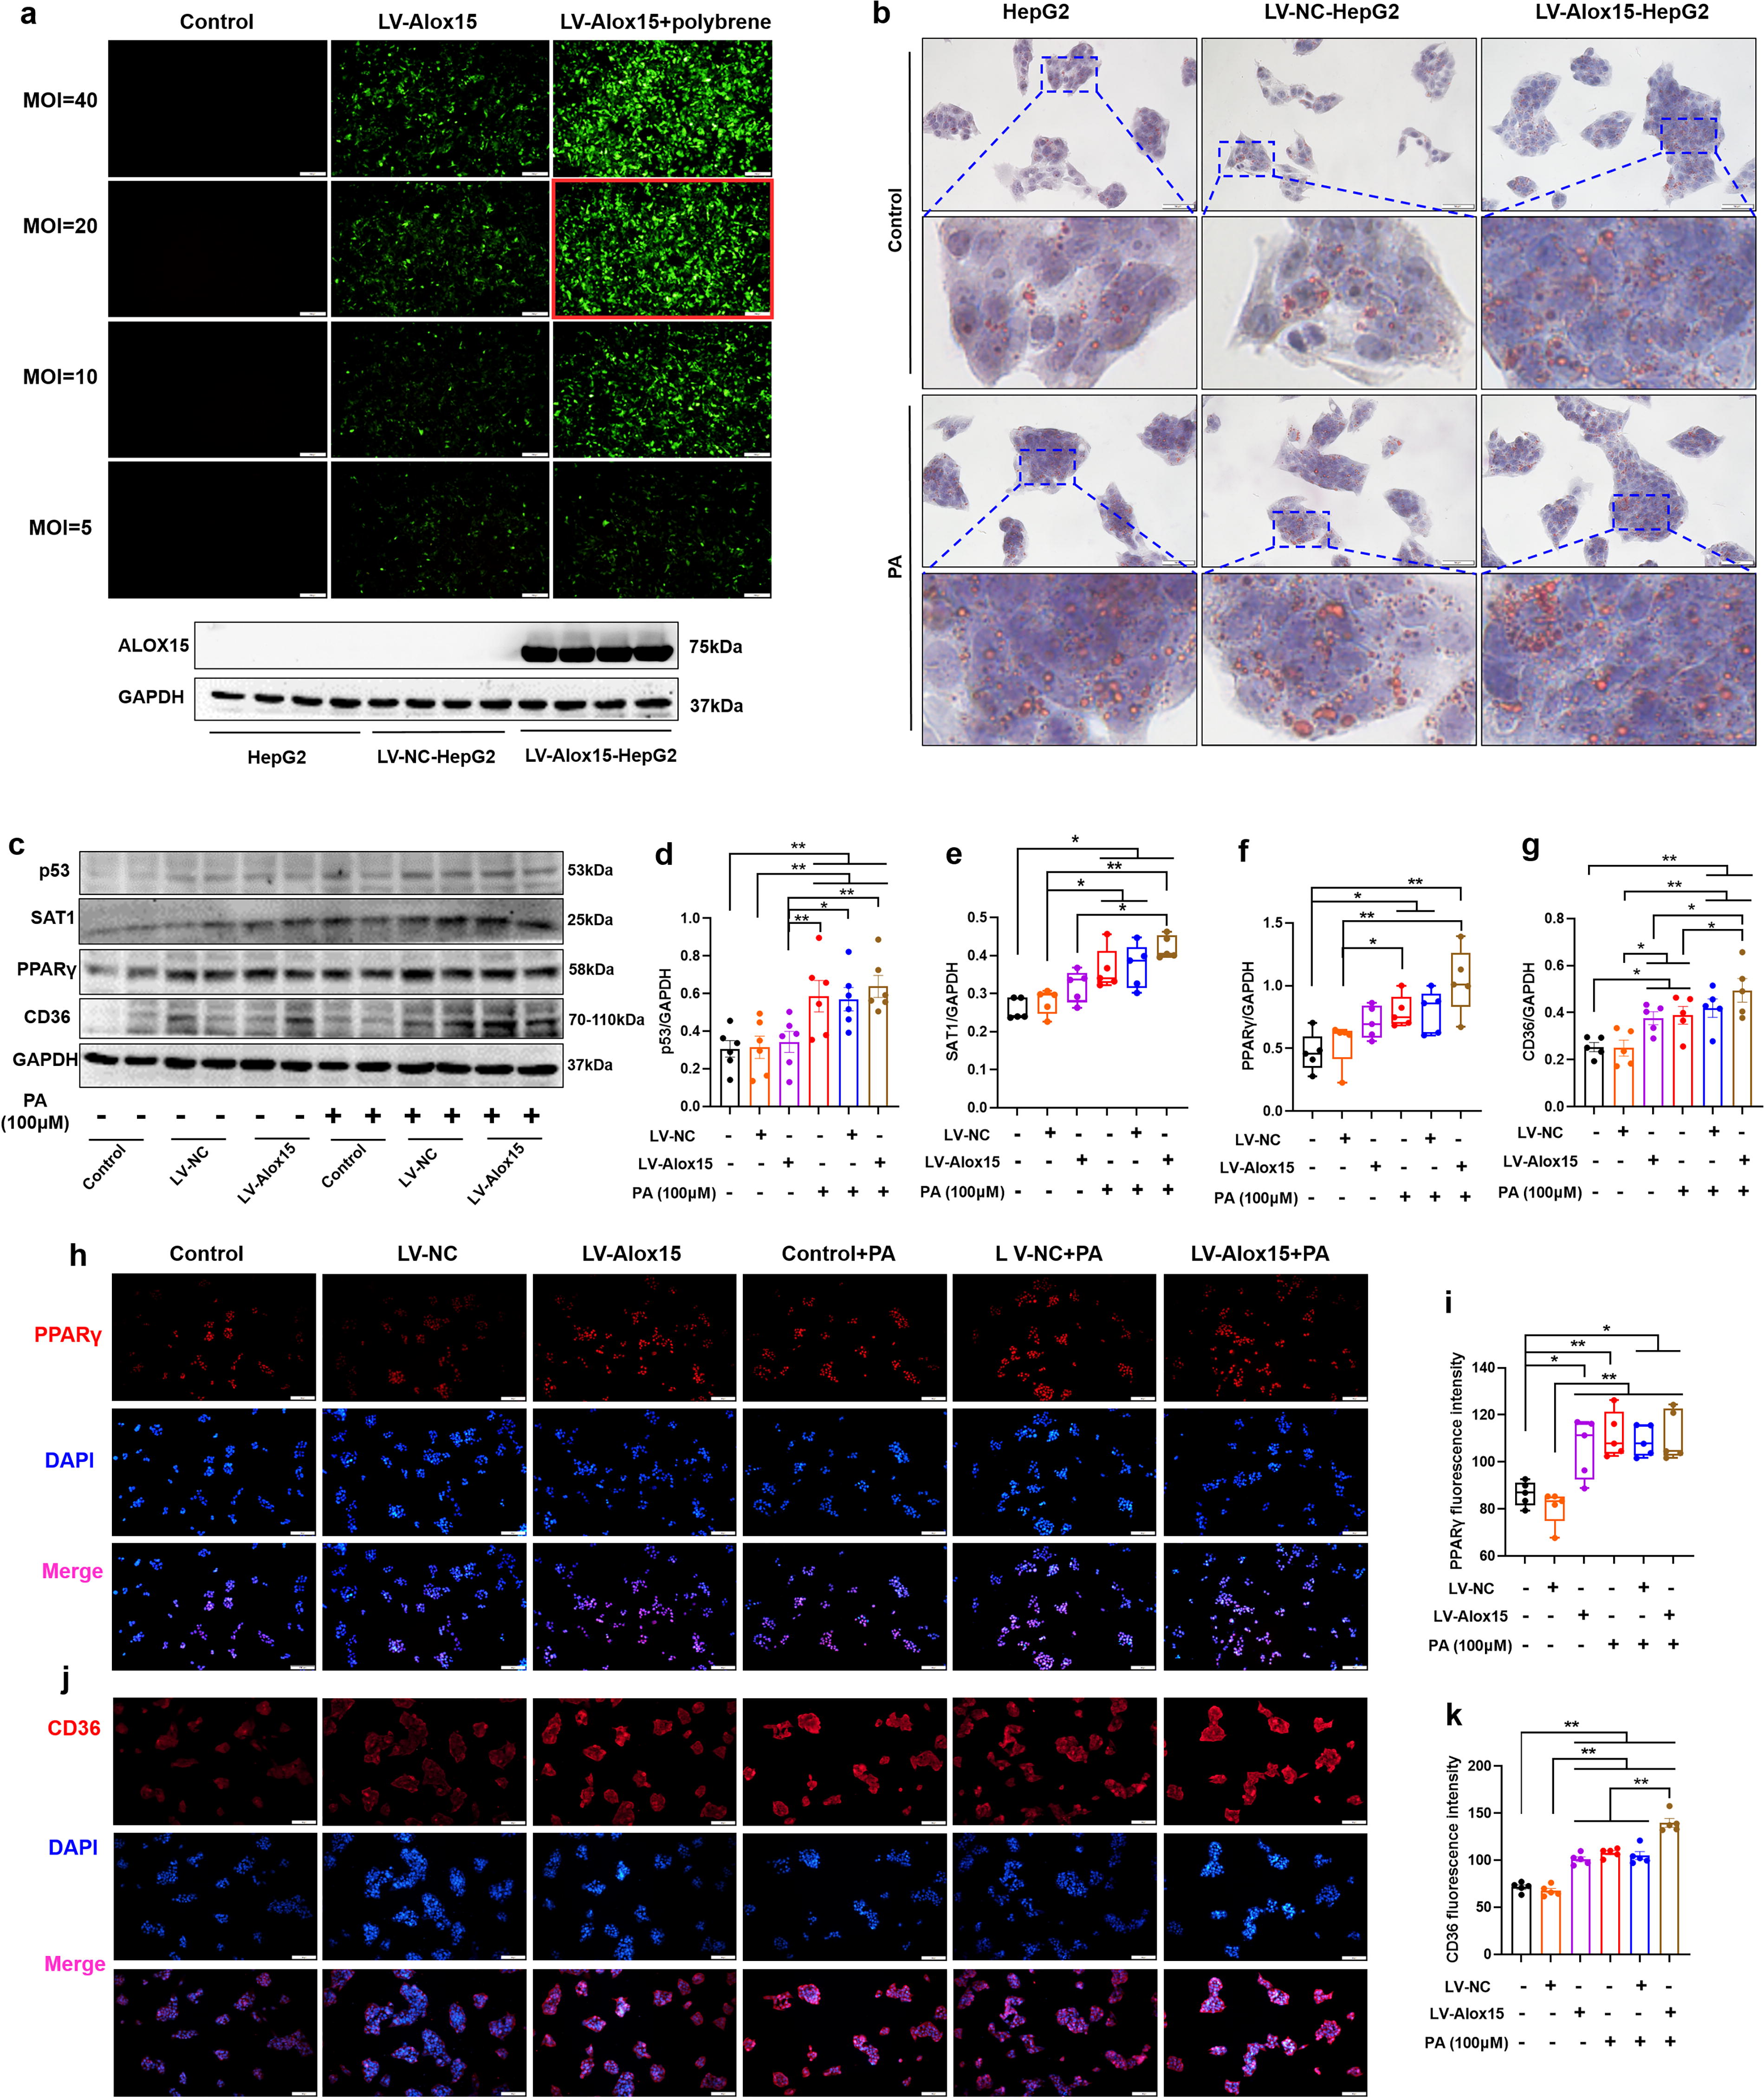
To better understand the effects of ALOX15 upregulation on lipid accumulation, HepG2 cells were transfected with lentiviral vectors expressing Alox15 gene and a scrambled fragment as negative control, and the transfection efficiency was verified by fluorescence microscope tracking green fluorescent protein and WB (Fig. 4A). Oil red O staining was performed to evaluate the effect of ALOX15 overexpression, and we found that ALOX15 overexpression not only induced lipid droplet accumulation like PA, but also aggravated PA-induced lipid accumulation (Fig. 4B). WB and immunocytochemistry results showed that ALOX15 overexpression alone promotes the expression of PPARγ (Fig. 4H, I, p < 0.05) and CD36 (Fig. 4C, G, H, and K, p < 0.05) in HepG2 cells, but did not affect the expression of p53 (Fig. 4C, D) and SAT1 (Fig. 4C and E). In addition, ALOX15 overexpression heightened PA-induced upregulation of CD36 (Fig. 4C, G, J, and K, p < 0.05). These results confirm that ALOX15 overexpression induces the activation of PPARγ/CD36 pathway and aggravates lipid accumulation in PA-stimulated HepG2 cells.
Knockdown of ALOX15 mitigates lipid accumulation in PA-stimulated HepG2 cells
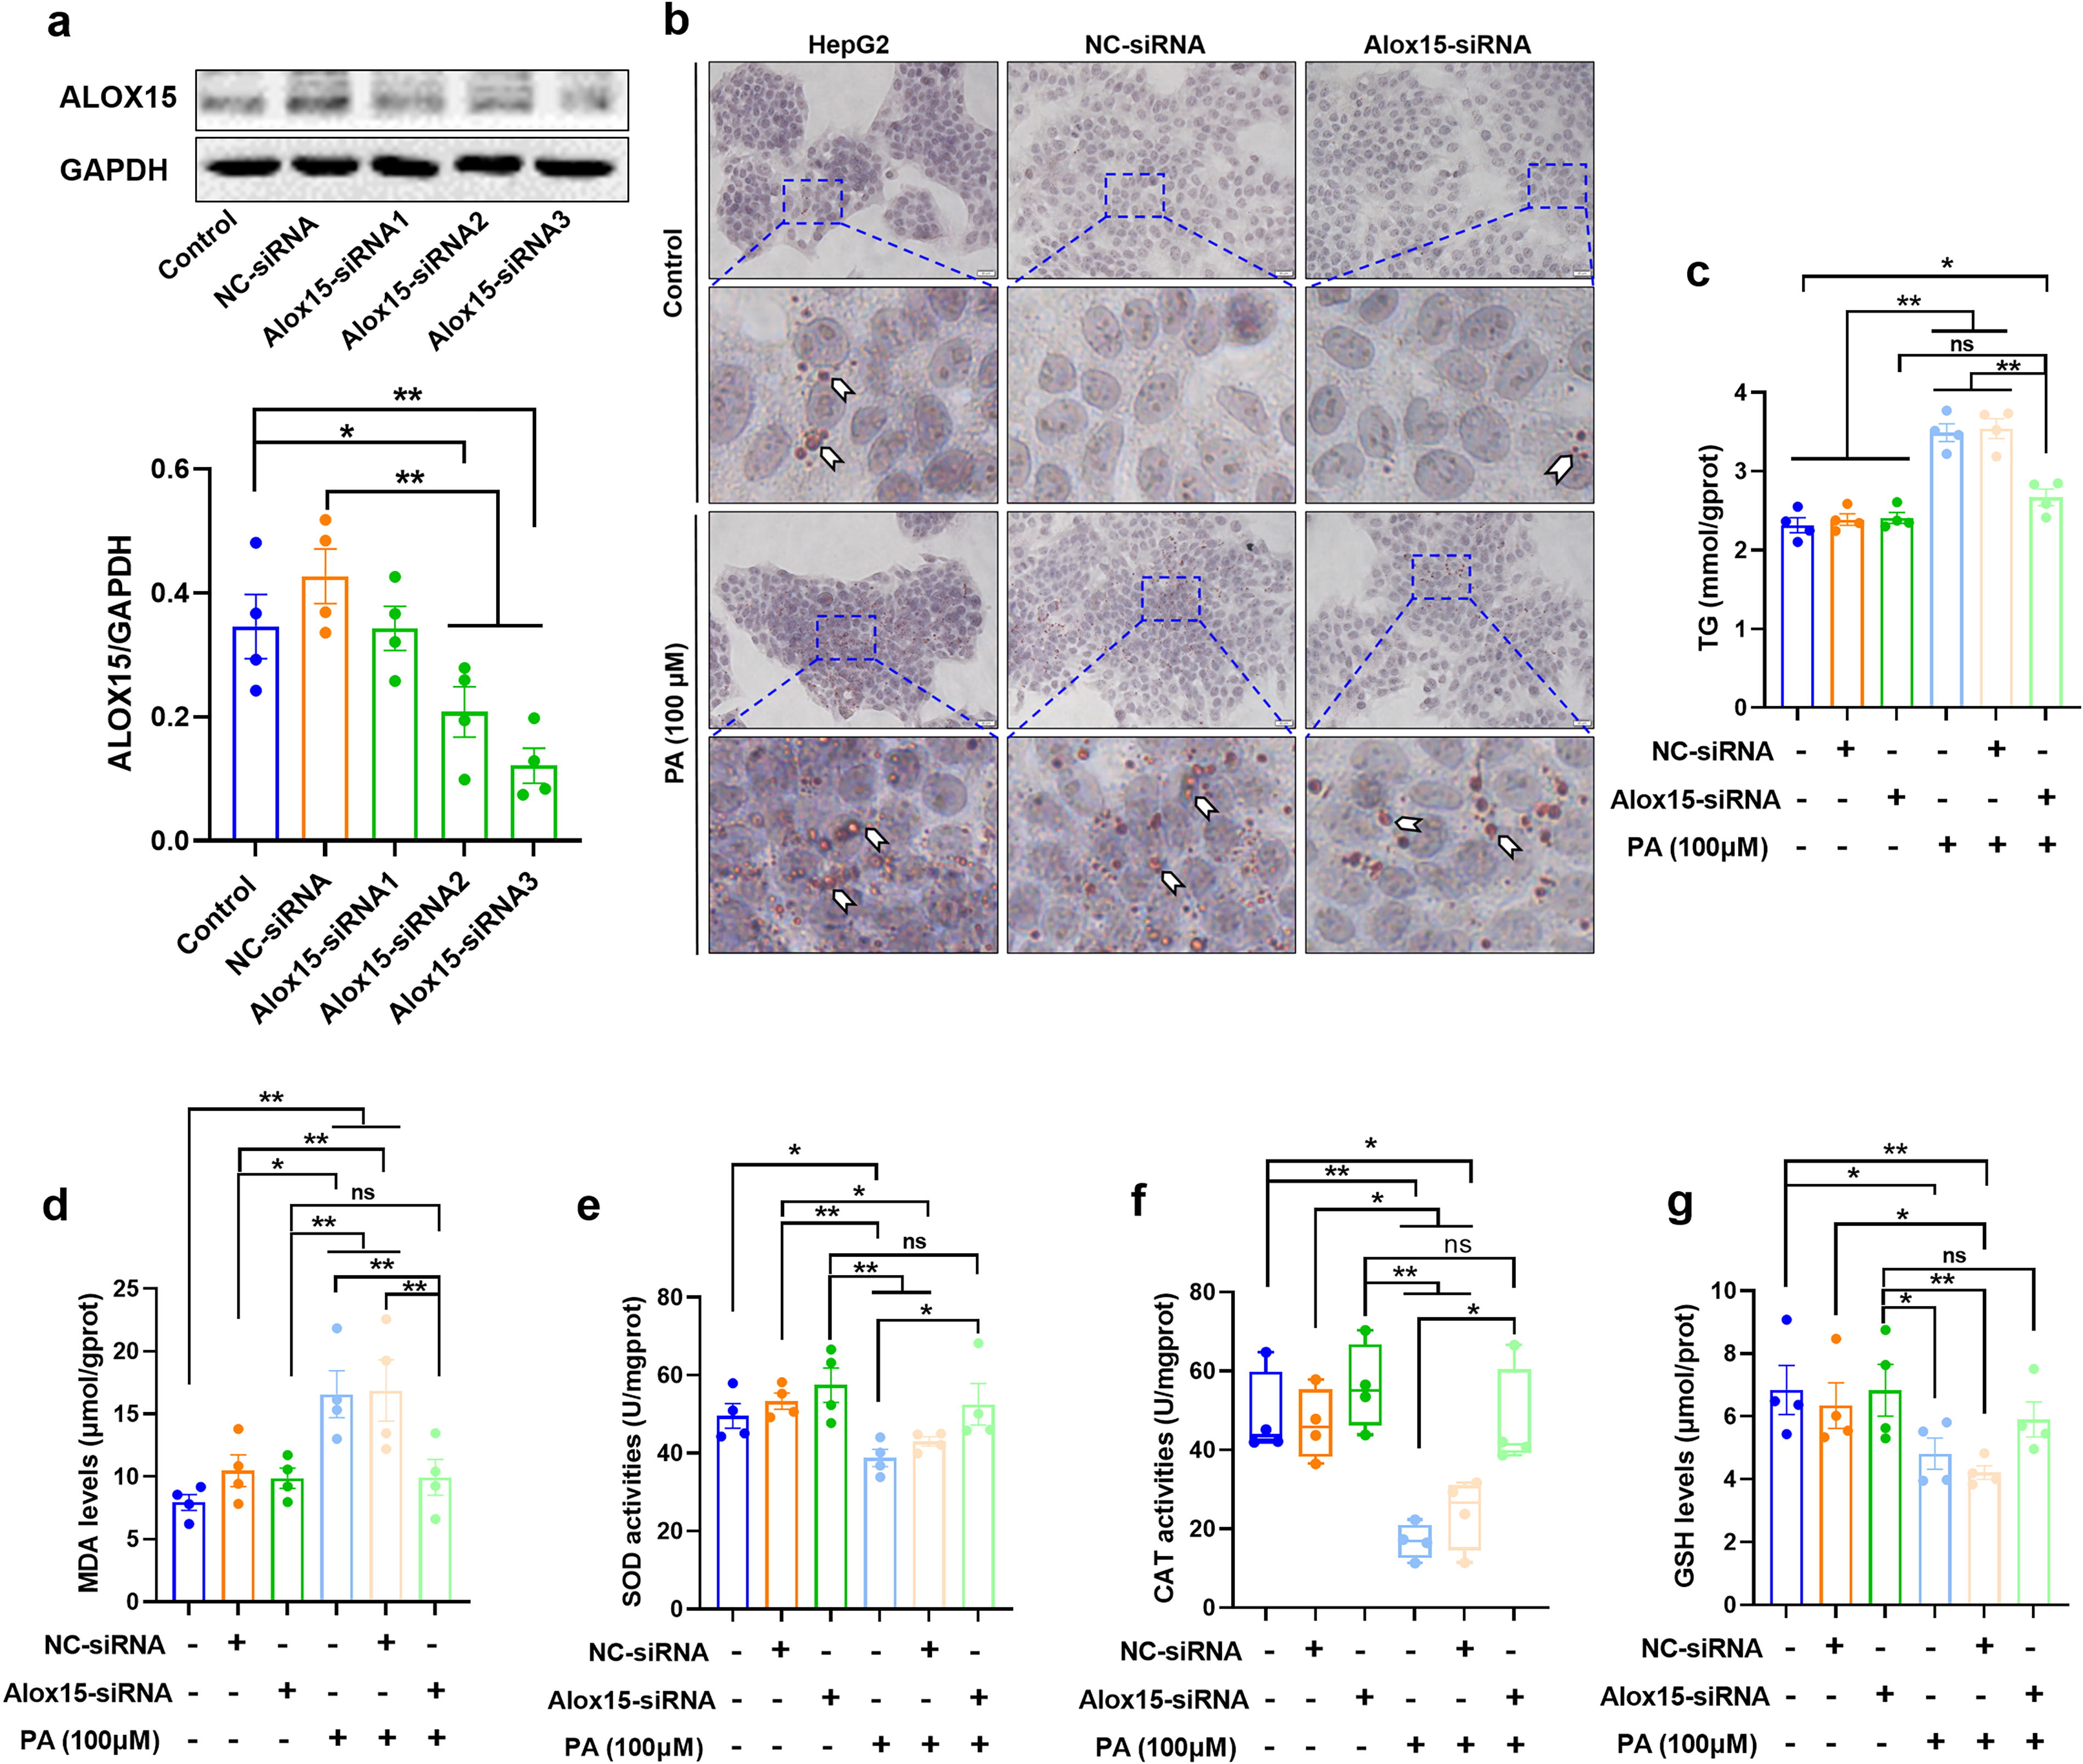
To further examine the role of ALOX15 in lipid accumulation, HepG2 cells were transfected with small interfering RNA (siRNA) targeting ALOX15, and a scrambled fragment as negative control (NC-siRNA). Notably, Alox15-siRNA3 achieved a substantial reduction in the protein expression of ALOX15 (Fig. 5A, p < 0.01) and was used for further experiments. Oil red O staining revealed that, in the absence of PA, siRNA-mediated ALOX15 knockdown did not result in the formation of lipid droplets in HepG2 cells (Fig. 5B). However, when the HepG2 cells were exposed to PA, Alox15-siRNA significantly mitigated the accumulation of lipids (Fig. 5B). To corroborate these findings, the TG levels were analyzed as an additional indicator of lipid accumulation in HepG2 cells, yielding results that were consistent with the oil red O staining (Fig. 5C). We also determined the alteration of oxidative stress biomarkers, including malondialdehyde (MDA) levels, superoxide dismutase (SOD) activities, catalase (CAT) activities, and GSH levels. The results showed that PA induced a significant increase in MDA levels (Fig. 5D, p < 0.01) and a marked decline in SOD activities (Fig. 5E, p < 0.05), CAT activities (Fig. 5F, p < 0.01), and GSH levels (Fig. 5G, p < 0.05) in the HepG2 cells. Alox15-siRNA alone had no impact on these biomarkers. However, in the presence of PA, Alox15-siRNA obviously reversed the increase in MDA levels (Fig. 5D, p < 0.01) and attenuated the reduction in SOD (Fig. 5E, p < 0.05) and CAT activities (Fig. 5F, p < 0.01), suggesting that the knockdown of ALOX15 significantly weakened the PA-induced lipotoxicity in the HepG2 cells.
Inhibition of PPARγ/CD36 pathway alleviates lipid accumulation in HepG2 cells caused by PA and ALOX15 overexpression
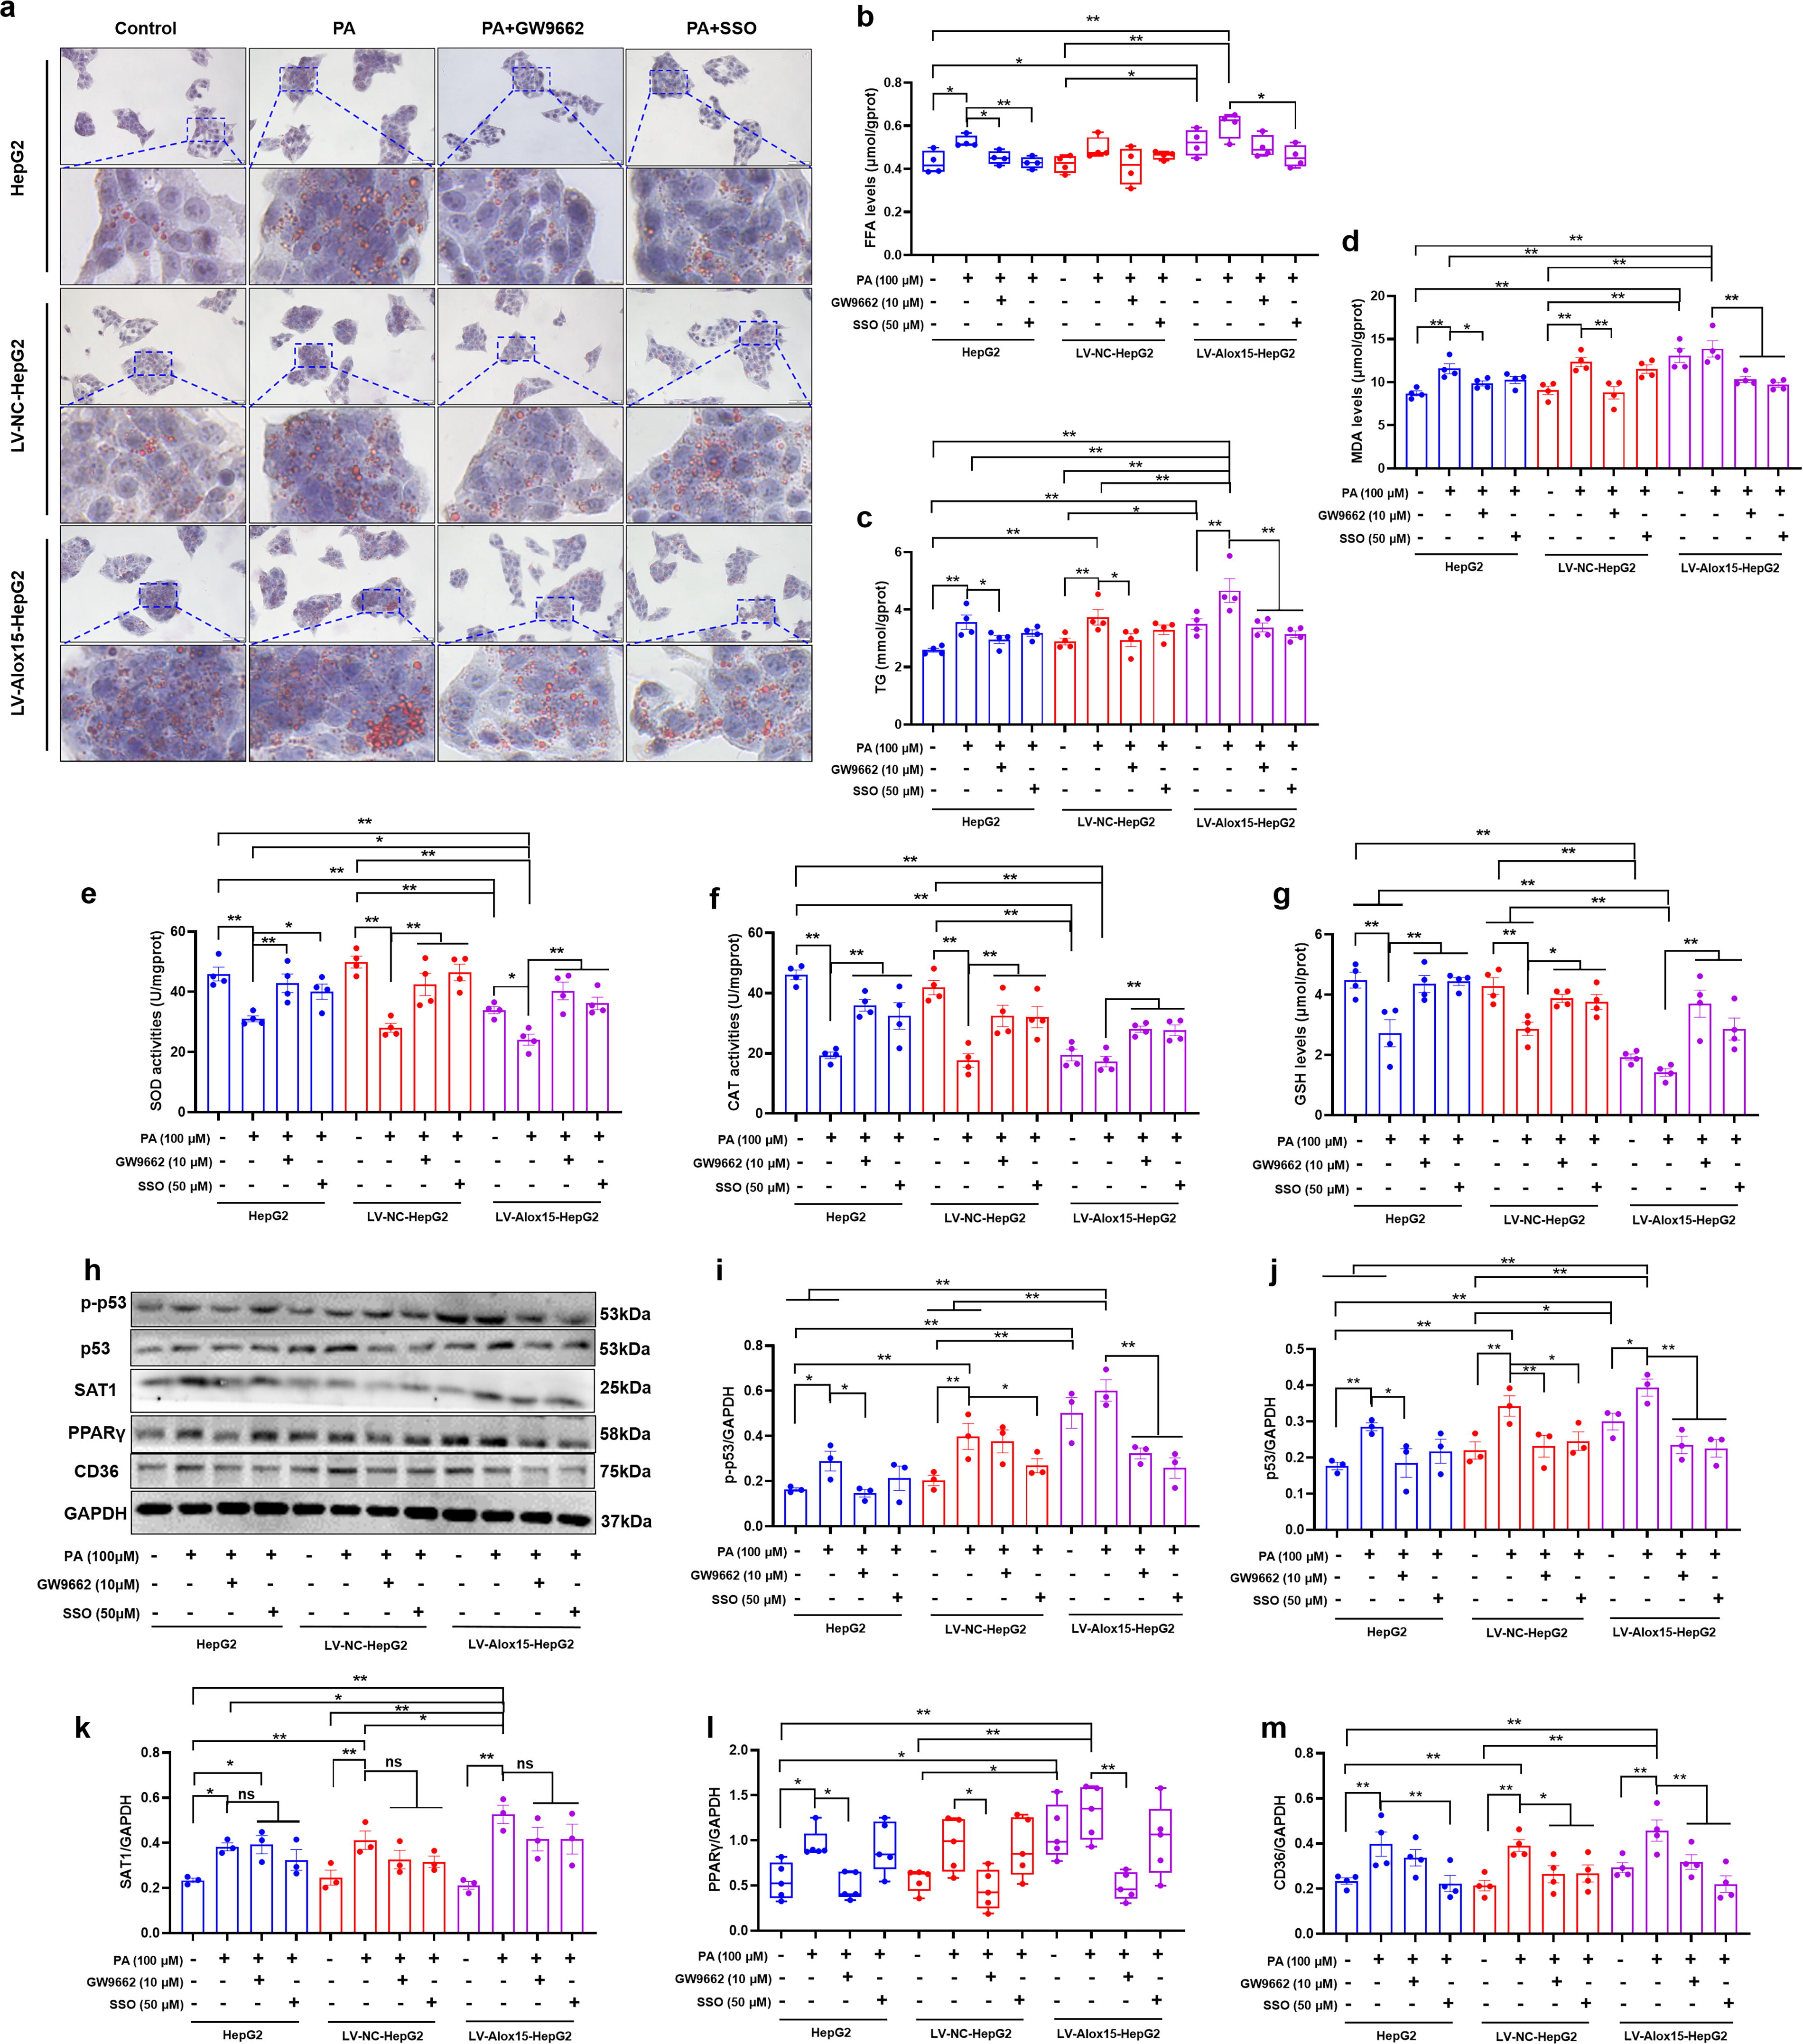
To investigate the involvement of the PPARγ/CD36 pathway in lipid accumulation mediated by ALOX15, we utilized GW9662 (a PPARγ antagonist, 10 μmol/L) and sulfosuccinimidyl oleate sodium (SSO, an irreversible inhibitor of CD36, 50 μmol/L) in PA-induced HepG2, LV-NC-HepG2, and LV-Alox15-HepG2 cells. Oil red O staining confirmed that both agents reversed lipid droplet deposition triggered by PA and ALOX15 overexpression (Fig. 6A). Considering that the main feature of MASLD is the accumulation of free fatty acid (FFA) and TG in the liver (Rao et al., 2023), we detected the level of FFA and TG in the HepG2 cells subjected to PA and ALOX15 overexpression. The results demonstrated that ALOX15 overexpression exacerbated PA-induced increases in the levels of FFA (Fig. 6B, p < 0.05) and TG (Fig. 6C, p < 0.01), which was markedly mitigated by GW9662 and SSO (p < 0.01). We also determined the biomarkers of oxidative stress reflecting lipotoxicity. The results showed that, in the absence of PA, the overexpression of ALOX15 induced a significant increase in MDA levels (Fig. 6D, p < 0.01), and a remarkable decline in SOD activities (Fig. 6E, p < 0.01), CAT activities (Fig. 6F, p < 0.01), and GSH levels (Fig. 6G, p < 0.01) in the HepG2 cells. The heightened oxidative stress due to ALOX15 overexpression was further worsened by PA exposure, evidenced by further alterations in SOD activities (Fig. 6E, p < 0.01) in LV-Alox15-HepG2 cells. Conversely, the administration of GW9662 and SSO notably mitigated the lipotoxicity induced by both PA and ALOX15 overexpression (Fig. 6D–G). WB assay unveiled that GW9662 and SSO evidently inhibited the upregulation of phosphorylated p53 (Fig. 6H, I, p GW9662 < 0.01, p SSO < 0.01) and total p53 (Fig. 6H and J, p GW9662 < 0.01, p SSO < 0.01) in PA-induced LV-Alox15-HepG2 cells, without affecting SAT1 expression (Fig. 6H and K). In addition, GW9662 decreased the expression of PPARγ (Fig. 6H and L, p < 0.01) and CD36 (Fig. 6H and J, p < 0.01), while SSO only decreased the expression of CD36 (Fig. 6H and M, p < 0.01). Collectively, these findings suggest that inhibiting the PPARγ/CD36 pathway alleviates lipid accumulation in HepG2 cells caused by PA and ALOX15 overexpression.
Liraglutide improves fatty liver in the T2DM mice by suppressing the ALOX15/PPARγ/CD36 pathway
Due to the close relationship between T2DM and MASLD, concerns have been raised regarding the efficacy of antidiabetic drugs for the treatment of MASLD. Our previous studies have also demonstrated that liraglutide, a novel GLP-1RA drug for T2DM and obesity, can effectively reduce liver damage, liver ballooning, and lipid droplet deposition in T2DM mice (Guo et al., 2023). However, the precise mechanism by which the GLP-1RA improves MASLD remains incompletely understood. In this study, we aimed to investigate whether liraglutide exerts its beneficial effects on MASLD through the modulation of ALOX15 expression. As depicted in Figure 7A and B, liraglutide visibly attenuated elevated TG (p < 0.01) and FFA levels (p < 0.05) in the liver of T2DM mice, indicating its potential to inhibit lipid accumulation. Furthermore, the treatment with liraglutide significantly reversed the expressions of ALOX15 (Fig. 7C and F, p < 0.01), as well as its upstream regulator SAT1 (Fig. 7C and E, p < 0.01) and downstream targets PPARγ (Fig. 7C and G, p < 0.05) and CD36 (Fig. 7C and H, p < 0.01). The expression of ALOX15 detected by immunohistochemistry was consistent with that in WB analysis (Fig. 7I, J, p < 0.01). In addition, liraglutide also restored the expression of FAS (Fig. 7C, D, p < 0.05) in the liver of T2DM mice. Collectively, these results suggest that liraglutide may alleviate hepatic lipid accumulation in HFD- and STZ-induced T2DM mice by suppressing the ALOX15/PPARγ/CD36 pathway.
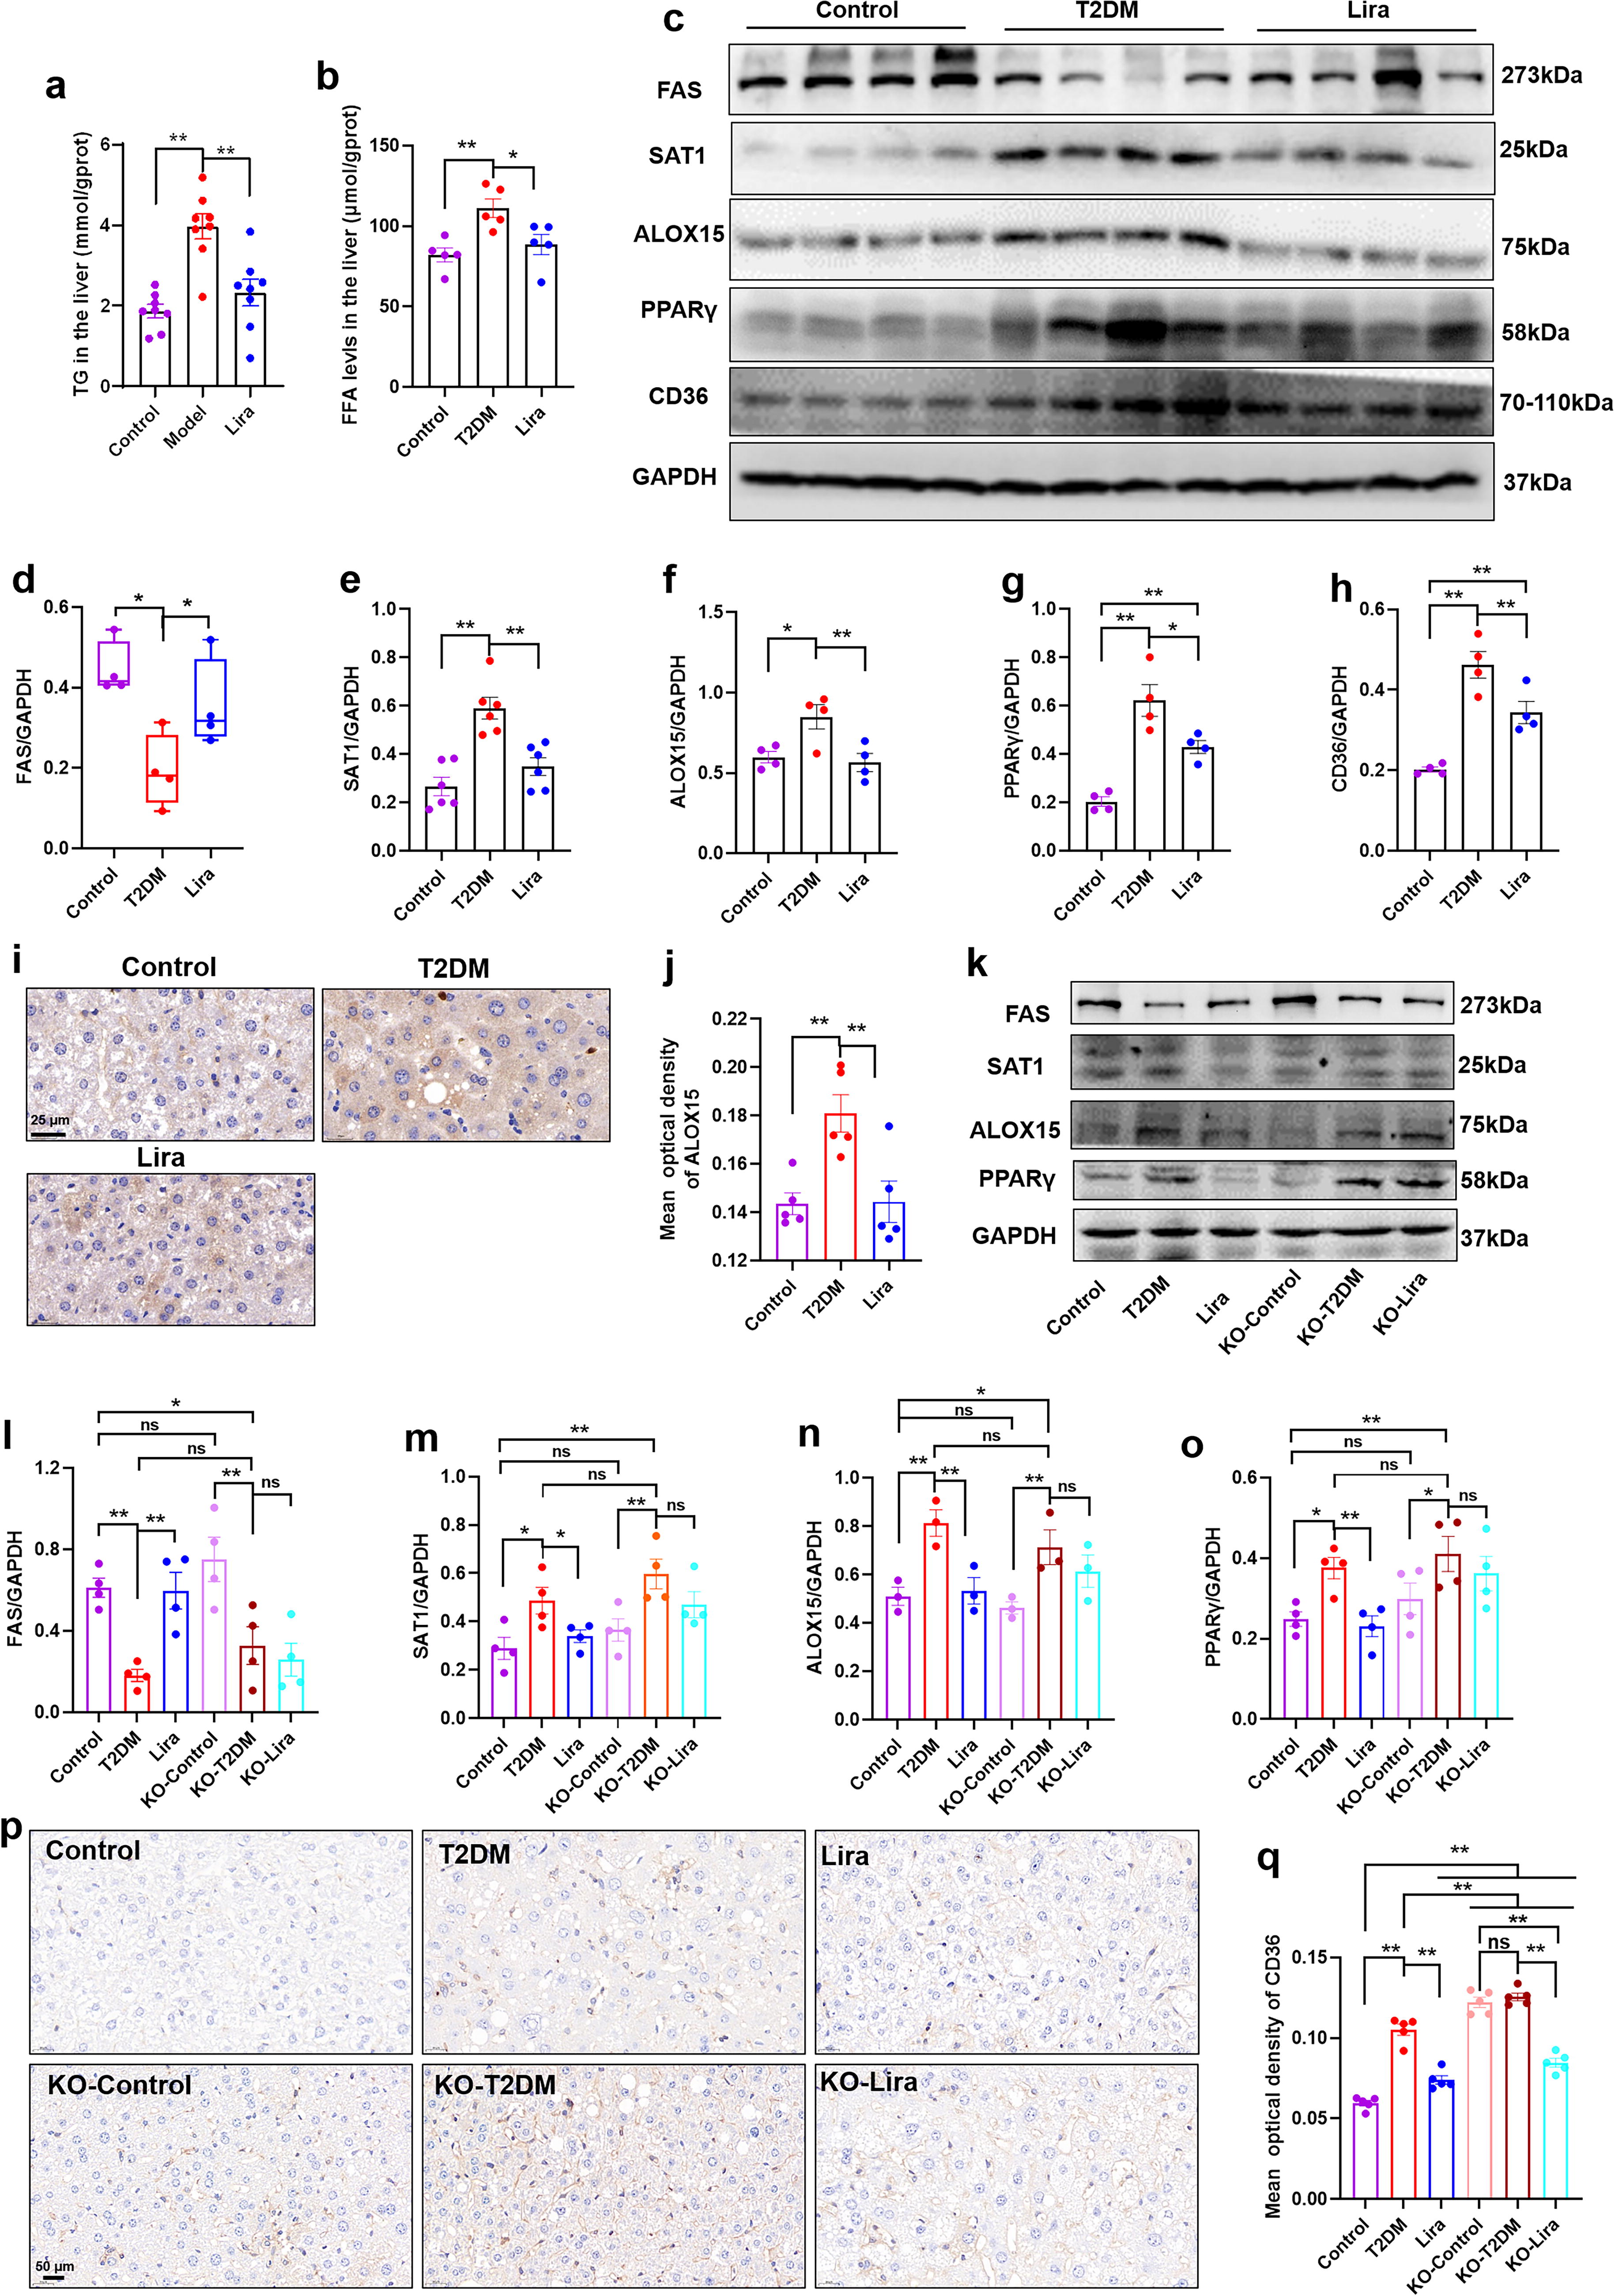
GLP-1RAs typically exert their physiological role by activating GLP-1R. In this study, the Glp1r KO mice with or without T2DM were utilized to assess the impact of liraglutide. In chow diet-fed mice, Glp1r KO did not affect the expression of FAS, SAT1, ALOX15, and PPARγ (Fig. 7K–O). In addition, Glp1r KO did not exacerbate the effects of HFD and STZ (Fig. 7K–O). However, the effect of liraglutide on the expression of FAS (Fig. 7K, L), SAT1 (Fig. 7K and M), ALOX15 (Fig. 7K and N), and PPARγ (Fig. 7K and O) in the liver of T2DM mice was abolished by Glp1r KO, as confirmed by WB analysis. These findings indicate that liraglutide suppresses ALOX15-mediated lipid accumulation in a GLP-1R-dependent manner.
The immunohistochemistry analysis revealed that Glp1r deficiency not only led to an increase in CD36 expression in the liver of control mice (Fig. 7P, Q, KO-control vs. control, p < 0.01), but also further enhanced the expression of CD36 in T2DM mice (Fig. 7P, Q, KO-T2DM vs. T2DM, p < 0.01). There was no significant difference in CD36 expression between KO-control and KO-T2DM mice. Liraglutide reduced CD36 expression in the livers of Glp1r KO T2DM mice (Fig. 7P, Q, KO-Lira vs. KO-T2DM, p < 0.01), suggesting that liraglutide can reduce the expression of CD36 through a mechanism independent of the GLP-1R.
Discussion
MASLD is defined as excessive fat, in the form of TG, and accumulates in the liver without alcohol consumption. The pathogenesis of MASLD is multifaceted, encompassing various factors such as diet, lifestyle, insulin resistance, and gut microbiota disturbances. Insulin resistance and hyperinsulinemia play a central role in the pathogenesis of MASLD, leading to fatty acid accumulation, which in turn causes lipid toxicity and inflammation, resulting in cell damage and progenitor cell activation, ultimately leading to fibrosis and disease progression (Colosimo et al., 2023). The growing prevalence of MASLD not only diminishes patients’ quality of life and shortened life expectancy but also imposes a significant economic burden on families and society. The treatment options for MASLD are very limited, with Rezdiffra being the sole therapy approved by the FDA. Consequently, it is urgent to identify novel therapeutic targets and develop effective treatment strategies and drugs.
ALOX15, as a member of lipoxygenase families, catalyzes the lipid peroxidation of PUFA, phospholipids, and plasma lipoproteins. ALOX15 has been shown to induce ferroptosis and inflammation, and therefore plays an important role in metabolic syndrome, including atherosclerosis, diabetes, and obesity (Singh and Rao, 2019). Alox15 is markedly upregulated in livers from ApoE−/−mice, which spontaneously develop MASLD secondary to hyperlipidemia; ALOX15 KO significantly reduced serum ALT levels, decreased hepatic steatosis, inflammation, and macrophage infiltration, and attenuated glucose intolerance and HFD-induced insulin resistance in the ApoE−/−mice (Martinez-Clemente et al., 2010). The studies disclosing the role of ALOX15 in MASLD are quite rare, and the mechanisms involved are unclear. In the present study, we utilized real-time PCR, WB analysis, and immunohistochemistry to assess hepatic ALOX15 expression in mice with T2DM and MASLD. Our observations revealed a significant increase in ALOX15 expression, indicating that its upregulation may contribute to the development of fatty liver in these mice. The findings of this study have important implications for understanding the role of ALOX15 in the pathogenesis of fatty liver disease in T2DM.
As shown by untargeted metabolomics, there was no significant difference in the levels of ALOX15 substrates between the control and T2DM group. Nevertheless, arachidonic acid-derived metabolites, 12(S)-HPETE and 15(S)-HETE catalyzed by ALOX15, were markedly elevated in the T2DM mice. In the mouse, ALOX15 produces predominantly 12(S)-HPETE and small amounts of 15(S)-HPETE (Singh and Rao, 2019). Using untargeted metabolomics, we identified the presence of 12-HPETE while failing to detect 15-HPETE, so their relative concentrations align with previously published research. Surprisingly, the level of 15(S)-HETE converted by 15(S)-HPETE was much higher than that of 12(S)-HPETE, suggesting the possibility of enzymes other than ALOX15 contributing to the formation of 15(S)-HETE. The ALOX15 enzyme and its multiple metabolites derived from different PUFAs are implicated in a variety of diseases. Elevated 15(S)-HPETE in cardiomyocytes has been reported to promote the ubiquitination degradation of PGC1α, leading to mitochondrial dysfunction and exacerbating myocardial I/R injury. Myocardial-specific KO or pharmacological inhibition of ALOX15 can reverse the upregulation of 15-HPETE and reduce myocardial I/R-induced heart damage (Cai et al., 2023). Linoleic acid-derived 13(S)-HODE generated by ALOX15 is associated with hepatocyte apoptosis induced by chronic alcohol exposure; however, ALOX15 KO or inhibition significantly attenuates alcohol-induced oxidation imbalance, lipid accumulation, and liver injury (Zhang et al., 2017). It is likely that ALOX15 affects the progression of MASLD in T2DM mice through 12(S)-HETE and 15(S)-HETE.
The ligand-activated transcription factor PPAR, comprising PPARα, PPARβ/δ, and PPARγ isoforms, is considered indispensable for the regulation of metabolic processes in the liver and other organs. They are activated by endogenous ligands such as fatty acids, eicosanoids, and oxidized phospholipids. PPAR signaling regulates lipid metabolism in MASLD pathogenesis through transcriptome modulation of genes related to fatty acid synthesis, degradation, and transport. In the present study, RNA sequencing revealed an upregulation of PPARγ and downregulation of PPARδ in the liver of T2DM mice, while no significant difference was observed in PPARα expression. Several studies have shown that ALOX15 metabolites 15(S)-HETE and 12(S)-HETE can function as a PPARγ ligand (Singh and Rao, 2019; Sun et al., 2015). Therefore, we hypothesized that ALOX15 may affect lipid metabolism via the activation of PPARγ. Among the target genes of PPAR signaling pathway, hepatic expressions of fatty acid uptake-related CD36 and FATP1 (encoded by Slc27a1), β-oxidation-related CPT1a and CPT1c, and fatty acid synthesis-related FAS, SCD1, and ACC were significantly increased in T2DM mice, as confirmed by RNA sequencing, real-time PCR, and WB analysis. The hepatic expressions of VLDL secretion-related ApoB and MTTP were not significantly altered. These findings indicate an increase in fatty acid uptake and β oxidation as well as a decrease in fatty acid synthesis. Therefore, it is easy to deduce that increased fatty acid uptake predominates in lipid accumulation, contributing to the development of MASLD in the HFD- and STZ-induced T2DM mice. What is more, ALOX15-mediated activation of PPARγ/CD36 pathway may play a role in increased fatty acid uptake. The abnormal fatty acid synthesis and β oxidation may be attributed to the excessive influx of FFA into hepatocytes during the early stage of MASLD, leading to various hormonal and metabolic changes that compensatively reduce hepatic lipid accumulation.
To further confirm the role of ALOX15 in the development of MASLD, a PA-induced HepG2 cell model was used. An obvious lipid droplet deposition and increments in the expression of ALOX15, p53, and SAT1 were observed in PA-stimulated HepG2 cells. A growing number of evidence shows that the tumor suppressor factor p53 plays an important role in MASLD pathogenesis by enhancing lipolysis and inhibiting lipogenesis (Yan et al., 2018). Thus, the increased β oxidation and decreased fatty acid synthesis in the liver of T2DM mice may result from the activation of p53. Several studies have demonstrated that the induction of p53/SAT1 pathway can lead to ALOX15 upregulation (Liu et al., 2023). To gain insight into the mechanism underlying ALOX15-mediated lipid accumulation, the HepG2 cells were transfected with lentiviral vectors expressing Alox15 gene or siRNA targeting ALOX15. A series of experiments indicated that ALOX15 overexpression not only induced lipid droplet accumulation like PA but also aggravated PA-induced lipid accumulation and augments in the expression of PPARγ and CD36. These findings suggest that ALOX15 overexpression induces the activation of PPARγ/CD36 pathway and exacerbates lipid accumulation in PA-stimulated HepG2 cells. On the contrary, the siRNA-mediated knockdown of ALOX15 remarkably reduced PA-induced lipid accumulation in the HepG2 cells, as confirmed by oil red O staining and TG quantitation. In addition, Alox15-siRNA notably attenuated the oxidative stress triggered by PA exposure. Oxidative stress, defined as an imbalance between the oxidants and antioxidants in the body, is a crucial mechanism underlying liver injury in MASLD and accelerates the progression from simple steatosis to MASH (Mohammadian et al., 2024). Increased oxidative stress has been observed in MASH patients (Castane et al., 2023), and therapies involving natural and/or synthetic antioxidants have exhibited promising outcomes (Mohammadian et al., 2024). Some phenolic compounds possessing potent antioxidant capabilities, such as curcumin, ferulic acid, and baicalein, have been confirmed to exert beneficial effects in the treatment of cancer, neurodegenerative disease, and MASLD (Calabrese et al., 2010; Catino et al., 2015; Di Rosa et al., 2020; Li et al., 2022). Notably, baicalein also acts as a selective inhibitor of ALOX15 (He et al., 2023), further validating our experimental findings.
Documented evidence suggests that ALOX15-generated endogenous PPARγ ligands enhance CD36 transcription in macrophages (Huang et al., 1999), involved in the pathogenesis of atherosclerosis (Kotla et al., 2014) and hypertension (Kriska et al., 2014). However, the role of the ALOX15/PPARγ/CD36 signaling pathway in MASLD remains elusive. To elucidate the involvement of the PPARγ/CD36 pathway in ALOX15-mediated lipid accumulation, PPARγ antagonist GW9662 and CD36 inhibitor SSO were utilized in HepG2 cells transfected with or without ALOX15 lentivirus. Through oil red O staining and the detection of FFA and TG levels, we found that GW9662 and SSO remarkably reduced hepatic lipid accumulation caused by PA exposure and ALOX15 overexpression. Lipotoxicity as measured by oxidative sress (MDA, SOD, CAT, and GSH) was also weakened by GW9662 and SSO. Taken together, the inhibition of PPARγ/CD36 pathway alleviates lipid accumulation in HepG2 cells caused by PA and ALOX15 overexpression, suggesting that ALOX15 overexpression induces lipid accumulation in PA-induced HepG2 cells by increasing fatty acid uptake regulated by the PPARγ/CD36 pathway.
The role of ALOX15 in MASLD has been established. Furthermore, we want to know whether liraglutide, a GLP-1RA that has shown potential in the treatment of MASLD, could improve MASLD by modulating ALOX15 expression. The results revealed that liraglutide significantly reduced the levels of FFA and TG and restored FAS expression in the liver of mice with T2DM and MASLD. Of note, the hepatic expression of SAT1, ALOX15, PPARγ, and CD35 in T2DM mice was markedly decreased upon liraglutide treatment. This study indicated that liraglutide may restore the compromised fatty acid synthesis and diminish the fatty acid uptake by suppressing the ALOX15/PPARγ/CD36 pathway. In this study, the Glp1r KO mice with or without T2DM were utilized to assess whether the impact of liraglutide is dependent on the activation of GLP-1R. The WB analysis revealed that there was no significant difference in the expression of FAS, SAT1, ALOX15, and PPARγ between the chow diet-fed wild-type and Glp1r KO mice. In addition, Glp1r KO did not worsen the effects of HFD and STZ. Nevertheless, the effects of liraglutide on the hepatic expression of FAS, SAT1, ALOX15, and PPARγ in T2DM mice were abolished by Glp1r KO. The results of immunohistochemistry detecting the expression of ALOX15 were consistent with WB. These findings confirm that liraglutide suppresses ALOX15-mediated lipid accumulation in a GLP-1R-dependent manner.
Interestingly, although an increase of CD36 expression was observed in Glp1r KO mice fed with chow diet, liraglutide still lowered the expression of CD36 in Glp1r KO mice induced by HFD and STZ, which means that liraglutide can reduce the expression of CD36 through a mechanism independent of the GLP-1R. As a result, liraglutide can improve MASLD through both GLP-1R-dependent and GLP-1R-independent pathways.
GLP-1RAs typically exert their physiological role by activating GLP-1R. Sometimes, the beneficial effects of GLP-1 and GLP-1RAs may not be entirely dependent on GLP-1R. In the canonical GLP-1R-dependent pathway, GLP-1 (7–36)a, the initial active form of GLP-1, binds to the GLP-1R in the target cells and subsequently activates the cyclic adenosine monophosphate (cAMP) and phosphatidylinostitol 3-kinase (PI3K) pathways (Cantini et al., 2016). GLP-1 (7–36)a is rapidly degraded by dipeptidyl peptidase-4 into GLP-1 (9–36), which has a very low affinity for the classical GLP-1R (Li et al., 2017). Recent study suggests that GLP-1 (9–36)a, once considered the cleaved inactive form of GLP-1, also has direct benefits, such as antiatherosclerosis (Lee et al., 2024), improving stroke and inhibiting neuroinflammation (Huang et al., 2020). In the absence of GLP-1R, for example, in the liver, GLP-1 (9–36) binds to translocation receptors (such as liver CD36/FAT) and be transported into the cell, thereby exerting its action (Tomas and Habener, 2010). This explains why liraglutide has the capacity to reduce hepatic CD36 expression in the T2DM mice despite Glp1r KO.
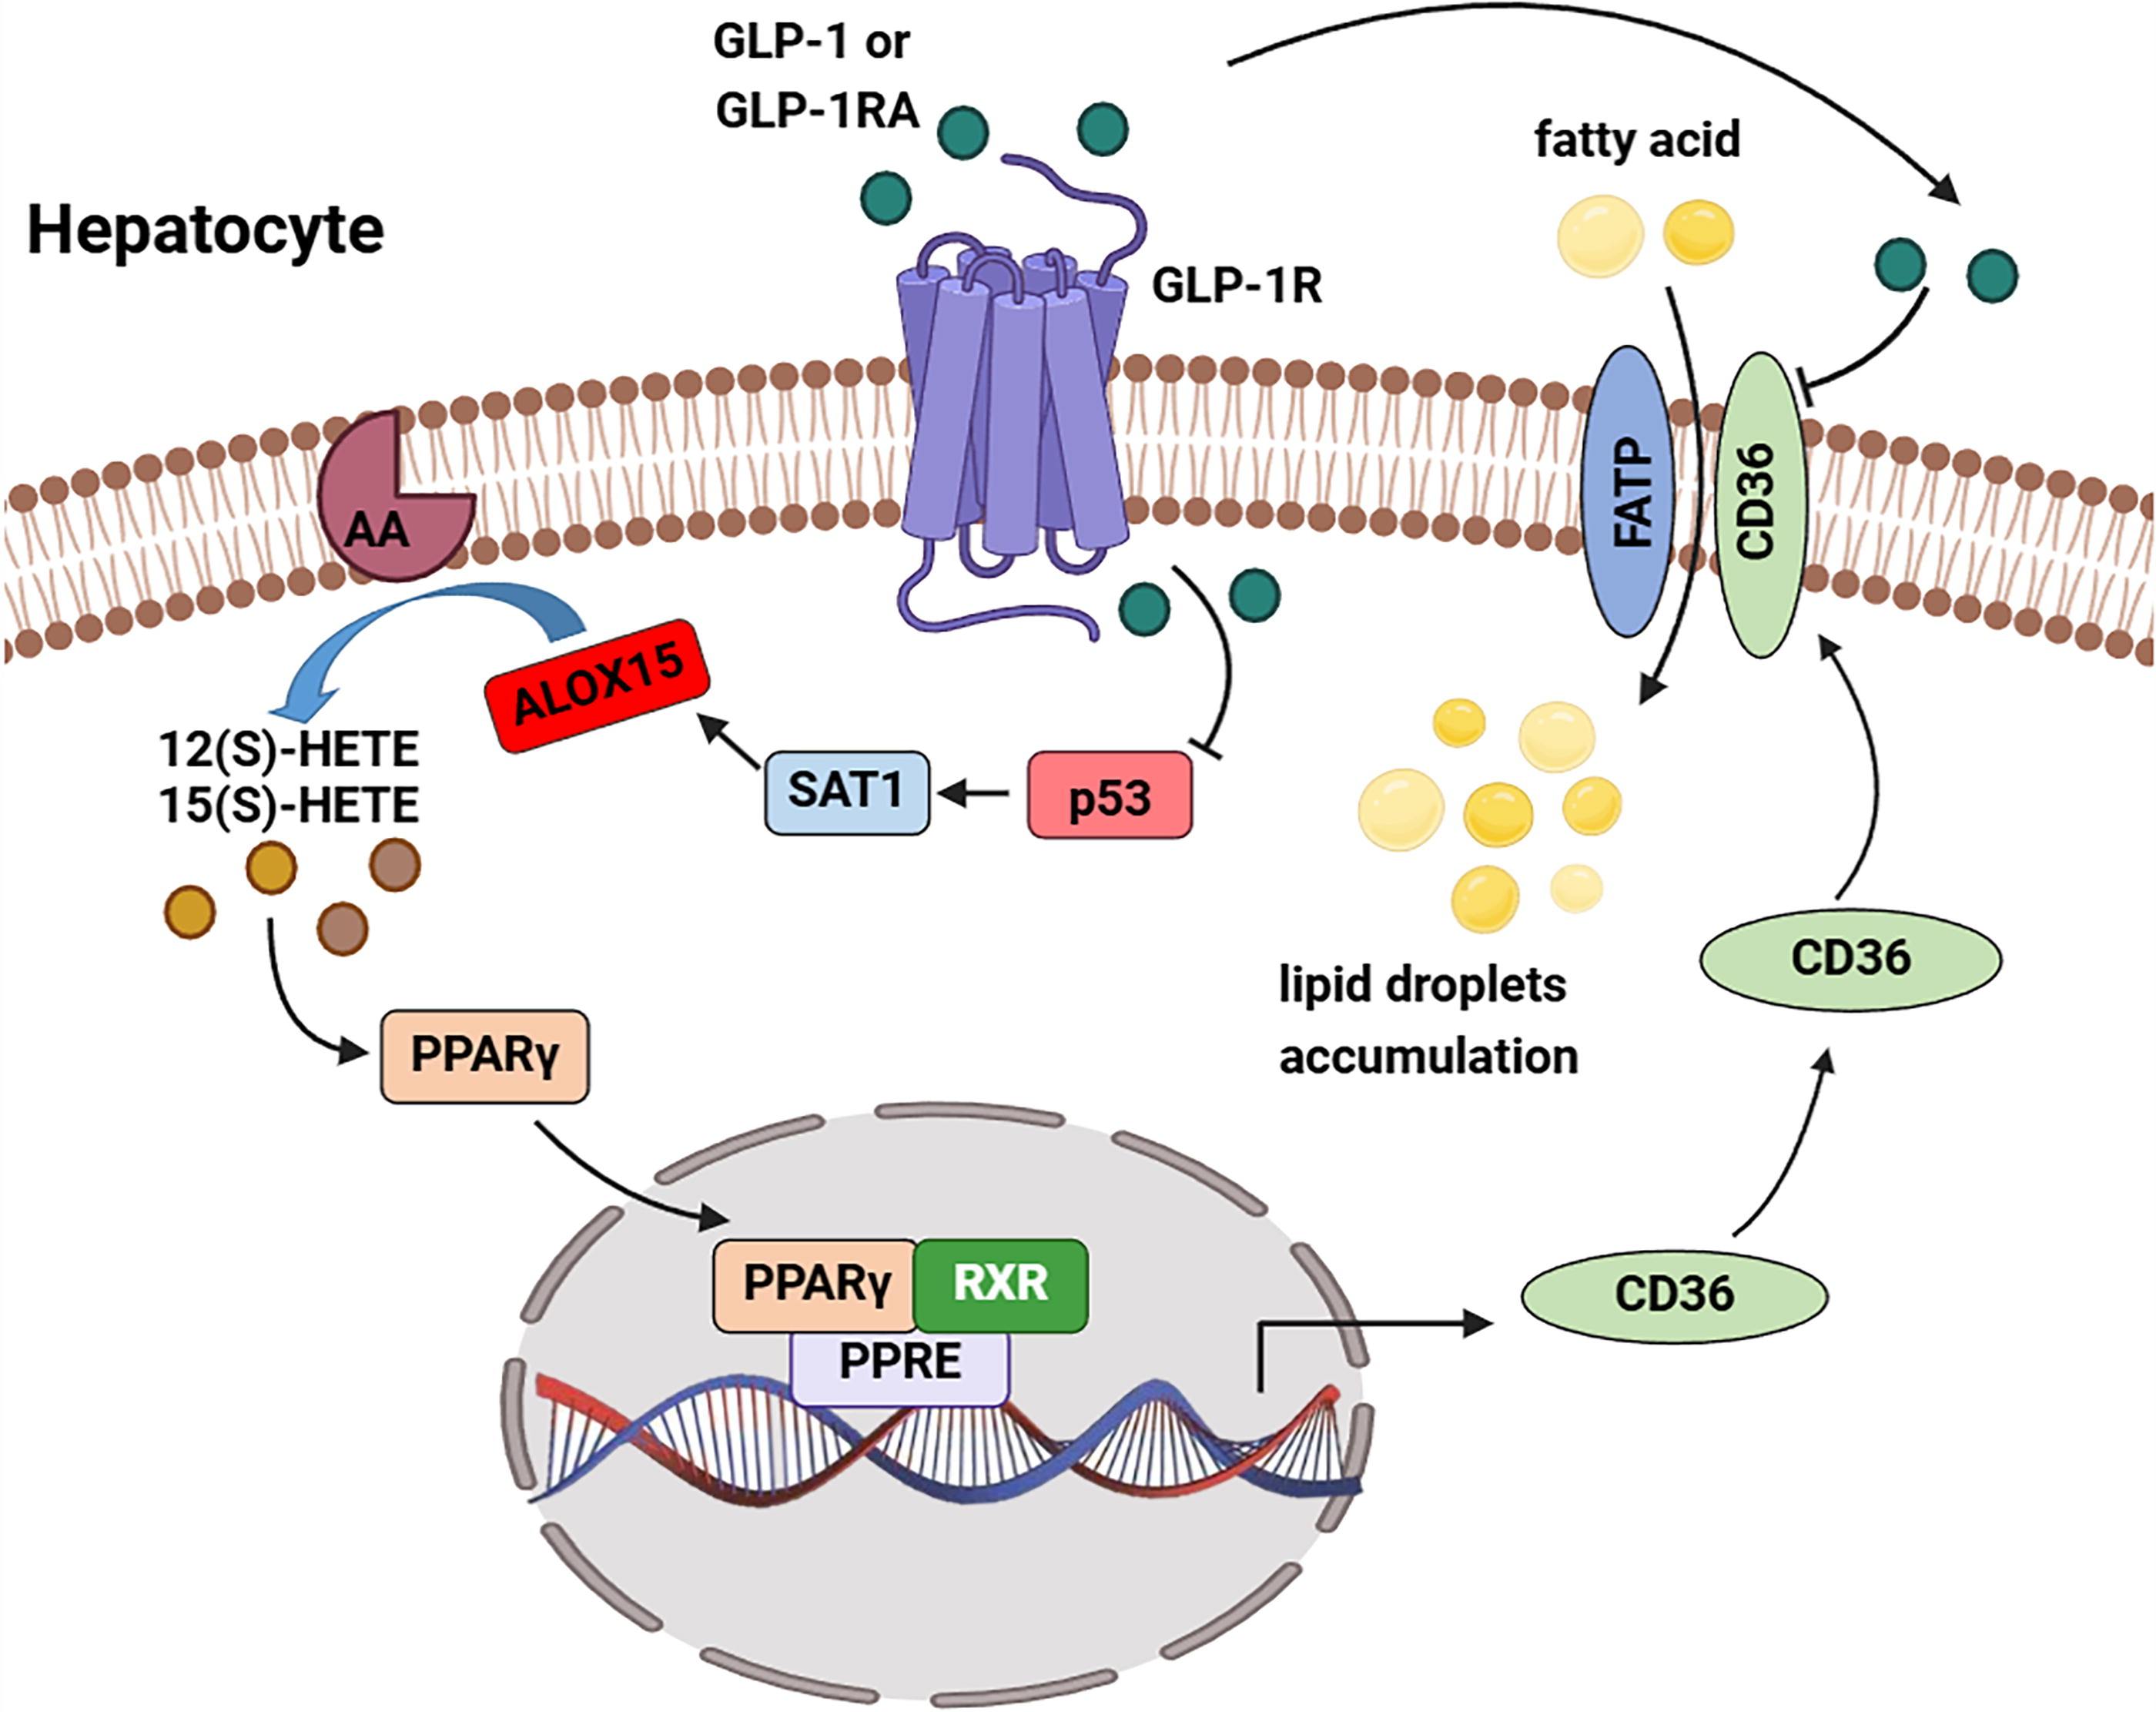
In conclusion, the present study demonstrated that upregulation of ALOX15 induces increased fatty acid uptake that contributes to the development of MASLD via activating the PPARγ/CD36 pathway. Our study identifies a novel target for the treatment of MASLD, providing a new insight into MASLD pathogenesis. Moreover, liraglutide, a GLP-1RA, has a protective effect against lipid accumulation in MASLD, likely through the modulation of ALOX15 (Fig. 8). This helps us gain a better understanding of the mechanisms by which GLP-1RA improves MASLD.
Limitations
We have to acknowledge the inherent limitations in our current research. While we have successfully validated the link between ALOX15 and PPARγ through in vitro experiments, obtaining more direct evidence to support our hypothesis would involve detecting alterations in the levels of 12(S)-HETE and 15(S)-HETE upon manipulation of ALOX15 expression, as well as observing changes in PPARγ expression following the direct intervention with these substances. This constitutes a pivotal area for our future exploration and research endeavors.
Despite the prominent effects of liraglutide, it is not fundamentally revealed that the effect of the liraglutide on hepatic accumulation is due to the effect on ALOX15/PPARγ/CD36. The other possibility is not excluded. What is more, there is ambiguity regarding whether the liraglutide-modulated disruption of ALOX15 signaling precedes or follows the improvement in MASLD. The utilization of knockin mice expressing ALOX15 may yield deeper insights into the effects of liraglutide on MASLD.
Materials and Methods
The electronic laboratory notebook was not used. All experimental animal procedures were approved by the Institutional Animal Care and Use Committee of Xi’an Jiaotong University and performed according to the National Institute of Health Guide for Care and Use of Laboratory Animals.
Animals
Male C57BL/6 mice were purchased from the Medical Experimental Animal Center of Xi’an Jiaotong University (animal permission number: SYXK-Shaan-2023–004). Two female and one male Glp1r KO (Glp1r
Untargeted metabolomics
The method was referred to our previous work (Guo et al., 2023). The blood was collected from C57BL/6 mice fed a chow diet or HFD and made to stand at room temperature for 2 h, and the serum was separated by centrifugation at 3000 g/min for 15 min. Untargeted metabolomics was performed on triplicate serum samples from control and model mice, using an LC20 ultrahigh-performance liquid chromatography apparatus (Shimadzu, Kyoto, Japan) coupled to a quadrupole time-of-flight (Triple TOF-6600, AB SCIEX, Framingham, MA, USA) at Metware Biotechnology Co. Ltd (Wuhan, China). Briefly, 50 μL serum was added to 300 μL acetonitrile and methanol solution containing isotope internal standard and vortexed for 3 min. The mixture was centrifuged at 12,000 g for 10 min at 4°C, and 200 μL of supernatant was transferred to another tube and cooled at −20°C for 30 min. After centrifuged again at 12,000 g for 3 min at 4°C, the supernatant was then analyzed using liquid chromatograph (LC)-mass spectrometer (MS)/MS. The chromatographic column was Waters HSS T3 (2.1 mm × 100 mm, 1.8 um), the flow rate was 0.4 mL/min, the column temperature was 40°C, the mobile phase A was ultrapure water containing 0.1% formic acid, and the mobile phase B was acetonitrile containing 0.1% formic acid. Gradient elution: mobile phase B was 5% (0.00–11.00 min), 90% (11.00–12.00 min), 5% (12.00–12.10 min), 5% (12.10–14.00 min), and the injection volume was 2 uL. Mass spectrometer was performed on a Triple TOF-6600 instrument (Sciex, Framingham, MA, USA) in electrospray ionization (ESI) (+/−) mode, operating in information dependnt acquisition (IDA) mode. The scanning range was set to encompass m/z 50–1200 Da, with positive/negative ion spray voltages adjusted to 5500 V/−4500 V, respectively. The collision energy was set at 30 V, declustering potential at 60 V, and the gas parameters were optimized with an ion source gas 1 of 50 psi, curtain gas of 35 psi, and ion source gas 2 of 60 psi. The temperature was maintained at 550°C. The raw data of mass spectrometry were converted into the mzML format by ProteoWizard, and the peak extraction, alignment, and retention time correction were carried out by the XCMS program. The “supportive vector regression (SVR)” method was used to correct the peak area, and the peaks with missing rate >50% in each group were filtered. After calibration and screening, metabolite identification information was obtained by searching the laboratory database, integrated public database, and metDNA method. Finally, statistical analysis was performed by R program. Statistical analysis is divided into univariate statistical analysis and multivariate statistical analysis. Univariate statistical analysis includes Student’s t-test and difference multiple analysis, and multivariate statistical analysis includes PCA and orthogonal partial least-square discriminant analysis. Metabolites with fold-change ≥2.0 or ≤0.5, p value < 0.05, and variable importance in projection value ≥1 were considered to be statistically significant results. The metabolomic data have been submitted to MetaboLights, a database for metabolomic studies (Yurekten et al., 2024), and the accession number was MTBLS11300.
RNA sequencing
The method was referred to our previous work (Guo et al., 2023). Triplicate samples from livers of control and T2DM mice were harvested for RNA sequencing. After RNA extraction, purification, and library construction, the libraries were paired-end sequenced using next-generation sequencing based on the Illumina sequencing platform. Sequencing was performed at Shanghai Bioprofile Co., Ltd (Shanghai, China). The filtered reads were mapped to the mouse genome reference sequence (GRCm39.dna.toplevel.fa Ensembl release103) using HISAT2. Gene expression levels were calculated by the fragments per kilobase of transcript per million mapped reads values. Genes with |log2 (fold change)| > 1 and p value < 0.05 were considered to be significantly differentially expressed. The raw data for RNA sequencing have been submitted to the National Center for biotechnology information (NCBI) Gene Expression Omnibus (GEO) database with the accession number GSE279512.
Real-time PCR
The method was referred to our previous work (Yi et al., 2022). Total RNA was extracted from mice liver tissues using the RNAiso Plus (Takara Bio, Shiga, Japan). Briefly, the liver tissues were homogenized in an appropriate amount of ice-cold RNAiso Plus (e.g., 10 mg of tissue: 100 μL of RNAiso Plus) utilizing a low-temperature tissue homogenizer (Servicebio, Wuhan, China). The homogenate was then left for 5 min at room temperature and centrifuged at 12,000 g for 10 min at 4°C, the supernatant was transferred to a fresh tube and trichloromethane was introduced in a proportion of approximately one-fifth of the RNAiso Plus volume. The mixture was vigorously vortexed until it became milky white and allowed to stand for 5 min at room temperature, followed by centrifugation at 12,000 g for 15 min at 4°C. Subsequently, the resultant solution stratified into three layers, with the colorless upper layer being transferred to a new tube. Isopropyl alcohol was added to the supernatant in a volume of 0.5–1 times that of RNAiso Plus, and the mixture was thoroughly mixed by inverting the tube several times before being left at room temperature for 10 min. After centrifugation at 12,000 g for 10 min at 4°C, the RNA precipitate became visible at the bottom of the tube. With utmost care, the supernatant was discarded, ensuring no contact with the precipitate. An equivalent volume of 75% ethanol to that of the initial RNAiso Plus was added, and the tube was inverted to wash the walls. After further centrifugation at 7500 g for 5 min at 4°C, the supernatant was discarded with caution. The RNA precipitate was then dried at room temperature for a few minutes before adding an appropriate amount of RNase-free water for dissolution. The concentrations of isolated RNA were determined through NanoDrop spectrophotometry. The isolated RNA showed good purity with the OD260/OD280 of 1.7–2.1.
Then the RNA samples were reverse transcribed using a PrimeScriptTM RT Master Mix (Takara Bio). Quantitative real-time PCR was performed using a TB green® Premix Ex Taq TM II (Takara Bio). The procedure was set with an initial 30-s incubation period at 95°C and then for 40 cycles of 95°C for 5 s and 60°C for 30 s. Glycerelgehyde-3-phosphate dehydrogenase (GAPDH) was used as an internal control and the relative expression of target mRNA was calculated according to the 2-△△Ct method. The primers of the genes tested are listed in Table 1.
Sequences of Primers for Real-Time Polymerase Chain Reaction
Immunohistochemistry
Immunohistochemistry analysis was performed in a similar way as described previously (Hussaini et al., 2023). The glass slides containing paraffin-embedded liver tissues were heated at 60°C for 30 min, deparaffinized in xylene, rehydrated in a series of graded alcohols (100%, 95%, and 75%), subjected to antigen retrieval by immersion in boiled sodium citrate for 20 min, permeabilized with 0.3% Triton X-100 for 15 min, immersed in 3% H2O2 for 15 min to block the endogenous peroxidase, blocked with normal goat serum for 2 h, and incubated with primary antibodies against ALOX15 (OriGene, Tianjin, China, TA504250, 1:100) and CD36 (Proteintech, Wuhan, China, 18836–1-AP, 1:150) at 4°C overnight. Subsequently, the slides were rinsed three times with phosphate-buffered saline (PBS), and incubated with the horseradish peroxidase (HRP)-conjugated goat anti-rabbit secondary antibody (Fude Biological Technology, Hangzhou, China) at room temperature for 2 h. Finally, the slides were stained with 3,3′-diaminobenzidine (ZSGB-BIO, Beijing, China) and counterstained with hematoxylin, washed with running water, and visualized and imaged using a fluorescence microscopy. The mean optical density of images was analyzed by ImageJ.
Western blotting
WB analysis was performed as previously described (Yan et al., 2019b). Briefly, the total proteins in liver tissues and cell lines were extracted by radio immunoprecipitation assay (RIPA) buffer containing the protease inhibitor (Solarbio, Beijing, China). The lysate was centrifuged at 12,000 g for 10 min at 4°C, and the supernatant was transferred to a fresh tube. The protein concentration was determined using a bicinchoninic acid (BCA) protein assay kit (Solarbio). Proteins, 30–50 μg, were separated by 8%−12% sodium dodecyl sulfate polyacrylamide gel electrophoresis (SDS-PAGE) and transferred to polyvinylidene difluoride membranes. Then the membranes were blocked in 5% nonfat milk dissolved in TBST for 2 h, followed by incubation with primary antibodies against FAS (Cell Signaling Technology, Danvers, USA, 3180T, 1:500), FABP1 (Cell Signaling Technology, 13368, 1:200), p53 (Abclonal, Wuhan, China, A19585, 1:300), p-p53 (Abclonal, AP0860, 1:300), SAT1 (Proteintech, 10708–1-AP, 1:300), ALOX15 (Abcam, Cambridge, UK, ab244205, 1:300), PPARγ (Abcam, ab178860, 1:500), CD36 (Abclonal, A17340, 1:300), and GAPDH (Engibody Biotechnology, Milwaukee, USA, AT0002, 1:10,000) at 4°C overnight. Subsequently, the membranes were washed thrice with tris buffered saline containing 0.1% tween-20 (TBST) and incubated with the HRP-conjugated goat anti-rabbit (Fude Biological Technology, Hangzhou, China, FDR007, 1:10,000) or anti-mouse (Zhuangzhi, Xi’an, China, EK010, 1:10,000) secondary antibody at room temperature for 2 h. Finally, the membranes were visualized using an electrochemiluminescence (ECL) substrate solution (Abbkine, Wuhan, China). The density of protein bands was quantified by ImageJ. The uncropped raw images of all blots are shown in Supplementary Data S1 for WB bands.
Cell culture
The human hepatocellular carcinoma cell line (HepG2) was maintained in minimum essential medium (Servicebio, Wuhan, China) supplemented with 10% fetal bovine serum (Gibco, New York, USA) and 1% penicillin–streptomycin (Solarbio) at 37°C in an atmosphere containing 5% CO2.
Lentiviral transfection
The method was referred to our previous work (Yi et al., 2022). Lentivirus overexpressing ALOX15 (LV-Alox15) and negative control (LV-NC) were purchased from GenePharma (Shanghai, China). The HepG2 cells were seeded into a 96-well plate at a density of 10,000 cells per well. Once 70%–80% confluence was achieved, the medium was removed and replaced with 100 μL medium containing LV-Alox15 or LV-NC in different multiplicities of infection (MOIs) (5, 10, 20, and 40). In addition, polybrene (GenePharma, the final concentration was 5 μg/mL), which enhances the transfection efficiency, was added to the cells infected with LV-Alox15. Twenty-four hours after infection, the cells were replaced with fresh medium and incubated for another 48 h. The transfection efficiency was observed under a fluorescence microscope and the optimal transfection conditions were determined to be MOI 20 plus polybrene. Puromycin (2.5 μg/mL) was used to select stably transfected cells. Under these conditions, the HepG2 cells were seeded into a 6-well plate and infected with LV-Alox15 or LV-NC. Then the control and infected cells were harvested to verify the expression of ALOX15 via WB assay.
Knockdown of ALOX15 by siRNA
The siRNA transfection was performed in the similar way as described previously (Yi et al., 2022). HepG2 cells were seeded into a 12-well plate at a density of 2 × 10⁵ cells/well. Twenty-four hours later, the medium was replaced with a fresh medium. Then the cells were transfected with three ALOX15-targeting siRNA oligonucleotides (Genomeditech, Shanghai, China) for 48 h using SuperKine™ Lipo3.0 Efficient Transfection Reagent (Abbkine, Wuhan, China). NC-siRNA was used as a negative control (Genomeditech). Then the control and infected cells were harvested to verify the expression of ALOX15 via WB assay. ALOX15-siRNA3 with the highest knockdown efficacy was chosen for further experiments.
MTT assay
The MTT assay was performed as previously described (Yan et al., 2019a). The HepG2 cells were seeded into a 96-well plate at a density of 2 × 10⁴ cells per well in a total medium of 200 μL per well. When the cells were adherent, they were exposed to a concentration gradient (50, 100, 200, and 400 μmol/L) of PA for 12, 24, or 48 h. Then 20 μL MTT was added to each well, followed by a 2-h incubation at 37°C. Subsequently, the medium was removed and 150 μL dimethyl sulfoxide (DMSO) was added to each well to dissolve the formazan dye. The absorbance was measured at 490 nm utilizing a microplate reader. Cell viability was expressed as the percentage of control.
Oil red O staining
The method was referred to the previous study (Liu et al., 2024). The oil red O staining kit was purchased from Beyotime Biotech Inc. (Shanghai, China, order number: C0158S). The HepG2, LV-Alox15-HepG2, and LV-NC-HepG2 cells were seeded at a density of 5 × 10⁵ cells per well in a 12-well plate for 24 h and then exposed to different treatments for 24 h. The cells were fixed with 4% paraformaldehyde for 30 min, and immersed with oil red O dyeing detergent for 20 s. Then 500 μL oil red O working solution was added to each well and incubated for 1 h. Subsequently, the cells were subjected to a dyeing detergent for 30 s and washed with PBS three times. Finally, the cells were counterstained with hematoxylin, washed with PBS, and observed under a brightfield microscopy.
Biochemical analysis
The HepG2, LV-NC-HepG2, and LV-Alox15-HepG2 were homogenized in ice-cold RIPA buffer. Followed by centrifugation at 12,000 g for 15 min, the supernatant was collected for biochemical assay. The protein concentration of each sample was assessed using the BCA protein assay kit. Subsequently, the FFA (Boxbio, Beijing, China, order number: AKFA008M), TG, (Nanjingjiancheng, Nanjing, China, order number: A110-1–1), MDA (Nanjingjiancheng, order number: A003-1–2), SOD activities (Nanjingjiancheng, order number: A001-1–2), GSH levels (Nanjingjiancheng, order number: A006-2–1), and CAT activities (Nanjingjiancheng, order number: A007-1–1) were determined using assay kits according to the manufacturer’s instructions.
Immunocytochemistry
The immunocytochemistry was performed according to the previously described method (Yan et al., 2023). HepG2, LV-Alox15-HepG2, and LV-NC-HepG2 cells were seeded at a density of 1 × 10⁵ cells per well in a 24-well plate for 24 h and treated with 50 or 100 μmol/L PA for 24 h. Subsequently, the cells were fixed with 4% paraformaldehyde for 30 min, permeabilized with 0.3% Triton X-100 for 15 min, blocked with normal goat serum for 2 h, and incubated overnight at 4°C with primary antibodies against PPARγ (Abcam) and CD36 (Abclonal). After being rinsed with PBS three times, the cells were incubated with Dylight 488-tagged (Abbkine) or cy3-tagged (Zhuangzhi) goat anti-rabbit secondary antibodies at room temperature and kept in the dark for 2 h. Following three washes with PBS for three times, the cells were mounted in 4' 6-diamidino-2-phenylindole (DAPI) (Solarbio) to stain the nuclei. The stained cells were visualized under a fluorescence microscopy. Images were processed and analyzed using the ImageJ software.
Statistical analysis
The data were assessed by IBM SPSS 26.0 software. The normality of data distribution was verified by the Shapiro–Wilk test. The equal variance of data was determined by Levene’s test. The data normally distributed were expressed as mean ± standard error of mean and were visualized through scatter plots with bar. Conversely, the data that were not normally distributed were expressed as medians and were visualized through box plots. If the data were normally distributed, differences between two groups were assessed by Student’s t-test, differences between multiple (≥3) groups were assessed by one-way analysis of variance (ANOVA) followed by a least significant difference test (assumed equal variance) or Dunnett T3 test (assumed unequal variance). If the data were not normally distributed, a nonparametric Mann–Whitney U test (two groups) or Kruskal–Wallis test (≥3) was used. A two-sided p < 0.05 was considered statistically significant.
Footnotes
Authors’ Contributions
W.Y.: Conceptualization, data curation, formal analysis, funding acquisition, investigation, methodology, writing—original draft, and writing—review and editing. X.C.: Data curation, formal analysis, investigation, and methodology. T.G., N.L., and Z.W.: Data curation, investigation, and methodology. Yuz.S., Yua.S., J.L., Yu.Z., and Ya.Z.: Methodology. L.C.: Conceptualization, supervision, funding acquisition, and writing—review and editing.
Author Disclosure Statement
The authors declare that they have no competing interests.
Funding Information
This work was funded by the Natural Science Basic Research Program of Shaanxi Province (2023-JC-QN-0921, 2023-JC-ZD-47), the National Natural Science Foundation of China (Grant No. 82301365), the Basic & Clinical Sciences Integration Innovation Project of Xi’an Jiaotong University (YXJLRH2022018), and the Research Project of Shaanxi Administration of Traditional Chinese Medicine (SZY-KJCYC-2023–008).
Supplementary Material
Supplementary Data S1
Supplementary Figure S1
Supplementary Figure S2
Abbreviations Used
References
Supplementary Material
Please find the following supplemental material available below.
For Open Access articles published under a Creative Commons License, all supplemental material carries the same license as the article it is associated with.
For non-Open Access articles published, all supplemental material carries a non-exclusive license, and permission requests for re-use of supplemental material or any part of supplemental material shall be sent directly to the copyright owner as specified in the copyright notice associated with the article.