
Abstract
Aims:
Reactive oxygen species (ROS) are considered to play a key damaging role in brain during the development of ischemic stroke. To clarify how different ROS contribute to ischemic pathogenesis, innovative approaches for real-time in vivo detection of redox parameters are necessary.
Results:
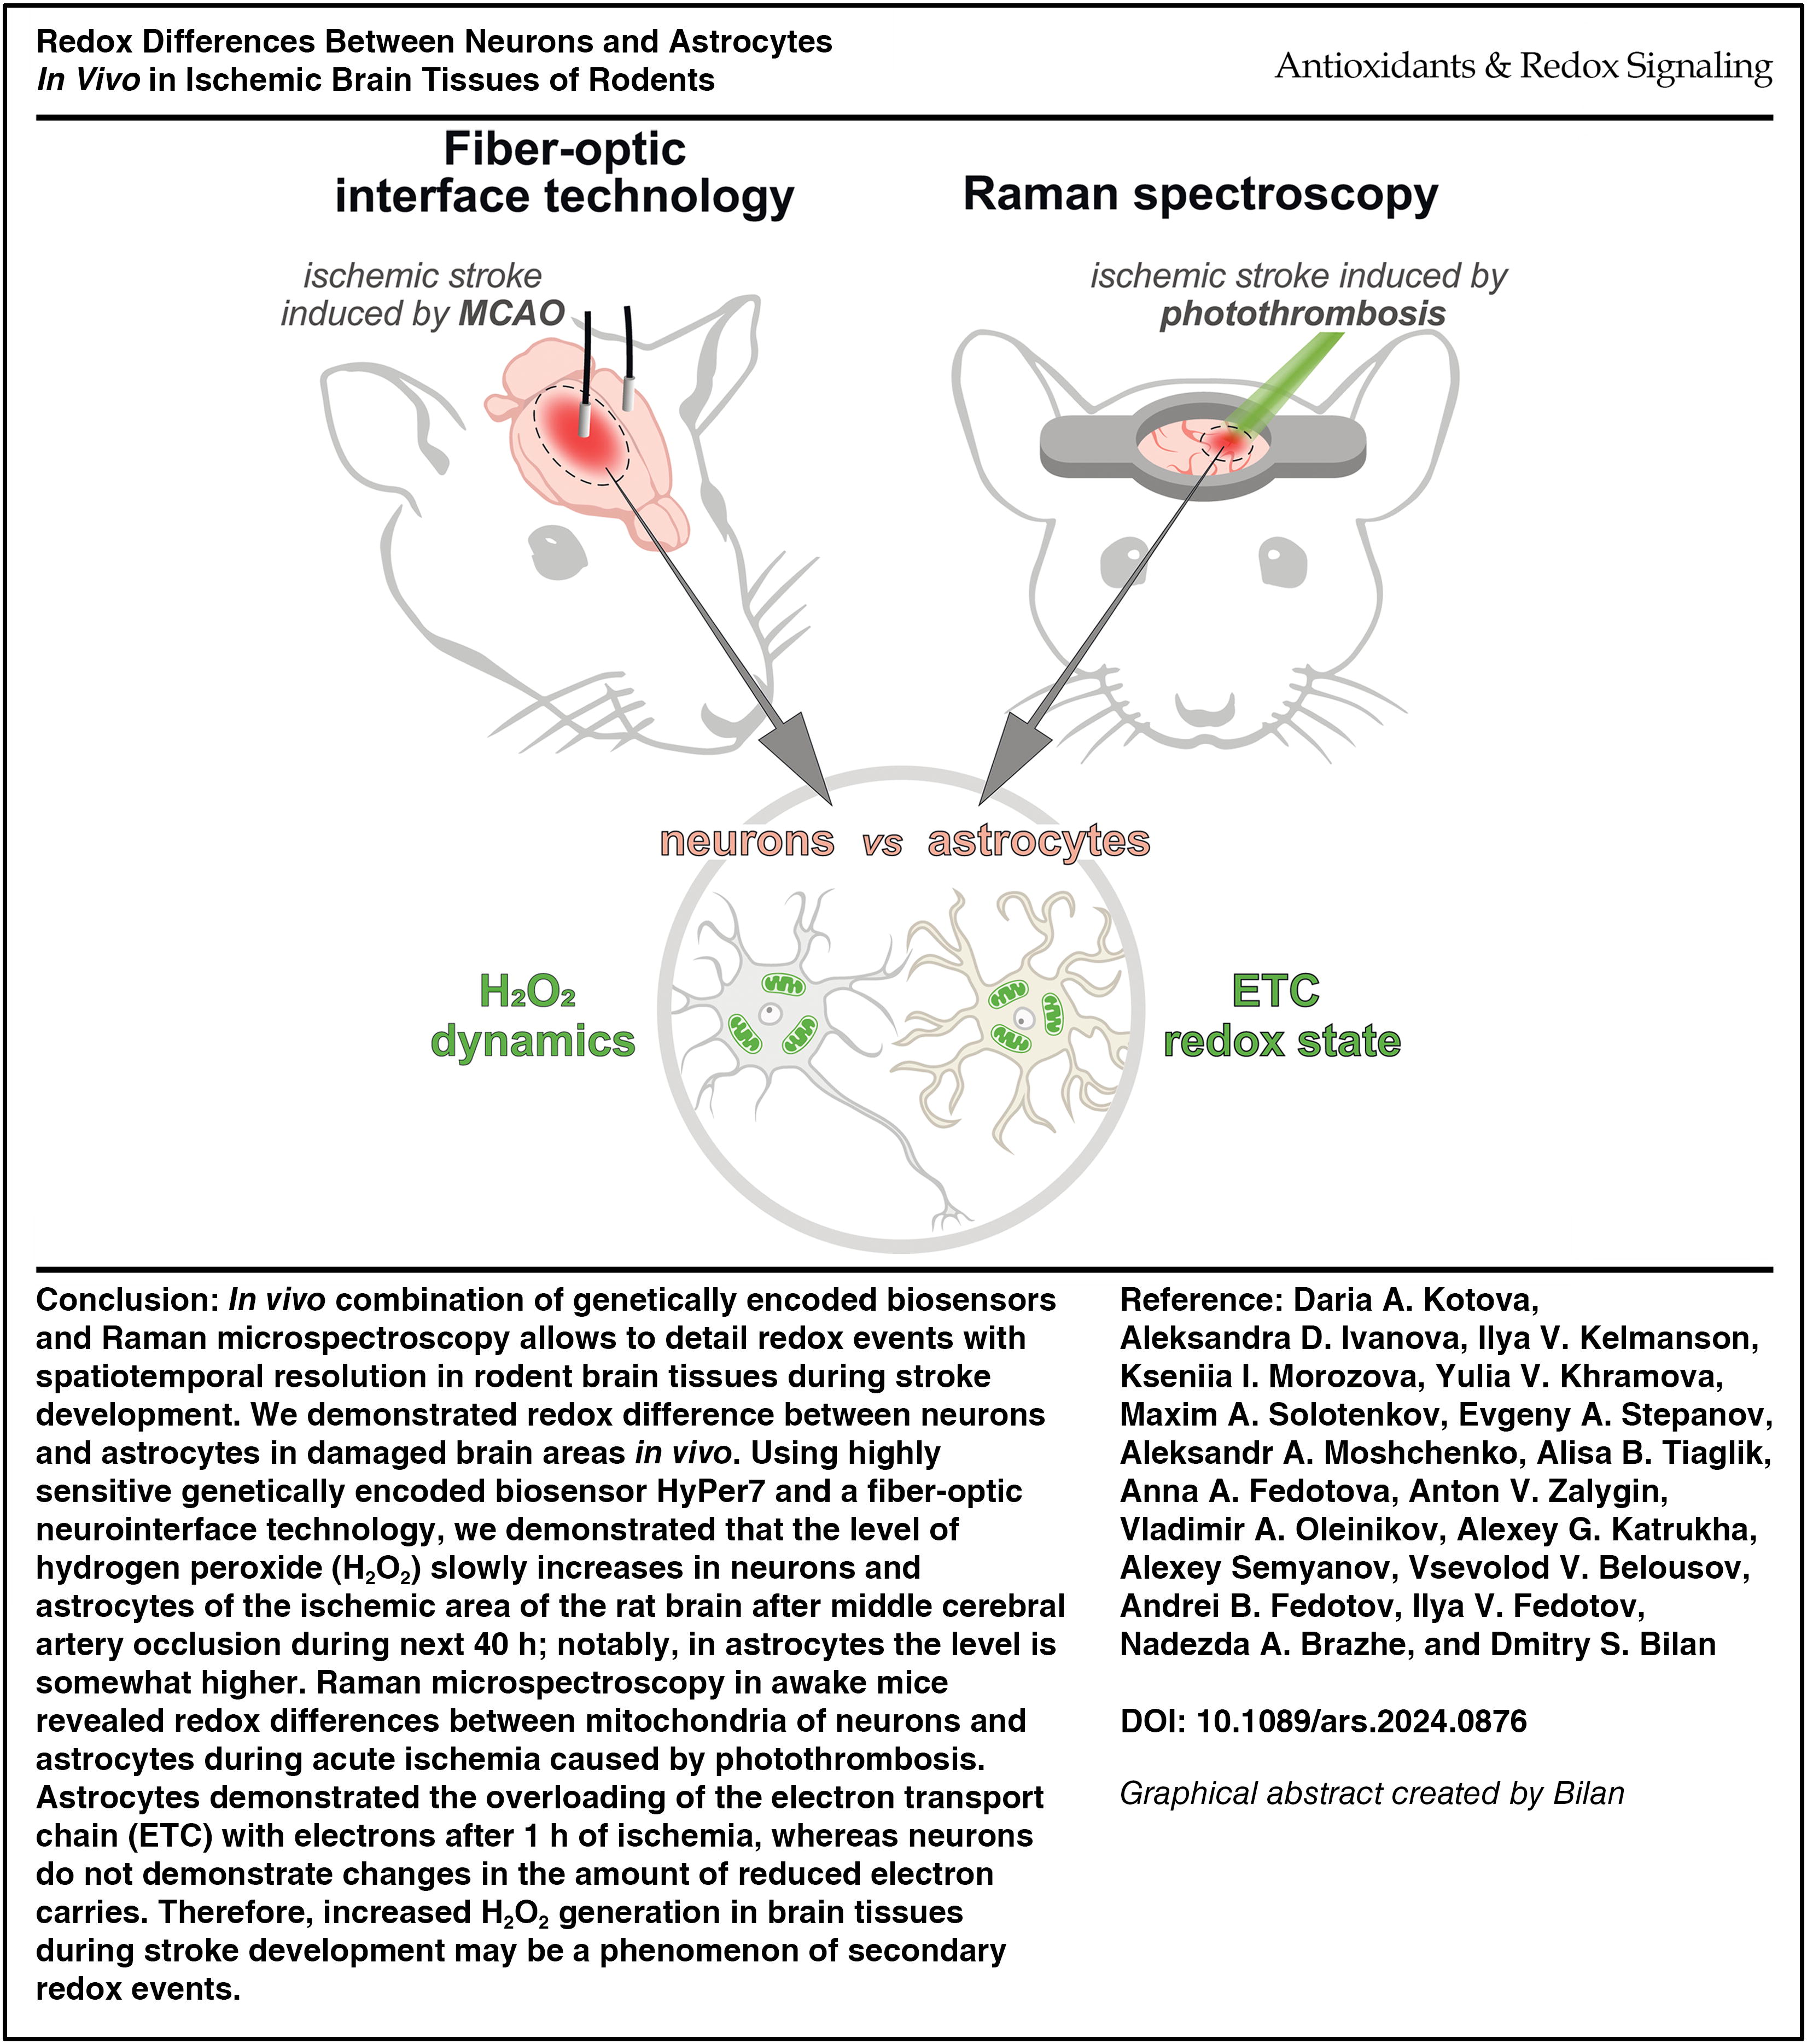
Using highly sensitive genetically encoded biosensor HyPer7 and a fiber-optic neurointerface technology, we demonstrated that the level of hydrogen peroxide (H2O2) slowly increases in neurons and astrocytes of the ischemic area of the rat brain after middle cerebral artery occlusion during next 40 h; notably, in astrocytes the level is somewhat higher. Raman microspectroscopy in awake mice also revealed redox differences between mitochondria of neurons and astrocytes during acute ischemia caused by photothrombosis. Astrocytes demonstrated the overloading of the electron transport chain (ETC) with electrons after 1 h of ischemia, whereas neurons do not demonstrate changes in the amount of reduced electron carries.
Innovation and Conclusion:
The combination of novel in vivo approaches allows to detail redox events with spatiotemporal resolution. We demonstrated redox difference between neurons and astrocytes in damaged brain areas in vivo. An elevated loading of astrocytic ETC with electrons during the acute ischemia phase provides basis for the increased generation of superoxide anion radical (O2 •−) with its following conversion to other reactive species. However, we observed increased H2O2 concentrations in astrocytes and neurons at later pathogenesis stages. During this period, ETC did not demonstrate an elevated loading with electrons, and therefore, increased H2O2 generation may be a phenomenon of secondary redox events. Antioxid. Redox Signal. 43, 272–287.
Introduction
It is generally accepted that ischemic stroke is accompanied by reactive oxygen species (ROS) generation and the development of intracellular oxidative stress (Allen and Bayraktutan, 2009; Manzanero et al., 2013; Piantadosi and Zhang, 1996).
Hydrogen peroxide (H2O2) is one of the most studied biologically significant representatives of ROS (Sies, 2014, 2017). However, the real-time dynamics of H2O2 during the development of ischemia and subsequent reperfusion have long remained unexplored in in vivo models directly. In our previous works, we recorded the dynamics of H2O2 concentrations in neurons of rat brain tissues from the first seconds of middle cerebral artery occlusion (MCAO; Kelmanson et al., 2021; Kotova et al., 2023; Pochechuev et al., 2022). We used adeno-associated viral vectors (AAV) to deliver the gene of the highly H2O2-sensitive biosensor HyPer7 (Pak et al., 2020) into neurons of dorsal striatum of the spontaneously hypertensive rats (SHRs). It is important to note that HyPer7 is a highly sensitive and specific genetically encoded tool for H2O2 detection. Its sensitivity toward H2O2 is in the subnanomolar range. Among other biologically significant oxidants, HyPer7 is also sensitive to organic hydroperoxides but at high concentrations (Pak et al., 2020).
Innovation
Using Raman microspectroscopy approach in a photothrombosis-induced stroke model in mice, we found that mitochondrial electron transport chain (ETC) of astrocytes is overloaded with electrons in the acute phase of pathogenesis, unlike neurons, with the following restoration of ETC redox state in astrocytes in 20 and 40 h after ischemia. In a rat model of middle cerebral artery occlusion (MCAO)-induced stroke, using HyPer7 biosensor and fiber-optic interface technology, we found that hydrogen peroxide (H2O2) levels slowly increased in neurons and astrocytes, reaching significant changes only on the following day. Astrocytes tended to generate more H2O2 compared with neurons in this model.
In the same coordinates of the rat brain where we injected the AAV particles, we implanted optical fibers for recording ratiometric HyPer7 signal continuously during the surgical operation to model ischemic stroke and for the next 2 h of the acute phase. In this series of studies, we observed only minor changes in the fluorescent signal of HyPer7. We found much more pronounced changes, corresponding to maximum oxidation of the biosensor, in the same brain area only on the following day (Kelmanson et al., 2021; Pochechuev et al., 2022). Our data demonstrated that H2O2 is indeed formed in the brain tissue of rats during ischemic stroke, but the main generation is observed at later stages of pathogenesis.
The aim of the present study is to identify redox differences in neurons and astrocytes of the ischemic brain region within the first 40 h. These cell types have different functions and biochemical specifics. Therefore, the dynamics of oxidative stress caused by ischemia may also differ. We prepared rats with HyPer7 gene expression in cell types of interest of the caudate putamen (CPu) by selecting appropriate promoters. Using a deep brain tissue signal recording approach via a fiber-optic interface, we compared the H2O2 generation in vivo between neurons and astrocytes in a stroke model induced by MCAO. We also compared the redox state of mitochondrial electron transport chain (ETC) in neurons and astrocytes in vivo using confocal Raman microspectroscopy (Krafft and Popp, 2015; Kotova et al., 2023). The MCAO model of ischemic stroke is not suitable for this approach, since tissue damage begins in the deep structures of the brain (striatum) that cannot be achieved with Raman microspectroscopy. Therefore, we caused local occlusion of arteries in the somatosensory cortex of mice using Rose Bengal dye (Talley et al., 2015), irradiating the region of interest with laser light at 532 nm and causing photothrombosis. Registration of Raman spectra in vivo to monitor redox state of mitochondrial cytochromes in cortical neurons and astrocytes under ischemia was carried out through the cranial window.
In both in vivo models used, we found redox differences between neurons and astrocytes during first 40 h of stroke development.
Results
Comparison of H2O2 generation in the mitochondrial matrix of neurons and astrocytes in rat brain tissues during the development of ischemic stroke
We used a highly sensitive HyPer7 biosensor (Pak et al., 2020) to compare the dynamics of H2O2 generation in the mitochondria of neurons and astrocytes. Targeted detection of H2O2 in the mitochondrial matrix was selected due to the redox-sensitive status of this cellular compartment and its widely accepted role as the primary source of ROS during ischemia/reperfusion (Chouchani et al., 2014; Yang et al., 2018). In addition, previous experiments with HyPer7 demonstrated that H2O2 generated in the cytosol diffuses rapidly into the mitochondrial matrix, but the reverse transport is limited (Pak et al., 2020). We also demonstrated in a Danio rerio model of hypoxia that H2O2 generated in the mitochondrial matrix does not penetrate into the cytosol (Sergeeva et al., 2025). Therefore, HyPer7 localized in the mitochondrial matrix reflects the dynamics of the total cellular H2O2 pool.
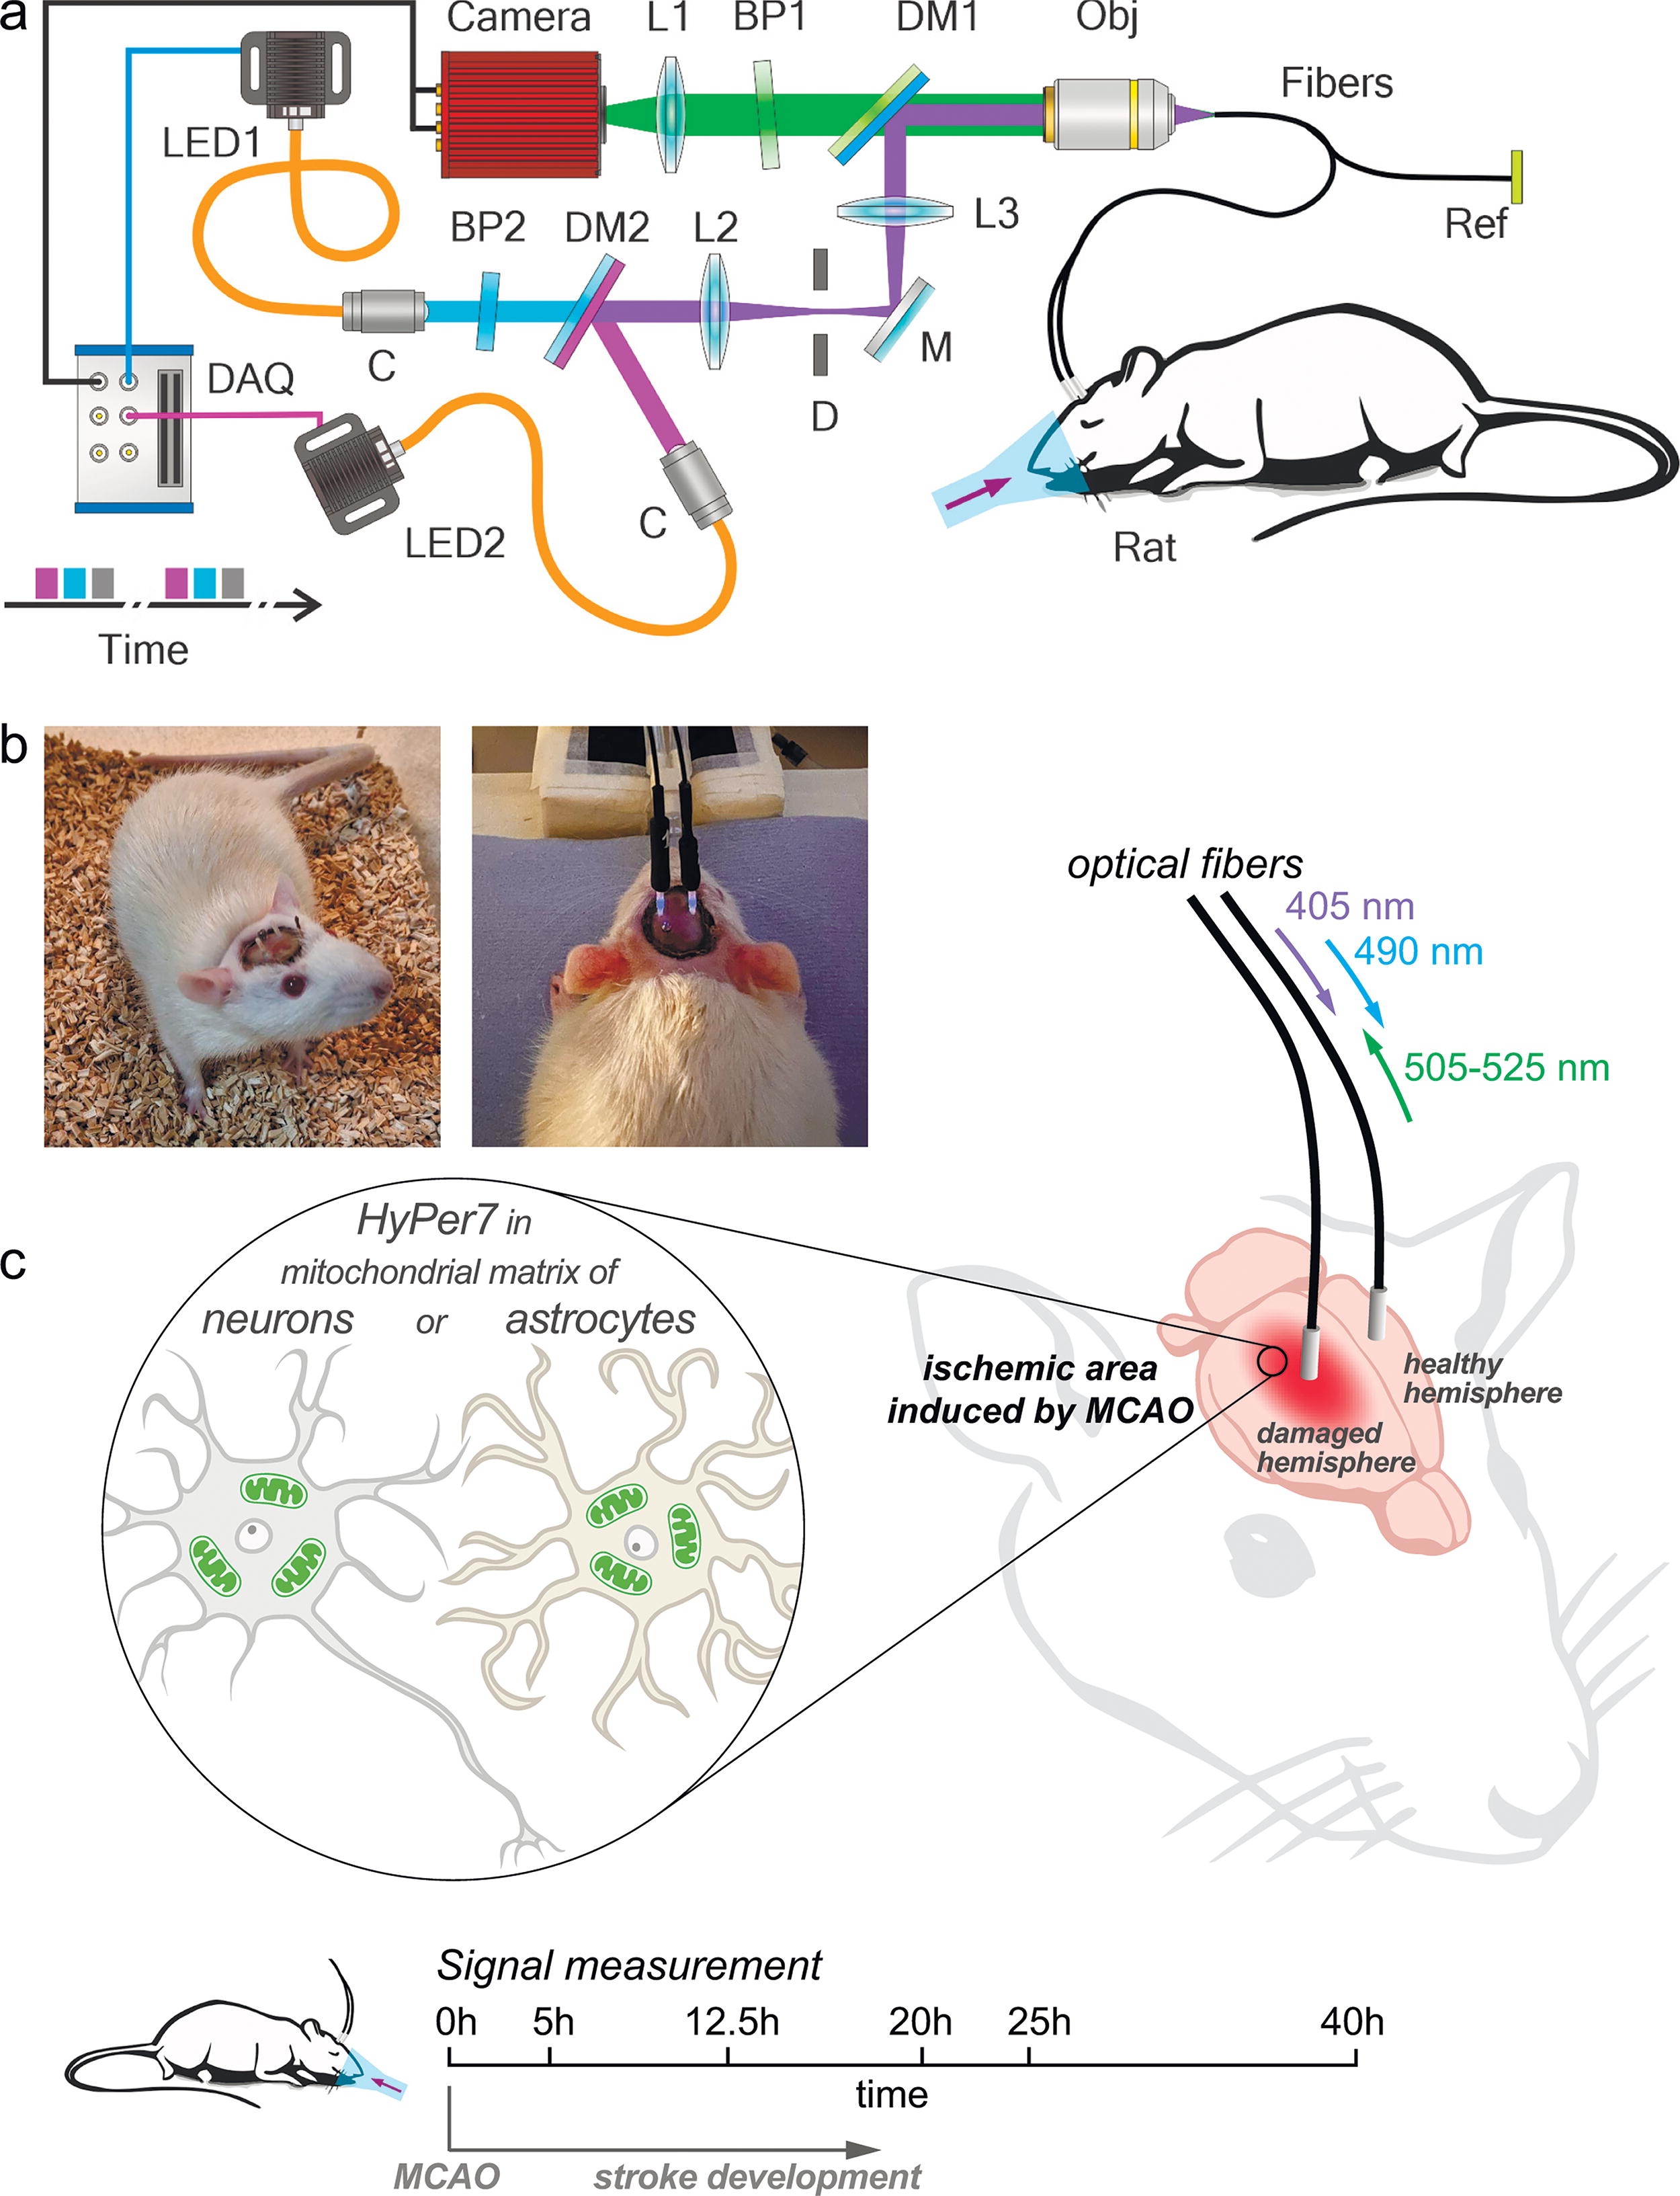
We have previously used HyPer7 to visualize H2O2 dynamics in real time in neurons of the rat brain during ischemic stroke development caused by MCAO. HyPer7 did not reveal significant changes in H2O2 concentrations in neurons in the acute phase of stroke within 1 h from the moment of arterial occlusion and the subsequent 1 h of reperfusion (Kelmanson et al., 2021; Kotova et al., 2023). In the present work, we determined time intervals of the cellular H2O2 production in the ischemic core. We compared H2O2 levels in neurons and astrocytes at different time intervals from the moment of ischemia/reperfusion (ischemia duration 1 h) by controlling the expression of HyPer7 biosensor using suitable promoters (human synapsin promoter 1 [hSyn1] and glial fibrillary acidic protein [GFAP], respectively). Genetic constructs contained the signal sequence (duplicated mitochondrial targeting sequence [MTS2]) for targeting the biosensor to the mitochondrial matrix. AAV serotype 9 (AAV9) particles with genetic constructs (hSyn1 or GFAP promotor, MTS2 signal sequence, and HyPer7 gene) were injected bilaterally into the area of the CPu of both hemispheres of SHR. Only one type of construct was injected into a single animal. Immediately after the injection of viral particles, an optical fiber was implanted in the same brain coordinate. The outer end of the fiber was protected by a ceramic ferrule, which also served as an adapter for connecting the implanted fiber to the optical system for registration of HyPer7 signal. Since we did not previously detect dramatic changes in the H2O2 concentration in the brain tissues of rats during the development of ischemic stroke in the acute phase (Kelmanson et al., 2021), in this study we recorded HyPer7 signal at certain time intervals from the onset of ischemia/reperfusion caused by the standard MCAO procedure. The signal from the second fiber implanted at the same coordinates into the healthy hemisphere we used as a control. Fiber-optic interface technology allows for the recording of fluorescent signals across multiple coordinates of deep brain structures. Each of these fibers was accurately positioned to interrogate a specific, well-defined area inside the brain tissue. Two light-emitting diodes (LEDs) with central wavelengths of 405 and 490 nm were used in our experiments to provide optical excitation for HyPer7. The output signal of HyPer7 is calculated as the ratio of the fluorescence intensity excited at 490 nm to the fluorescence intensity excited at 405 nm. The scheme of setup we developed, photographs of a rat with implanted optical fibers, and the scheme of the described experiment are demonstrated in Figure 1.
The measurements of HyPer7 signal in both hemispheres were performed before arterial occlusion and 5, 12.5, 20, 25, and 40 h after the onset of ischemia (Fig. 2a,b). Fluorescence was recorded for 1 min with an interval of 2 s, after which the average value was obtained. Between measurements, the animals were kept in individual cages with free access to food and water. Pronounced oxidation of HyPer7 was detected in most animals in the left damaged hemisphere 12.5 h after the onset of ischemia in astrocytes (Fig. 2c, GFAP_left). In neurons, the signal of HyPer7 developed more slowly, since the average values in the group showed minimal changes over the same time interval (Fig. 2c, hSyn_left). An increase in H2O2 in the mitochondrial matrix has been shown for both neurons and astrocytes in the damaged area. This becomes increasingly pronounced as the pathogenesis progresses. Astrocytes tend to generate higher levels of H2O2 compared with neurons. Over time, as the pathogenesis processed, this difference between neurons and astrocytes became more pronounced (Fig. 2a). In most animals, HyPer7 signal in the damaged area of brain tissues increased by twofold or more at later stages (after 20, 25, and 48 h). The fluorescent signal in the healthy hemisphere served as a control for each animal, with measurements taken simultaneously in both coordinates. As expected, no changes were observed in either neurons or astrocytes in the healthy hemisphere (Fig. 2b).
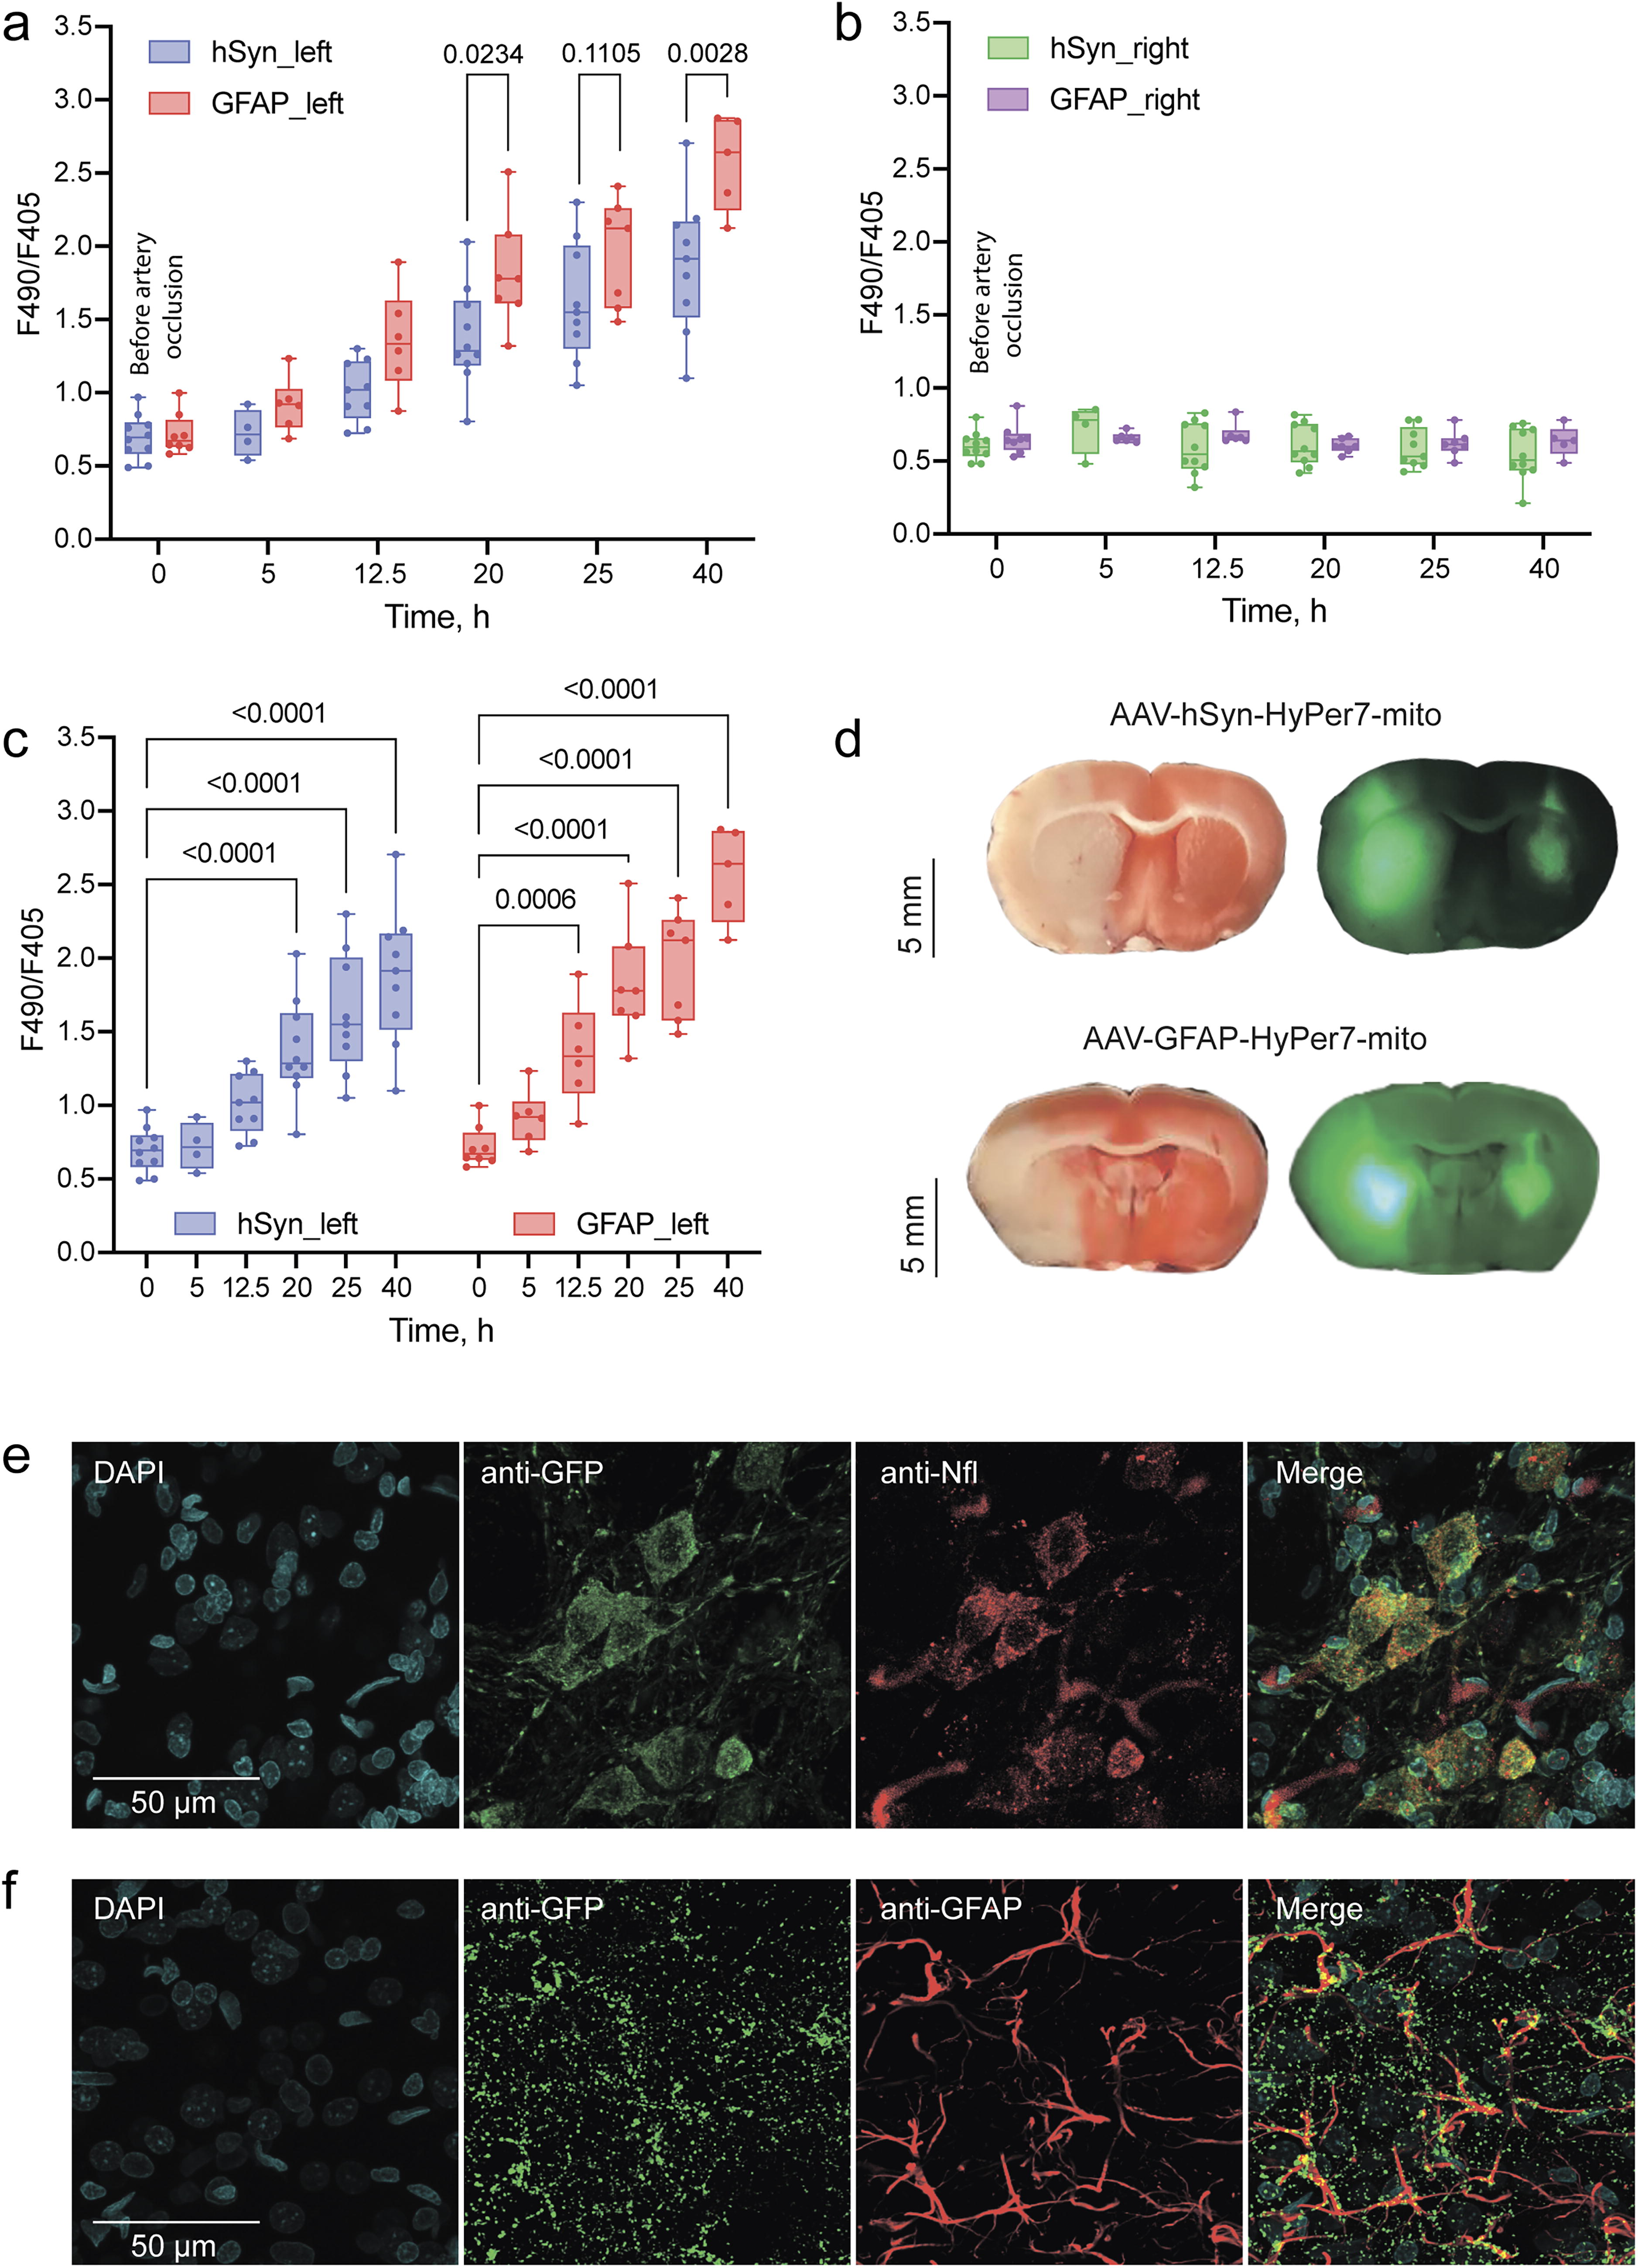
Following the final measurement, the rats were euthanized. Ischemic damage was assessed by 2,3,5-triphenyltetrazolium chloride staining of the brain slices. On the same slices, we visualized the fluorescent regions of the tissue, where cells, either astrocytes or neurons, expressed the mitochondrial version of HyPer7 biosensor (Fig. 2d). Only animals that developed a pronounced stroke, with the affected area overlapping the fluorescent signal region, were included in the data analysis. We further confirmed the localization of the biosensor in the selected cell types (Fig. 2e,f). To achieve this, we obtained brain slices from rats that had received AAV injections carrying HyPer7 constructs targeted to the mitochondrial matrix of neurons or astrocytes in the CPu. The brain slices were subsequently imaged using confocal microscopy. Expression of the biosensor in neurons was confirmed with neurofilament light (NfL)-36 antibodies (Fig. 2e), whereas antibodies against GFAP were used to confirm expression in astrocytes (Fig. 2f).
Comparison of mitochondrial ETC redox state in neurons and astrocytes in the somatosensory cortex of awake mice in a model of the local ischemic stroke induced by photothrombosis
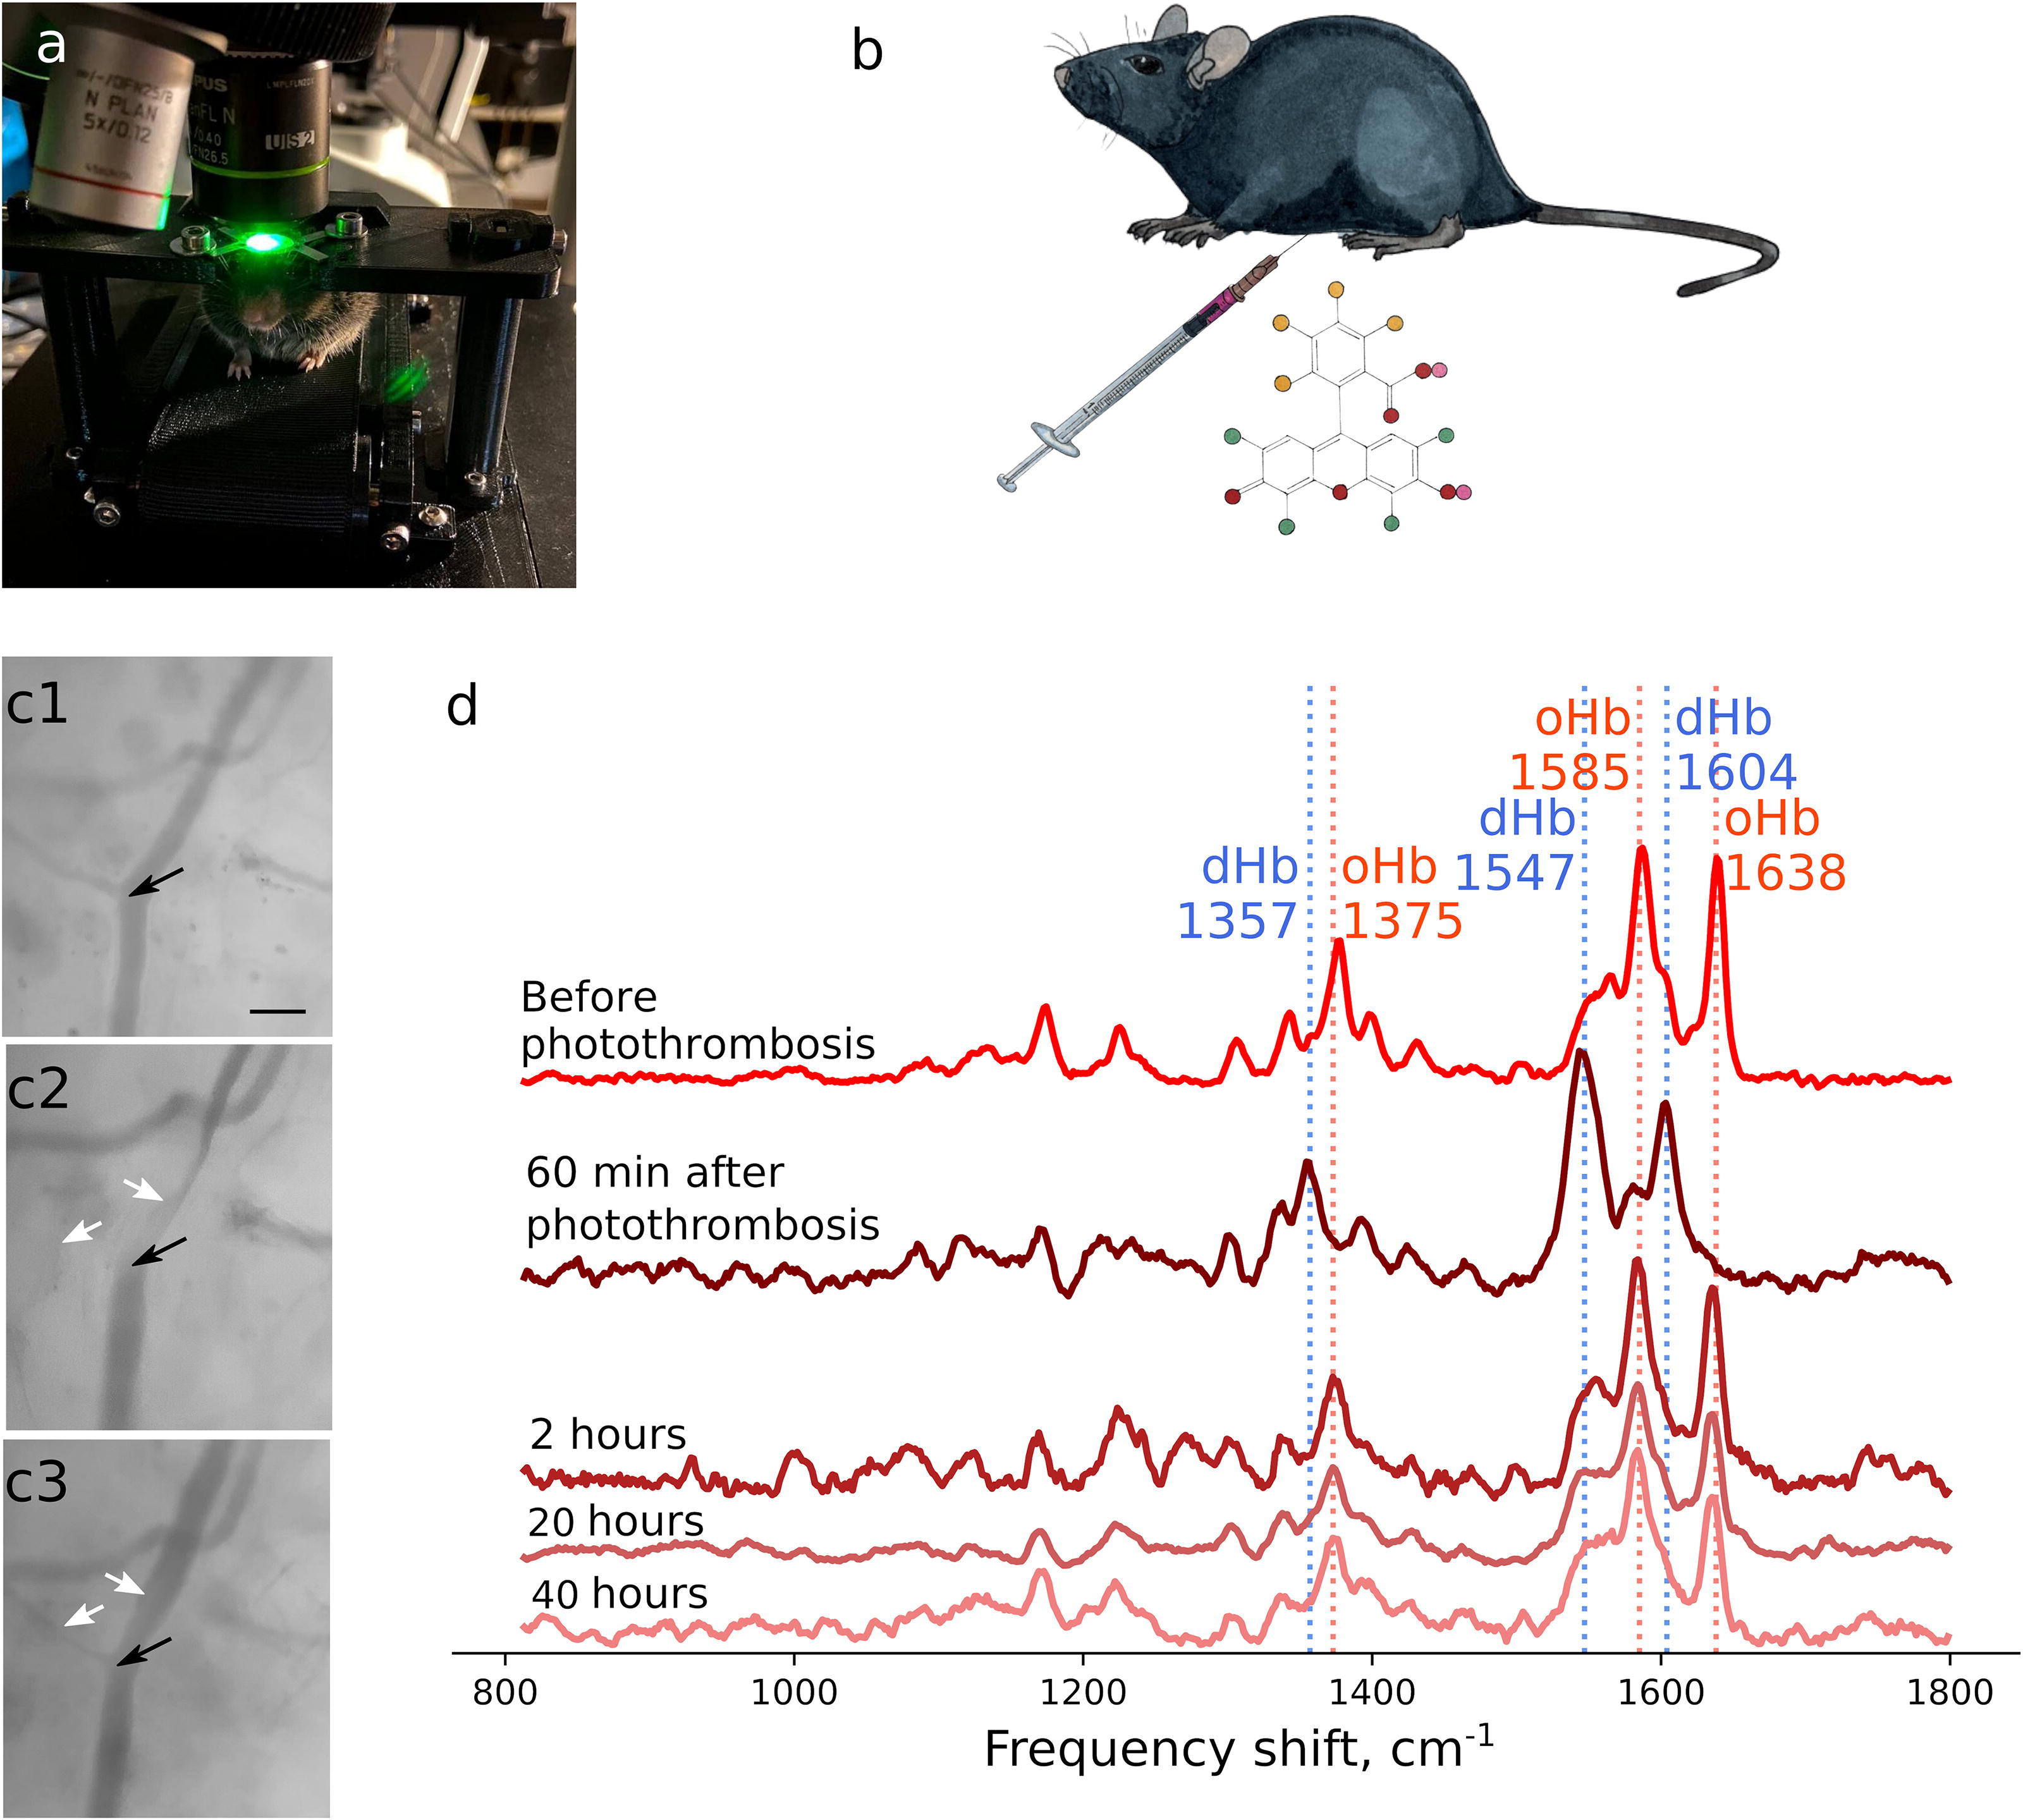
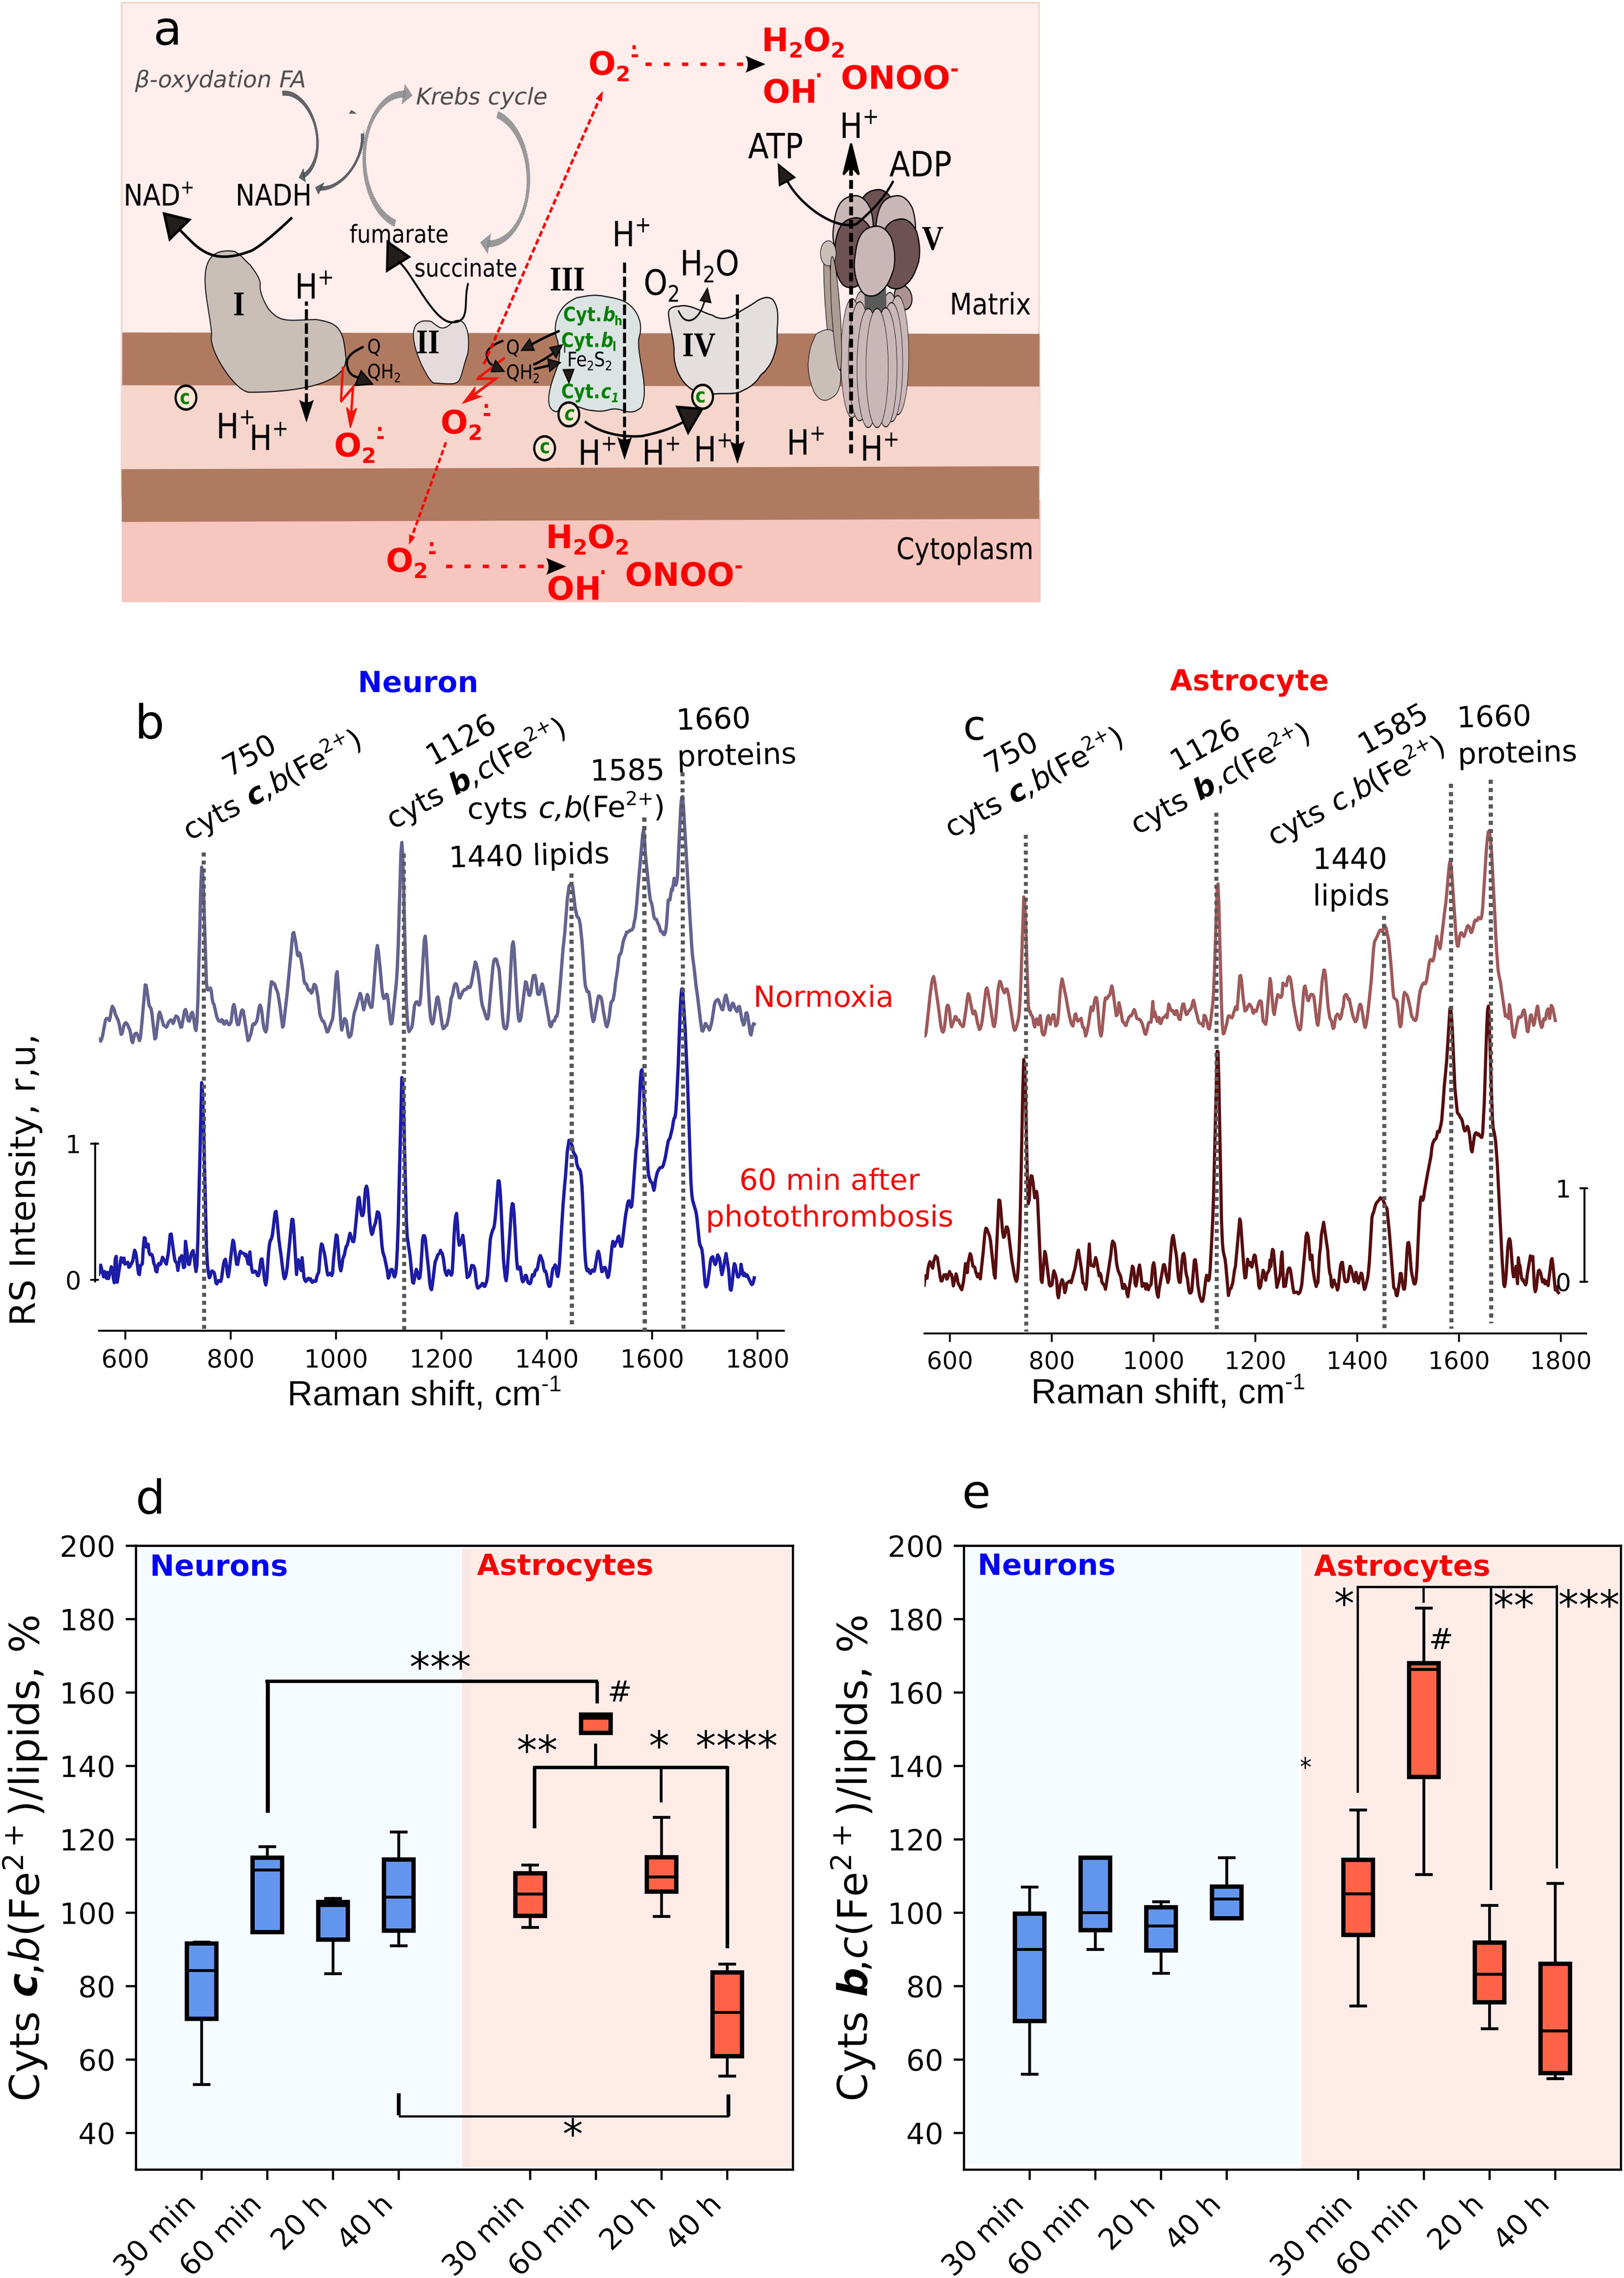
Mitochondria are known to be both the primary source and a key target of ROS generated during the stroke and in the reperfusion period (Moro et al., 2005). Thus, superoxide anion radical (O2 •−) is generated in ETC complexes I and III under hypoxic conditions or under the restoration of O2 supply to the ETC overloaded with electrons (Murphy, 2009). In order to investigate the redox state of mitochondrial ETC in astrocytes and neurons under the acute phase of local ischemic stroke and afterwards in 20 and 40 h, we applied Raman microspectroscopy using a specially designed treadmill to position awake mice under the microscope objective (Kotova et al., 2023) (Fig. 3a). Raman spectra of identified cells in the somatosensory cortex of awake mice were used to estimate the relative amount of reduced c and b-type cytochromes corresponding to the total ETC loading with electrons (Kotova et al., 2023; Popov et al., 2023). Since MCAO does not cause acute ischemia in the brain cortex and in vivo Raman spectra can be recorded only from cells in the upper cortical layers, we employed Rose Bengal-induced photothrombosis to produce acute local ischemia in selected cortical arteries (Fig. 3b). For this purpose, we performed intraperitoneal injection of the Rose Bengal with the consequent laser illumination of the chosen cortex arteriole (Fig. 3b,c). It can be seen that the local high power laser illumination of the arteriole—Rose Bengal photoactivation site (shown by the black arrow)—resulted in the formation of the blood clot that partially occluded the downstream arteriole region and fully occluded a smaller branching arteriole (white arrows; Fig. 3c1–c3). Occlusion of the arteriole also affected blood oxygenation. Thus, under normoxia conditions chosen arterioles exhibited intensive Raman peaks with maximum positions at 1375, 1585, and 1638 cm−1 corresponding to vibrations of heme atoms in oxyhemoglobin (oHb; Fig. 3d, upper spectrum) (Brazhe et al., 2018; Torres Filho et al., 2008). After photothrombosis Raman spectra of blood demonstrated new peaks, and 60 min postphotothrombosis Raman spectrum of blood represents intensive peaks with maximum positions at 1357, 1547, and 1604 cm−1 corresponding to heme vibrations in deoxyhemoglobin (Brazhe et al., 2018; Torres Filho et al., 2008) (Fig. 3d, dark brown spectrum). These spectral changes indicate deoxygenation of oHb in erythrocytes in the blood clot due to the local cessation of blood flow and diffusion of O2 from the blood into the surrounding tissues. This also indicates local absence of O2 delivery to the brain tissue and the development of local tissue ischemia.
To estimate the redox state of the mitochondrial ETC in neurons and astrocytes, we recorded Raman spectra from identified cells in the vicinity of the thrombosed arteriole (Fig. 4a). Raman spectra of neurons and astrocytes exhibited similar structure, showing intensive peaks corresponding to the vibrations of bonds in the hemes of reduced cytochromes bl, bh, c1 and cytochrome c in ETC of mitochondria (peaks with maxima positions at 750, 1126, and 1585 cm−1), as well as to the vibrations of bonds in lipids (peak with the maximum at 1440 cm−1) and peptide bond in proteins (peak at 1660 cm−1; Fig. 4b,c). Photothrombosis did not affect the redox state of mitochondrial ETC in neurons, as indicated by the consistent relative intensity in cytochromal Raman peaks in neuronal spectra under normoxia and 60 min after photothrombosis (Fig. 4b) and as the similar ratio of peak intensities I750/I1440 and I1126/I1440 representing relative amount of reduced c and b-type cytochromes (Fig. 4d,e, blue bars). In contrast, 60 min after photothrombosis, the ETC of astrocytes demonstrated increased loading with electrons, evident from the increase in the relative intensities of all cytochrome Raman peaks (Fig. 4c) and the elevated ratios of peak intensities I750/I1440 and I1126I1440, corresponding to the rise in the relative amounts of reduced cytochromes of c and b-types. Dynamics of changes in both ratios are similar, so we suppose that accumulations of reduced forms of both c and b-type cytochromes are also compatible. Reduction of electron carriers in complex III and accumulation of reduced cytochrome c suggest increased loading of the entire astrocytic ETC with electrons and the increase in the amount of O2 •− generated in complexes I and III leading to the formation of other ROS. We hypothesize that during the acute phase of ischemia in astrocytes O2 •− may not convert into H2O2 in the mitochondrial matrix but rather into other reactive forms, for example, ONOO¯, and therefore, we only observed the significant rise in mitochondrial H2O2 at later stages (Fig. 2a,c). This suggestion is supported by recently reported data on NO synthesis in astrocytic mitochondrial ETC under hypoxia due to the nitrite reduction on sulfite oxidase that accepts electrons from the ETC under its overloading with electrons (Christie et al., 2023). Thus, ischemia can lead to the generation of NO and O2 •− in close vicinity to each other, resulting in their interaction and ONOO¯ formation in the mitochondria of astrocytes. Neurons seem to be less sensitive to the conditions of local ischemia induced by photothrombosis, possibly due to O2 diffusion from surrounding tissues and lactate shuttling from astrocytes to neurons for metabolic support (Bolaños, 2016; Bonvento and Bolaños, 2021). Remarkably, that in astrocytes the ETC loading with electrons decreases to its control level in 20 h after photothrombosis and in 40 h after photothrombosis the relative amount of reduced mitochondrial cytochromes significantly decreases below the normoxia level indicating lower amount of electrons in ETC (Fig. 4d,e). With it, ETC redox state in neurons does not change significantly at any of the studied time intervals.
Discussion
Stroke is a severe disease that affects various types of cells and tissues. The pathological state of the brain is accompanied by the development of oxidative stress, caused by an imbalance in the regulation between antioxidant and ROS-producing systems. Ischemia/reperfusion of cerebral tissues leads to disruption of many biochemical processes. Oxidative stress is regarded as a key damaging factor (Allen and Bayraktutan, 2009; Manzanero et al., 2013). In response to ischemia/reperfusion, brain cells, each specialized in certain functions, activate various mechanisms to maintain tissue viability. Neurons, as one of the most energy-consuming cells, are particularly vulnerable to ischemia/reperfusion. The mechanisms of neuronal death in ischemic stroke are well described in the literature (Tuo et al., 2022). Neurons located in the penumbra zone trigger signaling pathways in order to prevent death, whereas surrounding cells play a crucial role in their protection. For example, astrocytes undergo global morphological and biochemical changes even at the early stages of pathogenesis, which leads to the launch of antioxidant cellular defense systems, the production of neurotrophic and inflammatory factors, and other active components (Shen et al., 2021). In the context of astrocyte-neuron networks, it is known that astrocytes can protect neurons from oxidative stress through various mechanisms (Bell et al., 2011; Chen et al., 2001; Griffin et al., 2005; Hayakawa et al., 2016; Shih et al., 2003; Wang and Cynader, 2000). At the same time, the role of reactive astrocytes in the development of neuroinflammation is also well established (Liu and Chopp, 2016; Min et al., 2015; Morizawa et al., 2017; Rakers et al., 2019). Despite conflicting information about its involvement in pathogenesis, astrocytes possess more efficient mechanisms for coping with hypoxia in brain tissues than neurons. They can synthesize a substantial amount of ATP through glycolysis and are capable of fully switching to this pathway under hypoxia or other negative conditions affecting the ETC (Almeida et al., 2004; Herrero-Mendez et al., 2009). The switch to glycolysis also occurs when astrocytes need to provide metabolic support to neurons: astrocytes synthesize lactate and shuttle it to neurons to maintain their oxidative phosphorylation and astrocytes also start to utilize fatty acids to support their own ETC (Bolaños, 2016; Bonvento and Bolaños, 2021). Importantly, the organization of astrocytic ETC differs from that in neurons: while neuronal ETC complexes are organized in respirasomes providing fast electron transport, astrocytic ETC complexes do not form supercomplexes, leading to higher production of O2 •− and H2O2 (Lopez-Fabuel et al., 2016) than neurons. This is probably why astrocytes have better antioxidant protection. Astrocytes produce a variety of antioxidants including GSH, ascorbate, ROS-detoxifying enzymes (He et al., 2022; Makar et al., 1994).
In the present study, we compared the dynamics of H2O2, a key marker of oxidative stress, and mitochondrial ETC function in neurons and astrocytes of rat and mouse brain tissue during the development of ischemic stroke and in the reperfusion period in vivo. Using HyPer7 biosensor and a fiber-optic interface technology, we observed pronounced but rather slow changes in the dynamics of H2O2 levels in cells of rat`s brain tissues after MCAO (Fig. 2a,c). This is consistent with our previous data where we demonstrated that during the first hours of ischemia/reperfusion there is no marked increase in H2O2 levels in brain tissue in the central stroke core (Kelmanson et al., 2021; Kotova et al., 2023). In this series of experiments, we recorded HyPer7 signal over longer time intervals and found that astrocytes tend to generate more H2O2 than neurons. At later stages of pathogenesis, the difference becomes more pronounced (Fig. 2a,c). We also detected redox differences between neurons and astrocytes during ischemia using Raman microspectroscopy in vivo. We observed a greater loading of the mitochondrial ETC with electrons in astrocytes compared with neurons during the first hour of ischemia caused by local photothrombosis of cortical arterioles in awake mice. Of course, we cannot directly compare the results obtained in the rat model of MCAO-induced stroke and the mouse model of photothrombosis-induced stroke. The choice of different models was determined by the technical features of the approaches we used to study redox parameters. However, these are the first attempts to study mitochondrial redox parameters in vivo in brain tissues during ischemia/reperfusion. Raman spectroscopic approach revealed increase in the amount of electrons in astrocyte ETC under ischemia. It is unlikely that ischemia caused by occlusion of an artery not by photothrombosis but by a special occluder would cause a different effect in rat brain tissues. Overload of mitochondrial ETC by electrons under hypoxia/ischemia is a common cellular response to hypoxic conditions. In particular, we observed a similar effect for various Danio rerio tissues exposed to low levels of O2 (Sergeeva et al., 2025). The observed increase in the amount of electrons in astrocyte ETC under ischemia in different models leads to higher production of O2 •− in complexes I and III that can later be converted to ONOO¯, H2O2, or •OH. However, HyPer7 biosensor whose sensitivity to H2O2 is in the nanomolar range does not reveal significant production of H2O2 in the acute phase of ischemic stroke. We hypothesize that during the initial stage of ischemia, astrocytic mitochondria may primarily produce ONOO¯, since their ETC has been reported to reduce NO from NO2 ¯ under hypoxia (Christie et al., 2023), facilitating the interaction of O2 •− and NO with ONOO¯ formation. Another intracellular scenario may be realized through the initiation of lipid peroxidation. Most probably that overloading of mitochondrial ETC with electrons under ischemia and the pronounced generation of H2O2 in astrocytes are redox events that are significantly separated in time in the studied pathogenesis. We suggest that the increase in astrocytic and neuronal H2O2 in 20 and 40 h after photothrombosis is not associated with mitochondrial ETC since we observed the restoration of ETC redox state and even decreased amount of reduced electron carriers in astrocytes without any change in neuronal mitochondria in 20 and 40 h. So, H2O2 formation is probably a secondary event caused by microglia activation or neutrophil infiltration into the area of developing inflammation.
We have also previously successfully used a combination of genetically encoded biosensors and Raman microspectrometry in different biological systems to detect redox events (Ivanova et al., 2024; Kotova et al., 2023; Sergeeva et al., 2025). This approach allows evaluating several redox parameters at once with high spatiotemporal resolution. Early redox events associated with the functioning of the electron transport system are clearly visible in Raman spectra, whereas biosensors complement the picture by visualizing the dynamics of highly reactive compounds. Further improvement of instrumental approaches that allow combining these methods in complex in vivo systems will certainly lead to a more detailed map of redox events in acute pathological processes.
Materials and Methods
Genetic constructs and viral vectors
In this study, we used AAV9. Neuron-specific expression was achieved by using a neuron-specific promoter—hSyn1 fused with the CMV immediate-early enhancer. A detailed scheme of neuron-specific constructs was described in our previous works (Kelmanson et al., 2021; Kotova et al., 2023). To target the expression of the genes of interest in astrocytes, we used a modified astrocyte-specific promoter—shortened GFAP without Alu repeats (Brenner and Messing, 2021). The GFAP promoter was inserted into the multiple cloning site using MluI and EcoRI (FD, Thermo Fisher Scientific) restriction sites of the AAV9 plasmid (Stratagene). The gene encoding the ultrasensitive biosensor for H2O2 detection—HyPer7 (Pak et al., 2020)—was inserted into the MCS using EcoRI and HindIII (FD, Thermo Fisher Scientific) restriction sites of the AAV9-GFAP and AAV9-hSyn1 sites for astrocytic and neuronal expression, respectively. For cloning HyPer7 into the AAV vector, we employed a previously generated eukaryotic vector from our laboratory—the pC1-HyPer7-dMito vector with the mitochondrial signaling tag. Targeted localization of the biosensor in the mitochondrial matrix was ensured by using an MTS2 (Rizzuto et al., 1989).
Plasmid DNA purification was performed by commercial kits according to the manufacturer’s instructions (QIAprep Spin Miniprep Kit, Qiagen). The functionality of all genetic constructs was tested on cell cultures under a fluorescent microscope (Zeiss Axiovert 200 M). Primary hippocampal mixed culture was analyzed in 1 week after transfection with 1 μg plasmid DNA Lipofectamine LTX with Plus Reagent (Invitrogen, ThermoFisher Scientific). The virus titers were 1.4 × 10¹³ VG/mL for AAV9-hSyn1-HyPer7-mito and 4.4 × 10¹² VG/mL for AAV9-GFAP-Hyper7-mito.
Cell culture
To test the resulting genetic constructs, we used the primary mouse embryonic hippocampal mixed culture. Cells were isolated from 17-day-old C5BL/6 mouse embryos as previously described (Seibenhener and Wooten, 2012; Institutional Animal Care and Use Committee [IACUC] protocol no. 357). Primary cells were cultured in minimal essential medium (Sigma) supplemented with 1% penicillin/streptomycin (Gibco), 5% fetal bovine serum (BioloT), 10 mM HEPES (PanEko), 0.6% d-glucose (Helicon), 2 g/L sodium bicarbonate (Dia-M), 1% GlutaMax (Gibco), and 2% B27 supplement (Gibco) at 37°C in 5% CO2. For transient expression of genes encoding biosensor HyPer7 of neurons and astrocytes, we used AAV-based vectors, serotype 9. Mixed primary cell culture was transduced with viral particles at an MOI of 10,000 VG/cell.
Animal husbandry
Breeding and housing of C57BL/6 mice and SHR (both females and males) were performed in the animal facilities of the Institute of Bioorganic Chemistry of the Russian Academy of Sciences (IBCh RAS) and Pirogov Russian National Research Medical University. All animals were maintained on a 12-h light-dark cycle with free access to food and water.
Animal cohorts
Cohort sizes were determined based on power estimations conducted using G*Power 3.1 software to ensure adequate statistical power for detecting expected differences. For the rat experiments, power analysis indicated that a total sample size of 18 rats (with 2 groups and 6 repeated measurements per group) would yield an actual power of 0.96 using a repeated measures analysis of variance (between factors). Based on our previous data and to account for potential dropouts (e.g., animals reaching humane endpoints or meeting exclusion criteria before the end of the experiment), the total sample size was doubled. Each resulting experimental group comprised females and males in equal ratios (1:1). The inclusion criteria for rats included age (3–6 months), weight (220–280 g), good health status, and the integrity of the implanted optical fibers. The final number of animals included in the statistical analysis was 18 rats: 10 rats in the first group (5 males and 5 females) and 8 rats in the second group (5 males and 3 females). In experiments with mice, we used two groups of mice with HyPer 7 in mitochondria of neurons (5 animals, 3 females and 2 males) or in astrocytes (6 animals, equal amounts of males and females). The inclusion criteria for mice were the integrity of the cranial window, good state of health, age of 6–9 months, and weight of 26–30 g.
Surgical procedures and postoperative care
For all surgical procedures, inhalation anesthesia was induced and maintained with isoflurane (2%–3% for induction and 1%–1.5% for maintenance as needed). In addition, analgesia was provided using 0.25% bupivacaine (administered subcutaneously, s.c., at the surgical site) and ketoprofen (5 mg/kg, s.c.). Postoperative analgesia was provided with ketoprofen (5 mg/kg, s.c.), administered immediately after surgery and then every 24 h for 48 h. Animals were housed for no more than 48 h after surgical intervention in accordance with the approved protocols. In rat experiments, animals were monitored continuously during the immediate postoperative period and at least every 12 h for 48 h following surgery. If any animal exhibited severe signs of distress—including significant weight loss, a hunched posture, decreased mobility, or other abnormal behaviors indicative of pain or suffering—humane endpoint criteria were applied. Animals meeting these criteria were humanely euthanized immediately, in accordance with institutional guidelines and the approved animal care protocol.
All procedures were conducted under the supervision of the IBCh IACUC, in accordance with the Regulations of the Ministry of Health of the Russian Federation and in compliance with ARRIVE 2.0 guidelines. Research plans were approved under IBCh IACUC protocols no. 354 and no. 360.
Injection of viral particles and implantation of optical fibers into the rat brain
The injection of viral particles was performed as previously described in our works (Kelmanson et al., 2021; Kotova et al., 2023). Briefly, stereotaxic setup was used to inject viral particles at CPu (dorsal striatum) in a bilateral manner (coordinates: AP = −0.9; ML = ±4.0; DV = −5.2). To do this, two burr holes (0.4 mm) were drilled in the skull under stereotaxic guidance (digital stereotaxic instrument, Stoelting Co.) 0.9 mm posterior to bregma and 4.0 mm lateral to the midline. A 33-gauge needle attached to a 5-μl Hamilton syringe, connected to a stereotaxic injector (Stoelting Co.), was slowly inserted through each burr hole to a depth of 5.2 mm below the skull surface. Then, 1 μL of AAV9 suspension with vector encoding the mitochondria-targeted HyPer7 biosensor under the control of either a neuronal (hSyn1) or an astrocytic (GFAP) promoter was slowly injected into the CPu at a rate of 200 nL/min. Each animal received only one type of vector, ensuring that HyPer7 was expressed in either neurons or astrocytes. Immediately following the injection, optical fibers were implanted into the rat brain at the same coordinates and fixed with a light-cured dental composite resin (DentLight-Flow A3, Vladmiva).
Injection of viral particles and cranial window implantation on mouse cortex
The injection of viral particles and installation of cranial windows were performed as previously described in our works (Chebotarev et al., 2024; Kotova et al., 2023). Briefly, for this procedure we also used the stereotaxic setup (Stoelting Co. or RWD). A 3 mm craniotomy above the cortex was performed by a drill (RWD). Next, a viral particle suspension AAV9-hSyn1-HyPer7-mito or AAV9-GFAP-Hyper7-mito with the indicated titer in a volume of 1 μL was injected into the cerebral cortex (AP = −2.3, ML = +0.5, DV = −1.0). A 5 mm cover glass (Thomas Scientific) was placed in the craniotomy area, after which a metallic head-stage adapter (custom-made, metal) was attached to the skull using a mixture of dental cement (Simplex rapid powder, Kemdent) and cyanoacrylate glue (Cosmofen Сa-12). The head-stage adapter was used for further fixation of the animal in the experimental setup (Raman confocal microspectrometer, Renishaw).
MCAO model in rats
MCAO model was used to model ischemic stroke in SHR. The procedure was the same as previously described in our article (Kelmanson et al., 2021) with minor modifications. The transient 60-min occlusion of the middle cerebral artery followed by reperfusion was performed 4 weeks after fiber-probe implantation. In this study, we used two groups of animals: one with a transient expression of mitochondrial HyPer7 in neurons and another group with the same gene expression in astrocytes under the hSyn1 and GFAP promoters, respectively.
For the signal measurement, the animal was lightly anesthetized (isoflurane 1.5%) to reduce stress and then immediately placed back into an individual cage. After 48 h of reperfusion, the animal was euthanized with an overdose of isoflurane, followed by cervical dislocation and decapitation. The brain was then sliced into 2-mm coronal sections. The slices were immersed in a 1% solution of 2,3,5-triphenyltetrazolium chloride in saline for 15–20 min. The infarct area was identified by the absence of red staining.
Confirmation of fluorescent signal in rat brain tissue at the desired location
To verify the expression of HyPer7 in neurons and astrocytes, two rats were injected by AAV particles with vectors AAV9-hSyn-HyPer7-mito and AAV9-GFAP-HyPer7-mito. Four weeks after the injections, the rats were deeply anesthetized via intraperitoneal administration of a mixture of tiletamine/zolazepam/xylazine at doses of 40/40/20 mg/kg. Once anesthetized, the rats underwent transcardiac perfusion with 0.01 M phosphate-buffered saline (PBS, pH 7.4), followed by cold 4% paraformaldehyde in PBS (pH 7.4) according to standard procedures. The brains were then removed from the skulls and postfixed overnight in 30% sucrose at 4°C. The next day, the brains were washed in PBS and sagittally sectioned with a Leica VT1200S vibratome (Leica-Microsystems) to obtain free-floating slices of 50 μm thickness. AAV infection was identified by biosensor fluorescence, and the slices were further processed for immunofluorescent staining with antibodies against GFP (anti-GFP, Evrogen, cat.# AB011), GFAP (antibodies were kindly provided by Hy-Test, cat.# 4G25), and NfL (antibodies were kindly provided by Hy-Test, Cat.# 4NF3) to detect HyPer7, astrocytes, and neurons, respectively. Anti-GFP antibodies were used to confirm HyPer7 expression because this biosensor is based on YFP, which in turn is derived from GFP. Initially, the slices were permeabilized in 4% Triton X-100 (Sigma-Aldrich, #T8787) in PBS for 1 h and then blocked with 5% goat serum (Sigma-Aldrich, #G9023) in PBS containing 0.1% Triton X-100 for 1 h. Subsequently, the slices were incubated overnight at 4°C with a primary rabbit anti-GFP polyclonal antibody (1:5000) and either a primary monoclonal mouse anti-NfL (1:250) or anti-GFAP (1:250), diluted in blocking solution. The next day, the slices were washed three times in PBS, followed by 2-h incubation at room temperature with secondary antibodies: goat anti-mouse IgG conjugated with Alexa Fluor 568 (1:500, Thermo Fisher Scientific, #A11031) and goat anti-rabbit IgG conjugated with Alexa Fluor 488 (1:500, Thermo Fisher Scientific, #A11034). DAPI (Sigma-Aldrich, #D9542, 1:2000) was also included for nuclear staining.
After staining, the slices were washed three times in PBS, mounted onto gelatin-coated glass slides, and covered with VECTASHIELD® Antifade Mounting Medium H-1000 (Vector Laboratories). Confocal imaging was performed with an Olympus Fluoview FV3000 inverted fluorescent microscope. Z-stacks of the imaged area were acquired using Olympus UPLFLN 20× objective with a step size of 1 μm. To prevent overlap of fluorescent signals from adjacent channels, each channel was scanned sequentially (plane by plane), using laser lines at 350, 488, 488, and 568 nm to excite DAPI, GFP, NfL-36-Alexa Fluor 488, and GFAP-Alexa Fluor 568, respectively.
Modeling local transient stroke in mouse cortex by photothrombosis with Rose Bengal dye
Local ischemic stroke was induced by photothrombosis, based on photoactivation of Rose Bengal (4,5,6,7-tetrachloro-2′,4′,5′,7′-tetraiodofluorescein, Sigma) through laser illumination of a chosen arteriole in the somatosensory cortex of awake mice. A 3 mg/mL solution of the Rose Bengal was prepared within 2 h prior to the experiment using powdered Rose Bengal (Sigma) and sterile 0.9% sodium chloride solution and was kept in the dark until use. The estimated dose was in the range of 20–30 mg/kg. Prior to photothrombosis, Raman spectra were recorded from the selected arteriole with a diameter of 40–50 μm, as well as from identified neurons and astrocytes in adjacent regions in the cortex of the head fixed animal, as was previously described (Kotova et al., 2023). Rose Bengal was administered via intraperitoneal injection and photoactivated in 20–30 min by the continuous illumination of the arteriole with 532 nm laser of 3–4 mW power per 800-nm diameter spot during 10–15 min. The described laser illumination was performed on the same arterioles for which Raman spectra have been recorded under normoxia. Arteriole occlusion caused by laser photoactivation of Rose Bengal was monitored visually by observing blood clot formation and the disappearance of the downstream arteriole segments. Arteriole occlusion was also seen on Raman spectra of blood demonstrating hemoglobin deoxygenation in the place of the blood clot formation. In all experiments, vascular recanalization occurred 90–120 min after the laser-induced photothrombosis, as indicated by the restoration of arteriole shape in reflected white light and by the restoration of the full blood saturation with oxygen measured by Raman microspectroscopy. For each animal, only one cortex arteriole was subjected to laser-induced photothrombosis.
In vivo site-specific fiber-optic photometry with HyPer7 biosensor in rat brain tissues
Simultaneously recording H2O2 dynamics at several sites across a rat’s brain during a stroke, we implanted two fibers into the brain tissue. Two LEDs with central wavelengths of 405 and 490 nm (M405F1и M490F, Thorlabs) were used in our experiments to provide optical excitation for genetically encoded fluorescent biosensor HyPer7. The LED outputs were delivered via fiber-optic cables and collimated with 10.9-mm-focal-length fiber-optic collimators (Thorlabs, F220SMA-A). Suitable spectral filters were inserted in both arms of this scheme for a better spectral isolation of two radiation fields used for fluorescence sensor excitation. The beams were then combined by a dichroic mirror. A slightly tilted bandpass filter (ET480/20, Chroma) was used for this purpose and 490 nm light filtering. A 405 nm light was filtered by a shortpass filter (FESH450, Thorlabs). The combined beam was focused with a 150-mm-focal-length lens and a microscope objective (10×, Olympus) to be coupled into long, ≈1.5-m segments of optical fiber (FG105UCA, Thorlabs). For the duration of measurements, these fiber segments were connected to the fiber probes implanted into the rat’s brain, thus providing an optical excitation of HyPer7. The fluorescence signal from the biosensor was collected by the fiber probes implanted into the rat’s brain and delivered to the detection system via the same fiber-optic tract but in the opposite direction. Before reaching a CCD camera (4070C-GE-TE, Thorlabs), the fluorescence readout passes through an additional bandpass filter (Chroma, 525/50), which rejects the scattered excitation light, thus providing a high contrast of fluorescence readout detection. We used glass-clad multimode fibers with 105/125 core/cladding diameter (FG105UCA, Thorlabs). The ≈1.5-m stretch of optical fiber was cut and fed through furcation tubing. Both fiber ends were stripped from acrylate coating and cleaved. The distal end was then coated with a UV-cured optical adhesive (NOA61, Thorlabs) and inserted inside a standard telecommunication ceramic ferrule for LC connectors. The glue was cured under UV illumination, and then the protruding fiber tip was cleaved using a manual ruby cleaver and removed. After that ceramic ferrule was fixed inside the polishing puck and manually polished using a series of polishing sheets. Finally, a 5-cm piece of adhesive heat shrink tubing was passed over the ferrule and furcation tube and shrunk using a heat gun. The proximate ends of two long fibers were glued together using a drop of NOA61∼3 cm from the tip and cleaved. This resulted in two nearly flat fiber tips located in the same focal plane. Implantable fiber probes were fabricated on an in-house-built fiber processing bench using in-house-tailored fiber components and fiber processing tools. As the first step of the fabrication procedure, a factory-polished multimode patch cable was connected to a ceramic ferrule with a standard Lucent-connector-type ceramic sleeve. A short segment of bare optical fiber was then inserted inside the ceramic ferrule and fixed using a drop of UV-cured glue at the base of the ferrule. The length of each bare-fiber segment was chosen in such a way as to provide optical interrogation of a specific targeted area inside the rat’s brain. To this end, the length of each bare-fiber segment was adjusted with an accuracy well within 20 μm using a fiber cleaver (Thorlabs, XL411) driven by a computer-controlled motorized translation stage (Thorlabs, MT1/MZ8) on an in-house-assembled fiber-cleavage frame. Transmission properties of each fiber probe were carefully characterized, using a power meter (PM100D with an S120VC power sensor, Thorlabs). Only fiber probes with an overall transmission above 85% were used for implantation and subsequent measurements. Time-resolved traces of the HyPer7 fluorescence readout are recorded with a CCD camera, whose strobe output is read out with a multifunction I/O Device (I/O card, NI USB-6356), programmed with in-house-developed dedicated software, to gate the LED output (Fig. 1a) within gating pulses of adjustable pulse width and repetition rate. With up to four fiber-probe end faces simultaneously imaged onto the CCD camera via a suitably adjusted 4f imaging system, including a microscope objective (Olympus, 10X MPLN) and a 150-mm focal-length lens (Fig. 1a), each camera frame recorded at a given instant of time t yielded four fluorescence readouts from four specific sites inside the brain. Three frames were recorded for each t. Two of these frames captured fluorescence readouts from HyPer7 as quantifiers of H2O2 at two excitation wavelengths (405 and 490 nm) from multiple sites within the brain tissue. The third frame records the overall background signal needed for accurate quantitative data analysis. The average power of LEDs was kept below 1 μW, which excluded any photobleaching within the entire time span (up to 3–4 h) needed to record full traces of 405- and 490-nm light driven fluorescence readouts from all the fiber probes used in a given measurement for a meaningful characterization of H2O2 dynamics.
In vivo Raman microspectroscopy for the estimation of the mitochondrial redox state in astrocytes and neurons of the somatosensory cortex of awake mice during local ischemia induced by photothrombosis
Raman spectra of neurons, astrocytes, and blood vessels were recorded using confocal Raman microspectrometer InVia Qontor (Renishaw, UK) with 532 nm laser excitation and the grating 1800 lines/mm. To record Raman spectra from cells and vessels, an awake mouse was fixed by the head plate in the special head stage mounted to the treadmill positioned on the microscope table under the objective 20×, NA 0.4. Astrocytes or neurons were identified by HyPer7 fluorescence spectra excited with a 473 nm laser (excitation power <0.1 mW and spectrum accumulation time 1 s). An arteriole subjected to the photothrombosis was identified by the Raman spectrum demonstrating Raman peaks characteristic to oHb only. For the investigation of the local ischemia effect on neurons and astrocytes, we used identified cells in the close vicinity of the arteriole (no further than 50 μm from the arteriole wall). Raman spectra of astrocytes and neurons were recorded under 532 nm laser excitation with the laser power of 1 mW per the registration spot with the diameter of 800 nm. Spectrum accumulation time was 20–30 s depending on the Raman scattering intensity. Raman spectra of cells were recorded under normoxia conditions—before Rose Bengal injection—and at 30 and 60 min after the photothrombosis initiation by the laser illumination of the chosen arteriole. Raman spectra of the chosen arterioles were recorded at normoxia, in 5, 10, 30, 60, and 120 min after the laser-induced photothrombosis, and in 20 and 40 h using 532 nm laser excitation with the laser power of 1 mW per the registration spot with the diameter of 800 nm. The accumulation time of arteriole Raman spectra was 1 s. It is important to note that the laser power used for the Rose Bengal-induced photothrombosis was 3–4 times higher than for the recording of Raman spectra of arterioles, astrocytes, and neurons, and the exposure time for the photothrombosis was significantly longer than Raman spectra accumulation time.
Analysis of Raman spectra
Raman spectra were analyzed with open-source software Pyraman, available at https://github.com/abrazhe/pyraman. Fluorescence spectra were used solely for identification of astrocytes and neurons and were not further analyzed. The baseline was subtracted in each Raman spectrum, and it was defined as a cubic spline interpolation of a set of knots, number, and x-coordinates of which were selected manually outside any informative peaks in the spectra. The number and x-coordinates of the knots were fixed for all spectra in the study, and coordinates of the knots were defined separately for each spectrum as 5-point neighborhood averages of spectrum intensities around the user-specified x-position of the knot. After the baseline subtraction, the intensities of peaks with the following maximum positions were defined: 750, 1126, and 1440 cm−1. These peaks correspond to vibrations of bonds in heme molecules of reduced c and b-type cytochromes and H-C-H bonds in fatty acids of lipids (Brazhe et al., 2012; Love et al., 2020; Okada et al., 2012). Reduced cytochromes of c and b-types contribute differently to peaks at 750 and 1126 cm−1. Thus, in Raman spectra of c-type cytochromes the relative intensity of the peak at 750 cm−1 vs. peak intensity at 1126 cm−1 is higher compared with Raman spectra of b-type cytochromes (Ogawa et al., 2009; Okada et al., 2012). To estimate changes in the relative amount of reduced c and b-type cytochromes in mitochondrial ETC, we calculated the following ratios: I750/I1440 and I1126/I1440 corresponding to the relative amount of reduced c and b-type cytochromes vs. total amount of lipids in brain cells. Here we supposed that changes in the first ratio should be mainly due to the changes in the amount of reduced c-type cytochromes and that changes in the second ratio should be mainly due to the changes in the relative amount of reduced b-type cytochromes (Kotova et al., 2023; Popov et al., 2023).
Statistical analysis
All statistical analyses were performed using GraphPad Prism (version 9.5.1). Data are presented as box-and-whisker plots with whiskers indicating the minimum and maximum values, the box spanning the 25th to 75th percentiles, the line in the middle representing the median, and the “+” symbol if presented indicating the mean, as specified in the figure legends. The normality of data distributions was assessed using the Shapiro–Wilk test. For repeated measures data, such as the relative quantification of hydrogen peroxide and relative amount of reduced cytochromes in Figure 2(a, b, c) and relative amount of reduced cytochromes in Figure 4(d, e), a mixed-effects model was employed using restricted maximum likelihood estimation with Šídák’s or Dunnett’s multiple comparisons test. This approach was chosen because it accommodates missing data and differences in sample sizes across time points. Missing values arose from technical constraints during data collection, and no data were excluded from the analysis as outliers. Statistical significance was set at p < 0.05.
Footnotes
Acknowledgments
We are happy to have a friendship with Professor Aleksei Zheltikov and Matvei Pochechuev and thank them for their key contributions to the development of technologies for real-time monitoring of redox events in brain tissues in vivo.
Authors’ Contributions
D.A.K., A.D.I., I.V.K., Y.V.K., and D.S.B. performed all experiments on rodent models of stroke; K.I.M., A.B.T., A.A.F., and N.A.B. performed all experiments using Raman microspectroscopy; M.A.S., E.A.S., A.B.F., and I.V.F. developed and maintained the functioning of fiber-optic neurointerface; A.V.Z. and V.A.O. maintained the functioning and adjustment of confocal Raman microspectrometer; A.A.M. prepared viral particles AAV9; A.S., A.G.K., and V.V.B. conducted consultations; D.A.K., A.D.I., N.A.B., and D.S.B. analyzed data and prepared the article; and N.A.B. and D.S.B. designed the experiments of the research.
Author Disclosure Statement
The authors declare that they have no known competing financial interests or personal relationships that could have appeared to influence the work reported in this article.
Funding Information
This work was supported by the Russian Science Foundation (RSF) Grant 22-15-00299 (work with animal models of stroke, registration of redox processes with HyPer7 biosensor) (to D.S.B.); Raman spectroscopy experiments were done with financial support from RSF, grant number 23-74-00006 (to A.V.Z. and N.A.B.); development and the application of the mathematical python-based tools for the analysis of Raman spectra were supported by Non-commercial Foundation for the Advancement of Science and Education “INTELLECT” (to K.I.M.). Viral particles AAV9 were prepared and tested with financial support from RSF, grant number 23-75-30023 (to V.V.B.). Optical system development for the biosensors imaging in vivo was supported by the RSF Grant 22-72-10044.