
Abstract
The determination of the microbial load of a spacecraft en route to interesting extraterrestrial environments is mandatory and currently based on the culturable, heat-shock-surviving portion of microbial contaminants. Our study compared these classical bioburden measurements as required by NASA's and ESA's guidelines for the microbial examination of flight hardware, with molecular analysis methods (16S rRNA gene cloning and quantitative PCR) to further develop our understanding of the diversity and abundance of the microbial communities of spacecraft-associated clean rooms.
Three samplings of the Herschel Space Observatory and its surrounding clean rooms were performed in two different European facilities. Molecular analyses detected a broad diversity of microbes typically found in the human microbiome with three bacterial genera (Staphylococcus, Propionibacterium, and Brevundimonas) common to all three locations.
Bioburden measurements revealed a low, but heterogeneous, abundance of spore-forming and other heat-resistant microorganisms. Total cell numbers estimated by quantitative real-time PCR were typically 3 orders of magnitude greater than those determined by viable counts, which indicates a tendency for traditional methods to underestimate the extent of clean room bioburden. Furthermore, the molecular methods allowed the detection of a much broader diversity than traditional culture-based methods. Key Words: Planetary protection—Clean rooms—Microbial diversity—Bioburden—qPCR. Astrobiology 12, 572–585.
1. Introduction
Since bacterial spores primarily seem to have the potential to survive a flight to Mars as hitchhikers on a spacecraft (Crawford, 2005), current planetary protection constraints are based on a strict protocol that aims at their cultivation and quantification. This protocol, which is quite similar for ESA and NASA measurements, dictates the sampling and the processing of the samples (sampling tools, time-frame, handling, temperature limits, cultivation media, etc.) to ensure reliability and reproducibility of the method. It also includes a heat-shock step for the determination of resistant bioburden, by which the vegetative cells will be killed (NASA, 1999; ECSS-Q-ST-70-55 Working Group, 2008). The resulting number of colony-forming units (CFU) per square meter that appear after plating the heat-shocked samples on agar plates serves as a basis for the calculation of the overall bioload (“bioburden”). This bioburden must be below a predetermined value, depending on the type of mission; for a spacecraft landing on Mars, outside special regions, the acceptable microbial contamination is defined as 300 spores/m2 and a total of 500,000 spores on a spacecraft (Viking pre-sterilization biological burden; COSPAR, 2005; Pillinger et al., 2006).
The limitations of these cultivation-based bioburden determination protocols as indicators of contamination risk are understood and have been described previously (Crawford, 2005). Nevertheless, the traditional culture protocol is still used as an indication for the biological contamination of a spacecraft because it is reliable, robust, and independent to a large extent from developments of individual companies that provide the tools and consumables for the assay.
Despite the continued use of the culture protocols on flight hardware, it is also important to evaluate the microbial diversity, especially in spacecraft-associated environments. Previous publications have revealed that spacecraft assembly facilities, although depleted in nutrients and water and therefore representing an “extreme” environment for microorganisms (Venkateswaran et al., 2001), harbor a broad diversity of (specifically adapted) microbial inhabitants (Newcombe et al., 2005; La Duc et al., 2007; Stieglmeier et al., 2009). The background of microbial growth or persistence in these facilities is not yet understood, but the evaluation of a possibly well-adapted microbial community is also important to assess and challenge biological contamination control measures.
It is well known that the molecular analysis of microbial samples is subject to biases, including DNA extraction, PCR, selection of primers, and other steps (Von Wintzingerode et al., 1997). Nevertheless, the sensitivity of PCR allows the detection of unculturable organisms or organisms present at very low abundance. These microbes that are undetectable by traditional culture-based methods (Hugenholtz et al., 1998) may constitute a high risk of contamination to destination environments. However, only successful cultivation allows the characterization of microbes and evaluation of their specific resistances and properties.
Many clean room isolates obtained so far have revealed amazing properties and resistances (e.g., against temperature, UV, and desiccation). Some of them even showed metabolic properties (e.g., autotrophic or anaerobic growth) that could support their survival in extraterrestrial environments and therefore bear a risk for future life-detection missions (La Duc et al., 2007; Stieglmeier et al., 2009).
Previous molecular studies of US spacecraft assembly clean rooms have reported the detection of diverse (and so far uncultivated) Bacteria and even Archaea (Moissl et al., 2007, 2008; La Duc et al., 2009) and have increased the knowledge of the microorganism diversity and abundance of a typical clean room significantly. However, most of the detectable Bacteria and Archaea are still uncultivated, which highlights the general deficiency of current cultivation techniques and emphasizes the need for alternative cultivation strategies. For instance, by using anaerobic cultivation techniques, strictly anaerobic Bacteria (Clostridium, Propionibacterium) from clean room environments have been isolated that had previously been detected via their 16S rRNA gene only (Stieglmeier et al., 2009; Probst et al., 2010b).
Although it is unclear whether microbes are viable at the moment of sampling, molecular studies can expand the knowledge of the microbial diversity and abundance. Interestingly, the usage of high-density 16S rRNA gene-based microarrays (“PhyloChips”) has demonstrated clean rooms to be contaminated with a broader diversity of microorganisms than was indicated by standard bioburden measurements (Cooper et al., 2011) or classical clone library analysis (La Duc et al., 2009; Vaishampayan et al., 2010). This PhyloChip analysis led to the detection of DNA from approximately one thousand operational taxonomic units (OTU) per square meter in the housing facilities of the Mars Science Laboratory and Phoenix. Compared to standard cloning and sequencing analysis, this is an up to 70-fold increase in observed microbial biodiversity (La Duc et al., 2009).
The methodologies employed to obtain insights into the qualitative microbial diversity are proceeding rapidly, but the overall quantitative bioload is still a serious and mostly unanswered question.
The low biomass in controlled clean rooms does not allow a direct assay of the microbial cells in samples. Furthermore, the cells detected in clean rooms are often attached to particles, which makes it highly difficult to use methods like fluorescence-activated cell sorting or microscopic-based applications (La Duc et al., 2004). The currently available molecular method of choice is the very sensitive quantitative PCR (qPCR). While qPCR requires a DNA extraction step and subsequent PCR, it allows a quantification and identification (dependent on the primer sets used) of 16S rRNA gene copies present in a sample.
In general, the combination of a variety of cultivation assays and molecular methods could provide a more complete picture of the real composition and quantity of the bacterial community structure within the spacecraft assembly clean rooms than cultivation alone (Cooper et al., 2011).
With the exception of one recent publication (Stieglmeier et al., 2009), successful investigations into the microbial diversity in European spacecraft assembly facilities have been very sparse. In this communication, we contribute significant data by applying a combination of three different microbial methodologies to clean room samples from two European locations: ESA's standard procedure for the determination of bioburden, molecular diversity analysis (16S rRNA gene cloning), and qPCR. Additionally, the data derived from molecular diversity analysis in European clean room samples are compared to previously published results from US facilities. The findings from this study will contribute to a better understanding of the microbial diversity and bioburden in spacecraft-associated facilities. The data and insights given here are certainly also very helpful for the pharmaceutical industry and other clean room–dependent industrial sectors.
2. Materials and Methods
2.1. Sampling sites
Selected surface areas within two European spacecraft-associated clean rooms as well as the surface of the Herschel Space Observatory located therein were sampled during different steps of assembly, integration, and testing (Table 1). The clean room at the European Aeronautic Defence and Space Company (EADS) in Friedrichshafen, Germany, was sampled in April and November 2007 (ISO 5, classified according to ISO 14644-1). The third sampling was performed in March 2008 within the Hydra clean room (ISO 8) at the ESA European Space Research and Technology Centre (ESTEC, in Noordwijk, the Netherlands). The clean rooms at EADS (hall 6, room 6101-04) and ESTEC were in operation during sampling, with the Herschel Space Observatory inside. Although this mission was not subject to planetary protection requirements, all clean rooms were environmentally controlled with regard to particles, humidity (55%, relative), temperature (22°C), and air circulation. Nevertheless, directly before the first sampling in Friedrichshafen (April 2007), the curtain separating ISO 5 from ISO 8 was opened to transfer larger items.
FR1: Friedrichshafen, 1st sampling, April 2007. FR2: Friedrichshafen, 2nd sampling, November 2007. ES: ESTEC sampling, March 2008.
SC, spacecraft (spacecraft main body, not mirror); GSE, ground support equipment.
Cultivation assays. Assay 1: heat shock for 15 min at 80°C, plating on TSA medium, incubation at 32°C for 72 h. Assay 2: plating on R2A medium, incubation at 25°C for 72 h.
Swab samples were pooled.
2.2. Sample collection and processing for molecular analyses
Samples were taken by using either BiSKits (biological sampling kits, Quicksilver Analytics, Abingdon, MD, USA) or SpongeSicles (Biotrace [3M], St. Paul, MN, USA) for larger surface areas (e.g., floor). Prior to sampling, SpongeSicles were pre-moistened with 10 mL of sterile water. To extract the samples, SpongeSicles were squeezed and dispersed within their plastic transportation bag. The liquid was removed under a laminar flow to avoid contamination. BiSKits were used according to the manufacturer's instructions.
Nylon-flocked swabs (552C regular swab, microRheologics, Brescia, Italy) were used to swab spacecraft surfaces. The swab sampling and extraction was performed as previously described (Stieglmeier et al., 2009). After sampling, three swabs were pooled and stored in 2.5 mL sterile, PCR-grade H2O. All samples (Table 1) were stored at 4–8°C during transportation.
2.3. Sample collection and processing for bioburden measurements
Sampling was performed as outlined in the European Cooperation for Space Standardization (ECSS) document ECSS-Q-ST-70-55C (ECSS-Q-ST-70-55 Working Group, 2008). Samples were taken either with pre-moistened, sterile wipes (VWR Spec-Wipe 4; VWR International GmbH, Darmstadt, Germany, 15×15 cm) for larger surface areas (here 0.36 m2) or nylon-flocked swabs (pre-moistened with sterile water) for spacecraft and selected clean room surfaces (25 cm2). After sampling, swabs were transferred to tubes containing 2.5 mL of sterile PBST [i.e., phosphate-buffered saline solution including 0.02% (v/v) Tween 80], and wipes were transferred to tubes containing 36 mL sterile PBST. All samples were kept at 4–8°C and processed within 24 h of collection (Table 1).
Wipe samples were vortexed (10 s) and subsequently sonicated for 2 min (±2 s) at 35 kHz (USR 54 H, Merck Eurolab GmbH/Qualilab, Bruchsal, Germany) before any further analysis. As outlined in the standard protocol (ECSS-Q-ST-70-55 Working Group, 2008), samples were heat-shocked at 80°C (±2°C) for 15 min, cooled to 30–35°C within 2 min, and pour-plated on trypticase soy agar (TSA) medium (Becton Dickinson GmbH, Heidelberg, Germany; assay 1). In parallel, 2×2 or 4 mL were pour-plated with 20 mL R2A medium (Sigma-Aldrich Chemie GmbH, Steinheim, Germany) without prior exposure to heat to determine the overall culturable, microbial load (assay 2). All plates were incubated for 72 h at 32°C, and the colonies were counted afterward. A small subset of randomly picked colonies was processed, purified via single colony isolation, and afterward their 16S rRNA genes were partially sequenced.
2.4. Blanks and controls
Field blanks, extraction blanks, and amplification blanks were carried out for molecular studies. Field blanks were taken during each sampling event by waving the sampling material through the air for a few seconds instead of surface sampling (Stieglmeier et al., 2009). For extraction blanks, 1 mL of PCR-grade water was processed in DNA extraction and subsequent procedures. For bioburden measurements, field blanks and media blanks were performed.
2.5. DNA extraction
Samples belonging to the same sampling areas at each sampling site were combined as indicated in Table 1 to obtain a representative sample and increase DNA yield. The pooled samples were concentrated to approximately 1 mL via centrifugation with UV sterilized Amicon Ultra-15 filters (cutoff 50 kDa; Millipore GmbH, Schwalbach, Germany). Samples obtained from the first Friedrichshafen sampling (FR1) were processed with a standard phenol-chloroform DNA-extraction procedure (Moissl et al., 2008). For the other two samplings, a modification of the XS-buffer method (Tillett and Neilan, 2000) was used for DNA extraction as given in a recent publication (Moissl-Eichinger, 2011). In brief, samples were mixed with a buffer containing potassium ethyl xanthogenate and incubated for 2 h at 65°C, followed by a phenol-chloroform-isoamyl alcohol extraction. After precipitation, the DNA was dissolved in 15 μL PCR-grade water.
2.6. PCR and cloning of the bacterial 16S rRNA genes
Bacterial 16S rRNA genes were PCR amplified with the Bacteria-specific forward primer 9bF (5′-GRGTTTGATCCTGGCTCAG-3′) and the universal reverse primer 1406uR (5′-ACGGGCGGTGTGTRCAA-3′, Eder et al., 2001). A purified Taq DNA polymerase was used (Pure Taq DNA Polymerase; Peqlab Biotechnologie GmbH, Erlangen, Germany; final concentration 5 U/μL) to avoid unspecific amplification of E. coli DNA (preparative contamination of standard, recombinant Taq polymerases). The PCR cycling conditions were 95°C for 2 min, followed by 10 cycles of 96°C for 30 s, 60°C for 30 s, 72°C for 60 s, and subsequently another 25 cycles of 30 s at 94°C, 30 s at 60°C, and 60 s at 72°C. The run was finished with a final extension period of 10 min at 72°C. PCR products were purified with the MinElute PCR Purification Kit (Qiagen GmbH, Hilden, Germany), ligated into pJet cloning vectors (Fermentas GmbH, St. Leon-Rot, Germany), and the vectors transformed into chemically competent TOP10F′ One Shot Escherichia coli cells (Invitrogen GmbH, Darmstadt, Germany) according to the manufacturer's instructions.
2.7. Restriction fragment length polymorphism screening and sequencing of clones
Where possible, at least 100 randomly picked clones of every sampling were analyzed by restriction fragment length polymorphism. Inserts were PCR amplified, as described above, except that the vector-specific primers pJEt 1.2 forward and reverse were used (Fermentas GmbH). Amplicons of the correct fragment size (∼1.4 kb) were digested with the restriction enzymes HinfI and BsuRI (Fermentas GmbH) according to the manufacturer's instructions (Vaneechoutte et al., 1992). After electrophoretic separation, clones were grouped according to their banding pattern. One representative of each group was selected, the plasmid from this clone was purified (peqGold Plasmid Miniprep, PeqLab Biotechnologie GmbH), and the insert was sequenced (Geneart, Regensburg, Germany).
2.8. Phylogenetic analysis
Sequences were checked for possible chimeric artifacts with the CHECK_CHIMERA program from the Ribosomal Database Project II (Cole et al., 2003). Possible chimeric sequences were removed from the data set. For a preliminary phylogenetic classification, a BLAST analysis was performed (
2.9. Sequence data and statistical analyses
For an estimation of the detected species diversity, rarefaction analysis (Heck et al., 1975) and coverage calculations (Good, 1953) were applied as described by Moissl et al. (2007). The Shannon-Wiener index (Hs ) was used to measure the diversity within the clone library and thus also gave a raw estimation of the clean room microbial diversity (Shannon, 1948). The Evenness (E), which shows the distribution of individual species within the community, was also calculated (Pielou, 1966) based on the clone libraries generated. Unifrac analyses (Cluster Environments) were implemented as previously described (Lozupone and Knight, 2005; Lozupone et al., 2006).
For the calculations, bacterial 16S rRNA gene sequences from US clean room samplings (Moissl et al., 2007) were compared to the European data sets. All libraries were based on the analysis of approximately 100 or less clones per sample. Further details about the US samplings, the sequences, and the accession numbers, for example, were given earlier (Moissl et al., 2007). For the analyses performed in this study, a total of 218 sequences were aligned, cropped to the same length, and combined into one neighbor-joining tree by using the ARB software package. For Unifrac analyses, jackknifing (100 permutations) was carried out as described (Moissl et al., 2007). The number of sequences to keep was set to 10, and abundance weights were not used for the calculation.
2.10. Nucleotide sequence accession numbers
A representative, partial 16S rRNA gene sequence from each clone group (longer than 800 bases) was submitted to the NCBI nucleotide sequence database. The accession numbers are provided in Table 2 (FR1: EU373541–52, FR2: EU888526–78, and ES: EU888477–507).
Acid, Acidobacteria; Act, Actinobacteria; Bact, Bacteroidetes/Chlorobi; Cyan, Cyanobacteria; Deino, Deinococcus-Thermus; Firm, Firmicutes; Planc, Planctomycetes; Prot, Proteobacteria.
FR1: Friedrichshafen sampling, April 2007. FR2: Friedrichshafen sampling, November 2007. ES: ESTEC sampling, March 2008.
Detected percentage of recombinant sequences belonging to this genus. Bold: Predominant group.
For each location the accession number of one representative recombinant sequence (clone) is given.
All recombinant 16S rRNA gene sequences revealing more than 5% difference to available type species sequences were denoted as “Unclassified.”
2.11. Quantitative real-time PCR
Quantitative PCR was carried out as previously described (Moissl-Eichinger, 2011). One microliter of extracted DNA was used as template, and amplification was performed with the Bacteria-specific primers 338bF- and 517uR (338bF: 5′-ACTCCTACGGGAGGCAGCAG-3′; 517uR: 5′-GWATTACCGCGGCKGCTG-3′; Lane, 1991). Cycle parameters were as follows: 95°C (15 min); 40 cycles of 94°C (15 s), 60°C (30 s), and 72°C (30 s). Standards were developed from PCR products of the 16S rRNA gene from Bacillus atrophaeus, and 10-fold serial dilutions thereof were used (Moissl-Eichinger, 2011). It has been described earlier that commercially available qPCR amplification and detection systems are not completely free of contaminating bacterial DNA (Philipp et al., 2010). Therefore, the very low copy numbers obtained from the field blanks (which were in the range of the extraction blanks) were subtracted from the sample measurements.
As has been shown in various publications, Bacteria usually possess several 16S rRNA gene copies within their genome (Rainey et al., 1996; Conville and Witebsky, 2005), so that qPCR copy numbers do not reflect the number of cells present in a sample. Based on the analysis of approximately 1000 bacterial full genomes (rrnDB; Klappenbach et al., 2001; Lee et al., 2009), the copy numbers obtained were divided by 4.07, the average number of 16S rRNA gene copies per bacterial cell.
3. Results
This communication provides the first data pertaining to microbial diversity and bioburden in European spacecraft assembly facilities. For this, two different European spacecraft-associated clean rooms were analyzed extensively. During the three sampling events (Friedrichshafen was sampled twice), the clean rooms harbored the Herschel Space Observatory and were under full operational status.
3.1. Molecular diversity
One clone library was generated for each location from pooled clean room floor samples (Table 1). For the first sampling in Friedrichshafen (FR1), DNA extraction procedures based on conventional phenol-chloroform extraction resulted in DNA degradation. The degraded DNA affected the efficiency of full-length 16S rRNA gene amplification. This led to only 55 recombinant clones with a full-length 16S rRNA sequence insert, which could be further analyzed. Nevertheless, high-quality DNA was obtained by using a different DNA extraction method in subsequent studies, which allowed 105 and 110 clones to be analyzed for the FR2 and ESTEC (ES) samples, respectively. The Good's coverage values ranged from 93% for FR1, 76% for FR2, and 85% for ES, which indicates a less complete analysis of the microbial diversity accessible by the generated clone library. These data were confirmed by rarefaction analysis (Fig. 1).
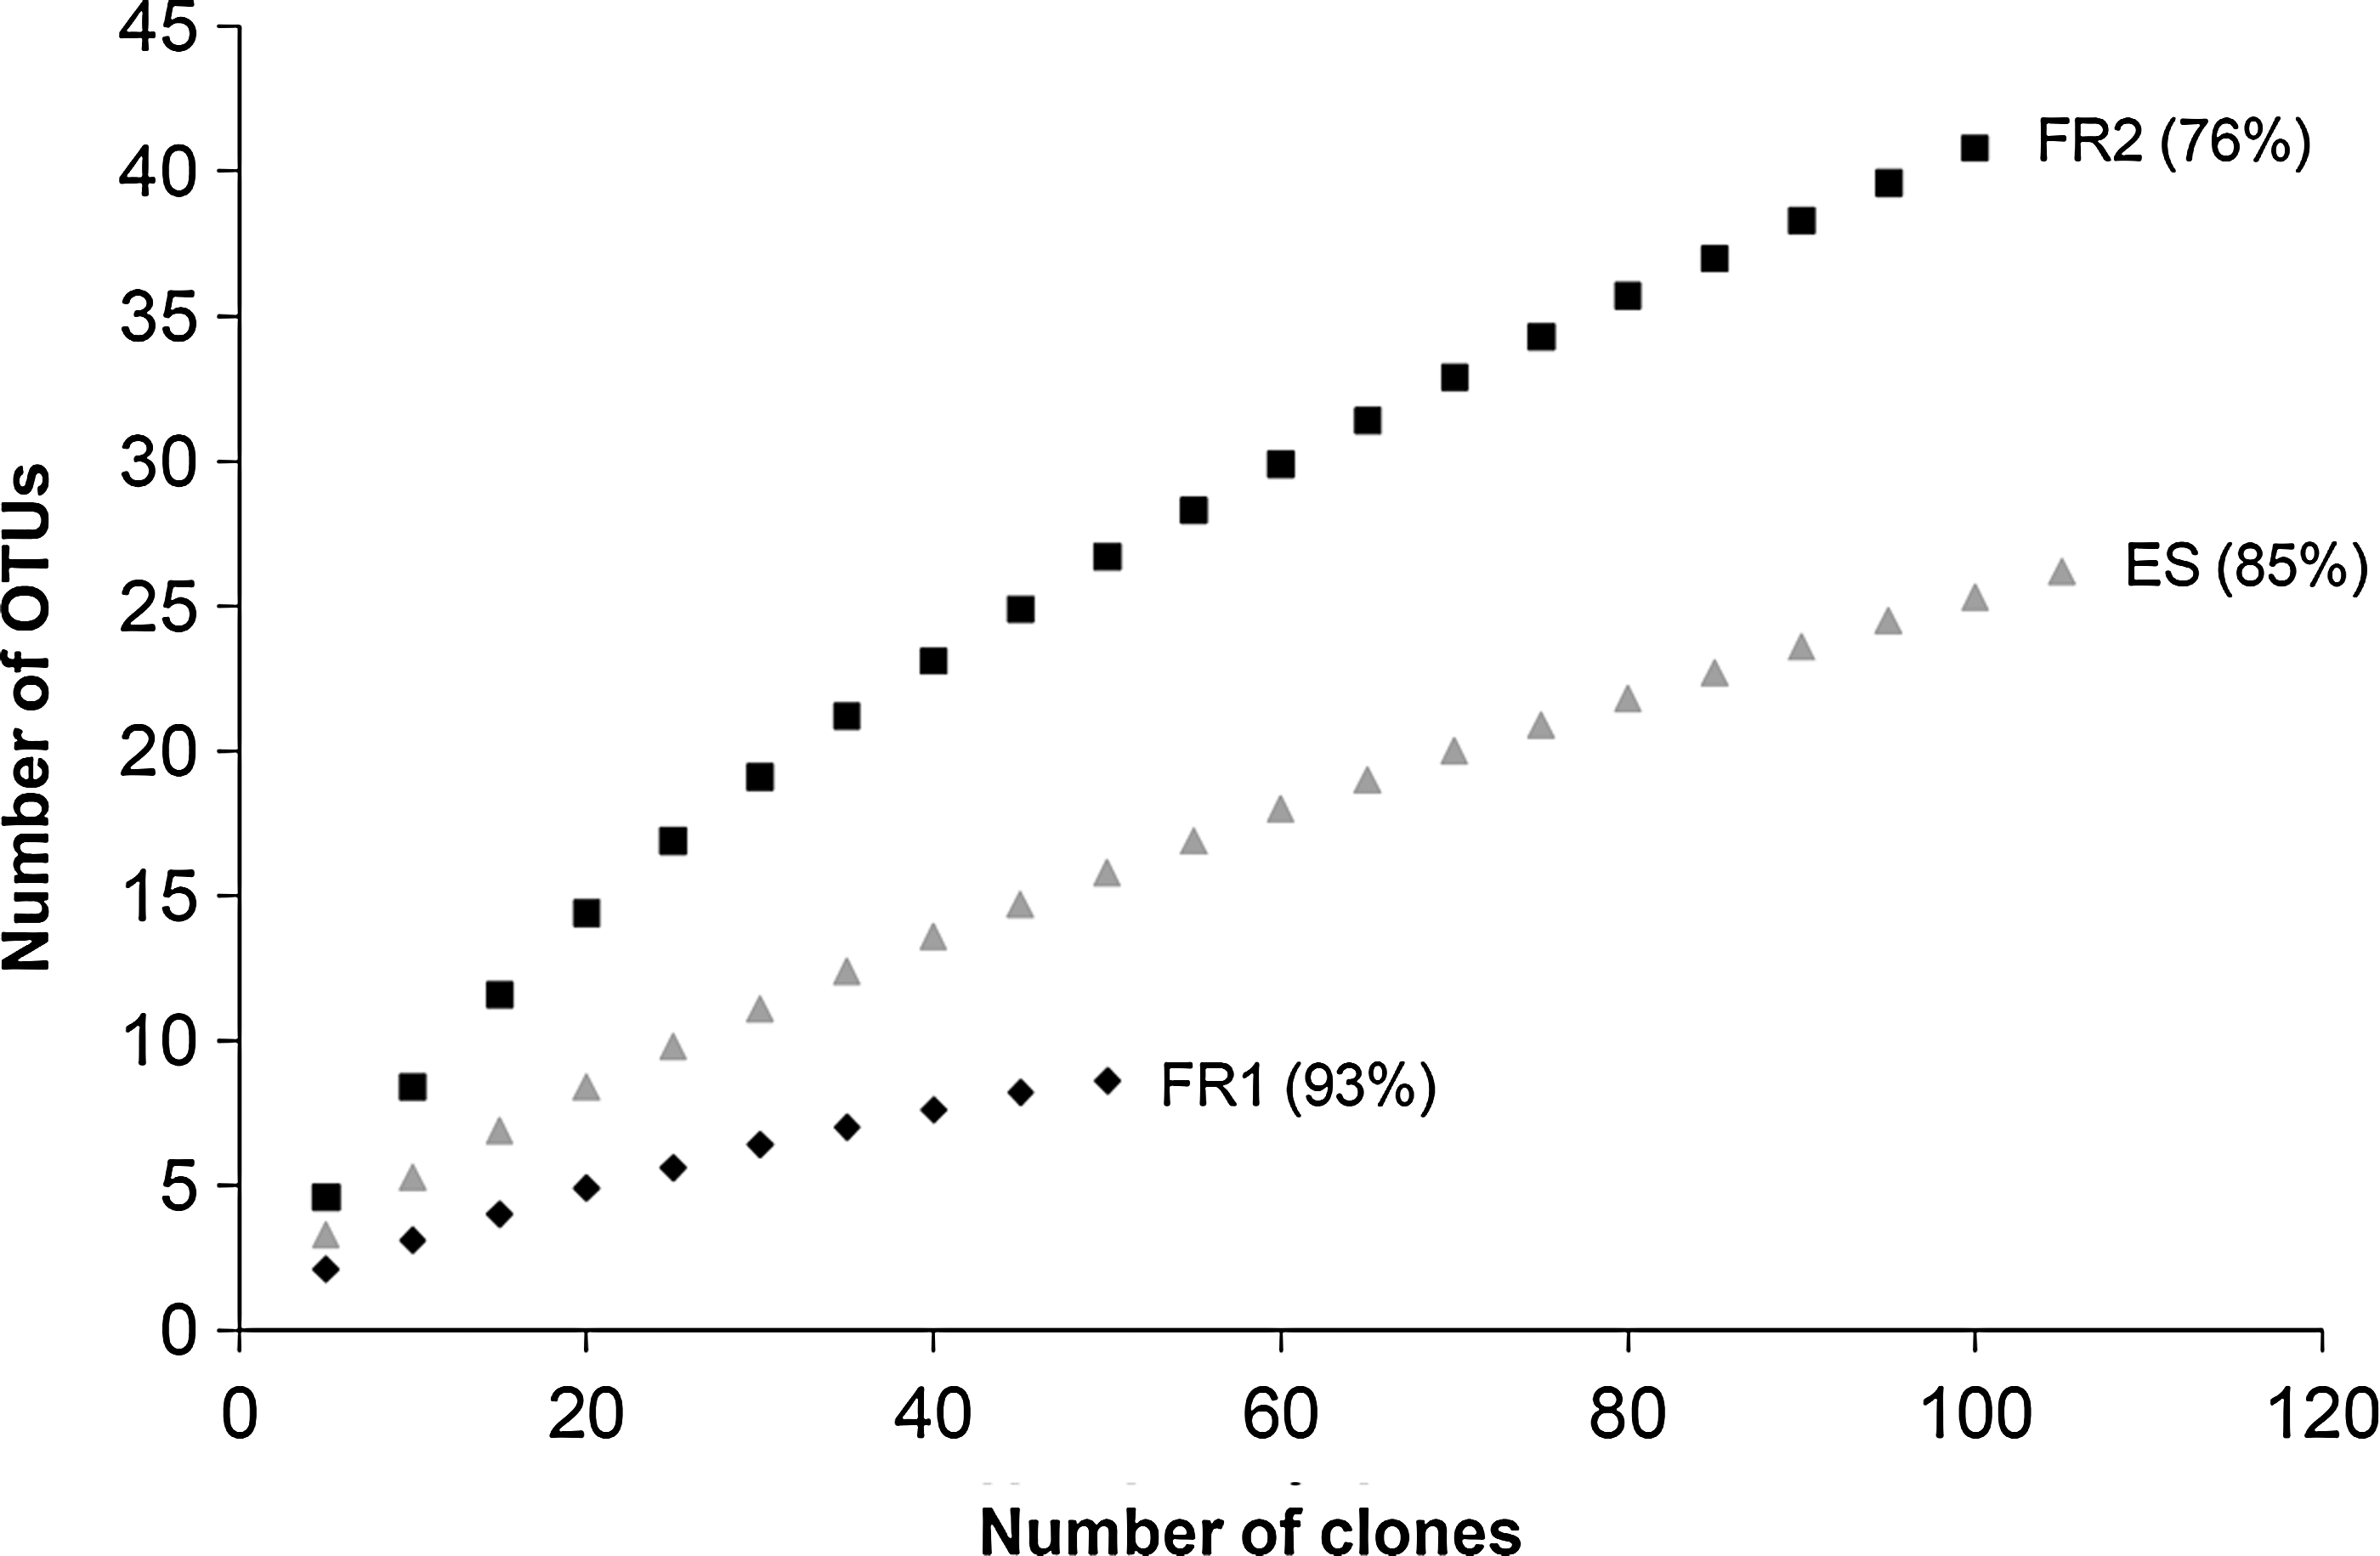
Rarefaction analysis and coverage. The rarefaction curves as well as the coverage values (in percent) for all three sampling locations are shown (FR1, Friedrichshafen sampling, April 2007; FR2, Friedrichshafen sampling, November 2007; ES, ESTEC sampling, March 2008). A flattening of the curve indicates approaching the complete coverage of the microbial diversity by the analyzed amount of clones.
In total, 10 different bacterial phyla were detected that encompass 29 families and 33 genera (Table 2). Approximately 10% of all DNA sequences (clones) showed a sequence homology <95% to their closest cultivated neighbors. These OTU were denoted “unclassified” microbes (Table 2). Selected bacterial phyla and genera are shown in Fig. 2, which illustrates the similarities, differences, and local characteristics for each sampling site and event.
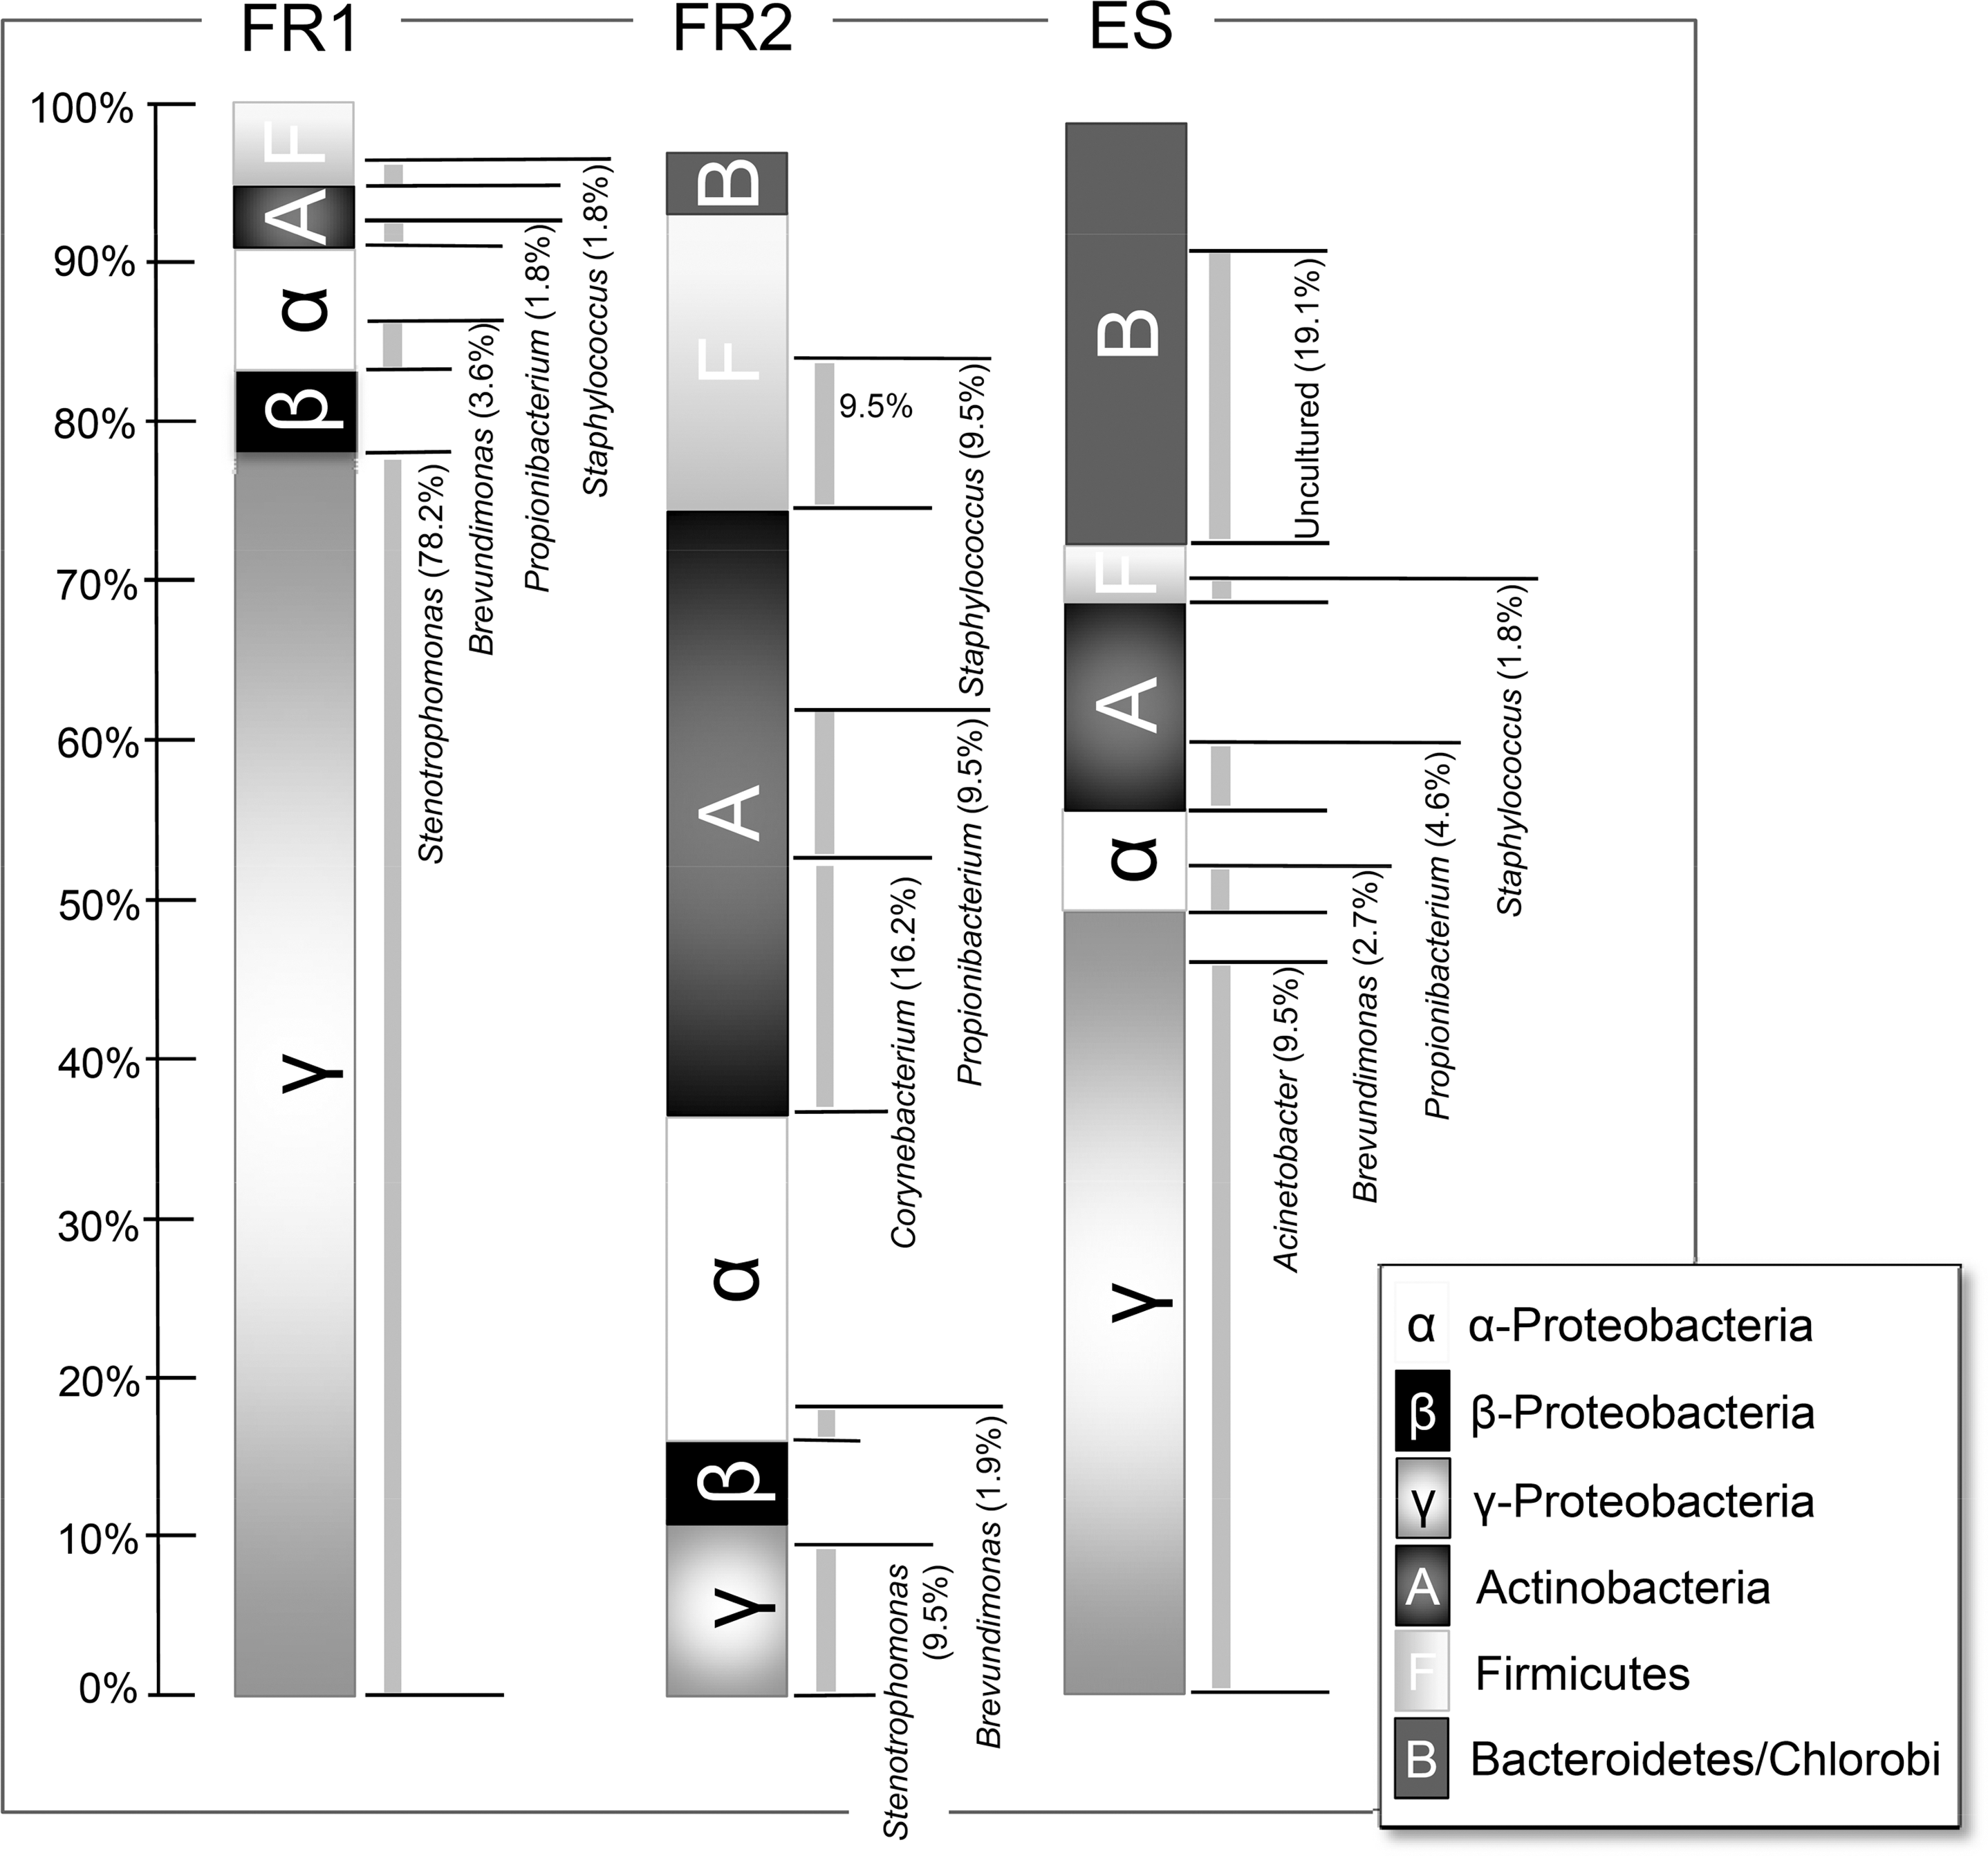
Microbial diversity as detected via 16S rRNA gene sequence analysis. The distribution by percentage of the detected microbial diversity at the three locations (FR1, Friedrichshafen sampling, April 2007; FR2, Friedrichshafen sampling, November 2007; ES, ESTEC sampling, March 2008) is shown on the phylum level (left column). Additionally certain genera of each location are shown next to the phylum as they are either common to each facility or special for one sampling (right column).
In general, the three locations differed considerably concerning their microbial species composition; however, some similarities were observed between locations at the genus level. 16S rRNA gene sequences that belong to the genera Propionibacterium, Brevundimonas, and Staphylococcus were detected in samples from each location and from each sampling event. Samples from FR1 and ES were dominated by clones carrying 16S rRNA gene sequences of γ-Proteobacteria. At the genus level, this phylum was represented by Stenotrophomonas only (FR1) or predominated by Acinetobacter (ES).
As more than two-thirds of all FR1 sequences could be identified as Stenotrophomonas maltophilia, this facility revealed the lowest diversity (with respect to the clone libraries) compared to the other two samplings. This observation was supported by the rarefaction analysis (Fig. 1), the lowest Evenness value, and the Shannon-Wiener index (Table 3). In contrast, FR2 revealed the highest diversity with 29 different genera distributed over 9 phyla. The rarefaction analyses showed the steepest curve and no visible flattening. The Shannon-Wiener index and the Evenness value were quite high, which indicates a high diversity but a more equal distribution of the species compared to FR1. In FR2 samples, the most frequently occurring sequences belonged to the phylum Actinobacteria (Corynebacterium). 16S rRNA genes from uncultivated members of the phyla Planctomyces, Deinococcus-Thermus, and Cyanobacteria could only be detected in FR2 samples (Table 2).
The most abundant sequences obtained from ES samples were assigned to the phylum γ-Proteobacteria, with Acinetobacter as the predominant genus. The second most common group, representing 20% of total recombinants, belonged to the phylum Bacteroidetes and revealed a sequence homology to their closest neighbors below 95%. The dominance of several genera (e.g., Acinetobacter) was also reflected in a lower Evenness. Furthermore, the detected diversity in ESTEC was not as high as in FR2.
Interestingly, the 16S rRNA genes of genera capable of forming spores (e.g., Bacillus, Paenibacillus, and Clostridium) were not detected in any sample.
Amplification of bacterial 16S rRNA genes was not observed in any of the field blanks, extraction blanks, or negative controls.
3.2. Environmental clustering
For comparative purposes, molecular data from US spacecraft-associated clean rooms were compared to the results from European facilities with Unifrac analyses. The European clone libraries were clearly distinct from US data sets with most clone libraries observed to cluster by their origin (Fig. 3).

Environmental clustering analysis, showing the relationship of different clone libraries from different locations (ES, ESTEC; FR, Friedrichshafen; JPL, Jet Propulsion Laboratory; JSC, Johnson Space Center; KSC, Kennedy Space Center). Significant jackknife values are given.
3.3. Cultivation-based bioburden determination
The ESA standard procedure was followed in this study (ECSS-Q-ST-70-55 Working Group, 2008) to determine the number of culturable, aerobic, heat-shock-surviving mesophilic bacteria per square meter (swab and wipe assay 1) as well as the number of culturable, aerobic, mesophilic bacteria (swab and wipe assay 2).
Results are presented in Tables 4 and 5. The average number of heat-shock-surviving microorganisms from each location was below 4×10³ cells/m2 of clean room surface (excluding plates that could not be evaluated due to overgrowth). Standard cultivation assays without heat shock, in which a less-rich medium was used, resulted in approximately 1 order of magnitude higher colony counts per square meter. Some locations revealed very high numbers of CFU, which indicates a substantially heterogeneous distribution of microorganisms in clean rooms. Swab samples from spacecraft surfaces showed quite similar distribution, level of bioburden, and overall culturable microbes (Table 5). Table 6 gives the culturable microbial diversity as obtained via standard assay procedures 1 and 2.
FR1: Friedrichshafen sampling, April 2007. FR2: Friedrichshafen sampling, November 2007. ES: ESTEC sampling, March 2008.
Cultivation assay 1: heat shock for 15 min at 80°C, plating on TSA medium, incubation at 32°C for 72 h.
Cultivation assay 2: plating on R2A medium, incubation at 25°C for 72 h.
nc: not countable, bacterial lawn. Cell counts given in italics were not used for the calculation of the average counts.
na: not applicable. Data too imprecise for the calculation of average CFU counts.
One plate from four aliquots confluent (overgrown by bacterial swarmer).
FR1: Friedrichshafen sampling, April 2007. FR2: Friedrichshafen sampling, November 2007. ES: ESTEC sampling, March 2008.
Cultivation assay 1: heat shock for 15 min at 80°C, plating on TSA medium, incubation at 32°C for 72 h.
Cultivation assay 2: plating on R2A medium, incubation at 25°C for 72 h.
Cell counts given in italics were not used for the calculation of the average counts.
nd: not done.
Only a small fraction of all isolates were characterized phylogenetically. GSE, ground support equipment; SC, spacecraft; ○, detected.
FR2: Friedrichshafen sampling, November 2007. ES: ESTEC sampling, March 2008. Isolates from FR1 sampling were not characterized phylogenetically.
Cultivation assay 1: heat-shock for 15 min at 80°C, plating on TSA medium, incubation at 32°C for 72 h.
Cultivation assay 2: plating on R2A medium, incubation at 25°C for 72 h.
GSE: ground support equipment.
Based on the detection of bacterial genus.
3.4. Quantitative real-time PCR
Compared to culture assays, approximately 104- to 106-fold higher bacterial concentrations (estimated approximately 106 to 107 cells/m2) were found when performing qPCR (Table 4). Thus, detection levels of viable bacterial spores or heat-shock survivors by the cultivation-based standard procedure 1 were below 0.05% of the microbial load on clean room surfaces estimated via molecular methods.
Microbial contamination levels for the Herschel spacecraft (swab samples) were also higher when determined by qPCR rather than by culture-based methods (Table 5). FR2 samples revealed an even higher number of bacterial 16S rRNA gene copies for the Herschel spacecraft than for the clean room. However, the sampled surface areas of Herschel were very small, and the access was quite restricted, which could have led to an unequal sampling.
4. Discussion
In this study, classical bioburden measurements as required in space agencies' standard documents were combined with molecular studies (16S rRNA gene cloning and qPCR) to compare and extend our understanding of the microbial community in spacecraft-associated clean rooms.
Samples from the first collection in Friedrichshafen (FR1) were subjected to the commonly used phenol-chloroform DNA extraction method. Nevertheless, this method did not result in high-quality DNA. As such, the extraction procedure was changed for the subsequent samplings to the XS-buffer method. The protocol for the XS-buffer method is rapid and simple but is able to open very stable and robust cells, such as cyanobacteria and fungi (Tillett and Neilan, 2000; Moissl-Eichinger, 2011). Despite the discrepancies in extraction procedures, the microbial diversity of samples FR1 and FR2 exhibited good agreement (Table 2; except Burkholderia, which was detected in FR1 only). Nevertheless, the effect of the different DNA extraction procedures on the detected microbial diversity cannot be gathered here, but the change in methodology has to be taken into account when interpreting the results of FR1 compared to FR2 and ES. Diversity detected in the FR2 sampling was, however, much higher compared to FR1, with Cyanobacteria and Deinococcus-Thermus detected in this sample. Both phyla include extremotolerant organisms, with the ability to resist radiation and desiccation (Mattimore and Battista, 1996; Billi et al., 2000) and the potential to survive under the extreme conditions of Mars (Cockell et al., 2005; La Pogoda et al., 2005).
Although the microbial community composition differed significantly between the facilities (Fig. 2), the signatures of Staphylococcus, Brevundimonas, and strictly anaerobic Propionibacterium were detected in each sampling. All three of these genera are well-known, human-associated contaminants of spacecraft assembly facilities (La Duc et al., 2007; Stieglmeier et al., 2009). This result supports previously published reports in which humans are implicated as the major source for contamination of spacecraft-associated clean rooms (Puleo et al., 1977; Stieglmeier et al., 2009). Interestingly, frequently detected genera in clean rooms, like Propionibacterium, Staphylococcus, Micrococcus, and Streptococcus, have been found to be predominant on human skin locations that are not covered by the clean room garment, for example, the forehead and external ear (Costello et al., 2009).
In FR1 and FR2 samples, the fraction of likely human-associated organisms was predominant with almost no typically environmental organisms as described in the literature (e.g., Hymenobacter; Hirsch et al., 1998). In FR1 samples, Stenotrophomonas maltophilia, a potential human pathogen (Falagas et al., 2009), was the predominant species within the 16S rRNA gene library. Its signatures were also detected in FR2 but did not appear at all in the clone library of ESTEC.
The detection of the genus Flavobacterium in the ES Hydra facility hints toward a quite significant influence by environmental conditions; representatives of this genus that occur in the North Sea (Musat et al., 2006) and the ESTEC facilities are in close proximity to this aquatic biotope (0.5 km). Nevertheless, due to the restricted entry of environmental microorganisms into clean rooms, the influence of the surrounding ecosystem is not always detectable and that obvious (see also Moissl et al., 2007).
Clone libraries from the European facilities exhibited a high degree of similarity and clustered together when comparative UniFrac analyses were performed with 16S rRNA gene sequences from US facilities (Moissl et al., 2007). The FR2 samples clustered with the ES samples, which may be attributable to the DNA extraction method used. Nevertheless, a standard phenol-chloroform DNA extraction procedure was used for all US samplings (Moissl et al., 2007) and also for FR1, but a clustering of these libraries was not obvious in our analysis. Nevertheless, PCR biases and other conditions could definitely influence the detectable diversity and explain clustering effects.
All clone libraries (US and European) were obtained from clean room floor samples except KSC6, which was a sample derived from the top of lockers located in a clean room (Moissl et al., 2007). This fact could explain the separate clustering of KSC6 from other KSC clone libraries. Interestingly, KSC, JPL, and ESTEC samples were obtained from an ISO 8 (class 100,000) clean room, whereas FR and JSC samples were taken under stricter clean room conditions (class 10, 1000/ISO 5, 5000). A clustering based on (environmental) conditions seems not to be obvious but could definitely be influenced by factors like maintenance, cleaning, and other circumstances. However, the different samples revealed a collocation according to their location. Therefore, the microbial diversities from European clean rooms are clearly distinguishable from US facilities, as well as different US clean rooms from each other. It can be concluded that each clean room appears to be influenced by the typical human-associated microbial diversity (which is detectable in each clean room and represented by typical microbes, like Staphylococcus, etc.) but also by its environment, which explains the presence of location-typical microbial inhabitants.
Nevertheless, the microbial diversity in clean rooms is subject to strong fluctuations and changes, dependant on, for example, human presence and activity. For instance, a recent publication shows a significant change in microbial diversity before, during, and after assembly, test, and launch activities (Vaishampayan et al., 2010). Surely, our data reflect only a glimpse of the microbial diversity within the analyzed facilities, and more frequent analyses or even a strict monitoring on a molecular basis is required. The clean rooms investigated in this study were controlled with respect to particulate matter but not bioburden. However, the bioburden measurements, according to the ESA standard assay, demonstrated a generally low, but very heterogeneous, distribution of microorganisms on clean room surfaces. The sampling sites in each clean room chosen in this study were selected to get a first overall result from different types of surface materials that are touched and cleaned in different frequencies. Even if it may not be appropriate to extrapolate and compare the sampling results obtained by swab or wipe sampling [different method, different recovery efficiencies (Probst et al., 2010a, 2011), different sampling size], it can be stated that the clean room and ground support equipment (GSE) bioburden in approximately half the overall 59 samples, that is, 34, was lower than 300 heat-tolerant microorganism per square meter, whereas 13 samples showed a very high bioburden with CFU too numerous to count.
Although the numbers acceptable for a typical spacecraft going to Mars were exceeded in some samples from the Herschel spacecraft from FR1 and ES, it should be noted that the Herschel mission was not subject to any planetary protection constraints. Considering this, the biological contamination of the spacecraft and the associated clean rooms was within the current specification.
Even though the intention of the application of a heat shock is to kill all vegetative cells, a closer characterization of the heat-shock-surviving microorganisms indicated that several hardy, non-spore-forming microbial species are able to survive this harsh treatment. In this study, Staphylococcus and Micrococcus isolates were found to be able to withstand the 80°C heat-shock treatment. Furthermore, even some Gram-negative organisms, such as Stenotrophomonas maltophilia FR-W3Cb and Acinetobacter sp. FR-W3CA, were able to remain viable. Thus the determined “spore load” consists obviously of counts derived from spore formers as well as hardy, non-spore-forming microorganisms. Since Staphylococcus, Micrococcus, and Acinetobacter are typical (and frequent) contaminants, they might significantly contribute to bioburden measurements despite the inability of these organisms to form spores. The equation of the term “bioburden” with “spores” in any documentation of space agencies should therefore be amended to include these organisms.
Currently, it is unknown why these non-spore-forming microbes can survive such a harsh temperature treatment. The dormancy phenomenon among nonsporulating actinobacteria has been discussed recently. In particular, the resuscitation-promoting factor (rpf), a small protein that helps to resuscitate Micrococcus luteus after dormancy, has been analyzed thoroughly (Koltunov et al., 2010). Other mechanisms like cell wall stabilization (Micrococcus: alkene formation) or the accumulation of, for example, trehalose as a protectant against osmotic stress and dryness (Micrococcus, Stenotrophomonas) could also support the survival following short-term heat-shock treatment (Roder et al., 2005; Beller et al., 2010; Young et al., 2010).
Heat-shock surviving, spore-forming Bacillus and Paenibacillus strains have been cultivated from samples of each location but were not detected during the molecular survey. This hints toward a presence of these microbes mostly in their dormant status and the inefficiency of the DNA extraction procedures used to release DNA from spores.
Considering only the results of the standard assay, the bacterial contamination of spacecraft assembly clean rooms, although not biologically controlled, appears quite low. Omitting the heat shock and the usage of R2A instead of TSA medium increased the culturable amount by around a factor of 10.
On the other hand, the quantification of bacterial 16S rRNA gene sequences via qPCR indicates an even higher microbial contamination (estimated 106 to 107 CFU/m2). Similar spore counts as well as qPCR results have been obtained during diversity studies in spacecraft assembly facilities of NASA (La Duc et al., 2007). For the sake of completeness, it should be noted that qPCR methods detect also signatures from nonviable cells. In conclusion, it becomes clear that the actual microbial load on spacecraft and associated surfaces lies somewhere between the standard cultivation results and qPCR estimations, as was also discussed by Cooper et al. (2011).
The results presented here clearly show that standard protocols required by the space agencies underestimate the abundance of microorganisms in clean room facilities. For more accurate estimations of the actual bioburden, additional analyses and improvement of current methods are necessary. The introduction of a bead-beating step in the DNA extraction procedure could help to assess the bacterial spore DNA for molecular analyses. Further, the application of propidium monoazide staining techniques could help distinguish 16S rRNA gene signals from intact (viable) or dead cells (Nocker et al., 2007).
5. Conclusion
In this communication, we have shown that the distribution of microbes within the clean room and on spacecraft surfaces is very heterogeneous, and a higher sampling and statistical effort is necessary to estimate the true overall bioburden. Previous assumptions that traditional culture-based methods underestimate the diversity and abundance of microorganisms in clean rooms have been confirmed. Additionally, our results indicate that spacecraft assembly clean rooms harbor a typical diversity of human-associated microbes but seem to be distinguishable based on the environmental microbial influence.
In addition, we have clearly shown that even non-spore-forming microbes are able to withstand the standard heat-shock procedure that is used for a selective enrichment of spores in space agencies' bioburden measurements. The results presented here also lead to the suggestion that spore formers are present as spores in clean room environments, which indicates a high external pressure for the formation of resistant dormant states.
The analyses of European spacecraft assembly facilities and in particular the consequent comparison of current standard assays with molecular microbiology techniques have significantly improved our understanding with regard to community structure, concentration, distribution, and bioburden in spacecraft assembly facilities. This will help to design future studies and planetary protection sampling and analysis plans.
Footnotes
Acknowledgments
We are grateful to ESA for funding this project (ESA contract 20508/07/NL/EK). We thank the Herschel Project Team for support during sampling. We thank Gerhard Kminek, Michael Thomm, and Harald Huber for helpful discussions and encouragement, Alexander Probst, Annett Bellack, Ruth Henneberger, Pierre Offre, and Gabriel Milinovich for scientific input and critically reading the manuscript.
Abbreviations
CFU, colony-forming units; EADS, European Aeronautic Defence and Space Company; ECSS, European Cooperation for Space Standardization; ESTEC, European Space Research and Technology Centre; GSE, ground support equipment; OTU, operational taxonomic units; qPCR, quantitative PCR; TSA, trypticase soy agar.