
Abstract
We report results from the exposure of the metalloporphyrin iron tetraphenylporphyrin chloride (FeTPPCl) to the outer space environment, measured in situ aboard the Organism/Organic Exposure to Orbital Stresses nanosatellite. FeTPPCl was exposed for a period of 17 months (3700 h of direct solar exposure), which included broad-spectrum solar radiation (∼122 nm to the near infrared). Motivated by the potential role of metalloporphyrins as molecular biomarkers, the exposure of thin-film samples of FeTPPCl to the space environment in low-Earth orbit was monitored in situ via ultraviolet/visible spectroscopy and reported telemetrically. The space data were complemented by laboratory exposure experiments that used a high-fidelity solar simulator covering the spectral range of the spaceflight measurements. We found that thin-film samples of FeTPPCl that were in contact with a humid headspace gas (0.8–2.3% relative humidity) were particularly susceptible to destruction upon irradiation, degrading up to 10 times faster than identical thin films in contact with dry headspace gases; this degradation may also be related to the presence of oxides of nitrogen in those cells. In the companion terrestrial experiments, simulated solar exposure of FeTPPCl films in contact with either Ar or CO2:O2:Ar (10:0.01:1000) headspace gas resulted in growth of a band in the films' infrared spectra at 1961 cm−1. We concluded that the most likely carriers of this band are allene (C3H4) and chloropropadiene (C3H3Cl), putative molecular fragments of the destruction of the porphyrin ring. The thin films studied in space and in solar simulator–based experiments show qualitatively similar spectral evolution as a function of contacting gaseous species but display significant differences in the time dependence of those changes. The relevance of our findings to planetary science, biomarker research, and the photostability of organic materials in astrobiologically relevant environments is discussed. Key Words: Astrobiology—Spectroscopy—Low-Earth orbit—Organic matter—UV radiation. Astrobiology 14, 87–101.
1. Introduction
M
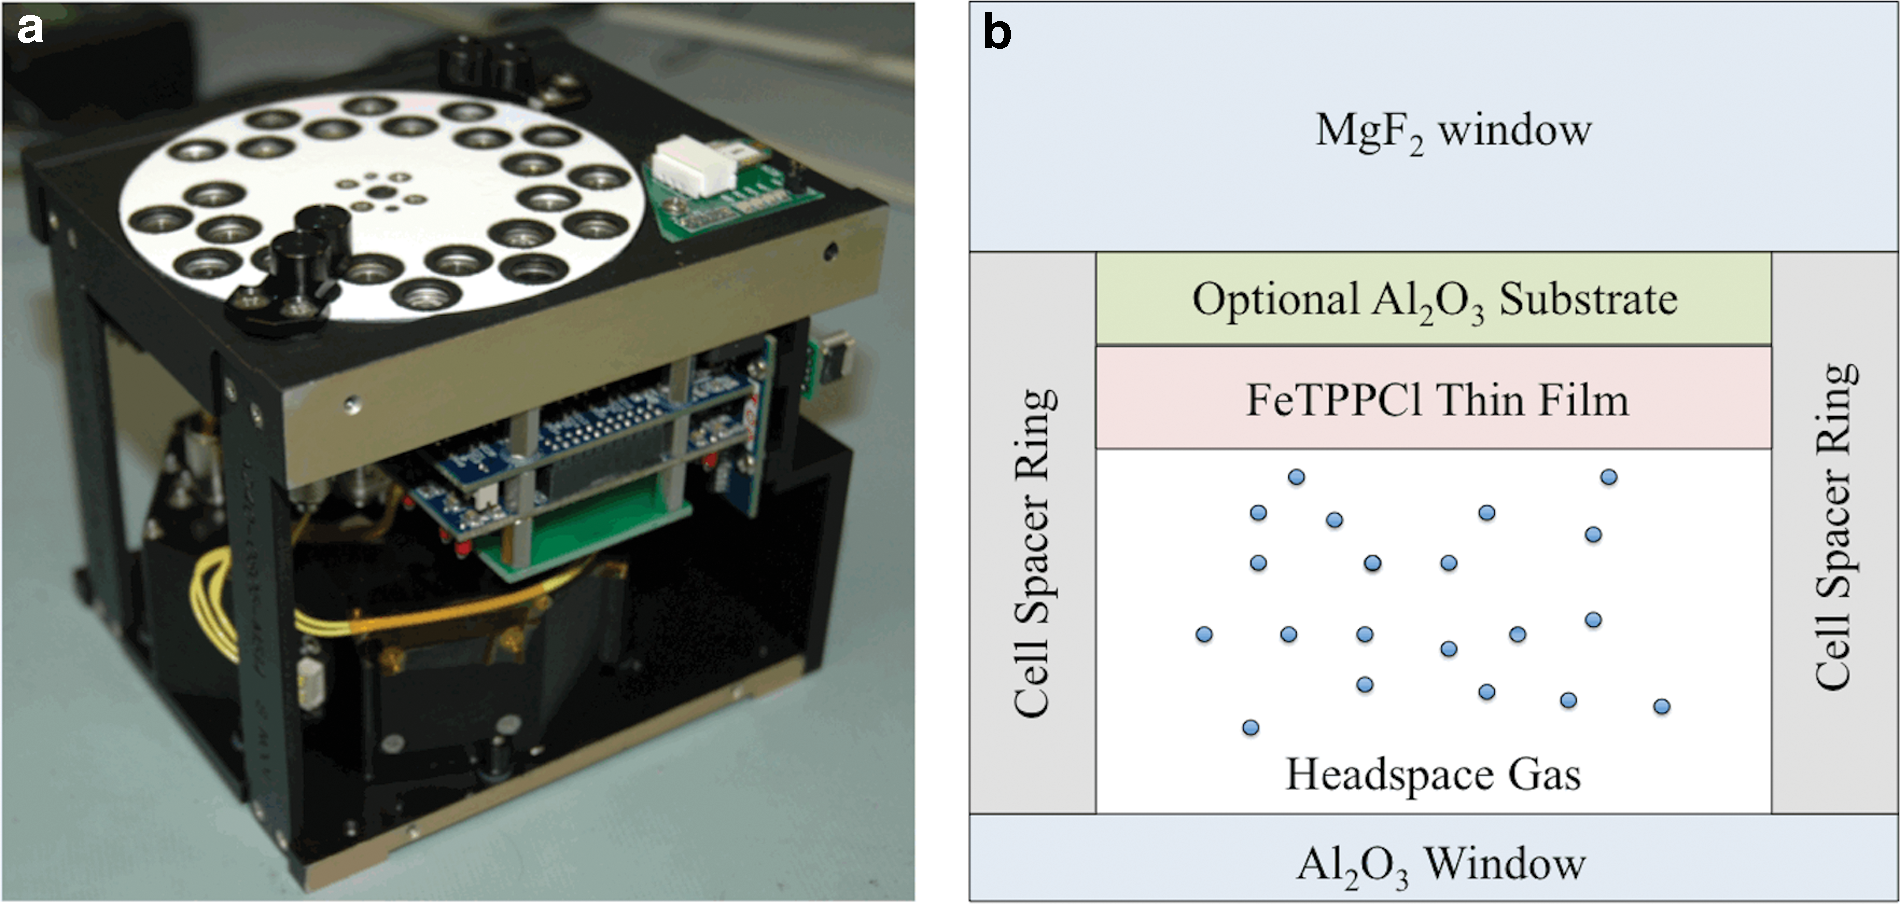
O/OREOS is a technology demonstration mission conducted under the auspices of NASA's Astrobiology Small Payloads Program. It was launched into low-Earth orbit (LEO) in November 2010 and accommodates two astrobiology experiments, SEVO and SESLO (Space Environment Survivability of Live Organisms), each housed in a separate 10 cm cube (see Fig. 1a). Design specifications and early science reports from the mission have been published elsewhere (Nicholson et al., 2011; Bramall et al., 2012; Mattioda et al., 2012; Ehrenfreund et al., 2014).
(
SEVO and O/OREOS contribute to a multinational legacy of experiments designed to examine changes in organic compounds when exposed to space radiation (Kinard et al., 1994; Dever et al., 2008; Guan et al., 2010, Bryson et al., 2011, Rabbow et al., 2012). However, SEVO is the first experiment with the capability to return data collected in situ at multiple time points over the course of months-long space exposure in LEO, rather than before the experiment is deployed in space and again after its return to Earth. (O/OREOS will not return to Earth; it will disintegrate upon atmospheric reentry in approximately 2032.) SEVO was designed to explore the photochemistry of organic molecules and biomarkers exposed to space radiation—solar exposure being the dominant factor—under different experimental conditions including variations in the partial pressure of water, headspace gas composition, contacting solid substrate composition, and spectral filtering. Mattioda et al. (2012) reported initial flight results for two organic samples: isoviolanthrene (a large polycyclic aromatic hydrocarbon) and anthrarufin (a quinone). This paper reports in detail the LEO spaceflight results obtained by SEVO's compact UV/vis/NIR (near-infrared) spectrometer over a duration of 17 months (∼3700 h of direct solar exposure) from thin-film FeTPPCl samples and includes a comparison of these results with complementary laboratory studies in which a solar simulator was used to expose samples to the ∼122–1000 nm spectral range at intensities comparable to solar radiation in LEO.
2. Materials and Methods
2.1. Sample cells
Hermetically sealed sample cells (Bramall et al., 2012) with controlled initial gas composition, pressure, and substrate composition were used for LEO and laboratory studies (Fig. 1b). The FeTPPCl samples were sublimed (at 300°C) as thin films, 17 nm thick, directly onto MgF2 windows or on top of optically thin inorganic substrates that were pre-deposited on the MgF2 windows; sample thicknesses were measured with a quartz crystal microbalance. The structural integrity of the molecule after sublimation was verified by dissolving a subset of the sample films in dimethyl sulfoxide (C2H6OS) after deposition; UV/vis spectra of the dissolved films matched that of the unheated dissolved powder sample. Spectra of cells with no organic films and spectra of “direct” solar radiation (i.e., not passing through any cell prior to entering the collection optics) were used as references.
To study direct radiation-induced changes relevant to interstellar and interplanetary conditions, Inert sample cells contained FeTPPCl with 100 kPa argon gas. To study the effects of planetary atmospheres containing CO2, Atmosphere cells contained 1 kPa CO2, 0.001 kPa O2, balance argon (∼100 kPa total cell pressure) with a FeTPPCl thin film deposited on top of an optically thin (200 nm) sputtered Al2O3 layer supported by a MgF2 substrate. The Al2O3 served to filter vacuum ultraviolet (VUV) radiation (<∼170 nm) as well as provide a mineral-like surface. To study the effects of water activity, Humid cells contained FeTPPCl deposited on top of Al2O3 (200 nm) on MgF2 (here the Al2O3 also protects the MgF2 from degradation by water vapor). Relative humidity of 0.8–2.3% (depending upon ambient temperature, which varied from approximately −5°C to 45°C as a result of variations in the orbital solar exposure conditions) was maintained in an argon atmosphere (100 kPa) by using a hydrated salt pair supported on a stainless-steel cylindrical wire mesh located along the sidewall of each cell (out of the optical path) (Bramall et al., 2012). Table 1 summarizes the conditions in each FeTPPCl cell used for both the flight experiment and supporting laboratory studies.
5,10,15,20-Tetraphenyl-21H,23H-porphine iron(III) chloride (FeTPPCl, ≥94% purity) was purchased from Sigma-Aldrich as a bulk powder. It was deposited as thin films (16.5 nm) onto the optical substrates (i.e., MgF2 or MgF2 coated with 200 nm of sputtered Al2O3) by subliming the powder at ∼300°C in a vacuum chamber (Bramall et al., 2012).
The O/OREOS satellite was in a 72° inclination, 650 km Earth orbit, with an average rotation rate of ∼1 rpm over the duration of this experiment. Satellite rotation resulted in periodic sample exposure to solar radiation for an average of 30% of the total elapsed time in space; the time-averaged net solar energy exposure flux was ∼500 J/cm2/h (Ehrenfreund et al., 2014), although the instantaneous flux varied significantly due to periods of solar eclipse of the spacecraft for parts of most orbits, as well as its ∼1 rpm rotation about the spacecraft's long axis. Sample spectra were collected from 200 to 1000 nm by the SEVO spectrometer as described by Bramall et al. (2012) at approximately 2-week intervals from November 2010 to April 2012.
2.2. Spectral data reduction
Ultraviolet/visible/near-infrared transmission spectra were retrieved from the O/OREOS satellite as an average of 16 spectra with an integration time of 100 or 135 ms for each cell. Spectra were selected for further analysis based on signal levels, signal-to-noise ratio, and the extent of signal saturation. Saturation was a significant factor for the mid-mission data before collection parameters (e.g., integration time, solar intensity triggers) were re-optimized. The highest-quality spectra were collected before February 2011 and after May 2011. The mid-mission gap in some of the reported results is explained by the lack of high-quality data collected during this period.
Absorbance was calculated with the following equation:
where A is absorbance, I S is the intensity of light after it passes through the sample cell, and I R is the intensity of light after it passes through the corresponding microenvironment reference (no FeTPPCl film). These intensities were additively shifted by n=100 intensity counts for presentation purposes to eliminate obfuscating noise due to low solar (light source) intensity at short wavelengths. Some of our figures reflect this additive scale factor, but band integrations were done without the use of this addition. Before calculating absorbance, to correct for variations in spectral intensity from solar intensity changes due to satellite orientation, I S was multiplicatively scaled to I R at 330 nm, where no absorbance features were expected or detected for FeTPPCl.
2.3. Laboratory dark controls and irradiation experiments
Laboratory studies consisted of two segments: FeTPPCl samples that were prepared concurrently with the flight samples and kept under dark conditions, and FeTPPCl samples that were also prepared at the same time as the others and irradiated by simulated solar emission in the laboratory. The samples maintained under dark conditions were stored in an argon-purged glove box at ambient temperatures (20–25°C) and measured with UV/vis/NIR spectroscopy at approximately 30-day intervals and with mid-IR spectroscopy at six time points during the ∼6-month monitoring period.
During the laboratory irradiation experiment, FeTPPCl sample cells and reference cells were photolyzed with a dual-source solar simulator. A 300 W xenon arclamp (Newport Corporation, part no. 66485) was used to approximate the solar flux across the UV and visible wavelengths from 200 to 1000 nm at AM0 (air mass zero, i.e., as in outer space at Earth's distance from the Sun). A H2/He discharge lamp was used to produce Lyman-α (∼122 nm) radiation. H2:He partial pressure ratio was ∼0.6:100; dilute mixtures result in more monochromatic Lyman-α output. The strength of the Lyman-α emission in the laboratory was measured with a UV-enhanced photodiode (method detailed in Cook et al., 2014), and lamp power was adjusted until the line matched the known strength of Lyman-α at LEO (Vidal-Madjar, 1975). The integrated irradiance of the xenon lamp from 200–1000 nm matched that of the solar irradiance spectrum within 2%. The Lyman-α photon flux from the H2/He lamp was 3.4×10¹¹ photons s−1 cm−2, which is within 8% of the solar Lyman-α flux. The Xe and H2/He lamp beams were aligned to intersect at the target samples, covering ∼1/3 of the positions in the sample carousel at a given moment. The sample carousel was rotationally stepped to bring samples in and out of the irradiation beams, exposing a given sample set to radiation for 20 s then rotating it out of the beams for 40 s before repeating the cycle. This temporal cycle was chosen to approximate the rotation rate of the O/OREOS spacecraft, which averaged about 1 rpm throughout the mission (Bramall et al., 2012; Mattioda et al., 2012). Temperatures inside irradiated cells were measured by using spare samples before the full solar simulation experiment was started; internal cell temperatures never exceeded 43°C and probably averaged ∼35°C. A comprehensive description of the laboratory experiment, hardware, and calibration is reported in Cook et al. (2014).
Irradiated samples were measured at approximately 14-day intervals with a UV/vis/NIR spectrometer and with a mid-IR spectrometer at six time points throughout the experiment. Ultraviolet/visible/near-infrared spectra were recorded with an Ocean Optics HR4000CG-UV-NIR spectrometer for which a spectroscopic, fiber-coupled deuterium/halogen lamp (DH-2000, Ocean Optics, Inc.) was used as the light source. Absorbance was calculated by using the same method described above, in Eq. 1, except that the additive scale factor n was not necessary for presentation in Fig. 3, since the laboratory spectrometer and light source provided adequate signal at short wavelengths.
A Digilab Fourier transform infrared (FTIR) spectrometer was used for all laboratory IR measurements, and band integrations were completed with Digilab Resolutions Pro software. A total of 256 scans at a resolution of 1 cm−1 were averaged for the reported spectra. The resulting spectra were filtered and baseline-corrected for presentation purposes. Band area integrations were conducted on identically filtered data to remove excessive fringing due to internal reflections within the sample cell window.
Following the completion of the solar simulation and dark control experiments, sample cells were transferred to the synchrotron facility at ISA, Centre for Storage Ring Facilities, Aarhus University, Denmark (Miles et al., 2007, 2008). Although the beamline at ISA is optimized for circular dichroism (CD) measurements, it can also provide normal absorption measurements. The CD1 beamline provided the capability to measure the absorbance spectra of our samples in the VUV wavelength region, from 115 to 350 nm, at a spectral resolution of 1 nm. The measurement chamber was nitrogen-purged, and the synchrotron beam entered the chamber through a CaF2 window.
3. Results
3.1. Background: iron(III) tetraphenylporphyrin chloride structure and spectroscopic features
The basic structure of FeTPPCl is shown in Fig. 2. Many porphyrins are primarily planar in nature, but the metal ligand in metalloporphyrins protrudes out of the plane of the macrocycle (Lü et al., 2006; El-Nahass et al., 2010). The Fe, Cl, and each of the coordinating N atoms form an angle of 103.95°, raising Fe out of the macrocycle plane by almost 14° (Lü et al., 2006). The crowding of the phenyl groups on the periphery of FeTPPCl is also thought to result in deformation of the macrocycle (Haddad et al., 2003). Computational analysis of X-ray crystallography data by El-Nahass et al. (2010) determined that FeTPPCl molecules in polycrystalline powder have a tetragonal structure with lattice constants of a=13.53 Å and c=9.82 Å. The space group is I4/m, Z=2; that is, there are two FeTPPCl molecules per unit cell. Although thermally deposited thin films were found to be amorphous, El-Nahass et al. (2010) verified that the integrity of individual molecular structures is maintained at typical deposition temperatures.
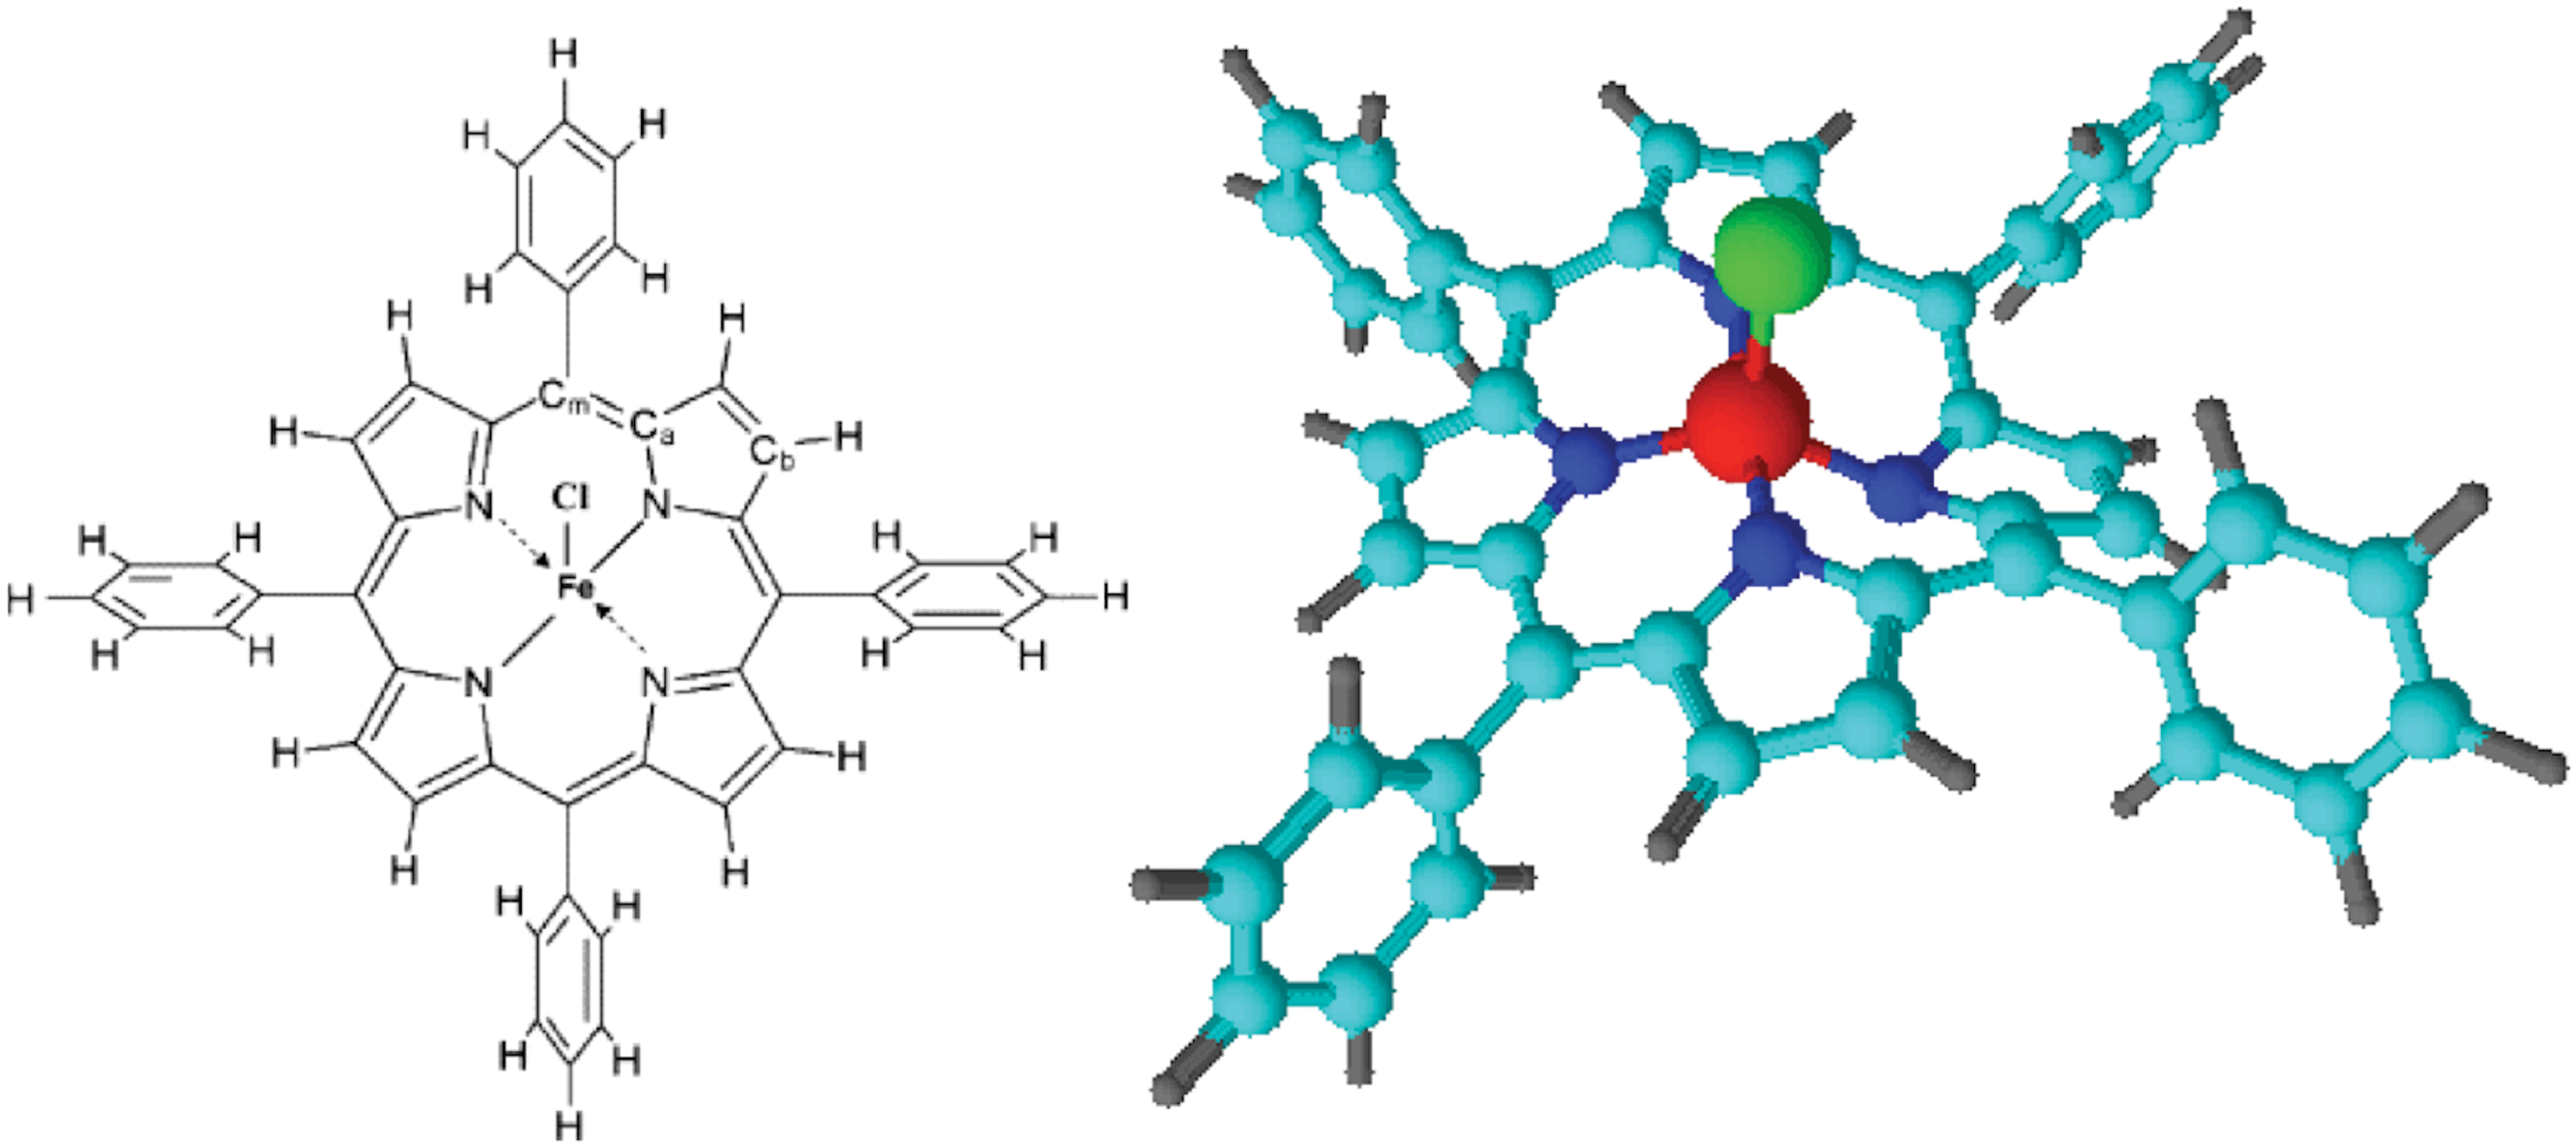
Molecular structure of FeTPPCl. Note that the phenyl groups and metal ligand are out of the porphyrin macrocycle plane and that the typically 6-coordinate Fe(III) has only 5 ligands. Color images available online at
Ultraviolet/visible spectra of FeTPPCl and H2TPP (tetraphenylporphyrin) have been reported by El-Nahass et al. (2005, 2010). In general, UV/vis spectra of porphyrins are described by the Gouterman four-orbital model, wherein absorption bands result from transitions between two HOMOs and two LUMOs (highest occupied molecular orbital and lowest unoccupied molecular orbital, respectively). A high-energy 1Eu state with high oscillator strength produces a strong Soret band (called the “B-band”) in the 300–480 nm region. In the case of FeTPPCl, the Soret band has a split peak, referred to as “hyper absorption” by Weinkauf et al. (2003); see Fig. 3. This split peak is inconsistently identified across the literature. Weinkauf et al. (2003) attributed the splitting to charge transfer interactions with substituents (e.g., between the porphyrin ring and the phenyl groups). According to Weinkauf et al. (2003) and El-Nahass et al. (2005), the split peaks exist in the absence of metal atoms. Therefore, as the Weinkauf study argues, intraporphyrin charge transfer is a likely explanation for double peaks, as opposed to metal-ligand or ligand-metal charge transfer, or metal-centered transfer [nominally Fe(II)→Fe(III)]. Alternatively, Huang et al. (2000) attributed the split band to opposing polarizations in the plane of the porphyrin macrocycle. These two polarizations, termed Bx and By , shown in Fig. 3, are degenerate and typically have almost identical intensities. The exact position and spacing of the polarization-induced split depends on the distances and angles between neighboring porphyrin molecules, any metal or other substituents, as well as the thickness of the observed film. Indeed, the Bx and By bands can be so closely spaced that they appear to merge into a single band in certain situations. For the sake of clarity when referring to the separate peaks in the Soret band, we adopt the Bx, By terminology. Discussion of the actual peak assignments is in Section 4.

A typical UV/vis spectrum from SEVO samples of FeTPPCl, with the molecule's apparent electronic transitions in the thin-film state. The split Soret band (Bx, By ), due to the 1Eu state, is shown at ∼430 nm. The nature of the splitting depends on the thinness of the film observed as well as the porphyrin's surrounding environment. In subsequent figures, the positions of Bx and By are marked by vertical lines. Accompanying weak Q and N bands are visible at 550 and 350 nm, respectively. See Section 3.1 for details.
A lower-energy 1Eu state with lower oscillator strength produces a weak Q band in the region from 480 to 800 nm. Due to vibronic coupling, this band is often split into several absorptions (Nozawa et al., 1980). A very weak N band is present at about 350 nm and attributed to a π-d transition (El-Nahass et al., 2010).
3.2. UV/vis spectra of flight samples
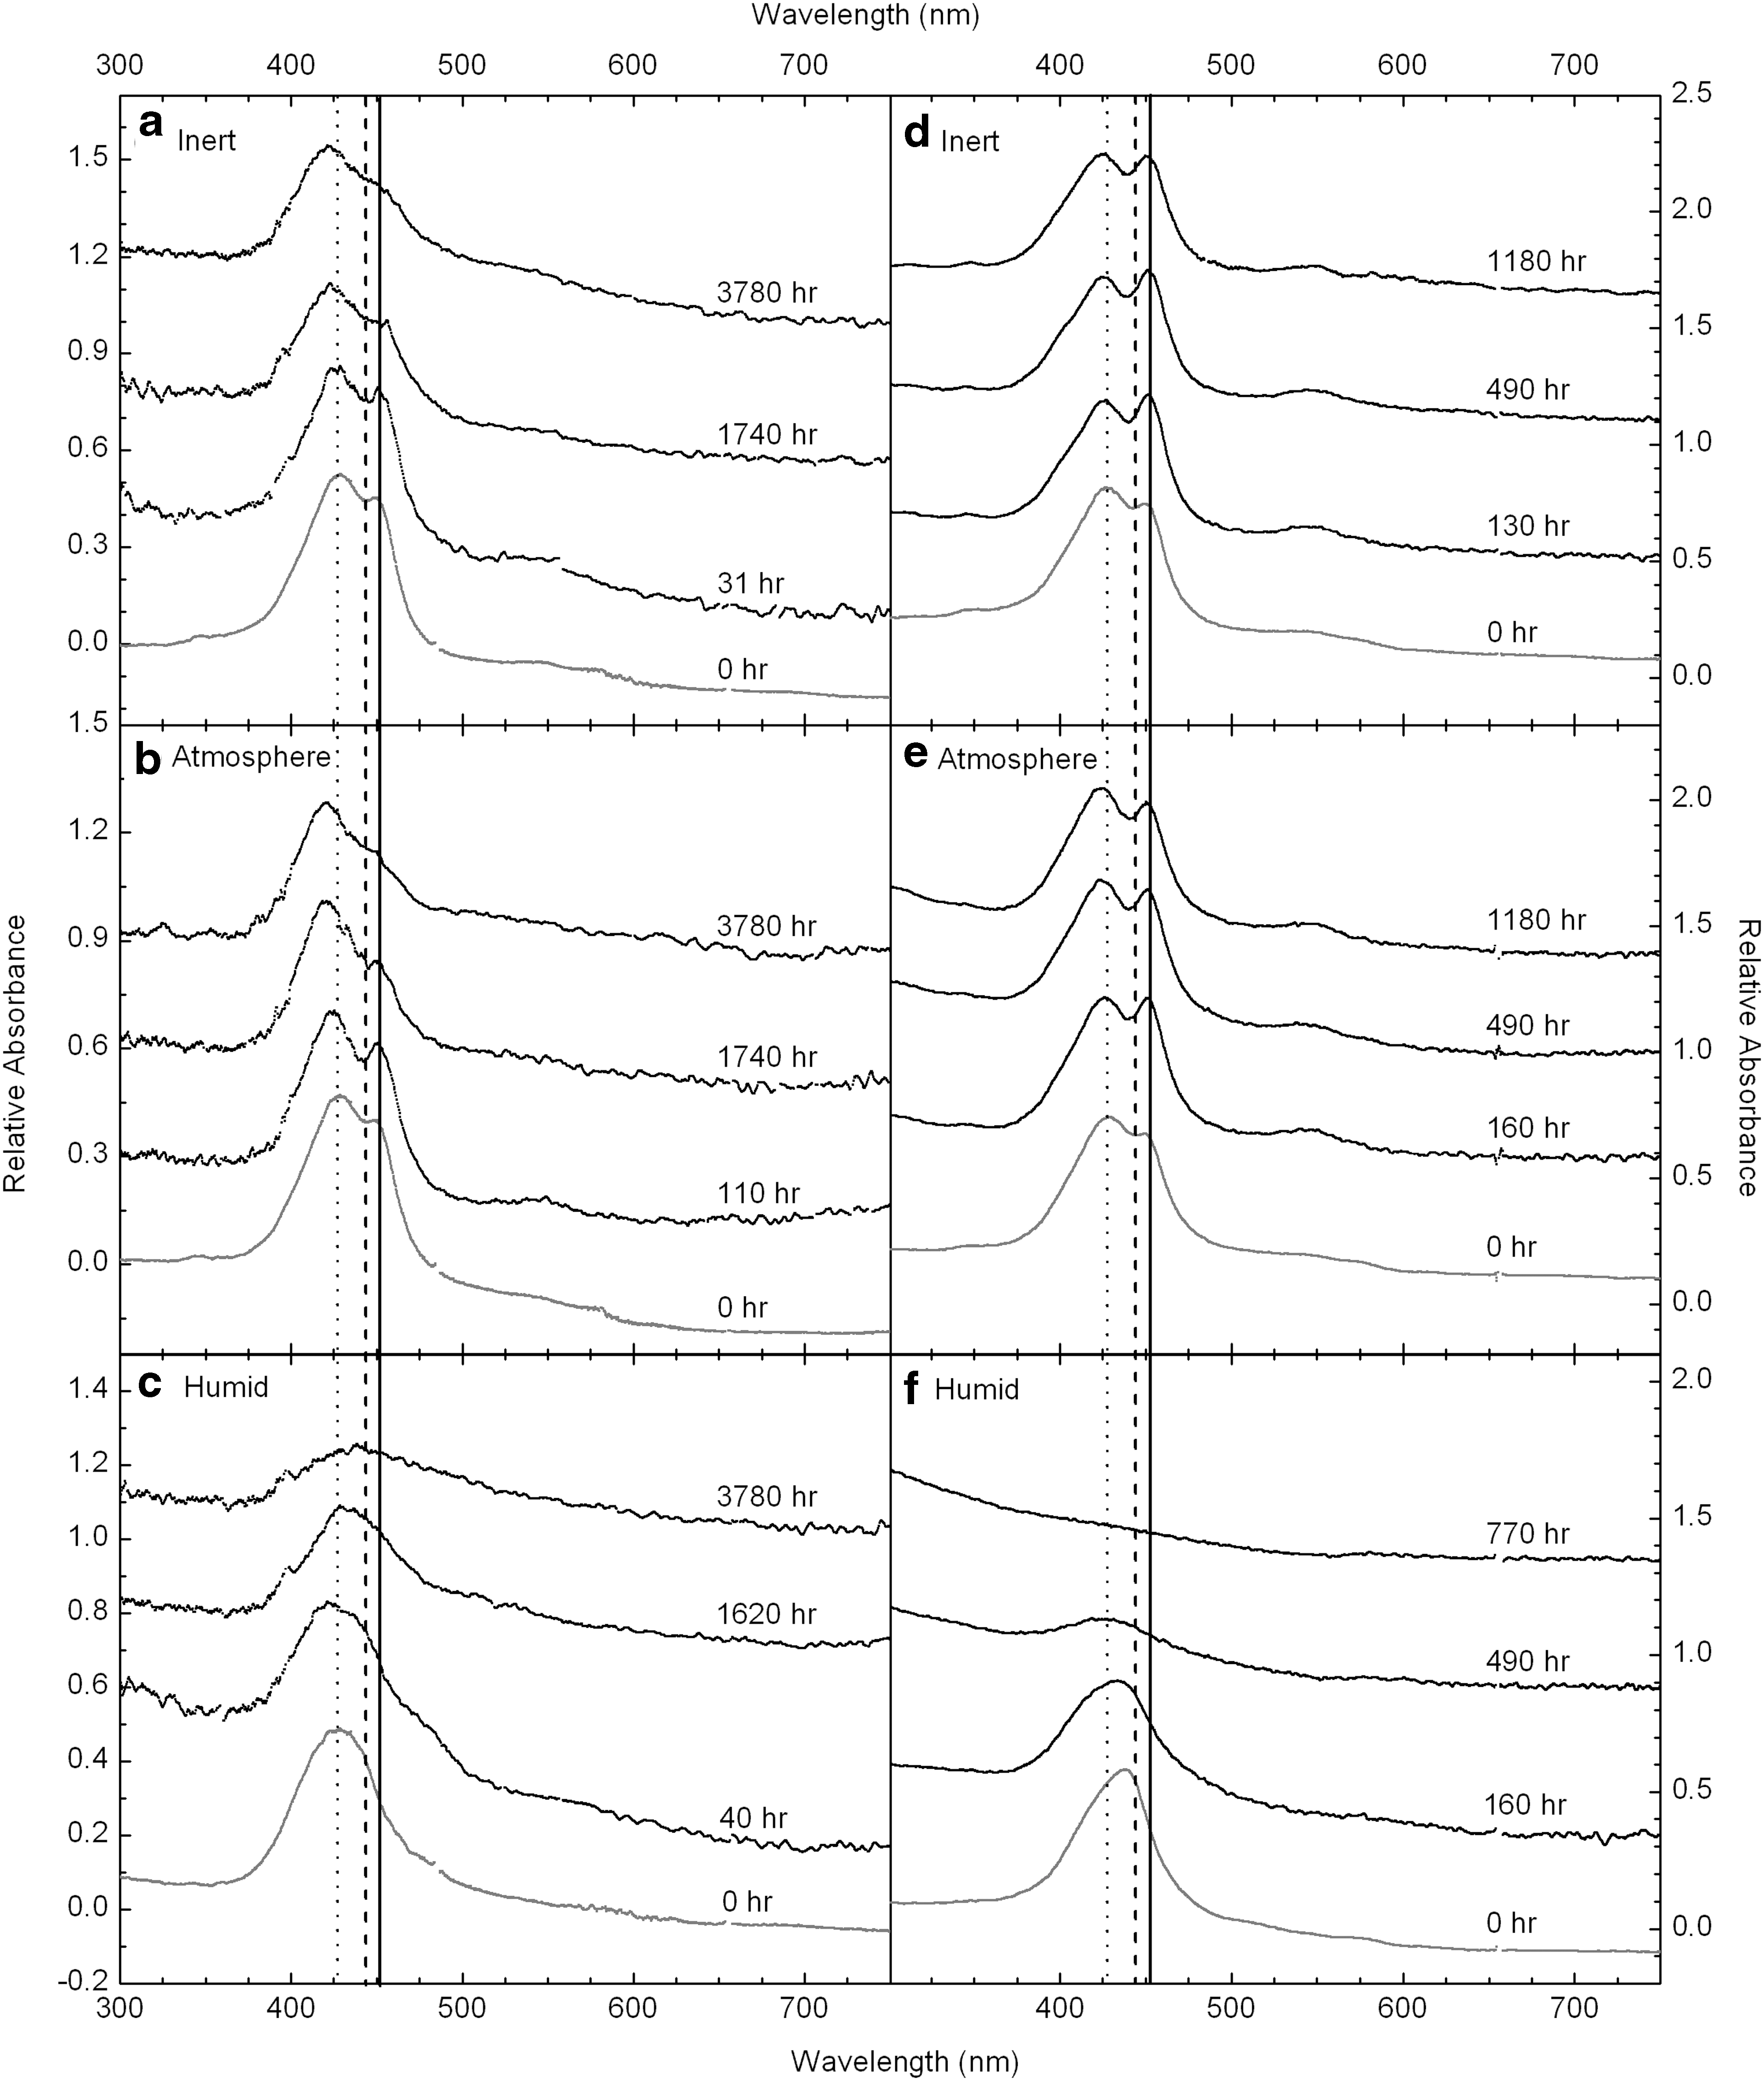
The preflight and sequential in-flight UV/vis spectra of three FeTPPCl sample cells are shown in the left-hand column of Fig. 4 (a–c). As indicated in Table 1, there were two Atmosphere cells and two Humid cells in the flight experiment, but only one of each type is shown in Fig. 4. The spectral behavior was largely consistent within cell types (i.e., spectra from one Atmosphere cell looked like those of the other). The prominent bands with peaks at 426 and 450 nm are attributed to the Bx and By polarizations of the Soret band. For the Humid cells, these bands are merged as a broad, “single” “B” peak centered at ∼427 nm. Another broad, but very weak, band at 550 nm is most obvious in the Atmosphere cell at 110 h of irradiation (Fig. 4b) but is present in varying strengths in most of the spectra. This 550 nm feature is believed to be the strongest of the Q bands, which extend with waning strength toward longer wavelengths. All the FeTPPCl flight spectra show a decrease in absorbance over time, with the rate of change dependent on the microenvironment of the sample.
(
3.3. UV/vis spectra of irradiated laboratory samples
Ultraviolet/visible spectra from the laboratory irradiation experiments are shown in the right-hand column of Fig. 4 (d–f ). Sample cells used in the laboratory experiment were exposed to simulated solar irradiation continuously for 6 months, with short breaks (<24 h) every 2 weeks for the collection of spectra. Spectra from the laboratory experiments are generally of a higher quality than the spectra obtained from the spacecraft, mainly due to the spectroscopic light source (which has better UV output than the Sun) and the ability to instantaneously optimize spectrometer parameters. The Soret band is evident in all the spectra from the laboratory experiment, and similar to the flight data, a decrease in the band is observed with increased irradiation time. Again, the rate of band loss depends on the microenvironment for each sample.
3.4. Integrated absorbance of the Soret region, flight and laboratory samples
To track changes in absorbance for the flight data, the entire region of the Soret band was integrated from 334 to 600 nm at numerous time points throughout the mission. Error bars for the integrated absorbance were estimated by selecting extreme (but still reasonable) continuum points on each side of the feature, resulting in the smallest and largest reasonable integrated absorbance for each spectrum, which define the margins of each error bar in Fig. 5. Larger error bars in the flight data are the result of weaker UV output from the Sun, as discussed above. The left-hand column of Fig. 5 (a–c) shows the change in integrated absorbance over time for the same cells displayed in the Fig. 4 spectra. Integrated absorbance data from each cell were fit by least-squares linear regression, weighted by error bars. Slopes and correlation coefficients (R) for each linear fit are included in Fig. 5.
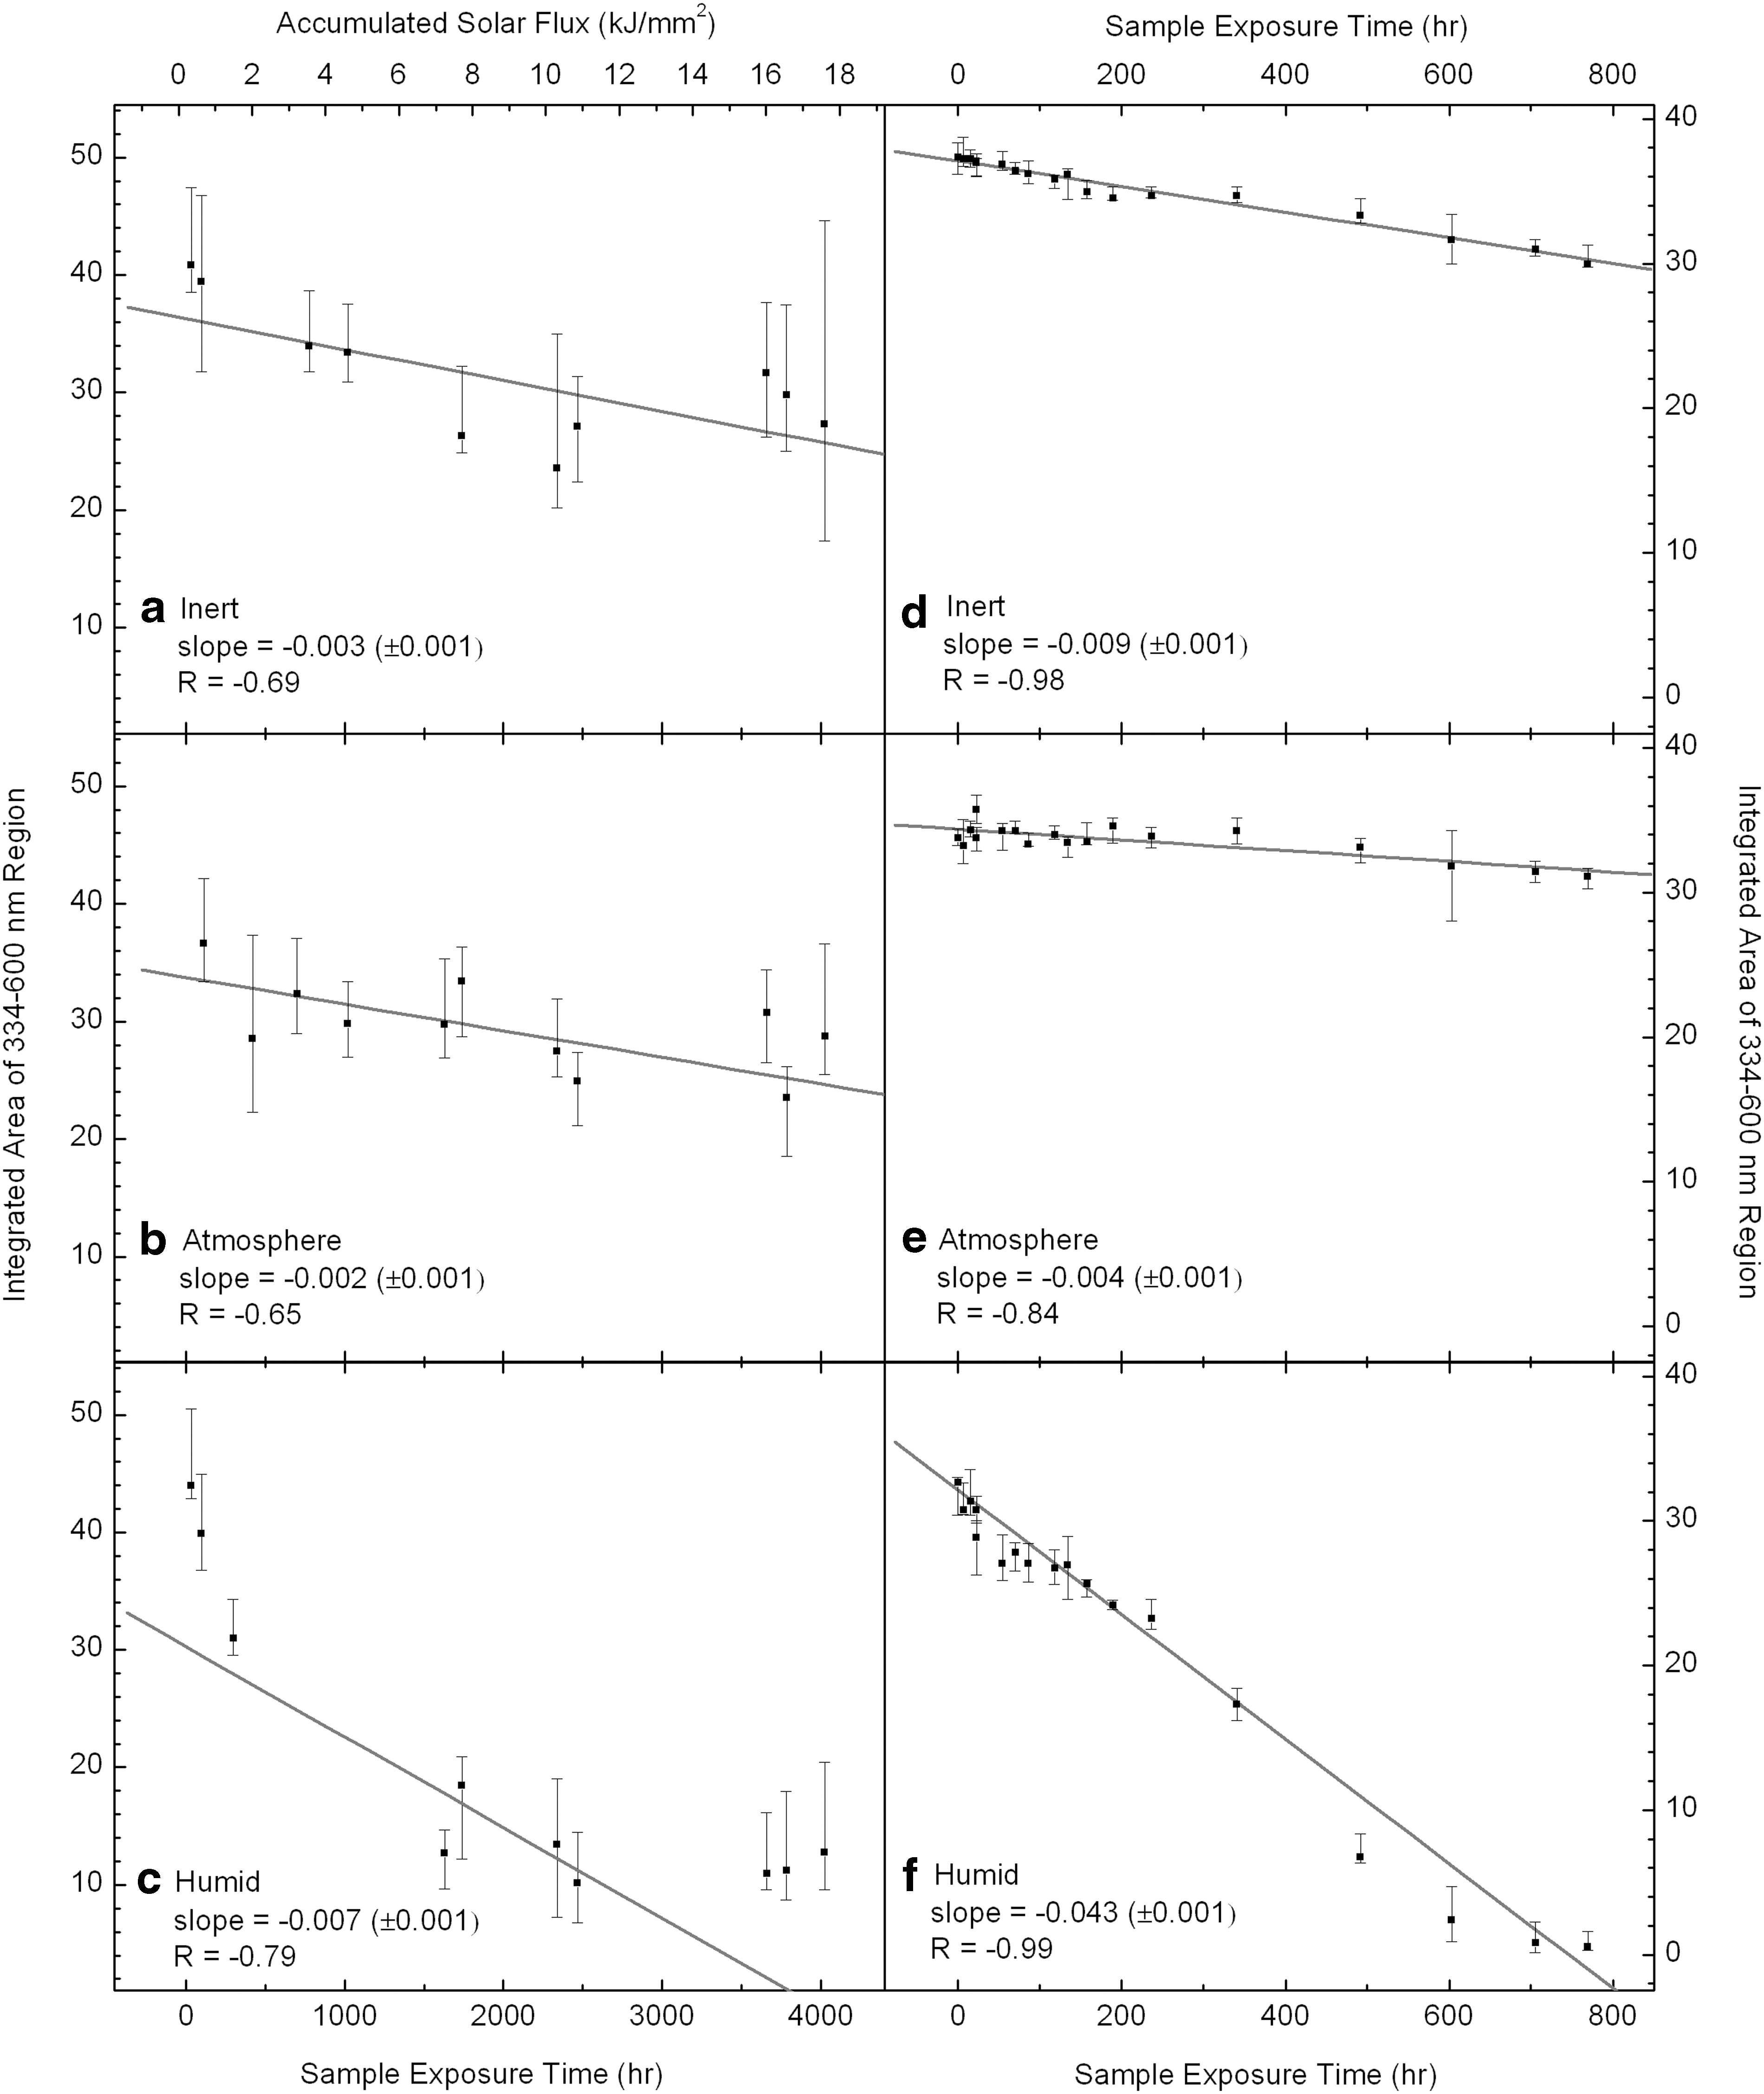
Photo-exposure time dependence of spectral changes in the spaceflight and laboratory samples, showing correlations across the three microenvironments for integrated flight spectra (
Integrations were performed for all the sample cells, including duplicates, but only one plot for each cell type is shown in Fig. 5. Linear fits to the data points have slopes in Integrated Absorbance Units (IAU) per hour of solar exposure or simulated solar exposure. The two Humid cells displayed the fastest decrease in the intensity of the Soret-region bands (slopes=−0.007, −0.004 IAU/h). The Inert and two Atmosphere cells showed a slower decrease in intensity of the bands (slopes=−0.003, −0.002, and −0.002 IAU/h, respectively). The error on all slopes was ±0.001 IAU/h.
Like the flight data, spectra from the laboratory irradiation experiment were integrated from 334 to 600 nm. The changes in integrated absorbance are displayed in the right-hand column of Fig. 5 (d–f ). The spectroscopic changes in the laboratory irradiation data are qualitatively similar to the flight data. Again, the Humid cell displays a rapid loss in intensity of the Soret-region bands, with the bands being entirely lost by ∼770 h of irradiation. The Inert and Atmosphere cells also show a decrease in the integrated band areas with time of simulated solar exposure.
Data for rates of change of absorbance versus time for each laboratory sample cell were fit with a least-squares linear regression, weighted by error bars. Slopes and correlation coefficients (R) for each linear fit are included in Fig. 5. The slope (rate of integrated intensity decrease) in the Humid cell is steeper (slope=−0.043 IAU/h) than those observed for the Inert and two Atmosphere cells (slopes=−0.009, −0.004, −0.004 IAU/h, respectively). The error on all slopes was ±0.001 IAU/h.
3.5. Gaussian fitting of Soret region
Since the laboratory irradiation experiments yielded spectra with very good signal-to-noise ratios, they were found suitable for multiband curve fits, assuming Gaussian line shapes. Curve fitting was helpful to identify, analyze, and compare individual spectral components and their changes over time. Figure 6 shows four examples of the fitting. The Soret band (or bands) at 430–460 nm, the neighboring Q band at 546 nm, and the N band at 350 nm were fit with a combination of six Gaussian components. The Soret band is best fit with the largest contributions from two Gaussians, Bx and By , as discussed in Section 2.3. The positions of the Bx and By bands vary depending on the cell microenvironment. Inert and Atmosphere cells have very similar spectral shape and evolution, so we consider them together: Bx and By are at 428 and 452 nm for these cells, sufficiently separated to produce two distinct peaks in the Soret region. The Soret band in the Humid cell also has Bx and By components, but their respective positions at 428 and 443 nm result in an apparent (asymmetric) single peak in the Soret region. The asymmetry of this peak, however, suggests it to be a blend of the same two primary components that are more distinct in the Inert/Atmosphere cells. The positions of Bx and By are marked with vertical lines in Figs. 4 and 6. For fitting purposes, the primary Bx and By bands were combined with weaker, broader Gaussians, which account for shoulders on either side of the main features. These shoulders are likely the result of the amorphous structure of our FeTPPCl thin films (without the inclusion of these features, the data cannot be well fit by using Gaussian line shapes). The N band and the Q band (when apparent) were also fit with broad, but comparatively less intense, Gaussian features.
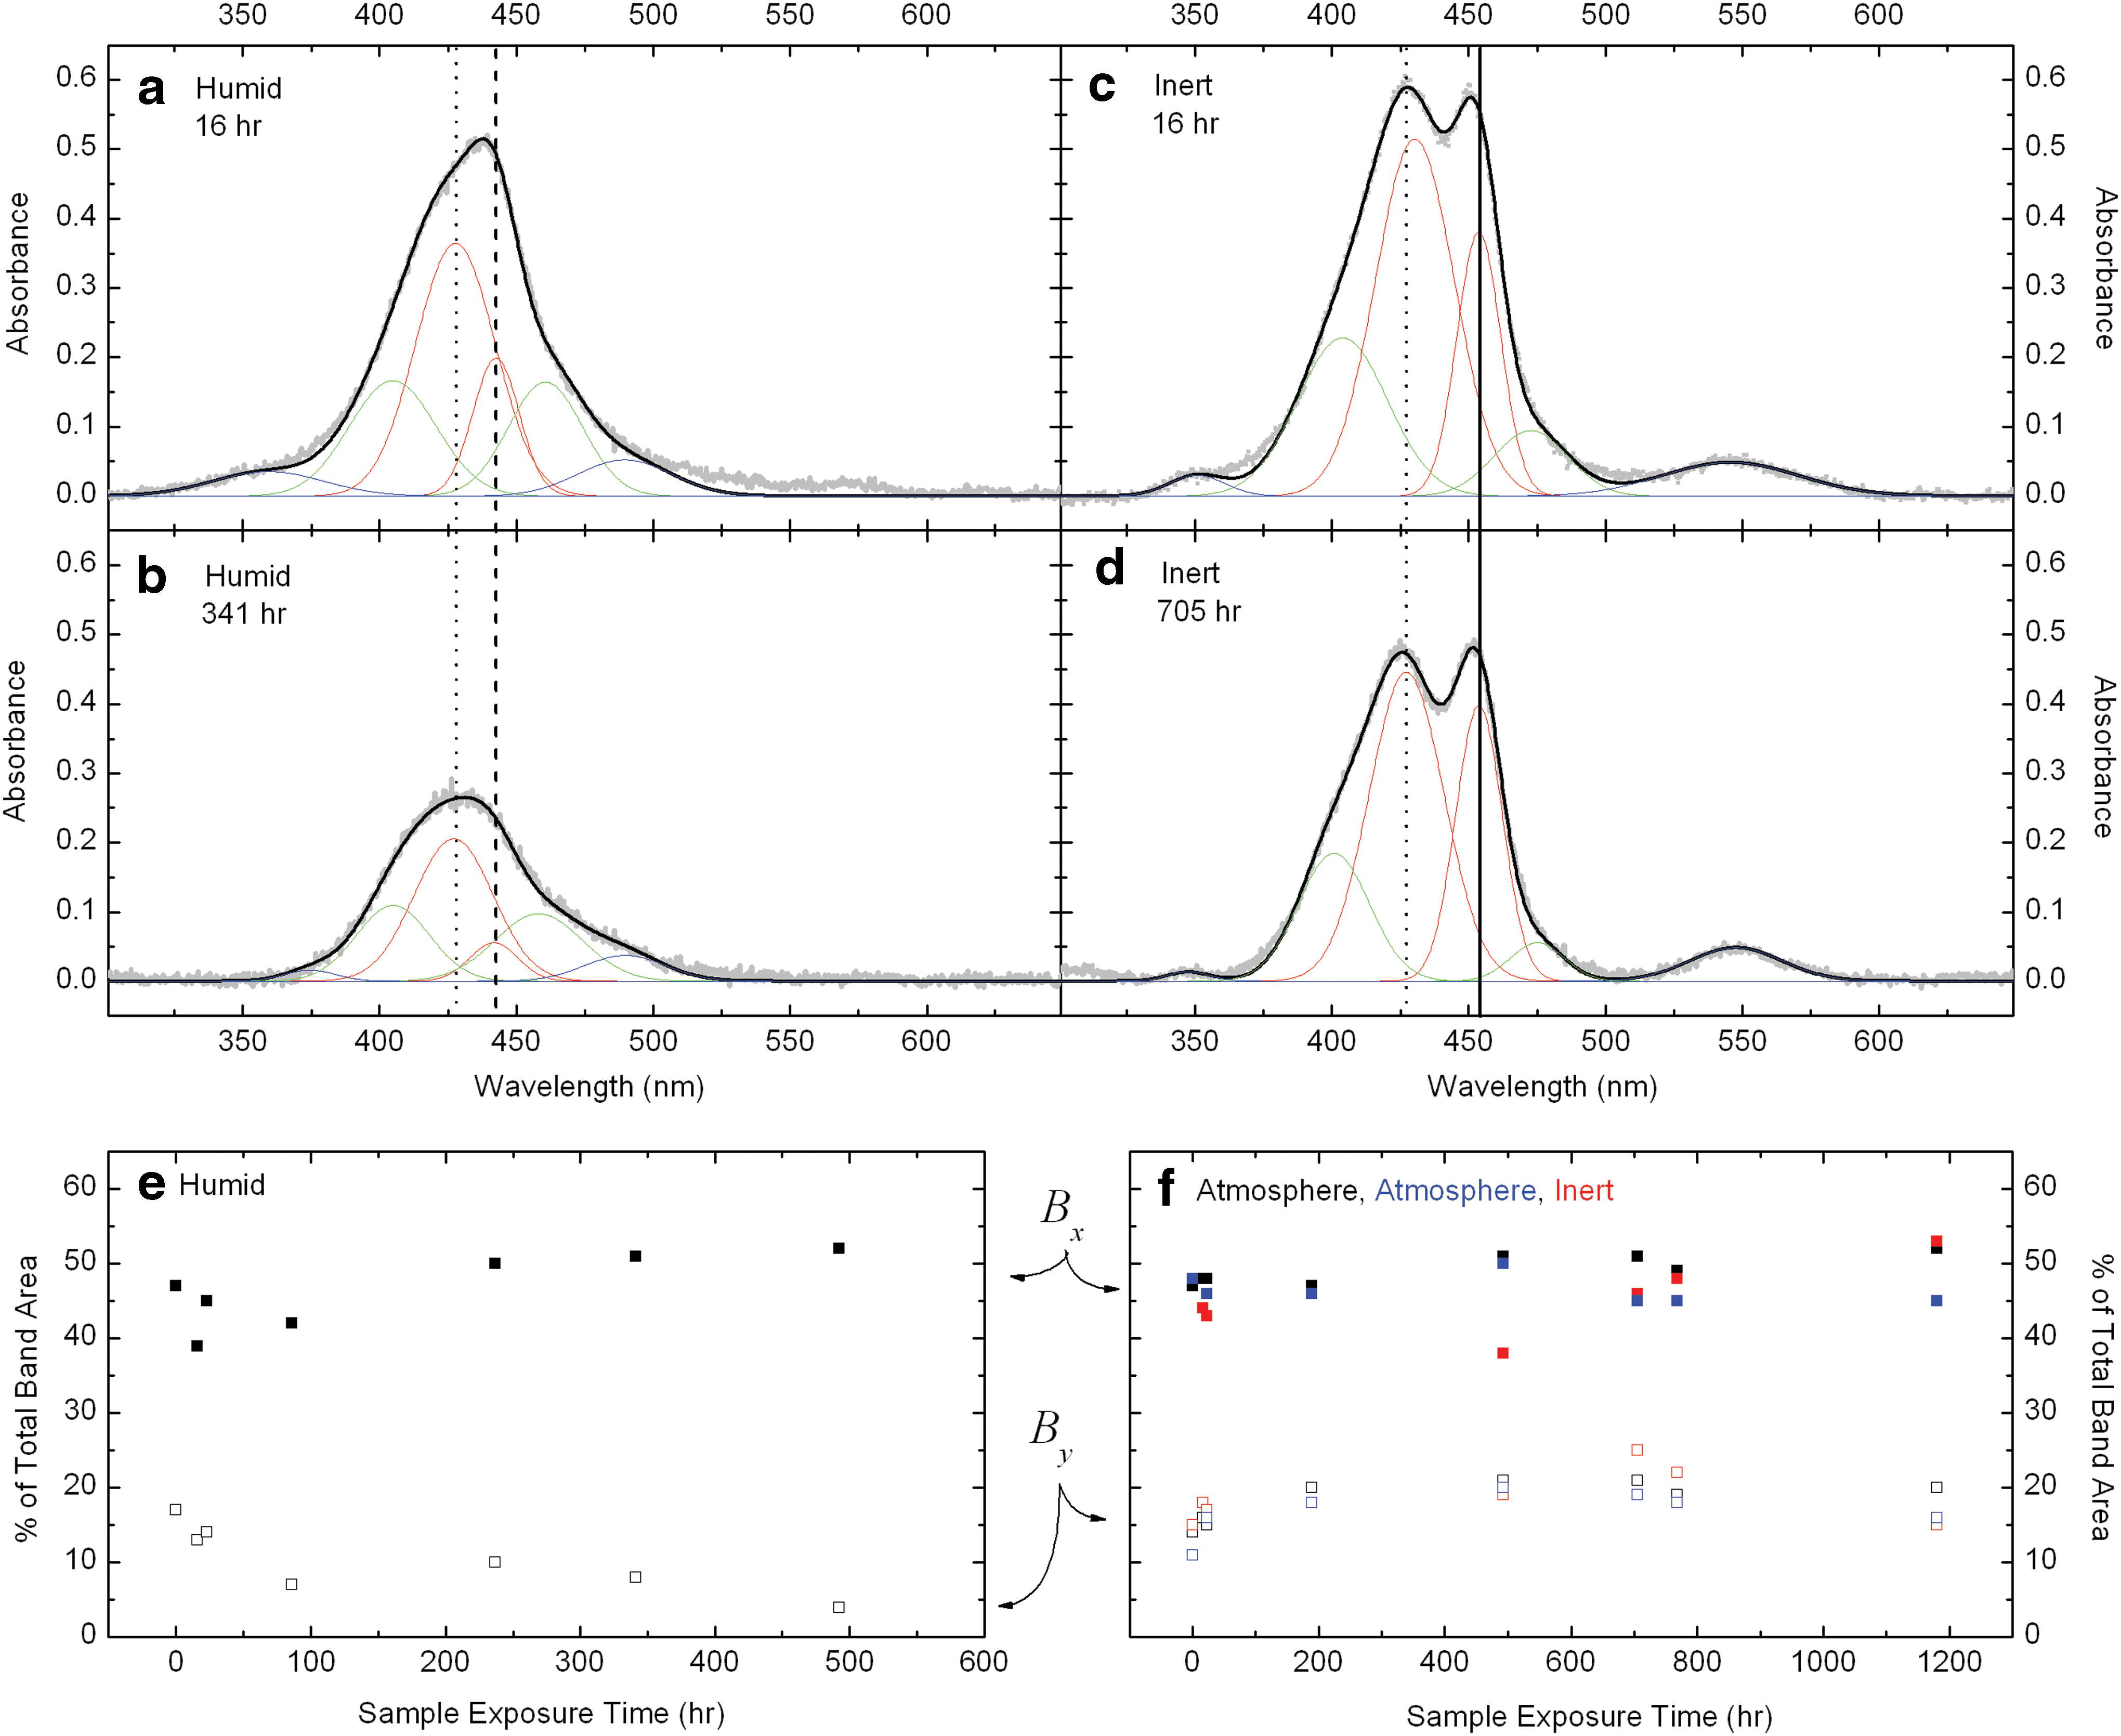
Examples of Gaussian curve-fitting of the spectral bands. Spectra from the Humid cell at two time points during the laboratory irradiation experiment are presented in panels (
The Gaussian fits were utilized to assess relative changes in the Bx and By components of the Soret band over time. We supplied our fitting routine with Gaussian parameters [band centers, full widths at half maximum (FWHMs)] for only those two bands, as a first iteration. The remaining four bands (the two shoulders and the Q and N bands) were optimized with less restriction on band centers and FWHM, only after the Bx and By components had already been optimized. Once a reasonable fit was determined, the integrated areas of the Bx and By components (red traces in Fig. 6) for each irradiation time point were tabulated. The relative contributions from Bx and By are presented as a percentage of the total band area in Fig. 6 (e, f ).
The Humid cell (Fig. 6e) shows a consistent decrease in the contribution of By to the total absorbance. The contribution from the Bx band is more persistent, accounting for 39–52% of the total absorbance at all measured time points. This strongly suggests that the structure responsible for the By component is preferentially eliminated with irradiation in a humid environment. Conversely, the Inert and Atmosphere cells display a stable (or possibly slightly increasing) contribution from the By band to the total Soret area and a stable (within the scatter) contribution from the Bx band.
3.6. UV/vis spectra of dark control samples
Four additional FeTPPCl sample cells (see Table 1) were kept under dark laboratory conditions (in an argon-purged glove box) to monitor as controls. They were measured monthly via UV/vis spectroscopy and with IR spectroscopy at two time points separated by 6 months. There were no significant changes in the UV/vis or mid-IR spectra over the monitoring period.
3.7. IR spectra of irradiated laboratory samples
The wavelength ranges for IR transmission through the MgF2 and sapphire (Al2O3) windows employed in the SEVO cell construction limited the observable IR frequencies to those greater than ∼1700 cm−1. While there have been numerous investigations of the IR properties of tetraphenylporphyrin (H2TPP) and FeTPPCl (e.g., El-Nahass et al., 2005; 2010), most are limited to frequencies less than 1700 cm−1. There appears to be a discrepancy in the literature for some of the vibrational motions above 1700 cm−1. In particular, the assignment of the aromatic C–H stretching modes attributed to the phenyl and the pyrrole groups are ambiguous (e.g., El-Nahass et al., 2005).
To resolve this ambiguity, we conducted our own computational Density Functional Theory (DFT, see Ricca et al., 2012) study to distinguish the C–H aromatic stretches of the pyrrole group in the porphyrin ring from those of the aromatic phenyl groups attached at the periphery of the ring. Our calculations showed the aromatic phenyl group C–H stretching motions to be distinct from those of the pyrrole aromatic C–H stretching, the former occurring at significantly lower frequencies than the latter. Thus, we assign the bands at 3024 and 3054 cm−1 to the aromatic phenyl C–H stretch, in agreement with Saini et al. (2004). Figure 7 shows the positions of these bands in our thin-film samples.
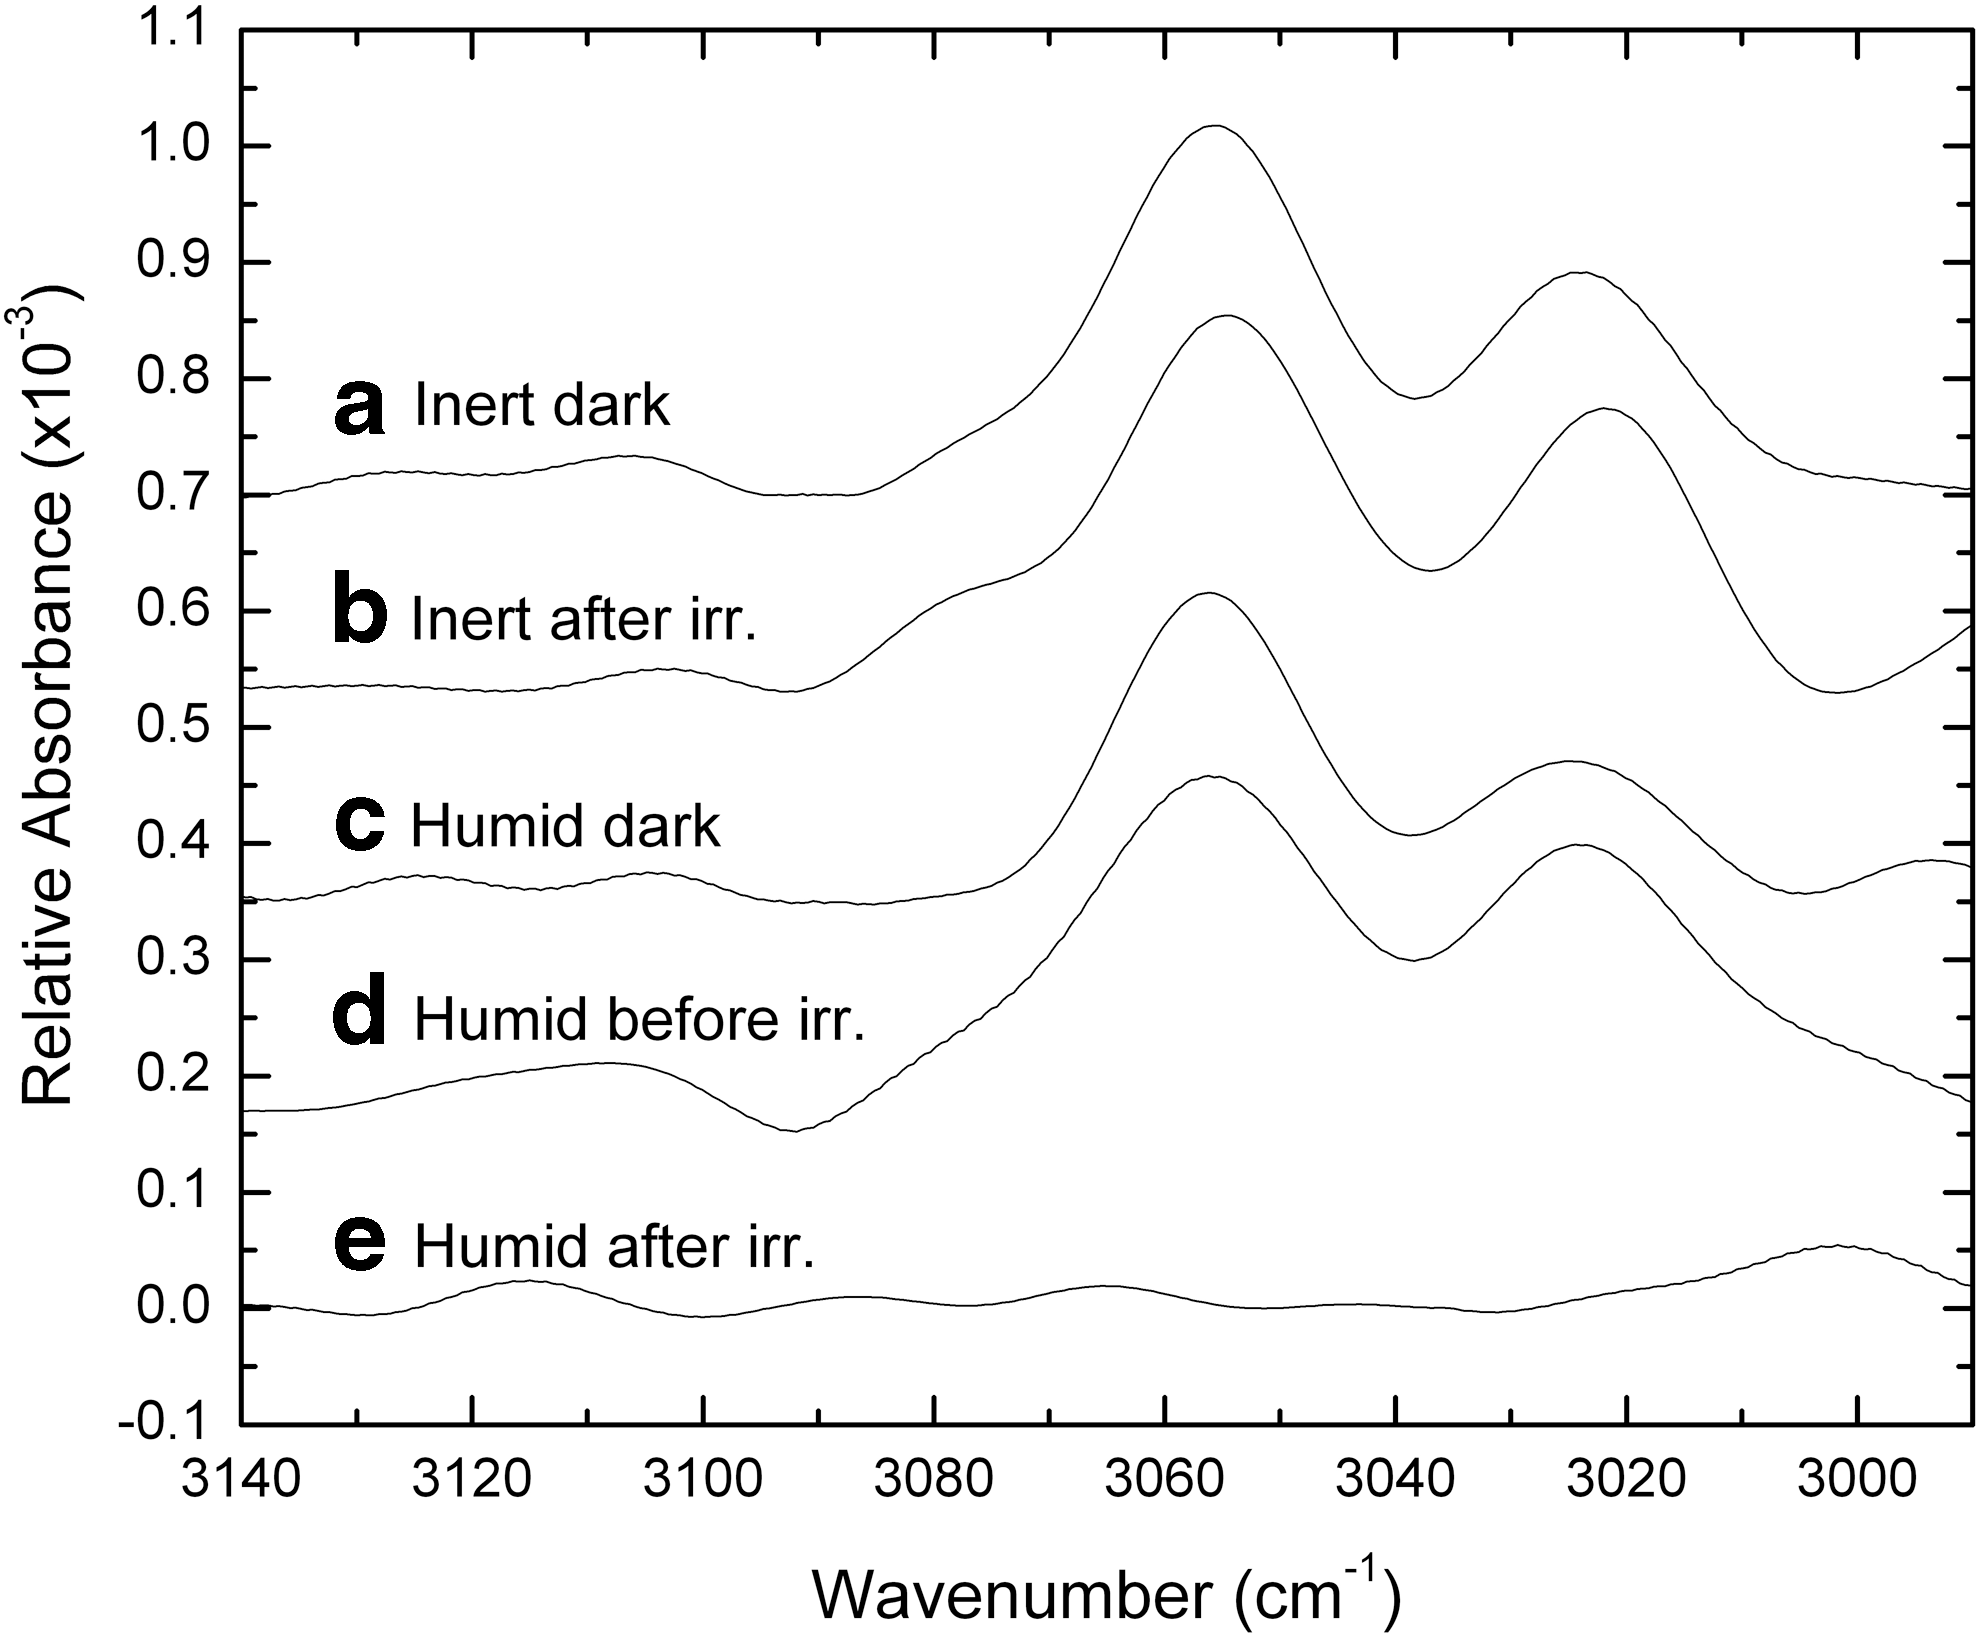
Infrared data showing the region of aromatic phenyl C–H stretching modes in the FeTPPCl sample spectra. Inert and Humid cells are shown from the set of dark controls and the set of irradiated cells. Note that in the irradiated Humid cell, the aromatic phenyl bands at 3024 and 3054 cm−1 have been lost by the end of radiation exposure, while the correspondingly irradiated Inert cell shows the phenyl bands remain intact. See Section 3.7 for details.
The laboratory FTIR measurements shown in Fig. 7 indicate only slight changes with time in the band areas for these phenyl modes for the “dry” cells (only Inert cells are shown, but Atmosphere cells showed similar stability). However, with irradiation, the 3024 cm−1 band undergoes a 2–5 cm−1 redshift for the Inert and Atmosphere cells. In comparison, the phenyl aromatic stretching modes in the Humid cell decrease rapidly upon exposure to the solar simulator, disappearing completely from the spectrum after ∼1000 h of irradiation; the band positions for the Humid cells do not appear to change with time.
Further comparison of the FTIR spectra for the three microenvironments reveals another pattern of spectral evolution. A new broad band (FWHM ∼27 cm−1) centered at 1961 cm−1 appears and grows with irradiation time in the Inert and Atmosphere cells. This new band is absent in the irradiated Humid sample cell as well as in the dark control samples. The behavior of this band and correlation plots are presented in Fig. 8 and discussed in Section 4.
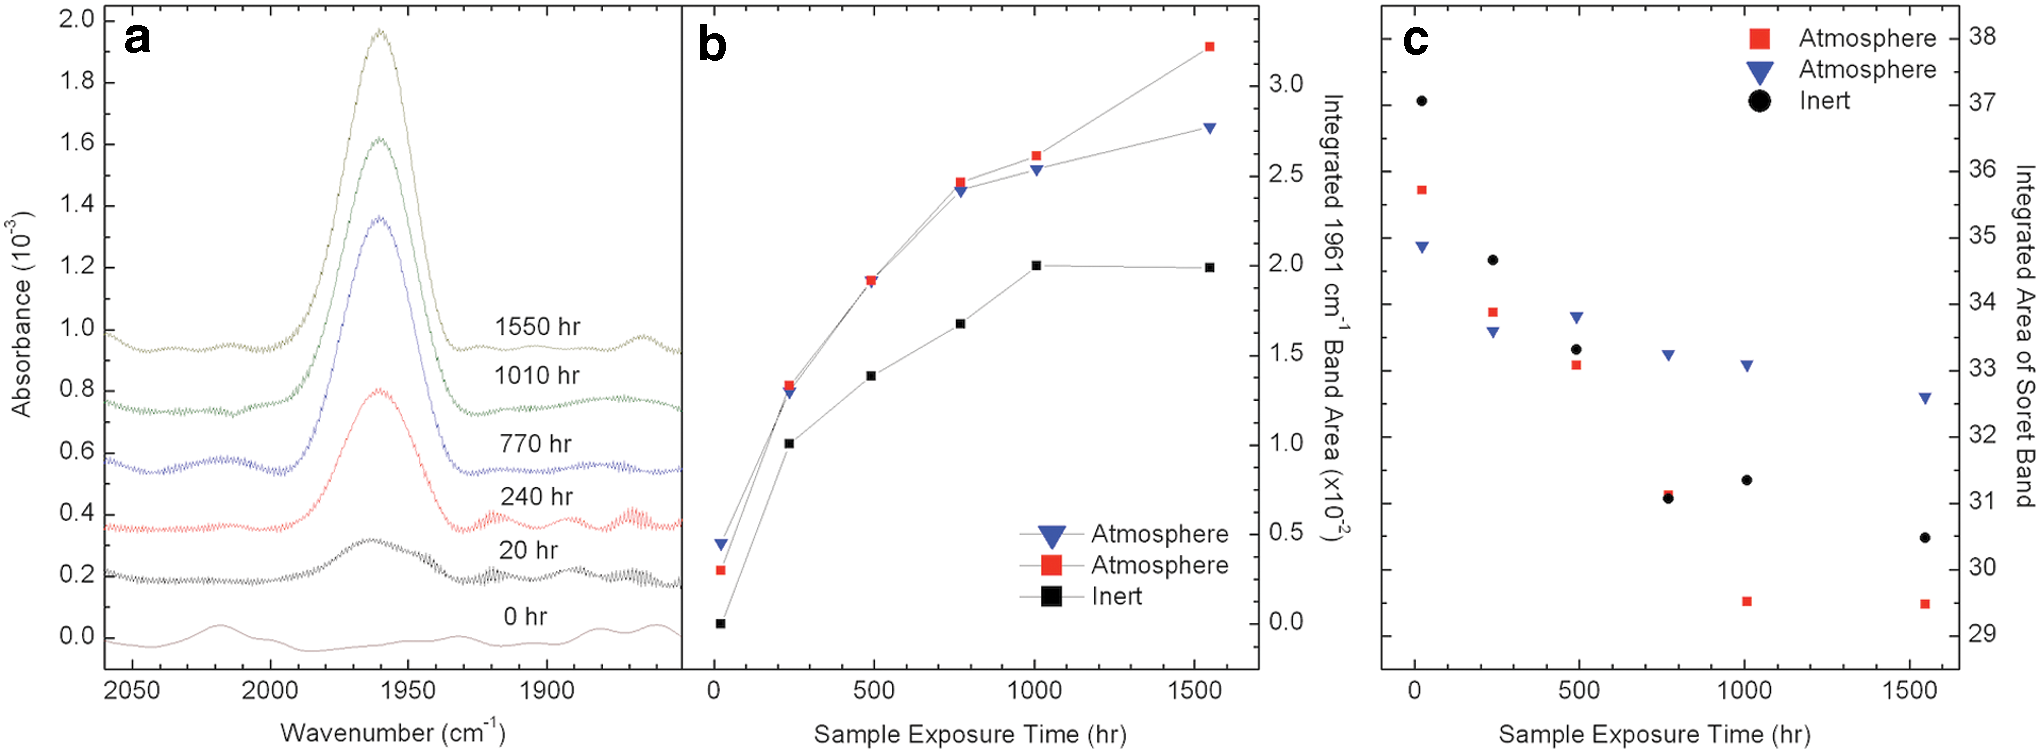
Infrared data, integrated bands, and correlations. (
3.8. Nitrogen species in dark and irradiated laboratory samples
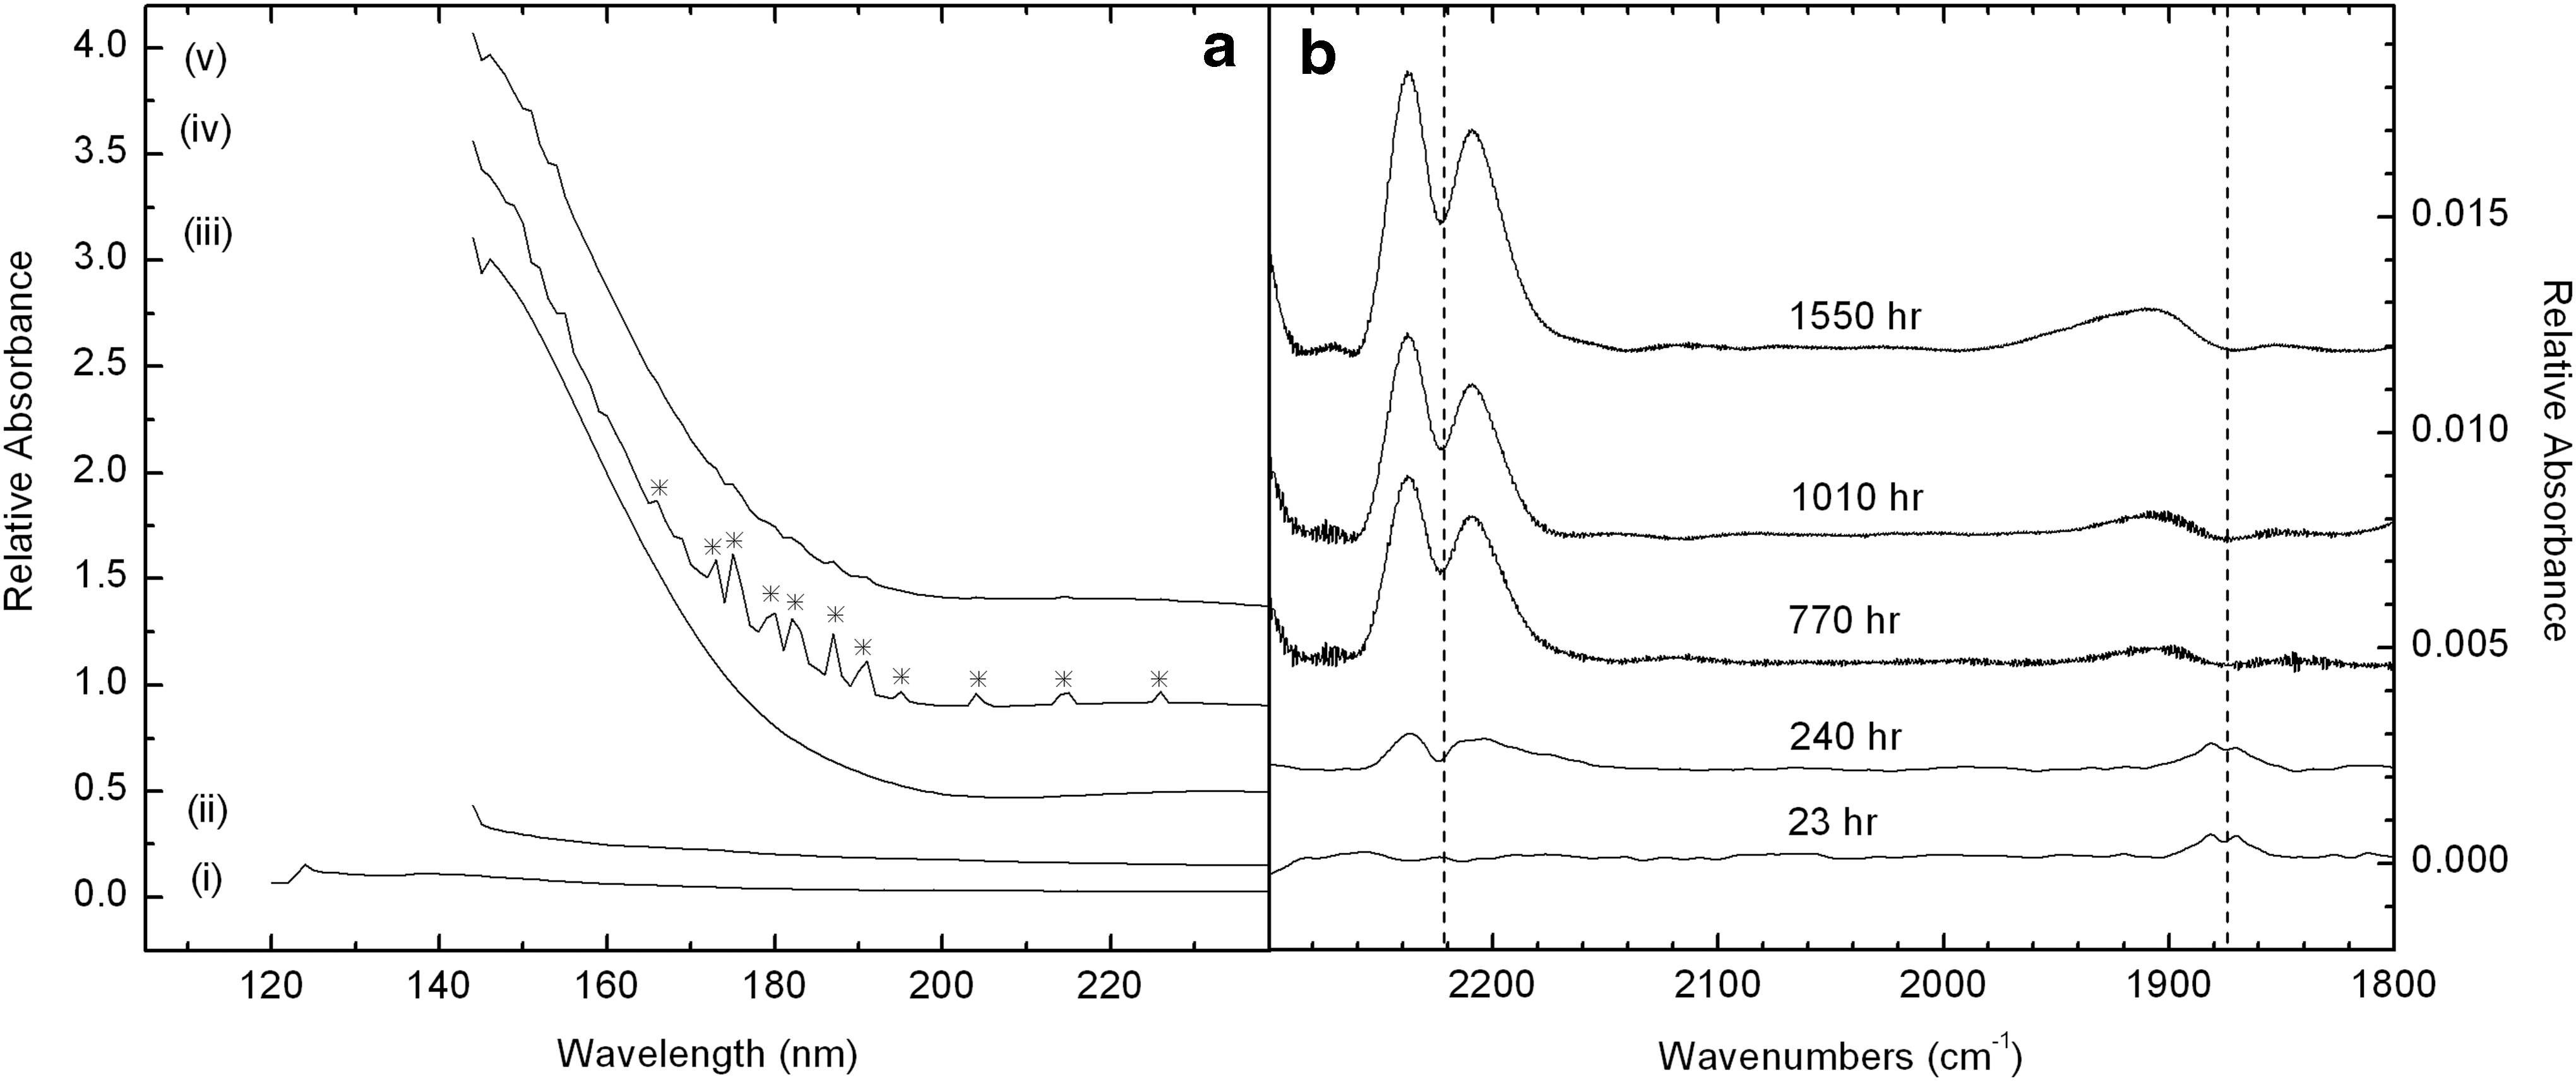
Vacuum ultraviolet spectra of SEVO sample cells and a SEVO window were measured at the Synchrotron Radiation Facility ASTRID at Aarhus University. Figure 9a shows the absorbance spectrum of a MgF2 window and of four complete sample cells, which are sealed with sapphire (Al2O3) windows, as shown in Fig. 1b. As expected, the MgF2 window alone [i.e., with no sample cell or sapphire window, trace (i)] has relatively low absorbance in the VUV/UV/vis. Likewise, the Inert reference cell in trace (ii) has a flat absorbance spectrum; however, the sapphire windows on these fully assembled sample cells do not transmit below 140 nm. The Atmosphere and Humid reference cells [traces (iii)–(v)] present a strong, broad absorption in the VUV as a result of the additionally deposited Al2O3 substrate layers for those cells. The VUV spectra reveal the presence of nitric oxide (NO) in the Humid sample cells, particularly in the dark control reference cell shown in trace (iv). The NO features marked by asterisks in Fig. 9a are also present in many of the Humid sample cells that were exposed to irradiation, but the strength of the bands is greatly diminished in those cells, as can be noted in trace (v) of Fig. 9a. Integration of the bands in the dark control cell indicated a NO concentration between 300 and 800 ppm; the concentration of NO in the irradiated Humid cell had an upper limit of 180 ppm. NO was only detected in Humid cells; NO was not detected in the Inert or Atmosphere cells (see Table 1 for description of sample cell microenvironments).
(
Humid sample cells were designed to maintain a narrow range of relative humidity (0.8–2.3% RH) inside the cell with a salt pair buffer immobilized on a stainless steel mesh at the cell's perimeter (Bramall et al., 2012). Equilibrium of H2O between the gas phase and the salt pair depended on the temperature inside the cell. The salt pair, consisting of Mg(NO3)2 dihydrate and Mg(NO3)2 hexahydrate, is the only source of nitrogen in these cells (the VUV-measured cells contained no FeTPPCl). We therefore conclude that the detected NO was derived from the hydrated salt pair; NO may have originated from outgassing of impurities in the salts or from oxidation reactions involving the H2O vapor, stainless steel mesh, and nitrate salt pair. McNesby and Fifer (1991) measured photodestruction of NO gas under Lα irradiation and subsequent production of N2O and NO2. Indeed, the loss of NO in the VUV spectra of Humid cells [Fig. 9a, traces (iv) and (v)] is consistent with photodestruction of this species.
Infrared spectroscopic measurements of the laboratory-irradiated Humid cell are shown in Fig. 9b. These IR spectra also confirm the loss of NO. Weak gas-phase P- and R-branch NO bands centered at 1875 cm−1 are present in the Humid cell, at the beginning of the irradiation experiment (at 23 and 240 h). These NO bands disappear with continued irradiation. In addition, the IR spectra indicate the growth with irradiation time of P- and R-branch N2O bands centered at 2224 cm−1. NO2 bands, if they exist, would be strongest around 1600 cm−1. Since this frequency is outside the observable range for our SEVO cells, we were not able to confirm or eliminate the possibility of the presence of this molecule in our sample cells.
4. Discussion
Ultraviolet/visible spectral changes were measured for FeTPPCl in each of the three microenvironments, in both the flight experiment and the laboratory experiment. The overall character and evolution of both the Inert and Atmosphere sample spectra are very similar for flight and ground samples (Figs. 4 and 5); indeed, comparison of these sample types in the flight and lab experiments shows a similar (within a factor of 2–3) rate of loss of total absorbance in both cases (Fig. 5). Both sample types also show an ∼8 nm blue-ward shift in the position of the Bx band with continued irradiation. We conclude that dry headspace gas is the primary factor in their similar behavior. The presence of CO2 and O2 in the Atmosphere cells, as well as the wavelength-filtering substrate coatings for these cells, plays at best a minor role in the spectral evolution of Atmosphere relative to Inert samples: Figure 5 shows that disappearance rates are ∼ 1.5–2× slower for the Atmosphere relative to the Inert samples in the flight and laboratory exposure experiments.
In contrast to the “dry” samples discussed above, the Humid samples showed more rapid degradation of the FeTPPCl with time of exposure. Photogenerated OH·was expected to play a major role in this accelerated degradation, which is consistent with its destructive capabilities. However, the presence of NO (as well as N2O) may have played a role in the degradation of the films in these cells as well. Based on humidity levels inside the cells, the concentration of H2O was ∼450 ppm. As noted in the previous section, NO concentrations were between 300 and 800 ppm in non-irradiated cells and decreased to <180 ppm after 1180 h of laboratory irradiation. By contrast, H2O gas was still detectable in IR spectra of the Humid sample cells, even after irradiation. NO and OH·are both odd electron (radical) species, and the dark results show that light is required for degradation in any case. However, the persistence of H2O gas and the decrease of NO in the Humid cells support our hypothesis that photogenerated OH·played an important role in the degradation of the porphyrin.
Wayland and Olson (1974) found that FeTPPCl exposed to higher partial pressures of NO (∼1000 times higher than the NO pressure in our sample cells) readily produced FeTPP(NO)Cl and, in the presence of a weak reducing agent, FeTPP(NO). Our IR spectra show no clear evidence of the band detected by the authors at 1870 cm−1, which is related to a linear Fe(II)NO+ unit. In our UV/vis spectra (Fig. 4), there is some evidence of a new band at 400 nm, but this band is present in the Inert cell type as well; since the Inert samples do not contain any NO, the 400 nm band cannot be attributed to the FeTPP(NO) band detected at that wavelength by Wayland and Olson (1974). The more likely explanation for the 400 nm feature is a variation in the solar spectrum over time, in which particular absorption lines (Ca+ has two closely spaced lines at 398 and 396 nm) increase or decrease due to solar activity.
While, on the whole, all Humid cells showed a more rapid loss in FeTPPCl than the dry Inert and Atmosphere samples, the laboratory experiment showed much more rapid degradation with time of exposure than the corresponding spaceflight samples. The rate of decrease of integrated absorbance for the laboratory-irradiated samples is a factor of ∼6 times higher than the rate observed in the flight experiment (Fig. 5). The most plausible explanation for this difference is the effect that temporal thermal and illumination exposure variations in the spaceflight sample cells have on the environment inside the Humid cells. Humidity is maintained within a certain range (0.8–2.3% RH) by a hydrated salt-pair buffer, with the humidity within this range being determined by the sample cell temperature (higher temperature results in higher water vapor pressure). In orbit, sample cell temperatures depend on the satellite's orientation relative to the Sun, as well as its position in and out of Earth's shadow. On average, during each 98 min orbit, the satellite spent approximately 1/3 of the time in Earth's shadow, although this fraction varied from near zero to over 50% at different phases of the orbit over the course of months. For the spaceflight experiment, the concentration of photogenerated OH·in the Humid cells would drop quickly during the shadowed portion of each rotation of the satellite about its axis; a similar effect occurs during the 40 s time periods (out of each minute) during which the laboratory samples are in the dark. In the space experiment, the concentration of photogenerated OH· also would fall to zero during the many-minutes-long periods of eclipse during each orbit of Earth. In the laboratory exposure, there was no analogous “long dark period” except on those occasions when samples were removed for spectroscopic measurements. Further, the average temperature of samples in the laboratory experiment (∼30°C, based on a range of 20–43°C) was higher most of the time than for the flight samples exposed to varying temperatures, resulting in higher relative humidity within the laboratory cells and, presumably, higher concentrations of photogenerated OH·in contact with those samples. Organics are expected to degrade more rapidly in the presence of highly reactive OH·; in the laboratory Humid sample relative to the flight sample, faster destruction of the FeTPPCl was unequivocally measured.
Other studies have addressed the fidelity of laboratory-simulated solar irradiation. Guan et al. (2010) conducted experiments to compare the effects of simulated radiation to that experienced in LEO and contended that many different variables can cause differences in observed processing of organics in space and in a laboratory simulation. These factors include pressure, gas mixture ratios, and power used in H2(/He) lamps to produce Lyman-α irradiation (all of which affect the monochromaticity and spectral distribution of the lamp output), decrease in transmission of MgF2 windows due to extended irradiation time (color centers), as well as temperature fluctuations.
As noted in Section 3.5, the Humid sample displayed a preferential loss of the By (443 nm) polarization of the Soret band compared to the Bx (428 nm) polarization. Eventually, the entire Soret band was lost, but By disappeared first according to our Gaussian fits to laboratory data. Differences in the two polarization components have been ascribed to such factors as distances and angles between neighboring porphyrins, differences in metal or other substituents, as well as the thickness of the film (Huang et al., 2000). For the thin films (∼17 nm) studied here, the presence or absence of water presents a likely cause of polarization component differences; the Fe in FeTPPCl is formally coordinatively unsaturated, being ligated by four nitrogen atoms in the plane of the porphyrin and one axial Cl−. In the solid state, Fe's 6th coordination is likely satisfied by weak bonding to one of the nitrogen electron lone pairs of a neighboring FeTPPCl, which is consistent with the Z=2 variation of the crystal structure's space group (El-Nahass et al., 2010). The thin-film form of this compound provides ready access for H2O to Fe's 6th coordination site for those molecules at or near the outer surface, and any grain boundaries could provide access to some fraction of the molecules within the film as well. This “free” H2O (or OH−, with the dissociated H+ finding a nearby N from an adjacent porphyrin ring) would serve as a better 6th ligand for Fe than the geometrically constrained, shared N lone pairs. The addition of an axial H2O or OH− ligand could thus be the cause of different ratios of Bx, By polarization components for samples in humid versus dry environments. It could also be the reason for the differential rate of change in the two polarization states as new areas of the film are opened to water access by the photodegradation process.
The decreasing By band was also compared with the loss of IR features in the same cell (particularly the aromatic bands at 3024 and 3054 cm−1). Unfortunately, the By feature was completely lost in the UV/vis spectra before more than three data points (for integrated absorbance) could be collected via mid-IR spectroscopy. With only these three available points, there does not appear to be a correlation between the loss of aromatic bands (3034, 3054 cm−1) in the IR and the loss of the By band in the UV/vis.
The observed UV/vis spectral changes of the thin films were further examined by IR studies. The appearance and growth of a new band around 1961 cm−1 is intriguing, considering the limited changes observed in the phenyl aromatic C–H stretching region, which indicate that the phenyl groups are still intact in the Inert and Atmosphere cells. Furthermore, when cells were disassembled and exposed to air, this band disappeared, indicating a sensitivity to moisture or oxygen.
The growth of the 1961 cm−1 band was compared to the loss of the Soret band in the UV/vis spectra of the Inert and Atmosphere cells. Infrared spectra were measured at six time points throughout the laboratory experiment, and unlike the Humid sample, the Inert and Atmosphere samples degraded slowly enough that their bands were detectable with UV/vis spectroscopy over the entire duration of the laboratory experiment. An inverse correlation between the 1961 cm−1 band and the total absorbance of the Soret region is shown in Fig. 8c. The inverse correlation (R) was strong for each of the sample cells (Atmosphere, R=−0.83,−0.97; Inert, R=−0.94), indicating that the growth of the 1961 cm−1 band is likely to be related to the destruction of the porphyrin ring.
Given the limited IR window available for our study, unequivocal identification of the species responsible for the 1961 cm−1 band is not possible; however, a literature search for relevant molecules exhibiting a vibrational band in that region resulted in several possibilities: benzene (C6H6), an iron carbonyl complex, ethynylmethyl iron (CH3FeC2H), chloropropadiene (C3H3Cl), and allene (C3H4). Upon irradiation, it is possible that the porphryin ring is destroyed, leaving behind phenyl groups to form benzene, which exhibits an intense band around 1961 cm−1. However, benzene should also exhibit a band nearly as intense at 1815 cm−1; this band is not visible in our spectra, so we eliminate this option. FeTPP carbonyl complexes could be formed from contaminant oxygen in the Inert cell or CO2 in the Atmosphere cells. These complexes tend to exhibit intense bands in the 1950–1975 cm−1 region of the IR spectrum. Wayland et al. (1978) reported that when FeTPP in solution was exposed to an atmosphere of CO, they detected growth of a band at 1973 cm−1. They assigned the band to FeTPP(CO). The CO2 and H2O contamination in our sample cells is estimated to be at very low part-per-million levels, so it is unlikely to be responsible for the growth of this band in our Inert cell, which nominally contains no source of oxygen. We therefore conclude that, barring improbable contamination levels, carbonyl complexes are an unlikely source of the 1961 cm−1 band.
As discussed by Bartocci et al. (1991) and Ball et al. (1993, 1994), the iron atom in metalloporphryins can act as a catalyst under UV irradiation. In the studies of Ball et al. (1993, 1994), allene and methylacetylene with atomic iron were irradiated in an argon matrix. In both instances, when irradiated at wavelengths between 280 and 360 nm, a series of bands grew in between 1960 and 1980 cm−1. The authors attributed the new bands to the C≡C stretch of the ethynyl group (C2H). This species did not form when diatomic iron was used in the experiments. However, the Ball et al. (1993, 1994) studies indicate that the formation of this compound may require the availability of isolated Fe atoms, which are not likely to be present in our thin film samples. Chloropropadiene presents another possible candidate for the 1961 cm−1 feature. Shimanouchi (1972) reported a band at 1963 cm−1 (C≡C stretch); we hypothesize that this species could be created via UV reduction of Fe(III) to Fe(II), subsequently removing the Cl− ion (and freeing one electron). The Cl− may react with the porphyrin ring to make C3H3Cl. This compound would not be found in the Humid samples (indeed, there is no 1961 cm−1 feature in the irradiated Humid cells), since Cl− would be more likely to react with H2O to form HCl.
Finally, allene exhibits a C≡C stretch around 1957 (±6) cm−1 (Shimanouchi, 1972), as well as a CH2 symmetric stretch around 3015 cm−1 in the gas phase. Additionally, it is possible that the redshift of the phenyl aromatic band at 3024 cm−1 is the result of the formation of allene (where allene is replacing the contribution from phenyl groups). Considering all the factors discussed above as well as the relevant literature, we conclude that the most likely candidates for the new band at 1961 cm−1 are chloropropadiene and allene. Additional experiments are planned to study the formation of irradiation products, particularly in the IR, without frequency-limiting windows on the cells.
Regardless of the molecular species responsible for the feature around 1961 cm−1, it is clear that the chemical evolution processes that occurred in the Humid cell are distinct from those of either the Inert or Atmosphere cells. In the Humid cell, it appears that the phenyl aromatic rings responsible for the aromatic bands at 3024 and 3055 cm−1 were completely destroyed. In contrast, the aromatic phenyl bands persist in the Atmosphere and Inert cells, albeit with measurable redshifts. In addition, the chemical processes that occurred in the Atmosphere and Inert cells appear to be similar, implying that the CO2 and O2 in the Atmosphere cells did not play a measurable role in the modification of FeTPPCl.
5. Summary and Conclusions
The SEVO experiment on board O/OREOS has successfully measured and telemetered time-evolved spectra of FeTPPCl samples exposed to solar irradiation and space conditions in LEO. To aid in the interpretation of these data, a laboratory experiment was developed for exposure of nominally identical FeTPPCl samples to a high-fidelity (over the 122–1000 nm range) solar simulator. All the irradiated thin-film FeTPPCl samples, in contact with astrobiologically relevant “microenvironments,” showed degradation in response to irradiation, both in space and in the lab. Dark control samples remained unchanged.
It was found that FeTPPCl, a member of the porphyrin class of organic molecules, was more readily photodegraded in our Humid microenvironment (0.8–2.3% RH) than in the drier (low ppm H2O levels) Inert and Atmosphere microenvironments (argon and CO2:CO:O2 headspace gases, respectively). While the FeTPPCl thin-film samples degraded in all the microenvironment cells, the photodegradation rate was more rapid in the Humid cell, by a factor of ∼2–3 in the flight experiment and a factor of ∼5–10 in the laboratory irradiation experiment, than for the corresponding “dry” samples. The observed degradation of UV/vis features in the Humid sample cells is attributed to an initial loss of aromatic phenyl groups, followed by destruction of the porphyrin ring itself, based on our IR studies of the samples, which indicated the loss of aromatic C–H stretching features at 3024 and 3055 cm−1. These findings imply that wet, NO-rich environments, in combination with UV irradiation, encourage more efficient degradation of porphyrin-class organics. This might indicate that dry planetary surfaces with an absence of nitric oxide and/or with atmospheric screening of UV radiation could allow porphyrin structures to be preserved over longer timescales than otherwise similar wet environments.
These findings complement the Mattioda et al. (2012) study, which reported results for a large polycyclic aromatic hydrocarbon (PAH) and a quinone. The PAH was also found to be measurably less stable under irradiation in a humid environment. The chemical pathway for degradation of the PAH likely involves OH· radicals produced from H2O vapor interacting with and destroying these molecules. The detection of NO in the Humid sample cells also introduces the possibility that the PAH destruction was influenced by this species. However, as is the case with FeTPPCl, the PAHs were only degraded in the UV-exposed samples. The presence of nitric oxide appears to have had no destructive effect on the PAH samples in the absence of irradiation.
Observed degradation in the Inert and Atmosphere cells is correlated with the growth of a new band at 1961 cm−1. Pending future study, we hypothesize that this band is associated with a photodegradation product, most likely allene or chloropropadiene. We further conclude that the growth of this band is the result of destruction of the porphyrin ring (i.e., probably not related to the attached phenyl groups on FeTPPCl), based on correlations with band loss in the UV/vis.
While the laboratory solar simulator results reported in this paper are clearly helpful when interpreting our analogous spaceflight results, the discrepancies noted in this paper also make it clear that greater fidelity in matching temporal variations in temperature and photon exposure will be required if laboratory kinetic data are to match or even predict those of spaceflight samples. Due to the demonstrable differences that result from imperfect simulations, it remains difficult to compare results between different laboratories and different experiments.
The results of the reported experiments also show how different microenvironments (e.g., the presence of a few % RH or the presence of oxides of nitrogen) strongly influence the complex pattern of photodegradation of a metalloporphyrin. Given the importance of porphyrins as potential biomarkers, it is essential to understand their behavior under relevant astrobiological conditions. In the case of FeTPPCl thin films in contact with a humid headspace gas containing NO, it appears that aromatic phenyl side-groups may be the first fragments formed upon degradation of the molecule. However, in dry environments this molecule is quite robust. This suggests that FeTPPCl is a viable biomarker in low-humidity (or totally dry) environments, and given its slow rate of degradation, it may be possible to estimate surface exposure times, if the molecule were to be detected on planetary surfaces and the environmental conditions were well known.
Footnotes
Acknowledgments
The authors would like to thank the NASA Astrobiology Small Payloads program for support, Robert Walker for technical support, Emmett Quigley and Ryan Walker of the NASA Ames Airborne Instrument Development Lab for their work in producing the hardware necessary for the production of the sample cells and the glove box experiment. We thank Dr. El-Nahass at Ain Shams University for useful discussion regarding the nature of our porphyrin spectra. The authors also thank the NASA Astrobiology Institute, the NASA Postdoctoral Program (NPP) administered by Oak Ridge Associated Universities through a contract with NASA, and the Exobiology Program for additional support (proposal number 09-EXOB09-1030). We also thank Cindy Taylor for assistance with deposition and characterization of the thin films, and members of the NASA Ames Small Spacecraft Payloads and Technologies Team. We are also grateful for the efforts of the highly effective student-and-staff O/OREOS mission operations team at Santa Clara University.
Abbreviations
AM0, air mass zero; FeTPPCl, iron(III) tetraphenylporphyrin chloride; FTIR, Fourier transform infrared; FWHM, full width at half maximum; IAU, Integrated Absorbance Units; LEO, low-Earth orbit; NIR, near-infrared; O/OREOS, Organism/Organic Exposure to Orbital Stresses; PAH, polycyclic aromatic hydrocarbon; SEVO, Space Environment Viability of Organics; VUV, vacuum ultraviolet.