
Abstract
Midlatitude ground ice on Mars is of significant scientific interest for understanding the history and evolution of ice stability on Mars and is relevant for human exploration as a possible in situ resource. For both science and exploration, assessing the astrobiological potential of the ice is important in terms of (1) understanding the potential for life on Mars and (2) evaluating the presence of possible biohazards in advance of human exploration. In the present study, we review the evidence for midlatitude ground ice on Mars, discuss the possible explanations for its occurrence, and assess its potential habitability. During the course of study, we systematically analyzed remote-sensing data sets to determine whether a viable landing site exists in the northern midlatitudes to enable a robotic mission that conducts in situ characterization and searches for evidence of life in the ice. We classified each site according to (1) presence of polygons as a proxy for subsurface ice, (2) presence and abundance of rough topographic obstacles (e.g., large cracks, cliffs, uneven topography), (3) rock density, (4) presence and abundance of large boulders, and (5) presence of craters. We found that a suitable landing site exists within Amazonis Planitia near ground ice that was recently excavated by a meteorite impact. Key Words: Mars—Missions—Habitability—Landing sites—Ice. Astrobiology 14, 102–118.
1. Introduction
T
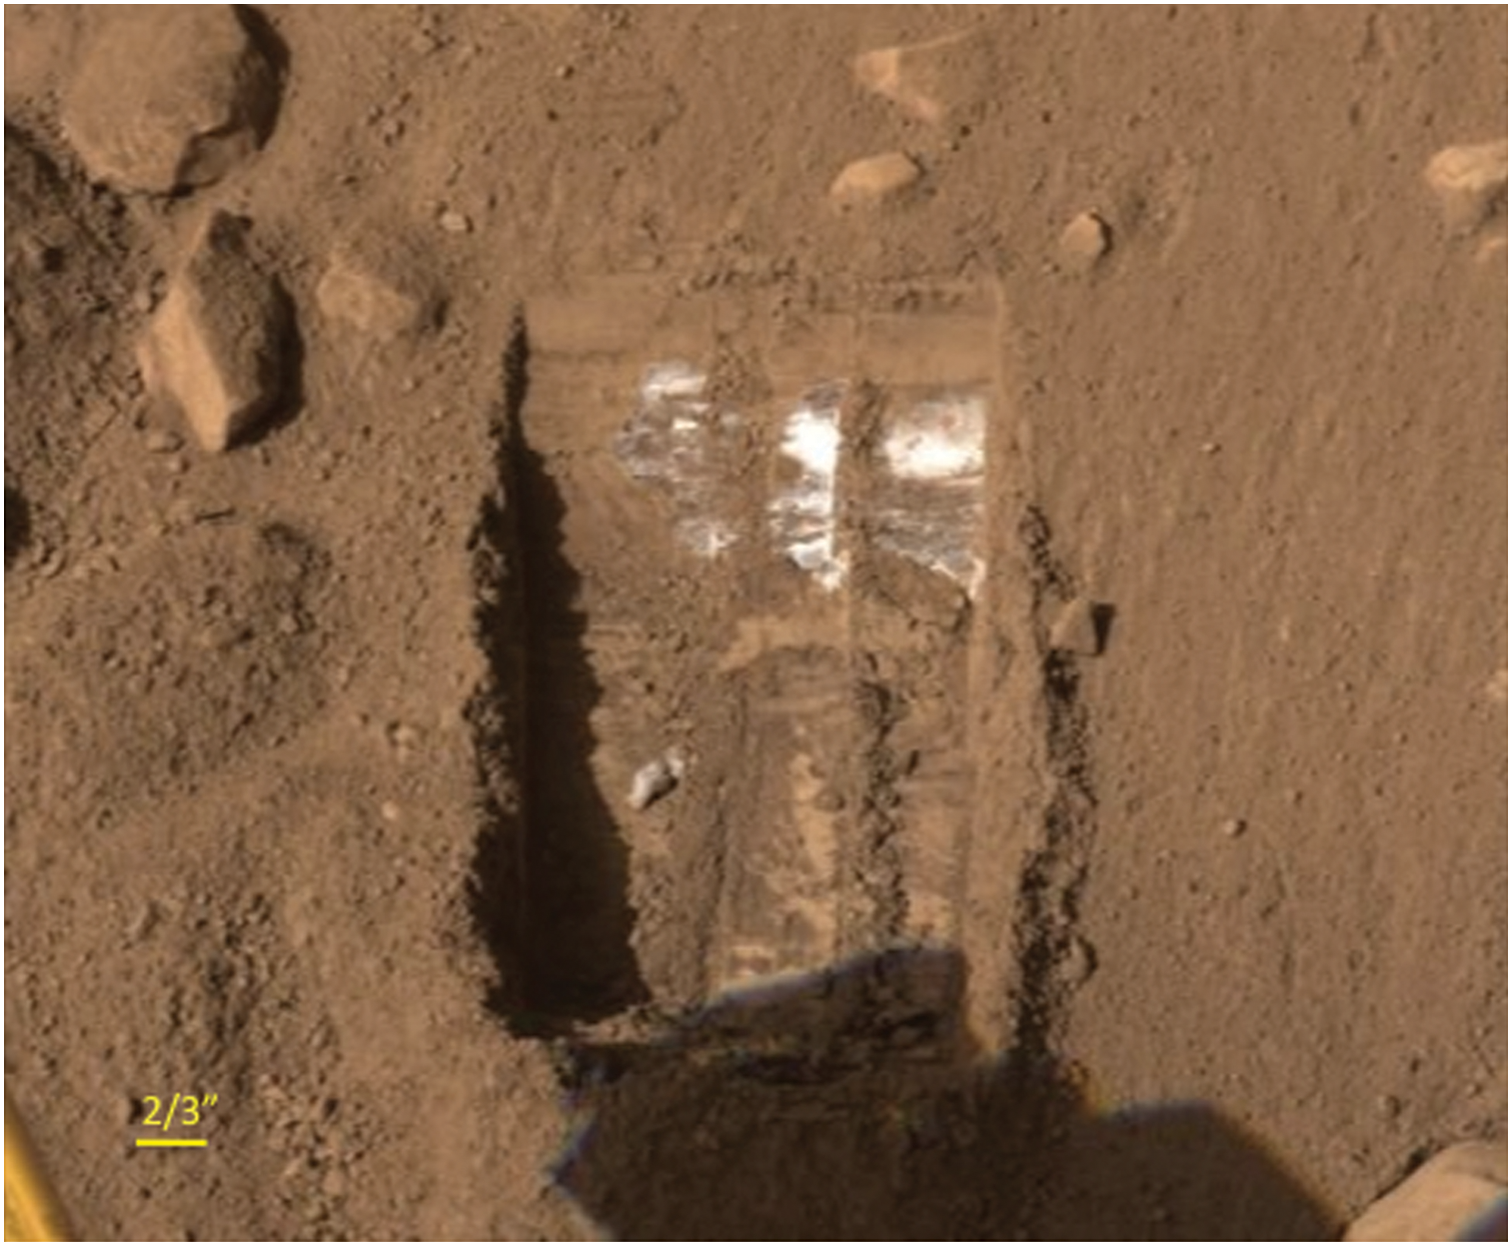
Excavated ground ice at the Mars Phoenix lander site dug by the Robotic Arm on NASA's Phoenix Mars lander. The trench is 22 cm (8.7 in.) wide and 35 cm (13.8 in.) long. Color images available online at
Sites of midlatitude ground ice are of great interest for both science and human exploration. Ice-rich permafrost is an excellent repository for organic molecular biomarkers (Gilichinsky et al., 1993, 2002; Smith and McKay, 2005) that could be detected on Mars by in situ robotic investigations (Davila et al., 2010; Schulze-Makuch et al., 2012; McKay et al., 2013). We also seek to understand the physical processes governing the emplacement and persistence of midlatitude ice, which is key to understanding ice evolution and present-day characteristics. In addition, the midlatitudes are a viable location for future human exploration (Drake, 2009), and understanding the nature of the ice is important for assessing its potential for in situ resource utilization (ISRU) and for the design of future ISRU systems (MEPAG, 2010; Sanders and Larson, 2010). From a planetary protection perspective, the possible presence of biological remains, or even viable cells, in the ground ice must be assessed before human exploration in order to mitigate cross contamination and ensure the safety of human explorers in terms of possible biohazards (McKay and Davis, 1989; Rummel, 2001; National Research Council, 2002; Race et al., 2003; Rummel and Billings, 2004; MEPAG, 2010).
Future robotic precursor missions to study midlatitude ice on Mars require landing at a site where ground ice is known to be present and readily accessible. Realistic mission capabilities within the next decade would enable access to ground ice that is within the top 1–2 m of the regolith (McKay et al., 2013). To maximize the probability of finding indicators of life, missions would have to target locations where the ground ice experienced a melt phase within the geologically recent past, since life as we know it requires liquid water to survive (Jakosky, 1999; Franks, 2000; Chyba and Phillips, 2001; Ward and Brownlee, 2003), and solar and cosmic radiation will kill any life that is near the surface and unable to perform metabolic repair in geologically short timescales (Dartnell et al., 2007). We note that liquid water may also occur as thin layers on the surfaces of solids or within cavities in porous ice (Jakosky et al., 2003); however, this work focused on more widespread near-surface ice deposits as both enabling for ISRU and for preserving evidence of biological activity.
Ground ice at the midlatitudes of Mars is thus of special relevance in terms of its origin, evolution, and potential habitability as well as its possible use as a resource for humans. In this paper, we first review the evidence for midlatitude ground ice on Mars and the possible explanations for its occurrence. We then consider the potential for this ground ice to be a recent habitat for life and assess the adequacy of different regions containing near-surface ground ice as landing sites for future missions to Mars.
2. Midlatitude Ground Ice on Mars
Models of ground ice stability indicate that ground ice on Mars should be annually stable poleward of latitudes ranging from 30–50° when considering a typical value of 10 precipitable microns of water in the atmosphere (Leighton and Murray, 1966; Farmer and Doms, 1979; Fanale et al., 1986; Paige, 1992; Mellon and Jakosky, 1993, 1995). These models generally assume a regolith with homogeneous thermal and/or diffusive properties, include only latitudinal variations in insolation, and assume the depth to ground ice is driven by vapor exchange with the atmosphere.
Subsequent ice stability modeling by Mellon et al. (2004) built upon these previous efforts and considered additional parameters affecting the ice table depth. The Mellon et al. (2004) model includes the effects of thermal conductivity when ground ice is present, uses new global-scale observations of thermal inertia and albedo, and includes the effects of elevation on near-surface atmospheric water abundance. Their findings support the notion that the stability and expected depth to ground ice depends on the exchange of water vapor by diffusion between the subsurface and the atmosphere (Mellon et al., 2004). The parameter that determines stability is the atmospheric frost point, which depends on temperature and water content (Fanale et al., 1986; Mellon and Jakosky, 1993, 1995). In general, the ice table is expected at a depth where the annual mean of the pore space vapor density in equilibrium with respect to the ground ice is equal to the annual mean of the atmospheric water vapor density (Mellon et al., 2004).
The predicted presence of ground ice at midlatitudes to high latitudes was confirmed by the Gamma Ray Spectrometer (GRS) aboard the Mars Odyssey spacecraft (Boynton et al., 2002; Feldman et al., 2002; Mitrofanov et al., 2002). Mellon et al. (2004) attempted to correlate their model results with GRS observations of ground ice distribution. This study concluded that the best match between GRS-measured ice distribution and the ground ice stability modeling occurred with 10–20 precipitable microns column abundance of atmospheric water, which is higher than the typical current value of ∼10 precipitable microns. In addition, Carrozzo et al. (2009) and Vincendon et al. (2010) suggested that the presence of a near-surface ice table at midlatitudes may help explain OMEGA (Observatoire pour la Minéralogie, l'Eau, les Glaces et l'Activité) spectral observations and global circulation model predictions of water vapor and surface ice/frost on Mars.
Definitive evidence for subsurface ice at midlatitudes comes from ice uncovered by meteorite impacts. Recent impacts have exposed subsurface water ice within the upper meter and often within a few tens of centimeters at midlatitudes in Utopia, Arcadia, and Amazonis Planitia (Byrne et al., 2009). Images from the High Resolution Imaging Science Experiment (HiRISE) reveal bright material that then faded over time as the ice sublimated away, and spectral measurements by the Compact Reconnaissance Imaging Spectrometer for Mars (CRISM) confirm that the bright material was water ice (Byrne et al., 2009; Dundas and Byrne, 2010).
The origin of the midlatitude ice, however, remains unclear. Initial modeling postulated that this ground ice was in vapor diffusion equilibrium with the atmosphere, which is essentially the same process that explains the presence of martian ground ice at higher latitudes poleward of ∼60°N (Leighton and Murray, 1966; Farmer and Doms, 1979; Fanale et al., 1986; Paige, 1992; Mellon and Jakosky, 1993, 1995). However, to explain the subsurface ice observed at ∼45°N by vapor exchange with the atmosphere, Byrne et al. (2009) had to double the atmospheric water content compared with present-day atmospheric water abundances: “results of models using 20 precipitable microns of atmospheric water vapor agree very well with our data (whereas ground ice at these sites is not expected with 10 precipitable microns).” The conclusion that the midlatitude ice can only be explained via vapor diffusion with the atmosphere at 20 precipitable microns is consistent with the Mellon et al. (2004) modeling that required 10–20 precipitable microns to match the GRS observations.
Dundas and Byrne (2010) modeled the sublimation of the dust and ice exposed in the fresh craters reported by Byrne et al. (2009) and concluded that over a millimeter of sublimation occurred in the period during which the ice was observed to fade. They proposed that the upper layer of the ground ice was virtually pure ice. A similar conclusion, that the subsurface ice was virtually pure ice, was reached by Kossacki et al. (2011).
Surface geomorphological features suggest that the ground ice between 30°N and 60°N experiences different processes than the ground ice north of 60°N. Balme et al. (2013) considered several scenarios for the placement and processing of ground ice between 30°N and 60°N and found that all scenarios require at least some liquid water to explain the occurrence of “countless gullies on the inner and outer crater walls and the small fluvial valleys downslope of the lobate (putative debris-covered glacier) features interpreted as permafrost-related landforms.”
In contrast to vapor diffusive equilibrium models, an alternative hypothesis for the presence of the midlatitude ground ice is that it is a relic from previous climate conditions. Schon and Head (2011) and Schaefer et al. (2011) suggested that the ground ice is a relic surficial mantling deposit composed of ice and dust that covered most of Mars at high latitudes and midlatitudes. The ice mantle is proposed to have been deposited during past periods of high obliquity over timescales <10 million years. These authors interpret the melting of this relic ice mantle in the current “interglacial” climate period (∼0.4 Ma to the present) as a key process responsible for forming gullies and fluvial features associated with young midlatitude craters.
The vapor equilibrium and the relic ground ice models have different implications in terms of the astrobiology potential of the ice. If the ground ice reflects vapor processes, as was concluded for the ground ice at the Mars Phoenix landing site (Mellon et al., 2009), then the production of liquid fractions in this ice may not be occurring at the present time, and liquid water may be present only at higher obliquities when ice temperatures become warm enough for melting. Only under the high-obliquity scenario does that ice become habitable, as suggested for the Phoenix site (Stoker et al., 2010; McKay et al., 2013). However, if the ground ice is relic from a previous climate regime and is out of equilibrium with the present climate, and if the fluvial features associated with midlatitude impacts are due to the melting of this relic ice, then liquid water activity may be occurring under present conditions, which would imply, in contrast with the Phoenix site, habitability at the present epoch. Hence, the possibility of indigenous life (extinct or dormant) within the midlatitude ground ice of Mars is real, and the absence of life needs to be thoroughly established before the ice can be used as a resource for humans (McKay et al., 2013). Alternatively, if biologically contaminated water is discovered on Mars, sterilization of the water may be required prior to human use, and planetary protection concerns must be directly addressed.
3. Enable Successful Landing and Surface Operations
Any mission to conduct in situ studies of the midlatitude ground ice must land in a location that is safe and will allow successful entry, descent, landing (EDL) and operation of the spacecraft on the martian surface. Previous NASA missions have successfully landed on Mars (Viking, Pathfinder, Phoenix, Mars Exploration Rovers, and Curiosity); thus the landing site safety criteria are well understood for existing spacecraft (Golombek et al., 2003a, 2003b, 2012; Grant et al., 2004; Arvidson et al., 2008; Kirk et al., 2008). Although new landing systems may enable landings at a wider variety of locations on Mars, given increased spacecraft capabilities and technology development, here we assume a conservative approach and base our analysis on previous Mars lander constraints. For example, the spacecraft is required to land at an elevation of less than −3.5 km for sufficient atmosphere to slow the lander with relatively low wind velocities. Rock and slope distributions must be similar to or more benign than the Viking Lander 2 (VL2) site to help ensure a safe landing spot will exist at touchdown (Arvidson et al., 2008). In addition, a landing site relatively free of rocks and boulders with little topographic variation is (1) ideal for subsurface operations (such as drilling, coring, or augering) to avoid near-surface obstacles and (2) will help ensure a relatively homogeneous ice table distribution, since heterogeneities in the martian surface result in undulations in ice table depth (Sizemore and Mellon, 2006).
4. Methodology
The region of interest (ROI) examined in this study ranged from 43–60°N and 130–190°E, focusing on Utopia, Arcadia, and Amazonis Planitia. This ROI encompasses the excavated icy craters identified by Byrne et al. (2009) and is consistent with the GRS hydrogen maps indicative of subsurface ice; furthermore, morphological and numerical modeling results suggest the presence of near-surface ground ice (Mellon and Jakosky, 1993, 1995; Mellon, 1997; Boynton et al., 2002; Mellon et al., 2004). This region also includes the successful landing site of VL2, which thereby demonstrates that robotic landings are possible.
We use the VL2 orbital and lander data to further understand the landing site characteristics within our ROI. VL2 landed at 48°N and 135°E (Mutch et al., 1977). Images of this site are available both from the ground and from orbit, which can be cross-correlated to ground truth the remote sensing data (Fig. 2). The VL2 landing site is characterized by relatively flat ground as part of the vast plains of the northern hemisphere. Near the landing site, the maximum apparent slopes are 1–2 degrees with few local craters. Rocks ranging from sizes of a few centimeters to a few meters evenly cover the terrain. Trough features are present at the landing site and are most likely the manifestation of thermal contraction polygons from subsurface ice (Masursky and Crabill, 1976; Squyres et al., 1992; Mellon, 1997; Levy et al., 2009). Since lander images have been compared with images from orbit, rock densities can be approximated on the ground by comparing the rock density seen from orbit with that of the VL2 site. We use the images from orbit and from the ground as a baseline for determining optimal landing sites.

Image taken by the Mars Viking 2 lander (VL2) of the VL2 landscape. Note the lander footpad is in the bottom right of the image. Color images available online at
Surface characteristics of the ROI were assessed by using high-resolution imagery from Mars orbital assets. The HiRISE camera aboard the Mars Reconnaissance Orbiter collects the meter-scale resolution imagery capable of 25.5–130 cm/pixel resolution (McEwen et al., 2007). The HiRISE instrument consists of a 50 cm aperture telescope, a focal plane subsystem that contains 14 charge-coupled device detectors (CCDs) that are 2048 pixels wide and 128 pixels high, and three color filters (red, blue-green, and near infrared). The swath widths of the broad red spectral band are 6 km, which is larger than both the blue-green and near-infrared bands, which can image the central 20% of the swath with additional CCDs (McEwen et al., 2007). For this reason, red spectral band images were analyzed in our study instead of the other spectral bands.
There are over 300 HiRISE images within the ROI. Many of the HiRISE images overlap, and most images are in pairs of color and red images of the same location. One HiRISE image per location is sufficient for our purposes of characterizing the surface morphology, so the HiRISE image with the largest apparent coverage of the ground was selected for our analysis. A total of 106 red HiRISE images that cover unique areas of the martian surface were used for this study.
To compare the different HiRISE images of different locations with the ROI, we developed a ranking system to quantitatively rank sites based on the presence of visible landing dangers and evidence of subsurface ice. Due to the large geographic area covered by each HiRISE image and the resultant variability in terrain, each HiRISE image was divided into four sections to completely rank the entire image in a manageable manner (Fig. 3).
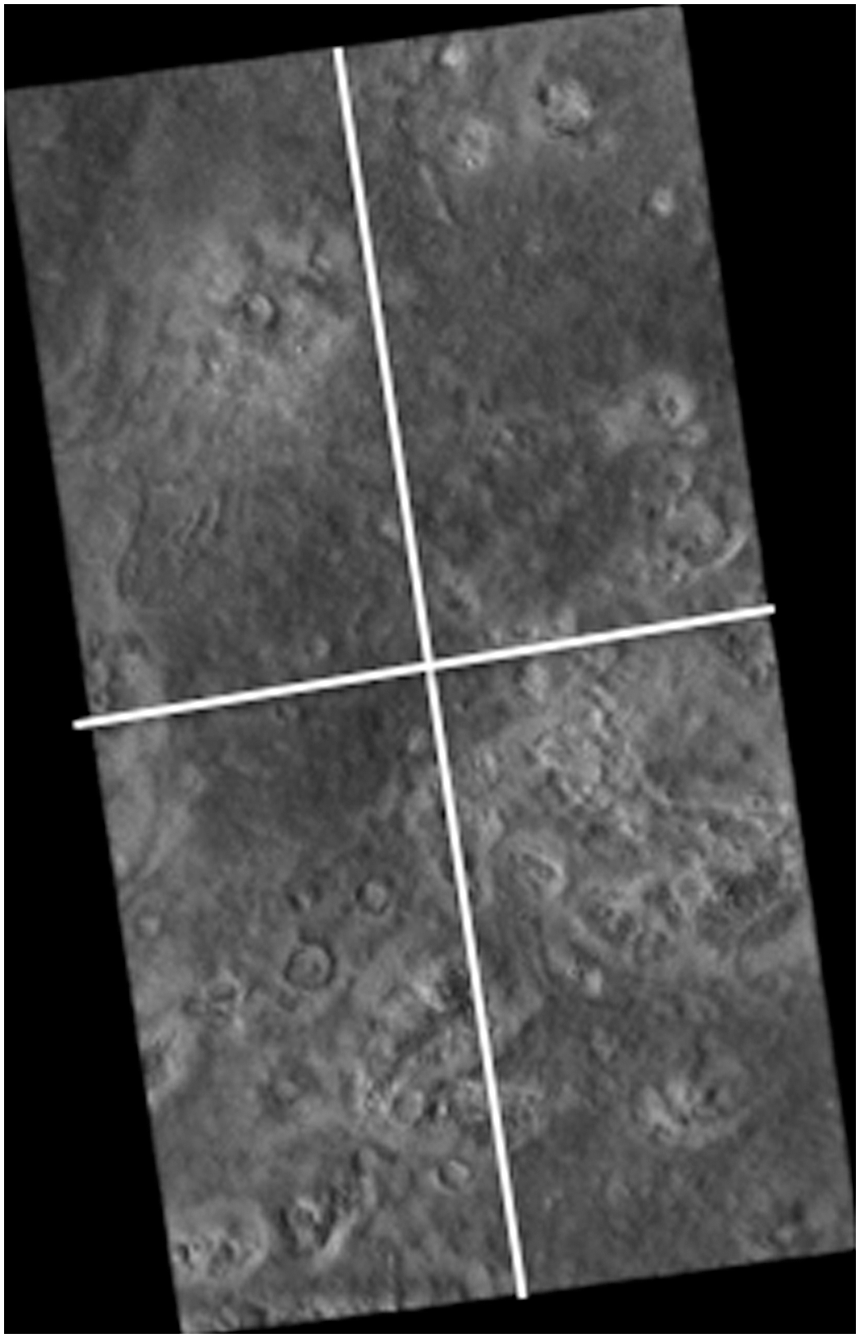
HiRISE image PSP_001501_2280 showing how each HiRISE image was divided into quadrants for landing site criteria analysis. This HiRISE image includes the VL2 landing site.
Each of the four sections of each HiRISE image was rated individually in comparison with the VL2 site. We devised the following categories to assess the science and engineering aspects of each site: polygonal ground, rough topography, boulders, craters, and rock density. Polygonal ground is an important proxy for the presence of subsurface ice (Lachenbruch, 1962; Pewe, 1974). The new impact craters that exposed subsurface ice in this region (Byrne et al., 2009) provide direct evidence for the presence of ice at those locations, while the presence of patterned ground (similar to that found at the five impact sites) allows us to infer the presence of ice elsewhere in the same ROI (Lachenbruch, 1962; Pewe, 1974; Mellon, 1997). Rough topography, boulders, and craters are landing hazards that could be detrimental to the EDL of the spacecraft and should be avoided where possible. Minimal rock density is also preferred to minimize the risk of landing hazards. An optimal landing site would therefore have the following characteristics: ubiquitous defined polygons, minimal rough topography, minimal boulders, minimal large craters, few to no small craters, a minimal rock density, and if possible a location closest to a site of recently exposed water ice.
4.1. Assessment categories
To search for sites that may satisfy the above-described landing site criteria, we assessed each category individually and then conducted a collective analysis of all the data to determine the location (or locations) where the most parameters are optimized to determine an optimal landing site (or sites). Each of these assessment categories is now described in further detail. We note that benign winds are also a requirement for Phoenix lander EDL. Since atmospheric conditions have been monitored at the VL2 site on Mars (Hess et al., 1977; Sutton et al., 1978), winds are considered benign enough for Phoenix EDL within our ROI and are not considered further in this work.
4.1.1. Polygons
Polygonal ground with polygons typically several meters or larger can easily be identified in HiRISE images. The presence of polygons indicates a high likelihood of subsurface ice (Lachenbruch, 1962; Pewe, 1974; Mellon, 1997). An optimal landing site would have clearly defined polygons present throughout the image. In this study, polygons were ranked by using two criteria: presence and definition. Polygons are ranked based on presence where 0 indicates that polygonal ground is not present, 1 indicates that polygonal ground is present but not ubiquitous, and 2 indicates that polygonal ground is ubiquitous. In HiRISE images, it is apparent that polygons come in a range of definitions as well, from very defined deeply cracked polygons to less obvious, shallower polygons. We track polygon definition as a function of location since more defined polygonal ground typically indicates more active polygon activity and thus recent ice. Polygon definition is ranked 0 if polygons are not present, 1 if the polygons are defined, 2 if there is a mix of defined and undefined polygons within the section, and 3 if the section consists of undefined polygons. Figure 4 shows examples of the polygon rating system.
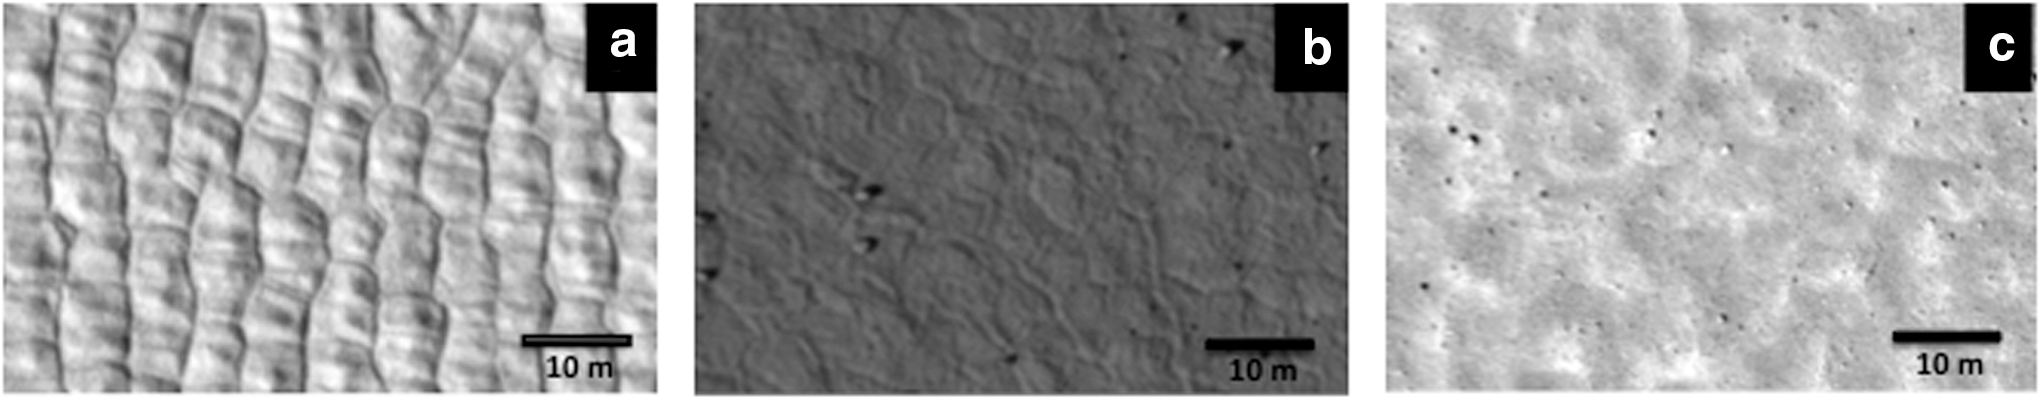
Representative images showing the landing site analysis criteria for polygon definition. Images are at the same scale. (
4.1.2. Topography
To land safely and operate the mission successfully, uneven topography and sharp slopes should be avoided. Therefore, we catalog the presence of large slopes, uplift, cracks, cliffs, and any other rough topographic features. The presence of rough topography was rated based on the amount of rough topography within each HiRISE section, where 0 indicates no rough topography, 1 indicates that some of the section has rough topography but not over the majority of the section, and 2 indicates that rough topography is ubiquitous. Figure 5 shows examples of the topography rating system.
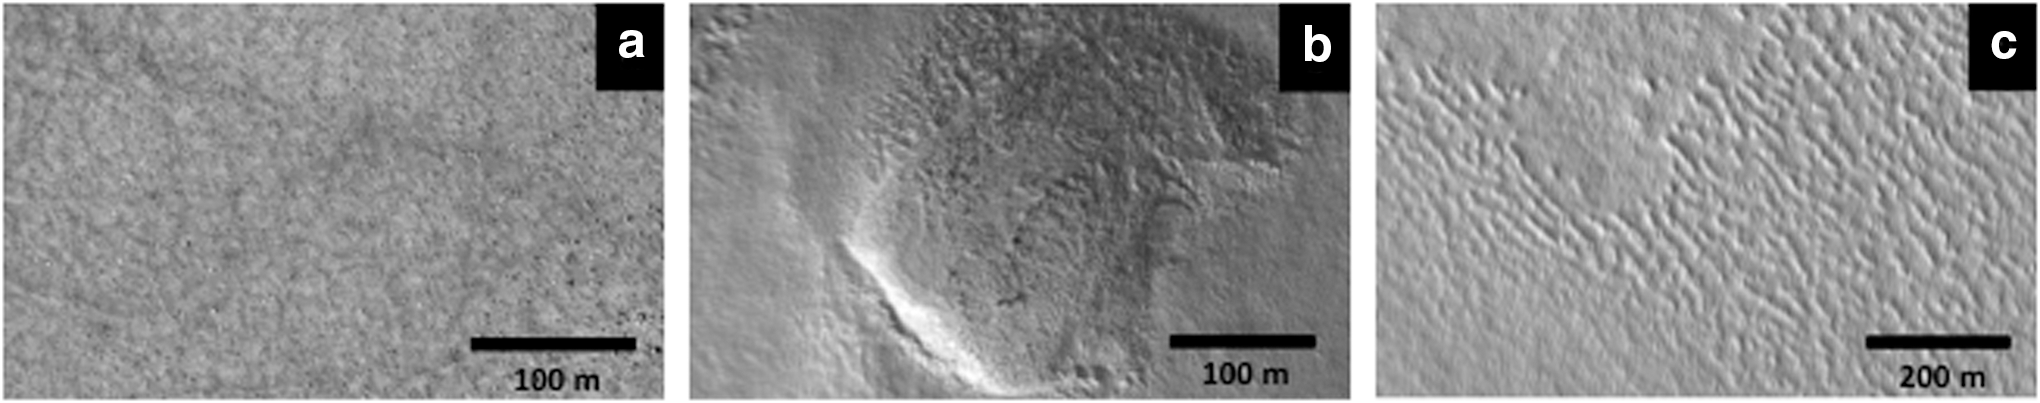
Representative images showing the landing site analysis criteria for terrain roughness. (
4.1.3. Boulders
Boulders or unusually large rocks viewed in HiRISE images are a potential hazard during landing and the drilling mission itself because they may cause uneven slopes or damage the lander during landing, and the drill may not operate correctly if deployed on top of a boulder. Here, we consider boulders as any rock large enough to be discerned in HiRISE imagery, typically making these boulders on the order of one to several meters in diameter. Boulders are rated based on their presence as follows: 0 if no boulders are present, 1 if some boulders are scattered within the region, 2 if there are groups of many boulders present, and 3 if boulders are present everywhere. Figure 6 shows examples of the boulder rating system.
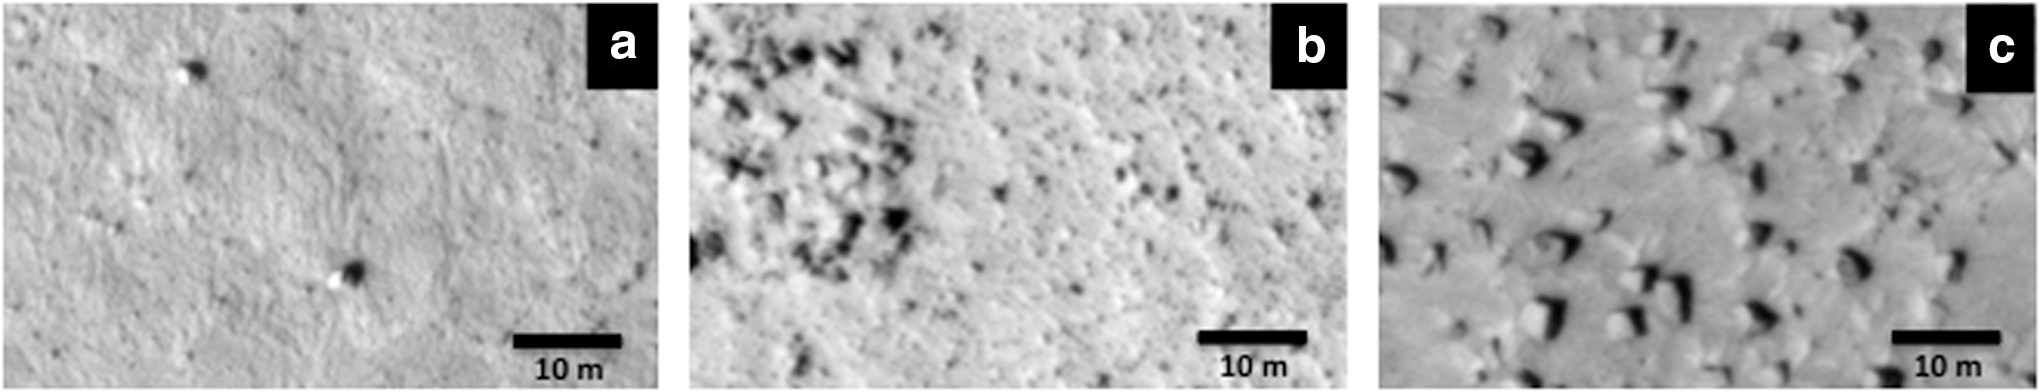
Representative images showing the landing site analysis criteria for boulder distribution. Images are at the same scale. (
4.1.4. Craters
Craters usually have uneven topography and associated boulders, which make them potential landing hazards. Since a large portion of HiRISE images are targeted at large craters, we divided the rating into two groups as follows: “big crater,” meaning one large crater taking up the majority of the HiRISE image, and “small craters,” where smaller craters below the resolution of HiRISE imagery are present. Big craters typically have diameters that are comparable to, or larger than, the width of the HiRISE image and compose the majority of the image. Big craters are rated based on their coverage of the image, where 0 indicates no big craters are present within the section, 1 indicates that there is a big crater present but it only covers a portion of the section being rated, and 2 indicates that a big crater is present and covers the entire section. Small craters are craters that do not take up the majority of the HiRISE image. They are rated by the relative amount of craters present within the section, where 0 means there are no small craters, 1 means there are only 1 or 2 craters, 2 means there are 3–4 craters, and 3 means there are more than 4 craters within the section.
4.1.5. Rock density
Finally, our baseline, the VL2 site, includes a fairly high rock density. An optimal landing site would have the least amount of rocks possible, since rocks may be landing hazards and hazardous to drilling activities. Rock density is therefore very important to our search and is rated in comparison with the VL2 site, where 0 indicates no rocks, 1 indicates there are only a few rocks, 2 indicates there are more than a few rocks but less than the rock density of the VL2 site, 3 indicates that the rock density is similar to that of the VL2 site, 4 indicates there are more rocks than at the VL2 site but it is not incredibly dense, and 5 indicates that the section has the highest rock density. Figure 7 shows examples of the rock density rating system.
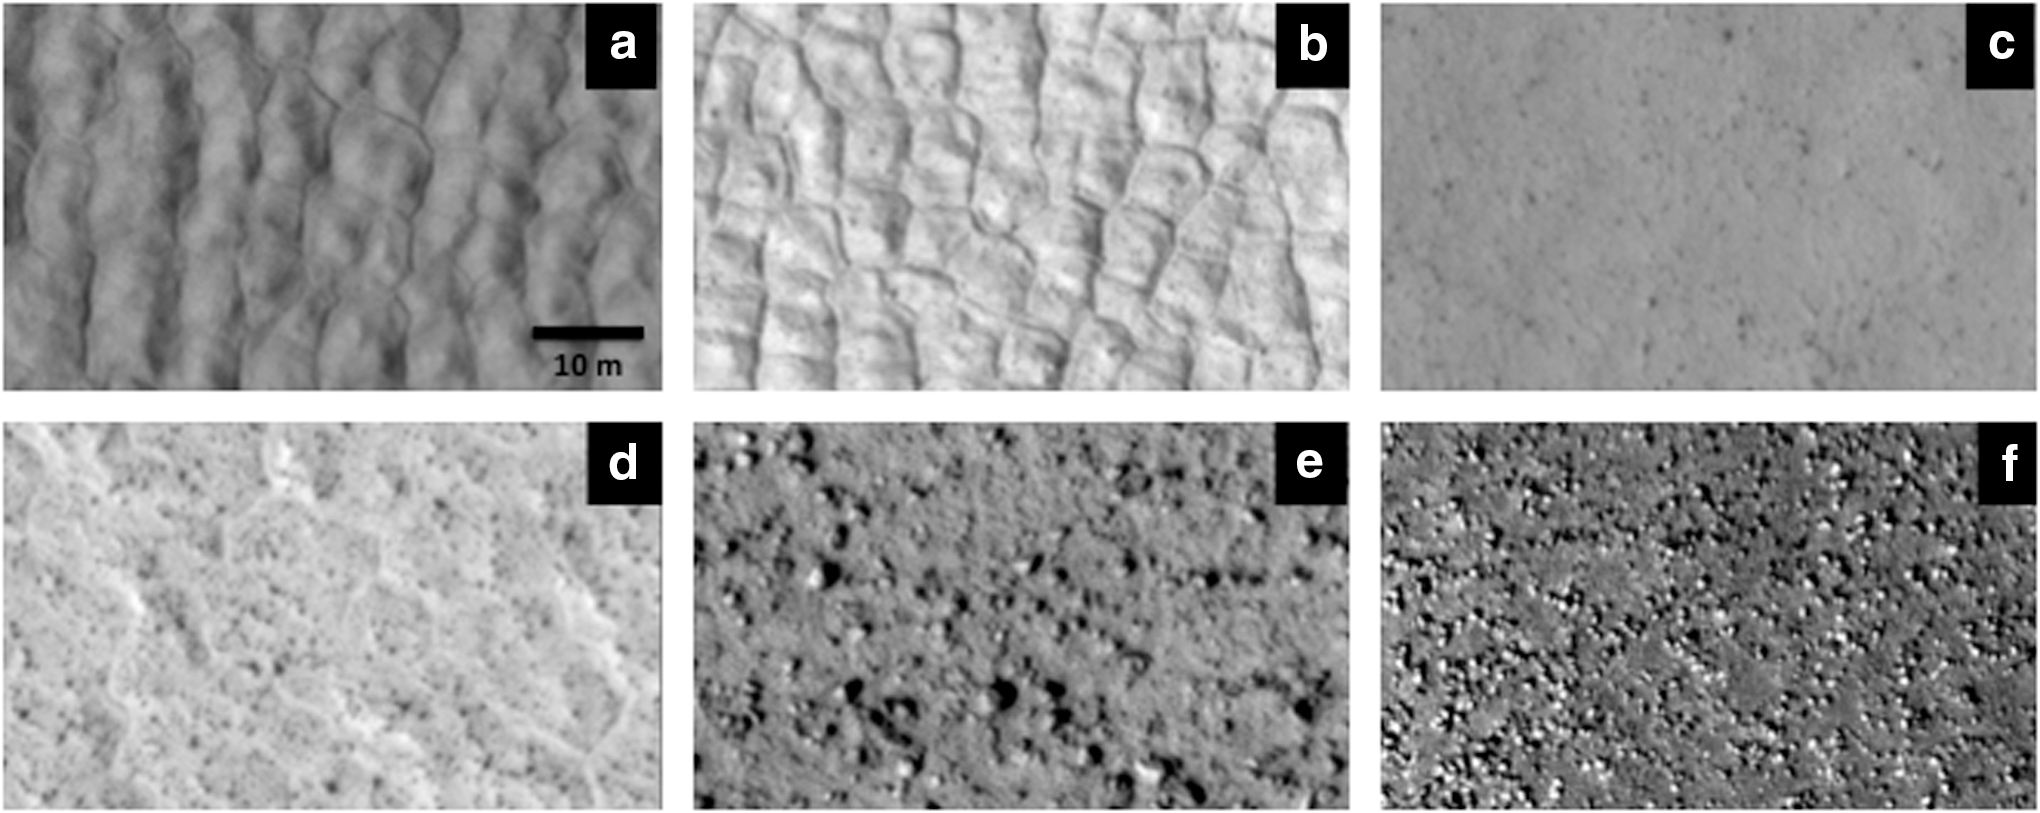
Representative images showing the landing site analysis criteria for rock abundance. Images are at the same scale. (
We access the HiRISE images using the JMARS program (Java Mission-planning and Analysis for Remote Sensing), a geospatial information system developed by Arizona State University (Christensen et al., 2009). In JMARS, all the HiRISE images within our region can be accessed along with the image metadata. The HiRISE images are opened on the IAS viewer, which allows the HiRISE images to be viewed at full resolution. First the image is divided into four even sections to ensure that the entire image is studied in sufficient detail (Fig. 3). Each of these four sections are viewed and ranked individually in each of the assessment categories.
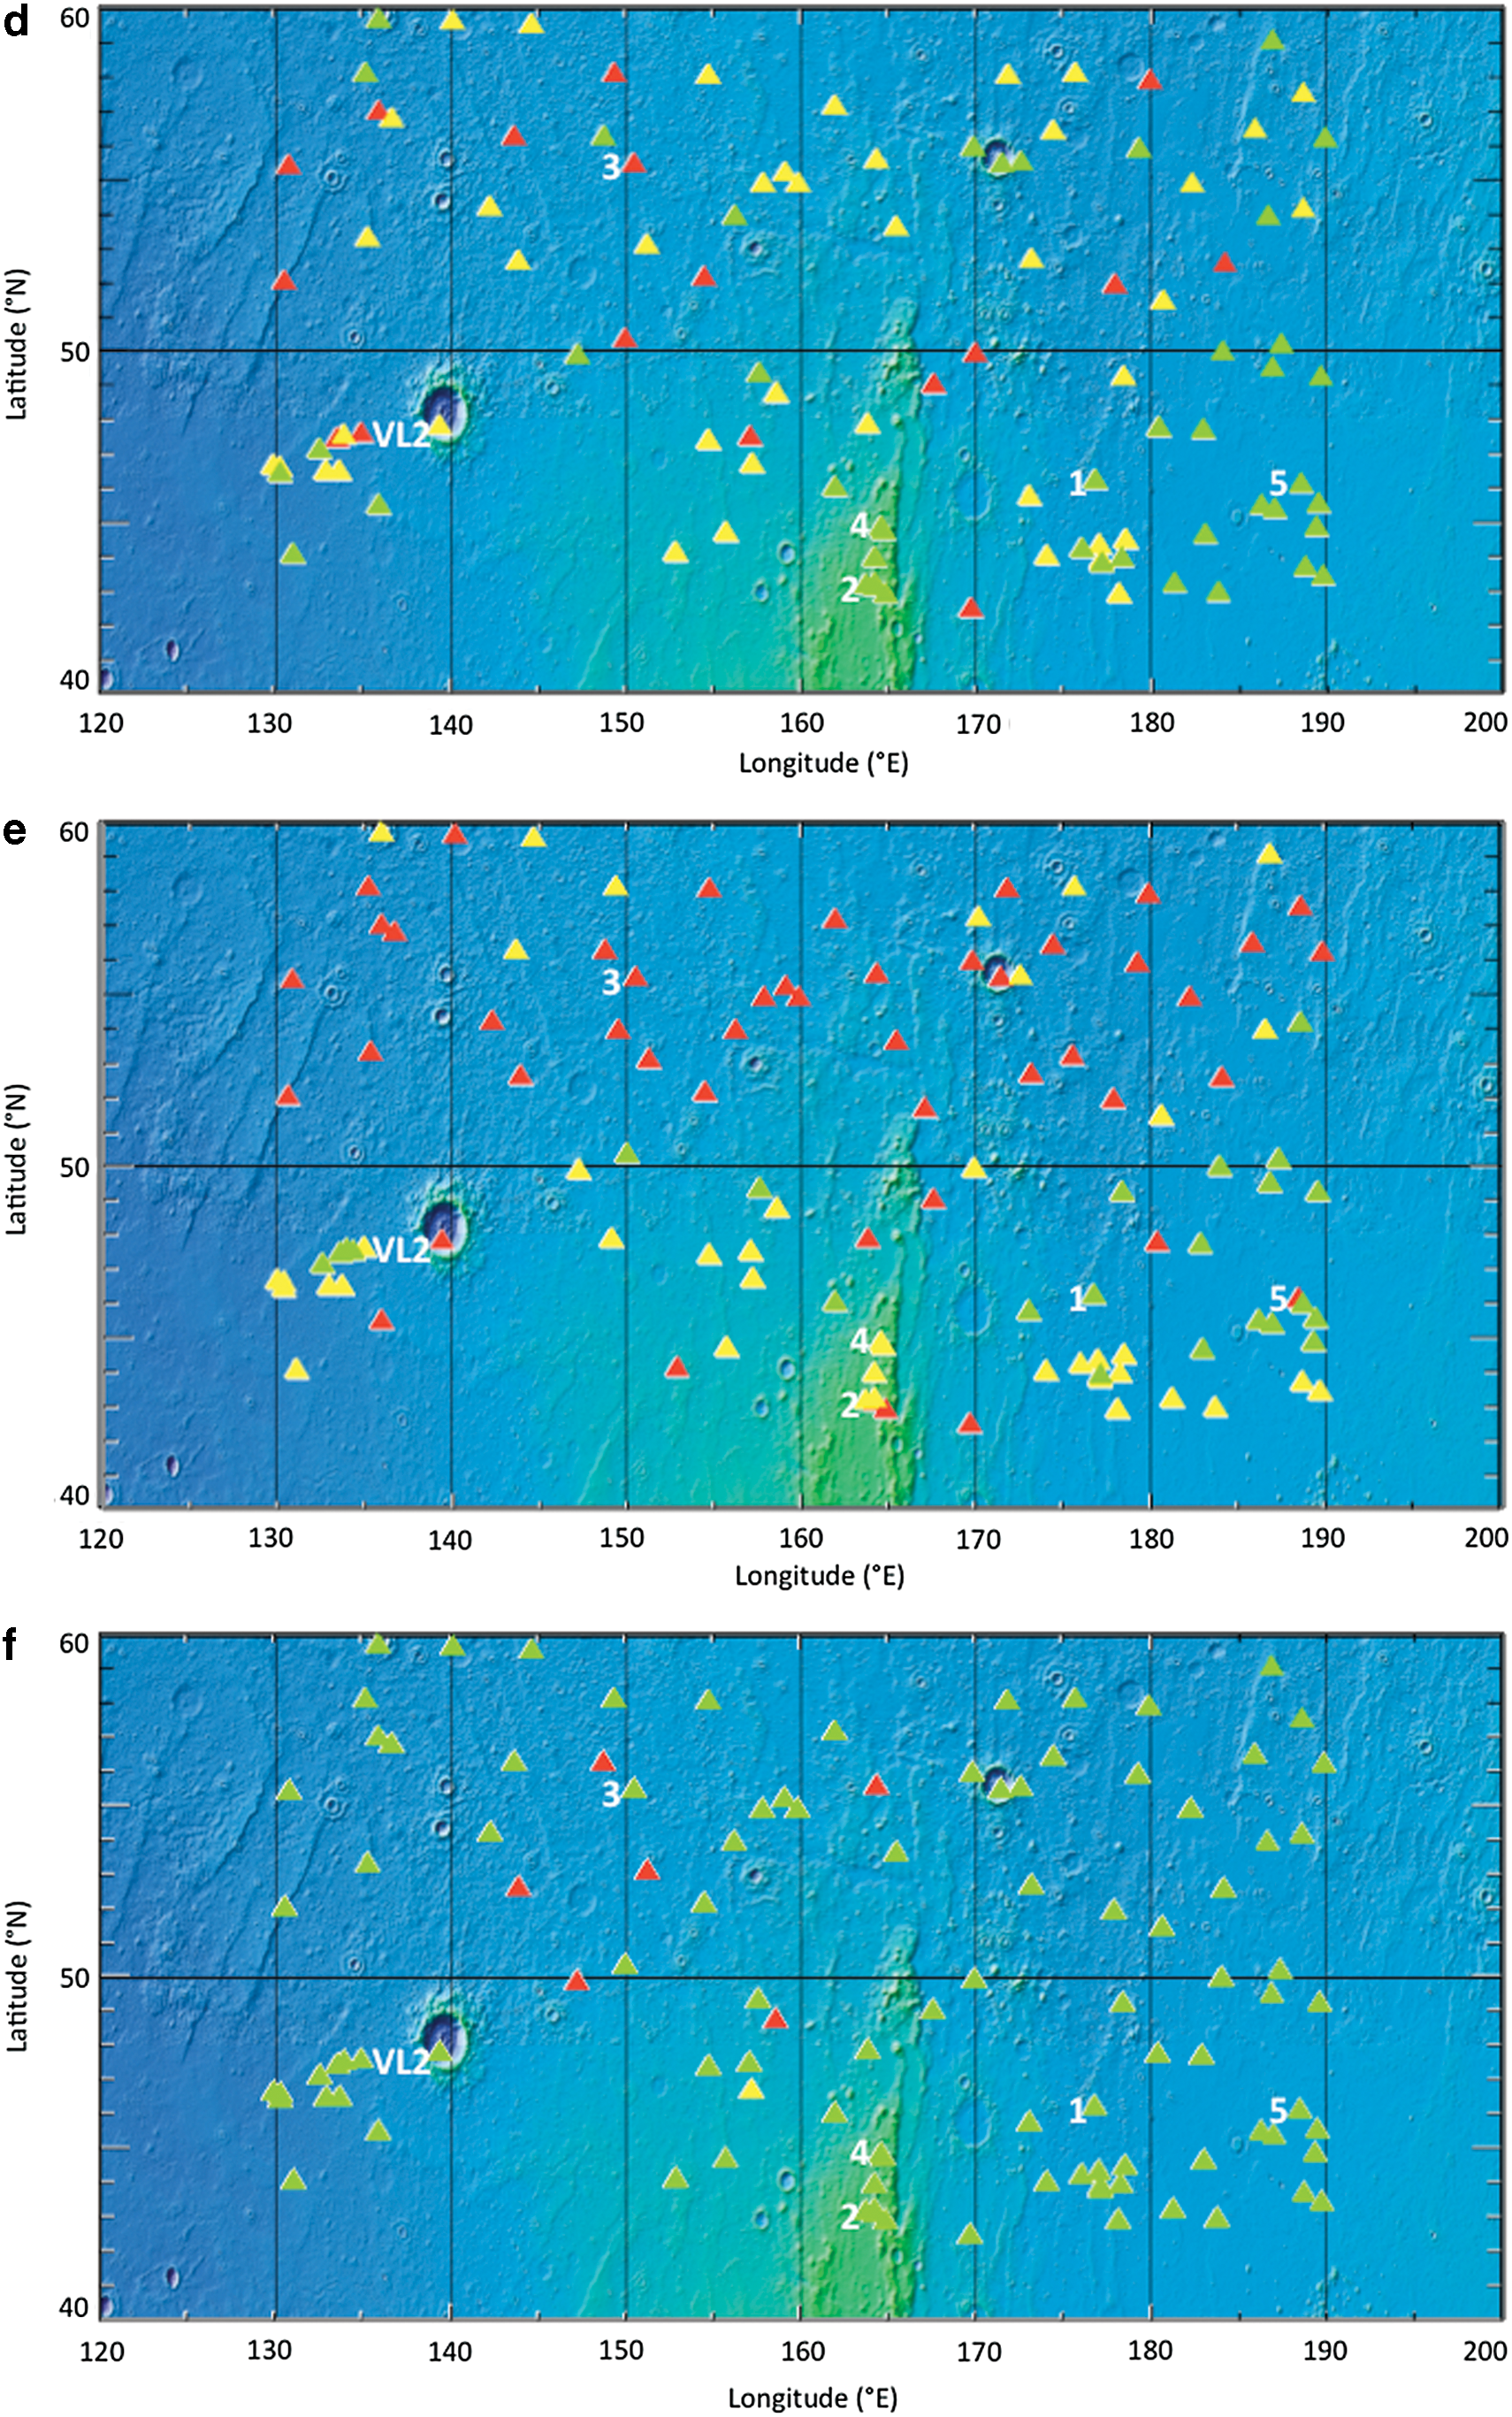
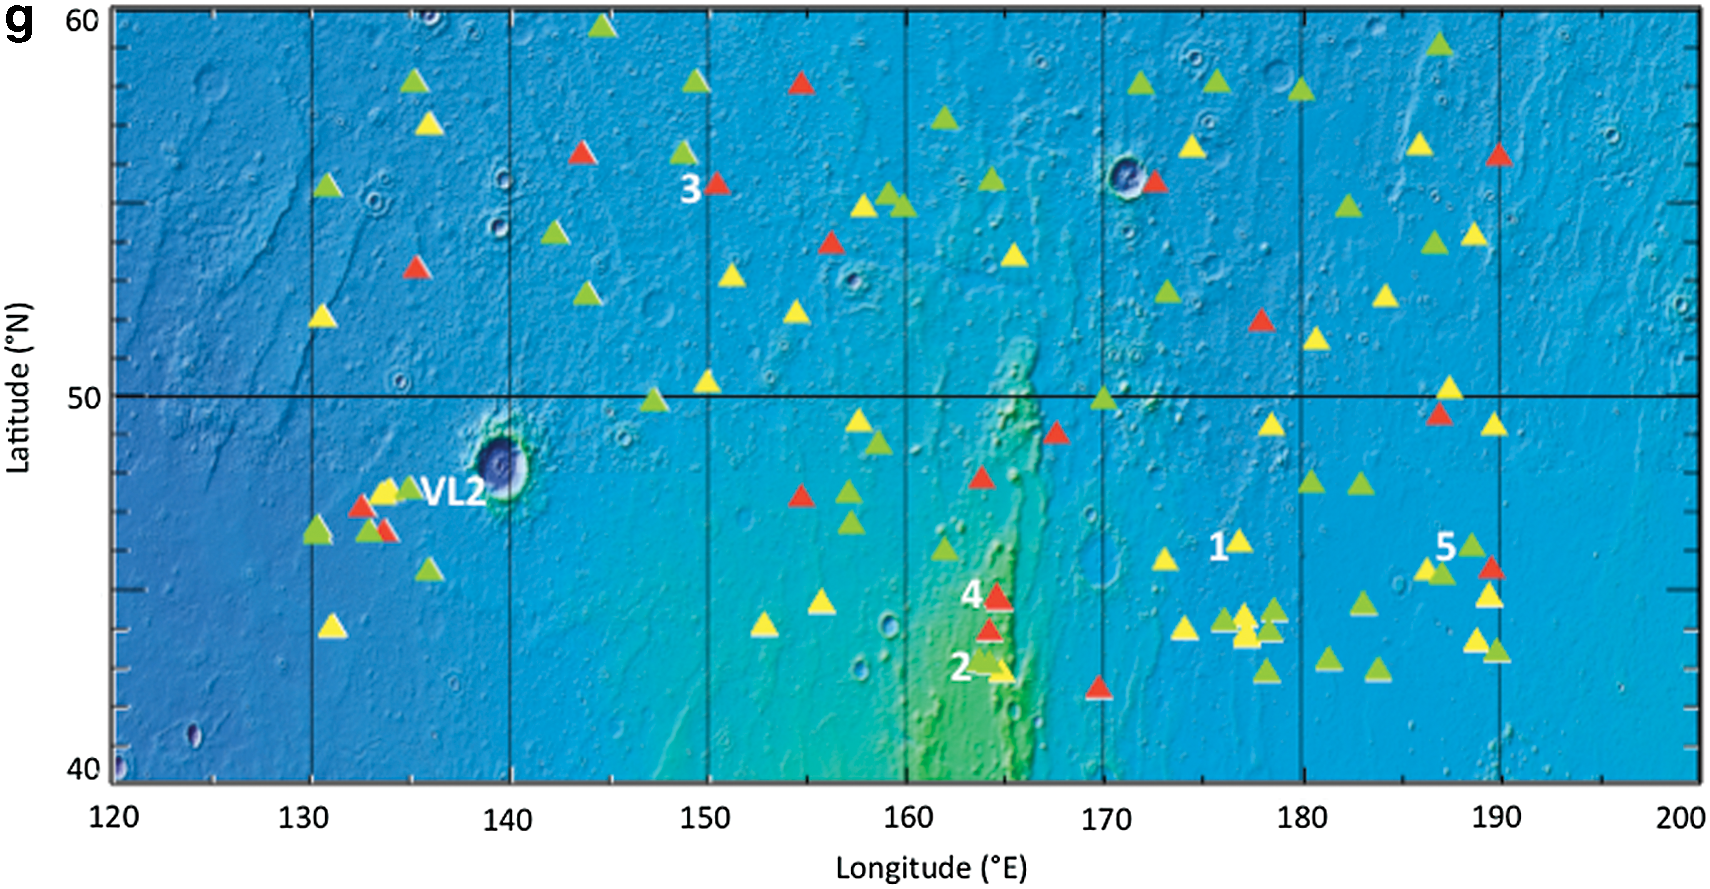
For all the HiRISE images in the ROI, we analyze each image per the procedure described above for each assessment category. Since each HiRISE image is divided into quadrants for ease in image viewing and analysis, we then average the four values for each category for each image. These values are then plotted on a map to depict the geographical distribution of measured values for each category. We assign a color-coded symbol for each parameter to be plotted on the map, where green represents a nominal landing site (ubiquitous defined polygons, minimal rough topography, minimal boulders, minimal large craters, few to no small craters, minimal rock density), yellow represents marginal conditions, and red indicates noncompliance with the landing site criteria (Fig. 8). Table 1 lists the values used to assign green (nominal), yellow (marginal), and red (unacceptable) rankings for each landing site selection criteria.
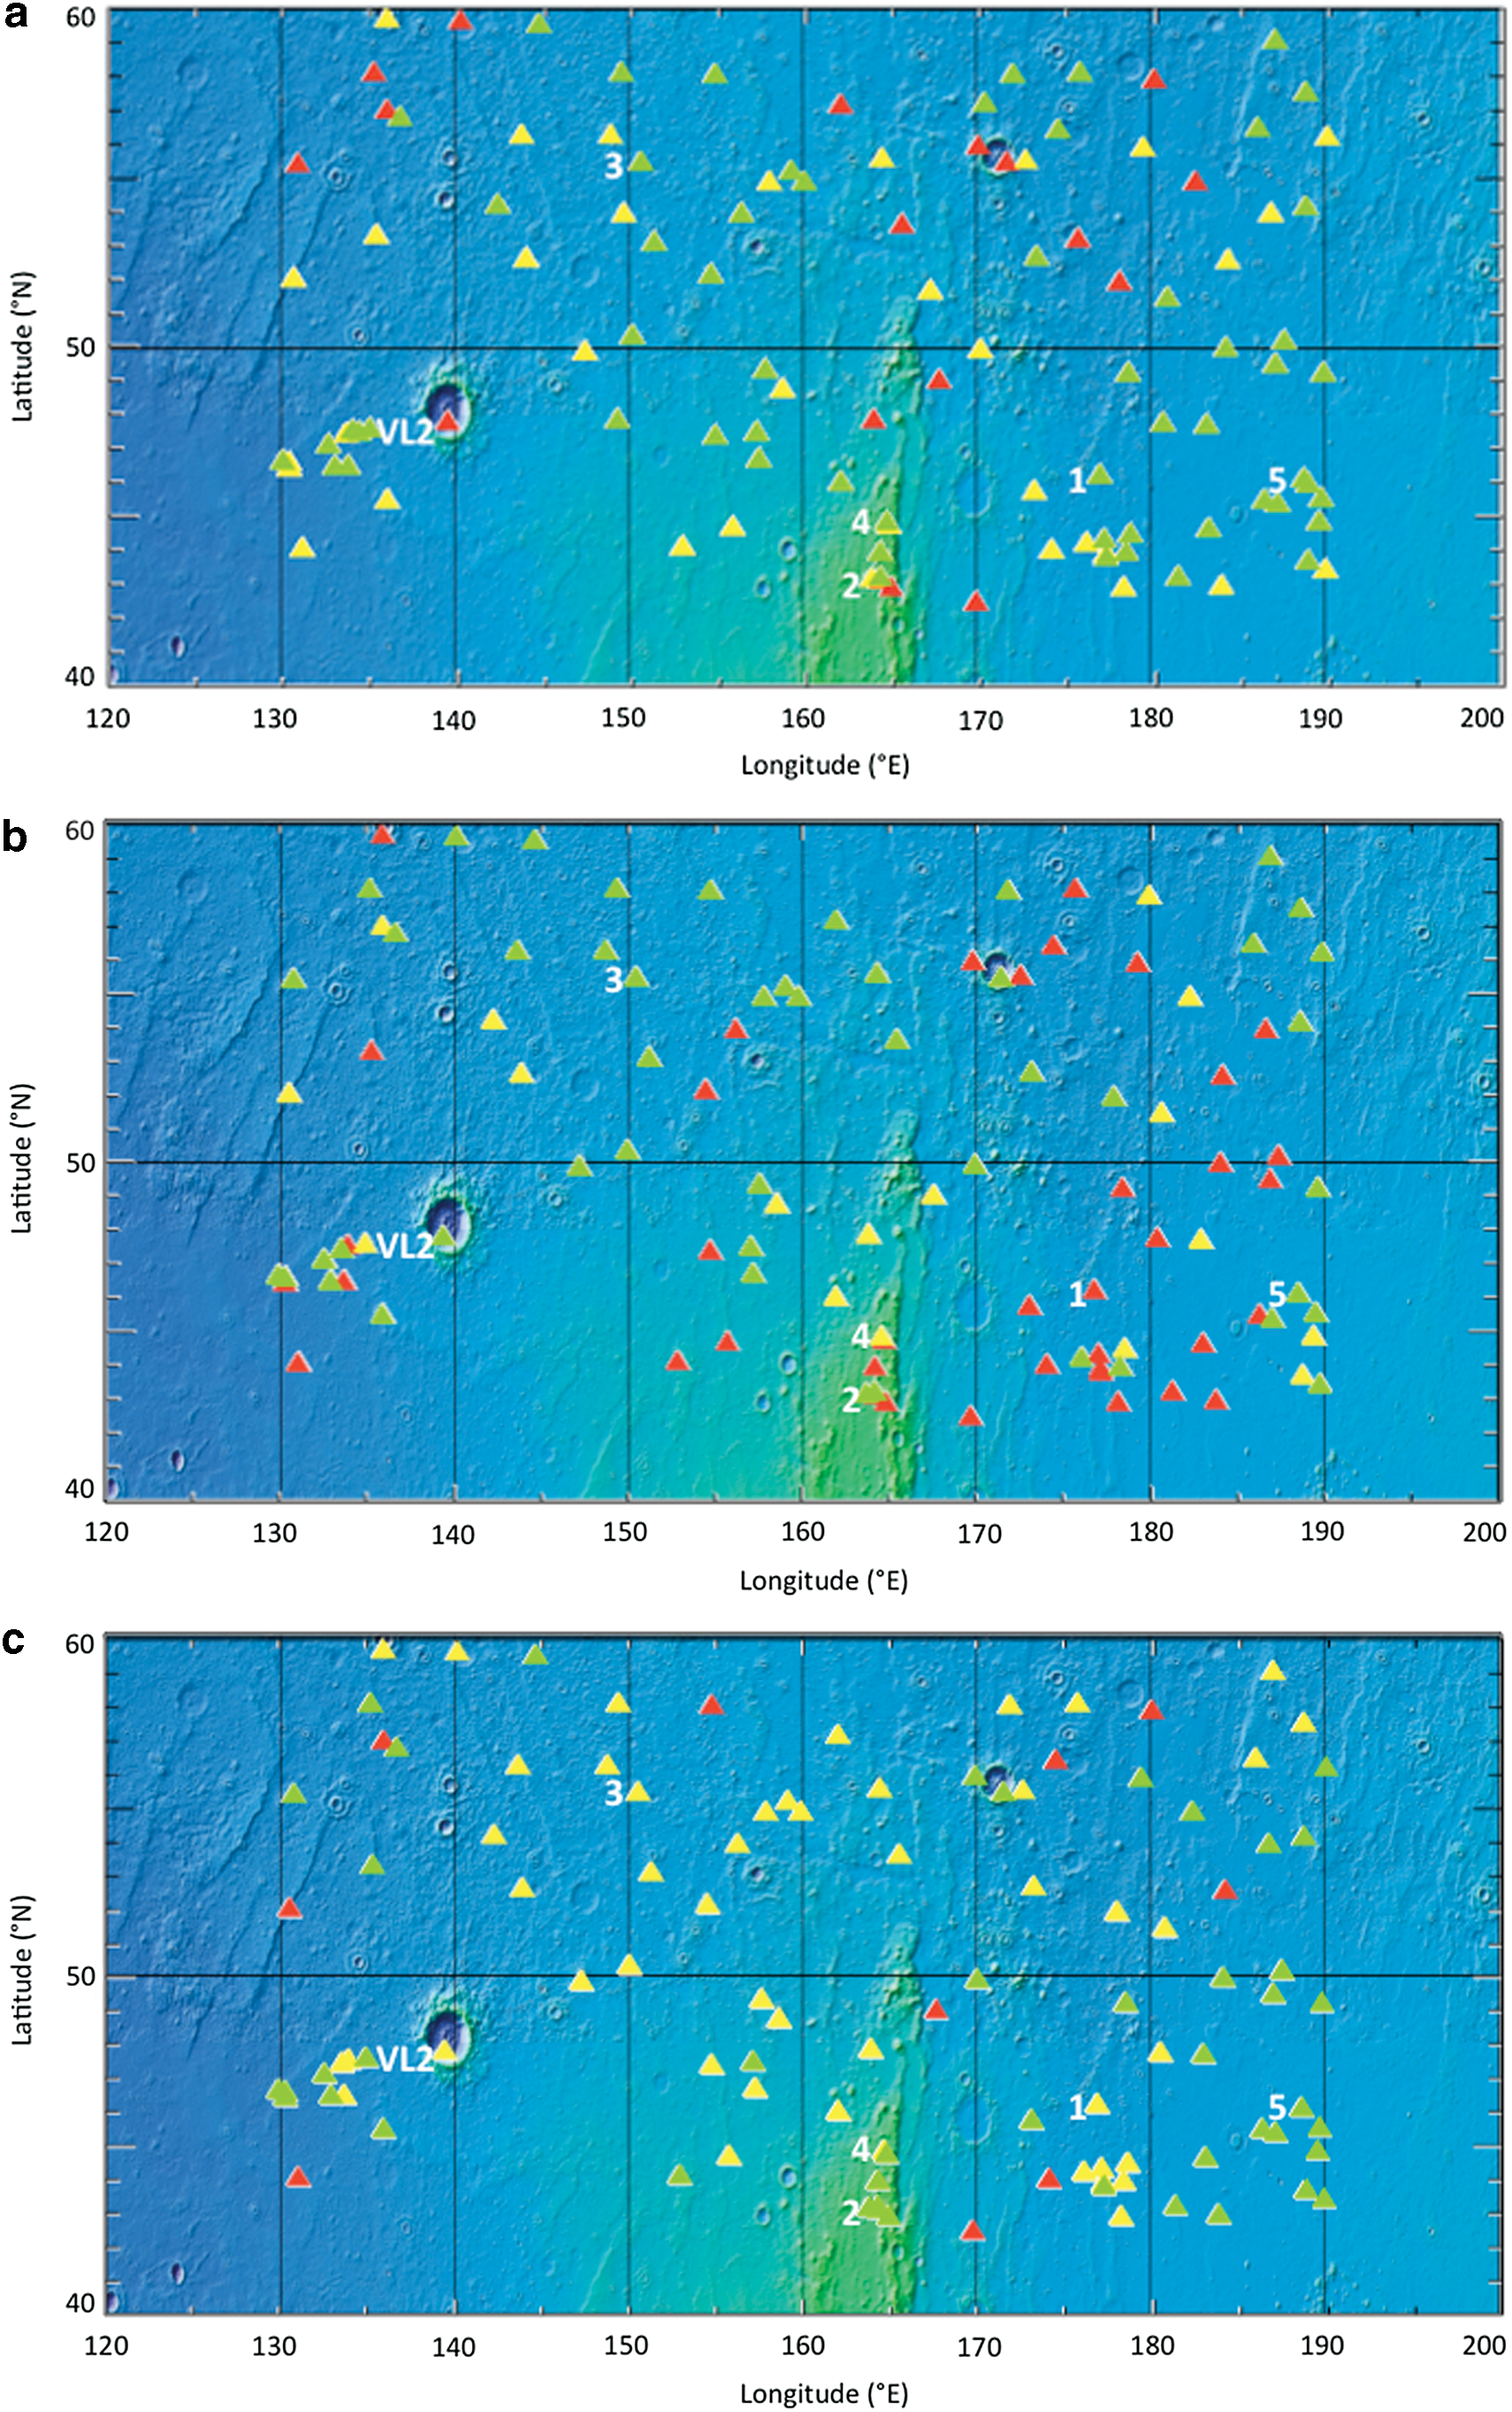
Plots showing the distribution of landing site criteria measurements for (
5. Results
For each of the five sites with exposed water ice identified by Byrne et al. (2009), we conducted further analysis as described here. We investigated these sites in more detail first since our aim was to determine whether landing near one of these exposed craters where ice is known to exist is feasible from an engineering and safety standpoint.
Site 1 (Fig. 9) is shown in HiRISE image ESP_011323_2265 located at 46.33°N, 176.90°E and has a modeled ice depth of 0.51 m (Byrne et al., 2009). Polygons are present and defined, and rock density is rated 1 or 2, with areas of higher rock density in closer proximity to the central region of uplift. Boulders are also present at the uplift, and the topography includes considerable uplift in the center of the image along with uneven terrain near the image bottom. Small craters are found interspersed throughout the image.
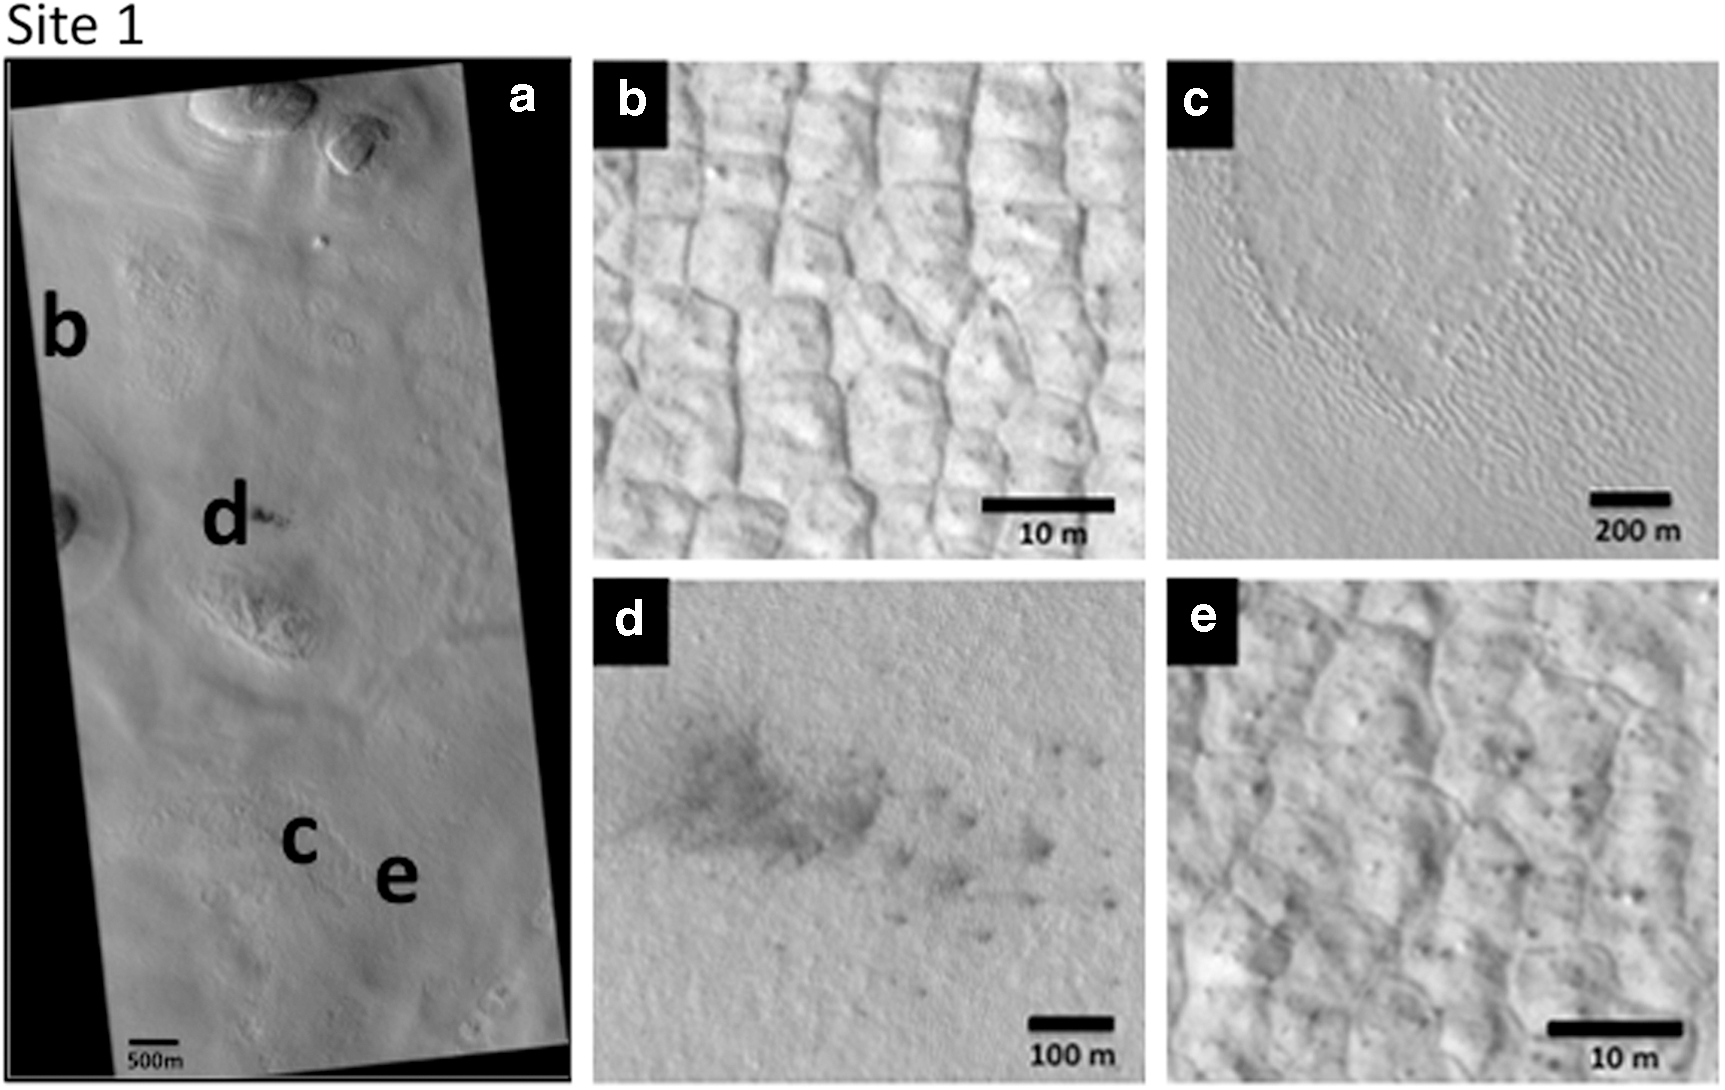
(
Site 2 (Fig. 10) is shown in HiRISE image ESP_011574_2235 located at 43.28°N, 164.22°E and has a modeled ice depth of 0.51 m (Byrne et al., 2009). Polygons are present in most areas and consist of both defined and undefined morphologies. Only a few scattered rocks are present in the image (closest to the large uplift in the center right of the image). Topography includes the uplifted region as well as small bumps in terrain. Craters and boulders are lacking.
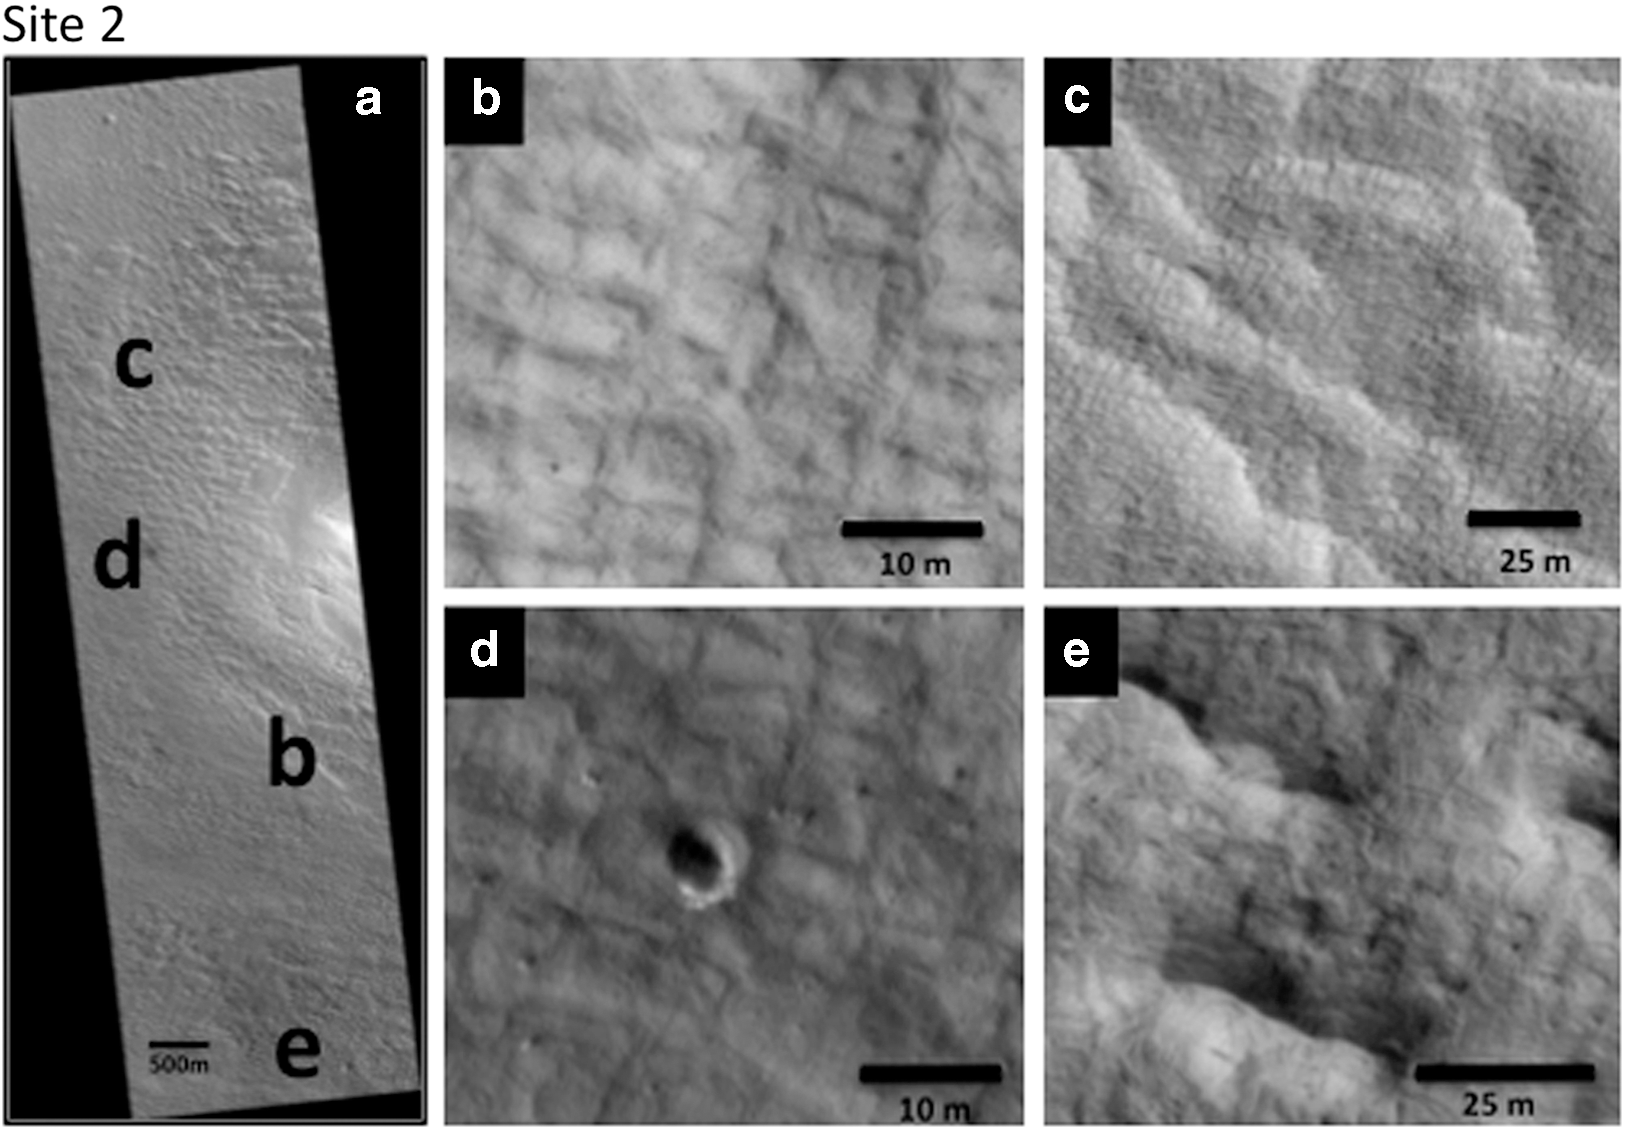
(
Site 3 (Fig. 11) is shown in HiRISE image PSP_010625_2360 located at 55.57°N, 150.62°E and has a modeled ice depth of 0.12 m. Polygons are present yet not well defined. The region has many areas that are rated 3 or 4 in rock density, while smaller regions on the right of the image are rated 1. The topography is relatively flat with the exception of the craters and the uplifted region near the bottom of the image. Many craters are present within the image, and boulders are associated with these craters. Dust devil tracks are also observed in this image.
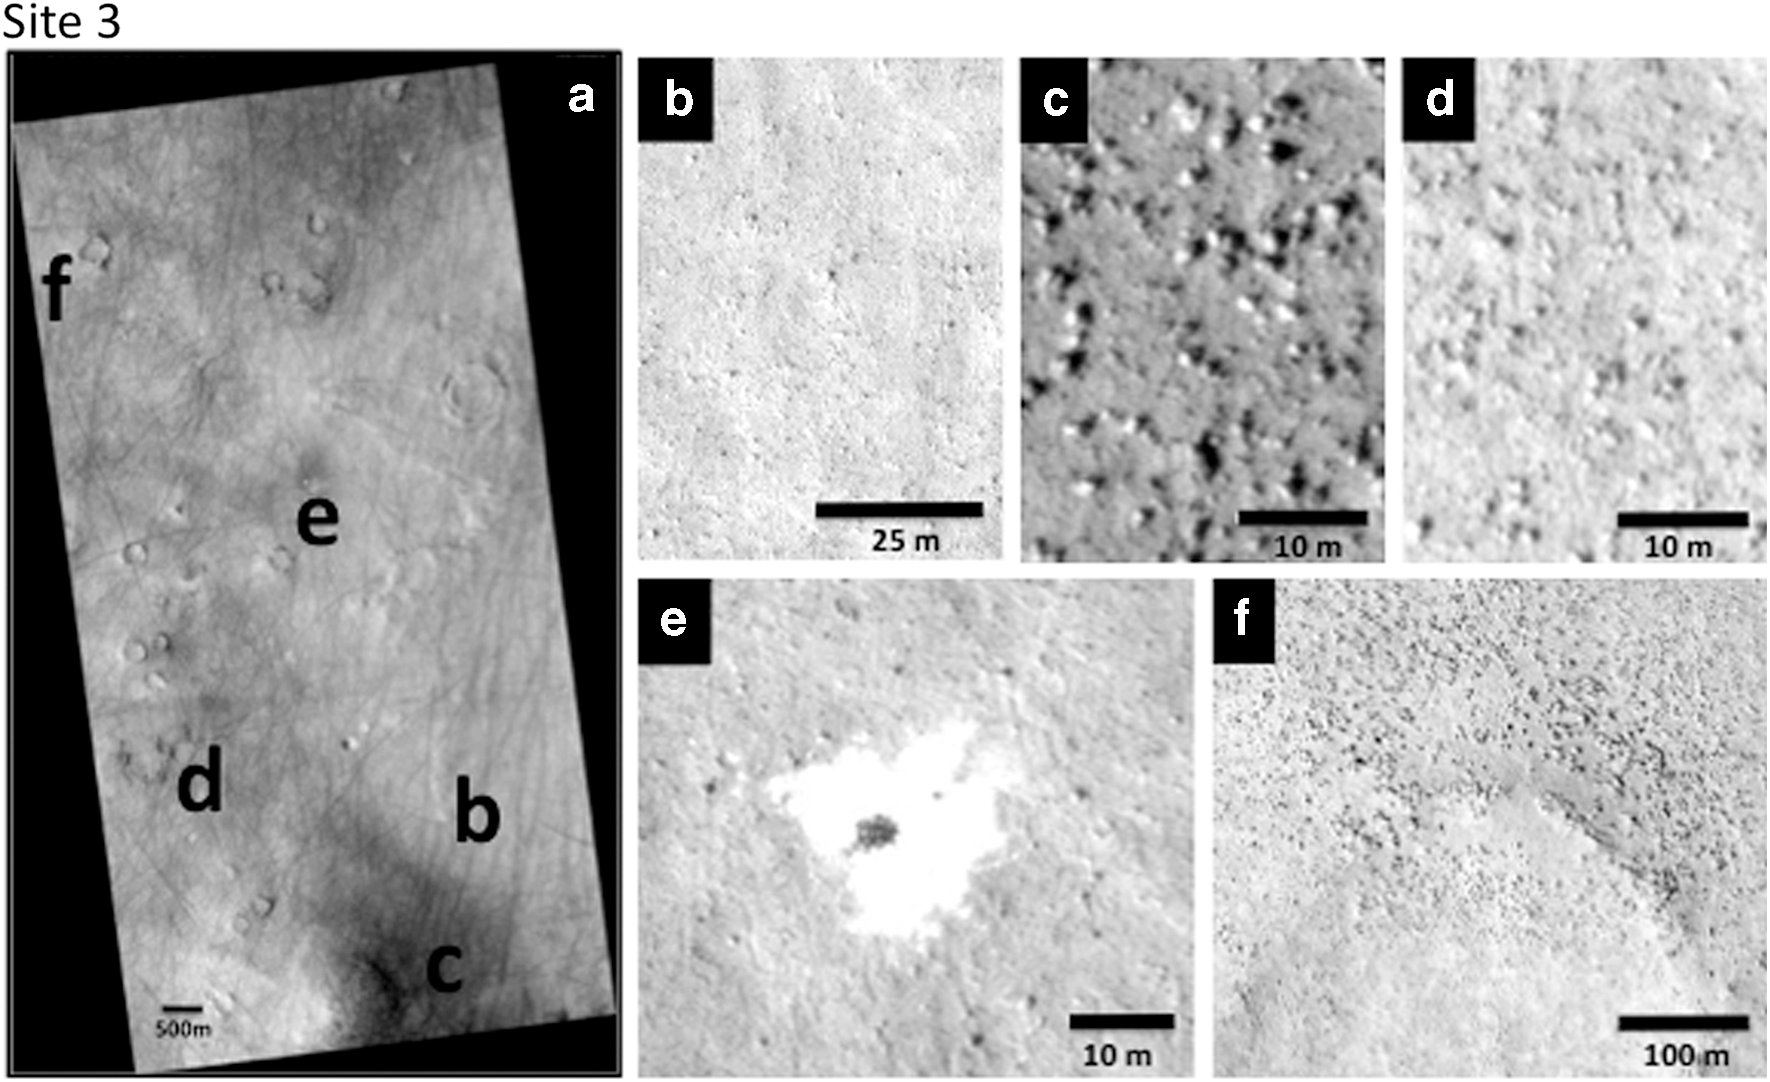
(
Site 4 (Fig. 12) is shown in HiRISE image ESP_011442_2255 located at 45.05°N, 164.71°E and has a modeled ice depth of 1.76 m (Byrne et al., 2009). Polygons are present yet not well defined. Rock density is typically rated 0 or 1. There are several regions of uplift throughout the image and many muted craters. Boulders are concentrated near the regions of uplift.
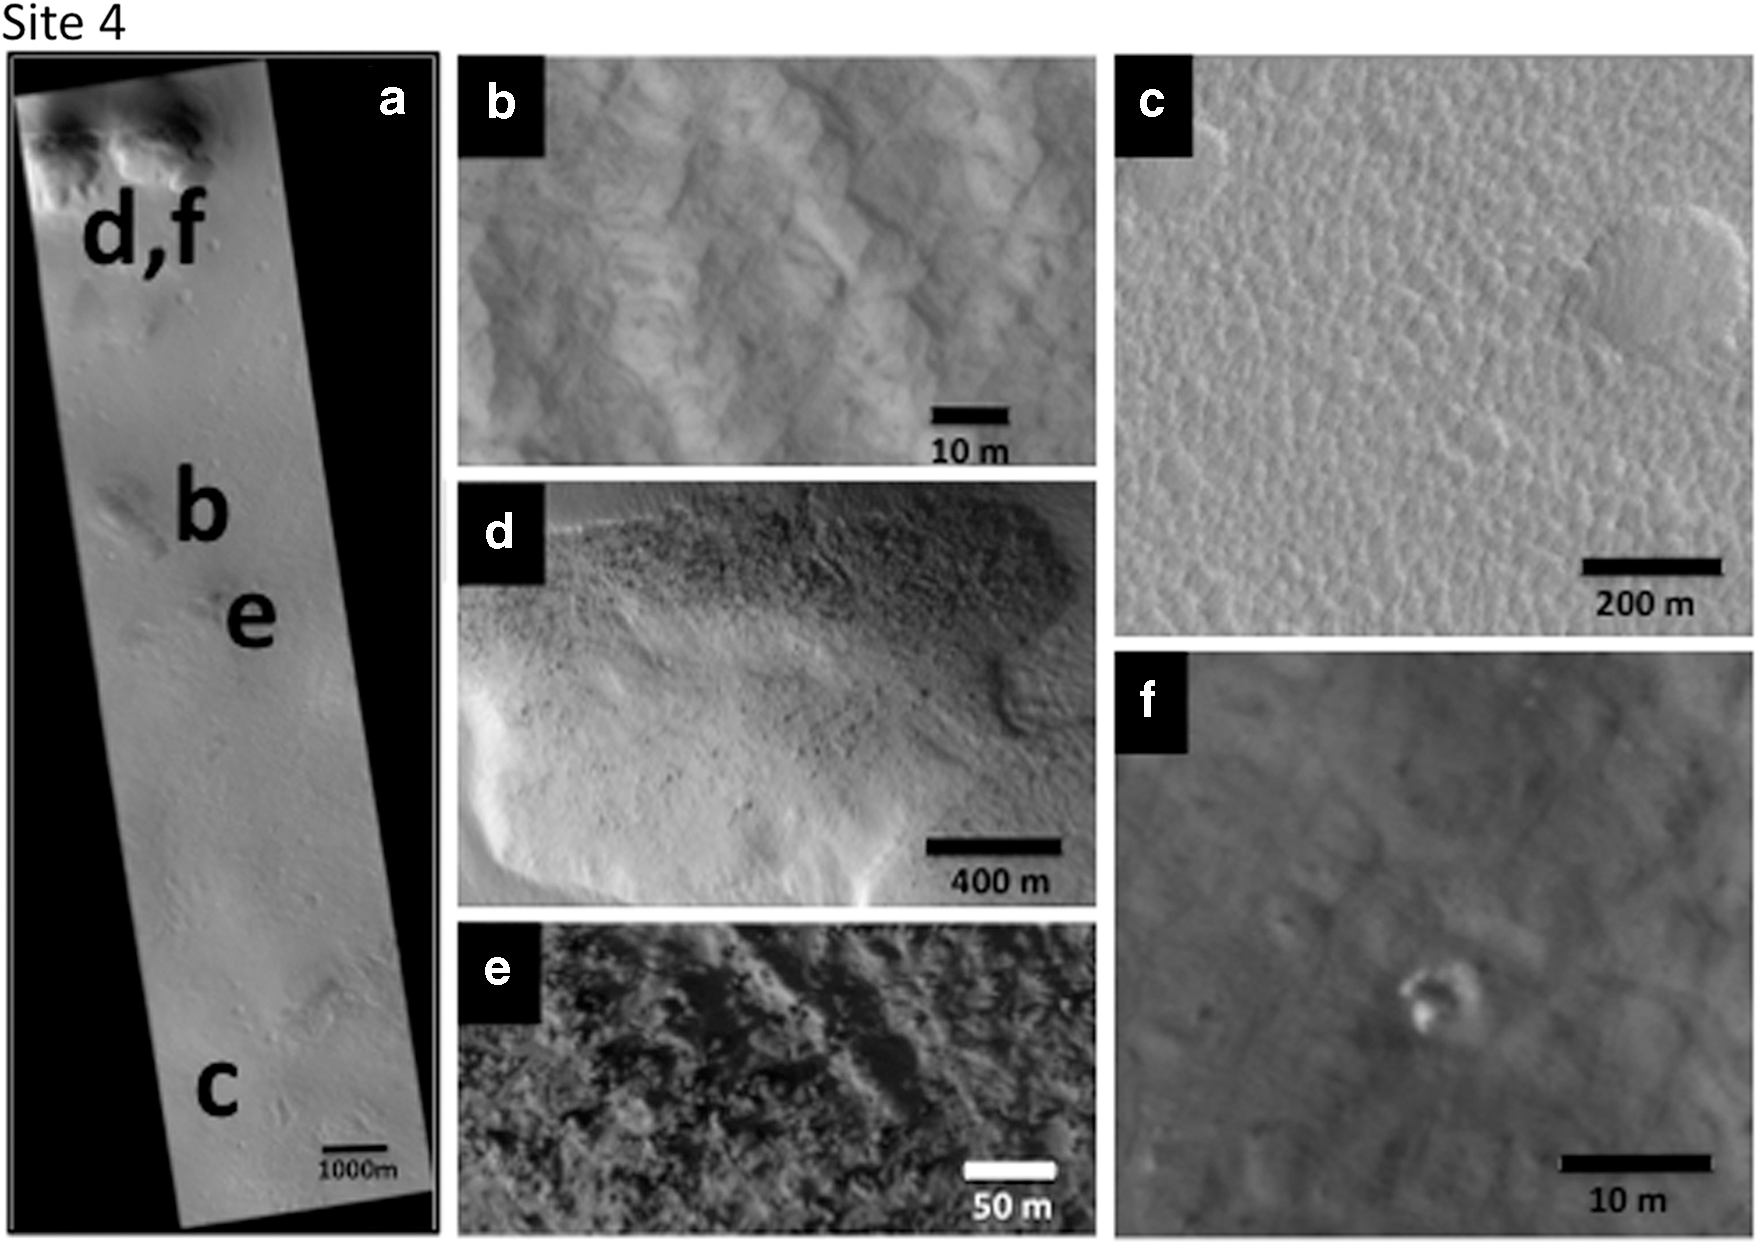
(
Site 5 (Fig. 13) is shown in HiRISE image ESP_011494_2265 located at 188.51°E, 46.16°N and has a modeled ice depth of 0.14 m (Byrne et al., 2009). Polygons are present throughout the image and are well defined. Rock density is generally low with a rating of 3 only near regions of uplift in a few small areas. The topography is generally flat with just some small areas of uplift. A few small craters are observed in the bottom right corner of the image only, and no boulders are seen.

(
Based on this data set, Site 5 is the most promising landing site of the five exposed ice craters identified. To further evaluate the viability of Site 5 as a landing site for a Mars life-detection mission, we requested further HiRISE imaging of this region. Heldmann et al. (2012) presented the rationale for further HiRISE imagery at the Mars Landing Site Workshop. Per Mars Program office guidelines, this image request assumed a 20×25 km landing ellipse. Figure 14 shows the location of the previously available high-resolution imagery as well as our requested HiRISE location. The western portion of the ellipse was well covered with existing imagery; the eastern portion of the ellipse (encompassing the orange proposed HiRISE image) was not well characterized. We therefore requested a HiRISE image of this region to evaluate the scientific potential of this site and its compliance with landing site engineering constraints. The areas of the ellipse with Mars Orbiter Camera (MOC), CRISM, and HiRISE coverage indicate the presence of polygons, typically indicative of subsurface ice.
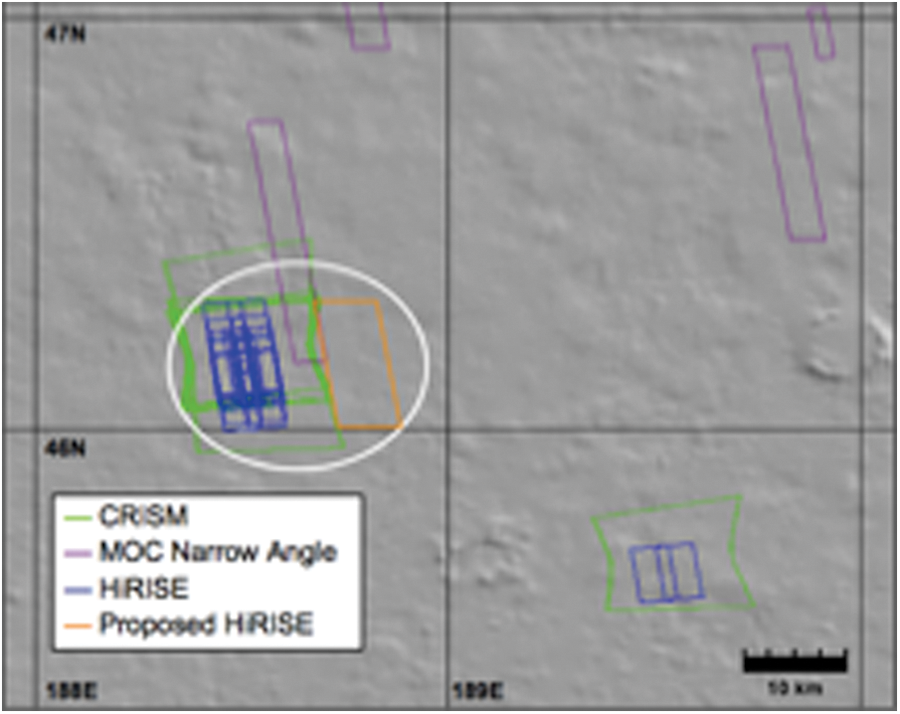
Amazonis site region with Mars Orbiter Laser Altimeter (MOLA)–shaded relief basemap. White indicates 20×25 km landing ellipse. Impact crater exposing subsurface water ice (Site 5 from Byrne et al., 2009) is located in the middle of the set of HiRISE images within the ellipse. The footprints of existing CRISM (green), MOC (purple), and HiRISE (blue) images are shown. The location of the requested HiRISE image is shown in orange (center coordinates 46.16°N, 188.79°E). Color images available online at
The requested HiRISE image was acquired on February 7, 2012 (HiRISE image ESP_025933_2265 centered at 46.16°N, 188.8°E). As shown in Fig. 14, the location of this image nicely covers the eastern portion of the landing ellipse. The image was evaluated with our predetermined evaluation criteria (presence of polygons, rock density, topography, craters, boulders). This new HiRISE image reveals that the eastern portion of the landing ellipse contains ubiquitous defined polygons, no boulders, very few areas of rock density higher than zero, minimal rough topography, and few craters, all of which make this region an ideal landing site.
We also assessed the landing site conditions throughout the entire ROI, including areas beyond just the five icy crater sites identified by Byrne et al. (2009). General trends in the geographic distribution of values for each assessment category (polygon presence, topography, rocks, polygon definition, and presence of craters) are shown in Fig. 8. The distribution of polygons shown in Fig. 8a does not display a strong geographic pattern. Polygons are clustered near the VL2 site and Site 5 (green data points) and are generally absent (red data points) near large craters. Uneven topography (Fig. 8b) is clustered between 43–50°N and 170–186°E. A generally benign region that lacks severe topography is present between 48–60°N and 136–165°E. Elsewhere, the presence of uneven topography is randomly distributed. Figure 8c shows that the locations of high boulder abundance (red data points) are few but distributed throughout the image. There are many marginal regions containing boulders (yellow data points), and these areas are interspersed with more acceptable (green data points) areas lacking boulders. The VL2 site and Site 5 are dominated by acceptable (green) abundances of boulders. Figure 8d shows that rocks are well distributed throughout the ROI. Site 5 (and the broader region encompassing Site 5) is generally ranked as acceptable (green data points) in terms of rock abundance. The VL2 site, by definition of our ranking system in our analysis, has middle values for rock abundance (a mix of red, yellow, and green data points). Polygon definition (Fig. 8e) shows an abundance of well-defined polygons in the ROI. Red data points correlate with Fig. 8a and show where polygons are not present. The locations of big craters (e.g., craters that dominate the areal extent of the HiRISE image) are shown to be few in number (Fig. 8f) and primarily distributed in the central plain between 48–57°N and 143–165°E. The regions east of 165°E and west of 143°E in our ROI are free of these large impact craters. The presence of smaller, sub-HiRISE–sized craters (Fig. 8g) is more randomly distributed throughout the ROI. Several such craters are located on both the higher-elevation tongue extending into the ROI between 160°E and 170°E and within the flatter plains without preference to location.
6. Discussion
Considering just the five sites identified by Byrne et al. (2009) with exposed water ice, the optimal landing site within Amazonis Planitia is Site 5, which satisfies all the science, human exploration (near-surface ice for ISRU and planetary protection considerations), and engineering criteria. This site is optimal because it has ubiquitous defined polygons, no boulders, very few areas of rock density higher than zero, minimal rough topography, few craters, and direct evidence of subsurface ice in the newly excavated crater. There are only a few very small areas of uplift and higher rock densities and only a few small cracklike features with smooth edges.
Our requested HiRISE image provides substantial coverage of the Site 5 landing ellipse (Fig. 14). These data, in conjunction with the preexisting HiRISE coverage, confirm that both the eastern and western portions of the landing ellipse are favorable landing sites due to the ubiquitous defined polygons, lack of boulders, few areas of rock density higher than zero, minimal rough topography, and few craters.
We also assessed the broader ROI to determine whether any additional landing sites satisfy the landing criteria. We analyzed the HiRISE images within this ROI (Fig. 8) and searched for any site (or sites) where all the criteria (polygon presence and definition, topography, boulders, craters, rock density) fall within the predetermined nominal threshold (represented by green values in Fig. 8). Only the aforementioned Site 5 (46.16°N, 188.8°E) unequivocally satisfies all the landing site criteria (acceptable, or green values in Fig. 8) of the five sites identified by Byrne et al. (2009).
We also searched for landing sites that may be marginally acceptable. These sites are depicted by yellow symbols in Fig. 8 and are representative of a less conservative application of the landing site criteria. Within the ROI, there are 21 sites where all landing site criteria fall within the nominal or marginal ranges (e.g., green or yellow entries in Fig. 8). The locations of these sites are plotted in Fig. 15. These marginal sites are more concentrated in the eastern half of the ROI (including clustering near Site 5) and are found near the VL2 site in the west. Two restrictive categories regarding the landing site assessment include topography, which rules out 35% of sites with an unacceptable value (red in Fig. 8), while polygon definition eliminates 42% of sites. The categories of polygons, boulders, small craters, big craters, and rocks have unacceptable values for 16%, 12%, 29%, 5%, and 17% of sites, respectively.
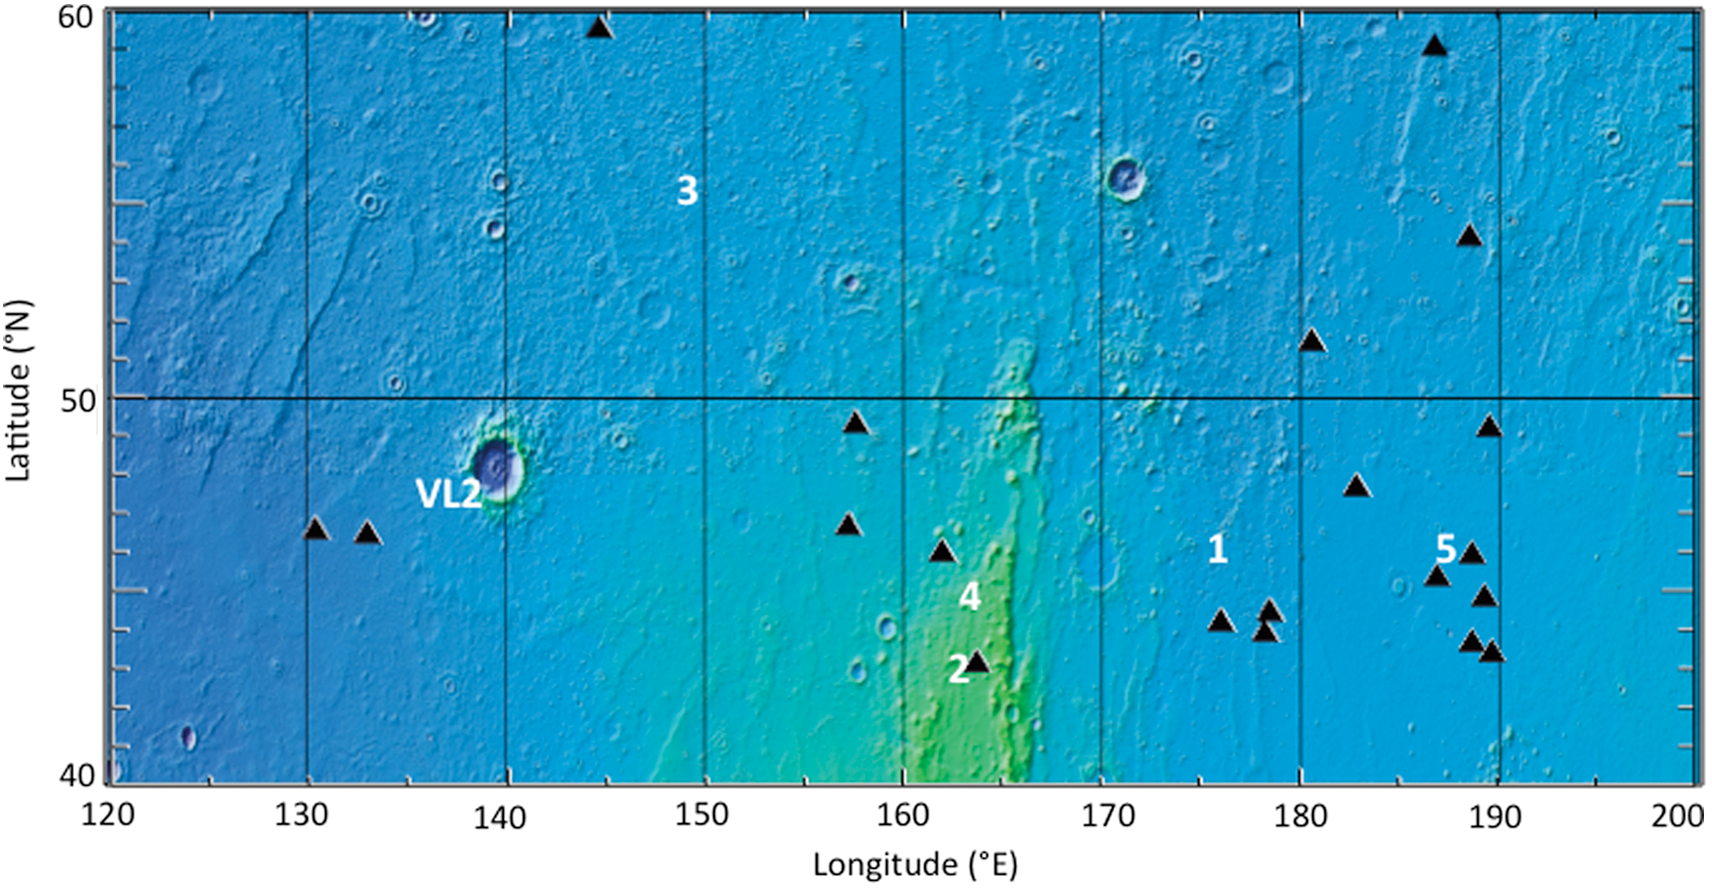
Plot showing distribution of locations with nominal and/or marginal values (Table 1) for all landing site criteria. Color images available online at
Sites within our ROI with acceptable values for all assessment criteria are shown in Fig. 16 (e.g., all green entries in Fig. 8). These sites are concentrated near Site 5 (Byrne et al., 2009) between 182°E and 190°E, and two sites are located near 160°E. No sites with all acceptable values are found west of 157°E in our ROI.
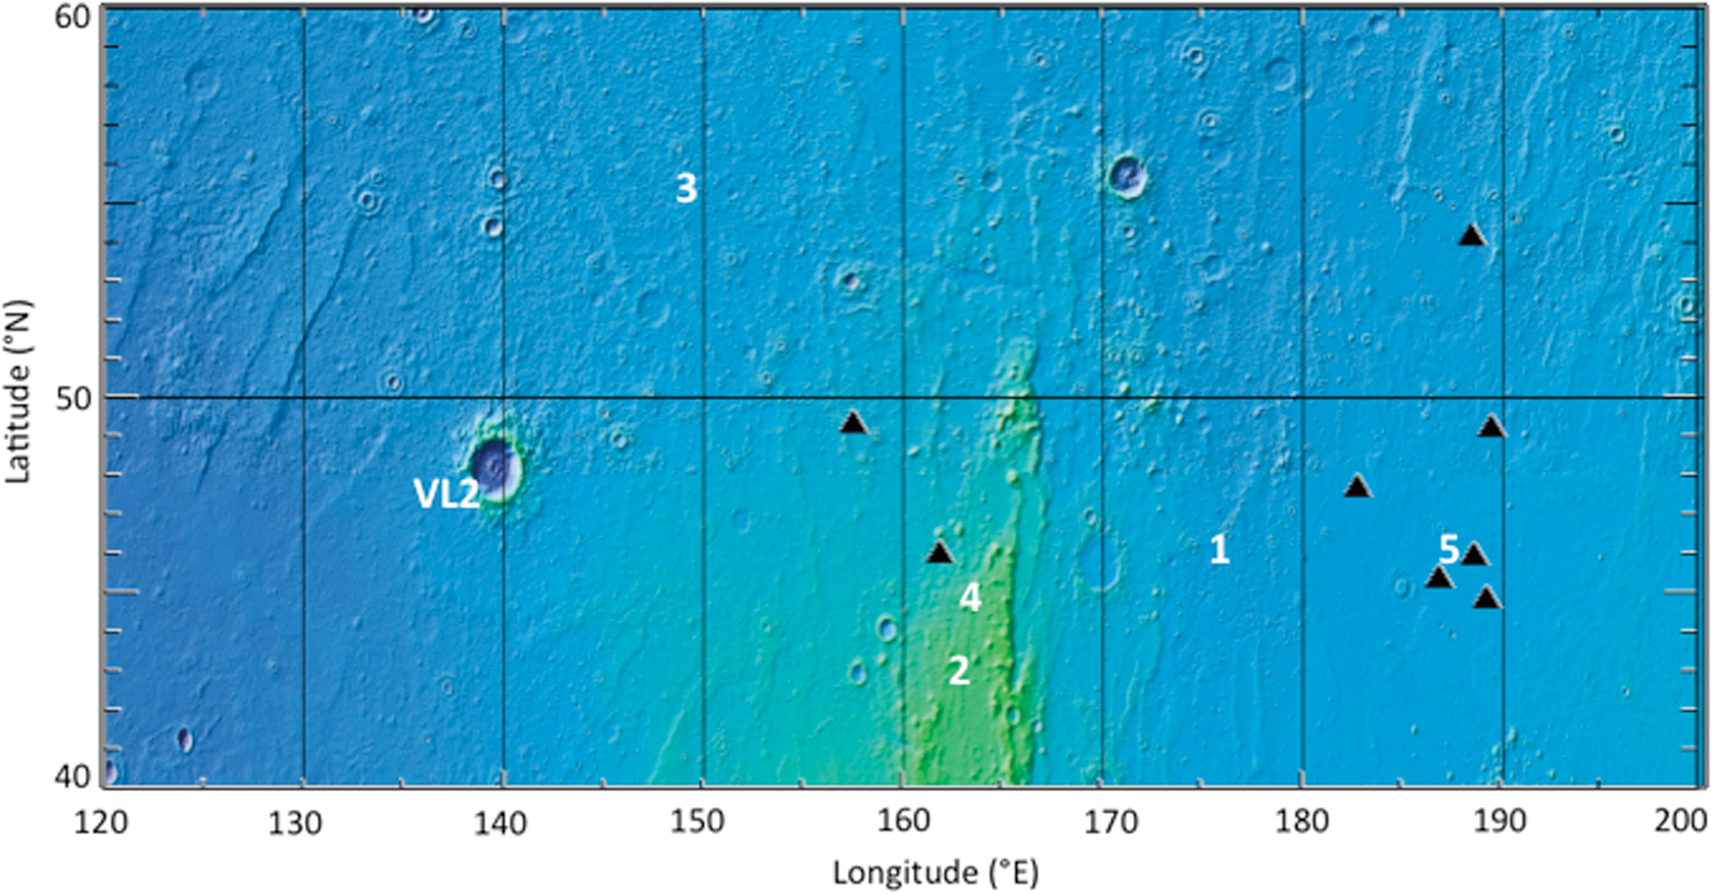
Plot showing distribution of locations with nominal values (Table 1) for all landing site criteria. Color images available online at
6.1. Mars mission concepts
Several mission concepts have been proposed to search for extant life and/or to assess midlatitude ice on Mars where the site selection work presented here could be applicable. The Mars Icebreaker mission has been proposed to search for life on Mars by landing a Phoenix-derived spacecraft equipped with a drill and relevant science payload (McKay et al., 2013). Icebreaker would (1) analyze subsurface ground ice where organic and biological compounds are shielded from radiation and (2) utilize the latest generation biotechnology for life detection to detect complex biomolecules with techniques compatible with the martian soil chemistry. A variation of the Icebreaker mission is the Ice Dragon concept, which uses a similar payload but is packaged within a SpaceX Red Dragon lander system (Stoker et al., 2012). The Biological Oxidant and Life Detection (BOLD) mission has also been suggested to search for extant martian life, including a set of landed oxidant and life-detection experiments (Schulze-Makuch et al., 2012). Additional missions such as impactors have also been proposed to assess the distribution of near-surface ground ice on Mars. One such option is the Mars Crater Observation and Sensing Satellite (MCROSS) mission concept with impactors launched from a SpaceX Dragon platform and follow-up observations conducted from Mars orbit to assess the spatial distribution of midlatitude ice (Heldmann et al., 2013).
7. Conclusions
We conducted a study of landing site suitability in the vicinity of Utopia, Arcadia, and Amazonis Planitia to support a Mars life-detection mission. Although water ice exists in the polar caps and high-latitude regions of Mars, these regions are not ideal for a human base, so we focused our analysis in this study on the ice-rich midlatitude region. The VL2 landed in Utopia Planitia at 48°N, 135°E. We used the VL2 site as a baseline for our classification since NASA has demonstrated successful landing at this site, and we also have detailed characterization of the VL2 site from both orbit and the ground. VL2 lander imagery reveals a relatively rocky, flat terrain; and orbital imagery reveals the presence of polygonal ground, which is often considered a proxy for subsurface ice (Squyres et al., 1992; Mellon, 1997; Levy et al., 2009). Within the VL2 plains are five recent impact craters that have excavated ice within the upper meter (often tens of centimeters) of the surface (Byrne et al., 2009). These sites span from Utopia into Arcadia and Amazonis Planitia. Direct observation from HiRISE showed bright material that faded over time as the ice sublimated away, and CRISM spectral measurements confirmed that the bright material was ice.
We examined each of these five impact sites in comparison with the VL2 site for scientific merit and landing site suitability. We classified each site according to the following criteria: (1) presence of polygons as a proxy for subsurface ice, (2) presence and abundance of rough topographic obstacles (e.g., large cracks, cliffs, uneven topography), (3) rock density compared to the VL2 site, (4) presence and abundance of large boulders, and (5) presence of craters.
Sites 1–5 as identified by Byrne et al. (2009) have been systematically studied by using the available HiRISE imagery data, and Site 5 (46.16°N, 188.51°E) is the optimal choice in terms of a preferred landing site. Site 5, the Amazonis site, has clearly defined polygons, few rocks, minimal topography, few very small craters, and no discernable boulders. New HiRISE imaging shows that the landing ellipse exists within a favorable landing zone. This site satisfies the science, human exploration, and engineering constraints for a midlatitude ice-rich site.
The search for biomarkers and life on Mars is the next logical intellectual pathway for Mars exploration. A future life-detection mission to Mars will accomplish both scientific and human exploration precursor objectives, and multiple mission concepts have been proposed to achieve these goals. Future landed robotic missions to Mars that are focused on the astrobiological science suggested here have ideal, ice-rich landing sites within the midlatitudes and polar plains of Mars.
Footnotes
Acknowledgments
The authors acknowledge the conveners of the 2012 Mars Landing Site Workshop and thank the HiRISE team for acquiring the requested landing site image for this work.
Author Disclosure Statement
No competing financial interests exist.
Abbreviations
CRISM, Compact Reconnaissance Imaging Spectrometer for Mars; EDL, entry, descent, landing; GRS, Gamma Ray Spectrometer; HiRISE, High Resolution Imaging Science Experiment; ISRU, in situ resource utilization; MOC, Mars Orbiter Camera; ROI, region of interest; VL2, Viking Lander 2.