
Abstract
Considerable data and analysis support the detection of one or more supernovae (SNe) at a distance of about 50 pc, ∼2.6 million years ago. This is possibly related to the extinction event around that time and is a member of a series of explosions that formed the Local Bubble in the interstellar medium. We build on previous work, and propagate the muon flux from SN-initiated cosmic rays from the surface to the depths of the ocean. We find that the radiation dose from the muons will exceed the total present surface dose from all sources at depths up to 1 km and will persist for at least the lifetime of marine megafauna. It is reasonable to hypothesize that this increase in radiation load may have contributed to a newly documented marine megafaunal extinction at that time.
1. Introduction
T
The possible terrestrial effect of a nearby SN has long been of interest. A major modern attempt to computationally approach the problem was published by Gehrels et al. (2003), and emphasized the effect of stratospheric ozone (O3) depletion and concurrent ultraviolet-B (UVB) increase at Earth's surface as a mechanism for change. Benitez et al. (2002) noticed the proximity of the SN timing to the PP extinction and proposed the ultraviolet (UV) mechanism as related to the extinction. However, there was also awareness of the effect of muons on the subsurface from cosmic ray (CR) showers (Marinho et al., 2014). All of these works were limited by a relative lack of information on source electromagnetic and CR emissions. More recently, new information on prompt and early emissions from SNe as well as the timing and distance of relatively recent proximate SNe was used as input in a series of computations (Melott et al., 2017). We use terrestrial muon flux from this study as an input to propagate effects into the ocean.
2. Base Study Methods and Conclusions
The work here is a follow-on to a recent fairly comprehensive study (Melott et al., 2017) modeling the best available information on the event indicated by recent data (Knie et al., 2004; Binns et al., 2016; Breitschwerdt et al., 2016; Fimiani et al., 2016; Fry et al., 2016; Ludwig et al., 2016; Mamajek, 2016; Melott, 2016; Wallner et al., 2016). We summarize the assumptions, methods, and results in this study, but the reader is referred to the original publication (Melott et al., 2017) for detailed information. An SN of type IIP is assumed to have taken place about 2.6 Ma, at a distance of 50 pc. We assume that the SN injects instantaneously the CR energy 2.5 × 1050 erg with source spectrum Q(E) ∼ E−2.2 exp(-E/Ec) and cutoff energy Ec = 1 PeV. We further assume that both the SN and Earth are within the Local Bubble, having been already formed by SNe earlier in the series (Breitschwerdt et al., 2016). The magnetic field in the Local Bubble is assumed to have been largely expelled and residing within the walls of this structure; the internal remnant field is turbulent with strength B = 0.1 μG. Under these conditions, the CR propagation is essentially diffusive and no major anisotropy in the direction of arrival is expected. A power law spectrum was associated with the turbulent magnetic field that leads to a diffusion coefficient of CRs after leaving the SN remnant to behave as D(E) ∝ E1/3 for E ≪ Ec. All this results in a CR intensity of I ∝ Q(E)/(Dt)3 exp(-(-r/Dt)2). Our results imply a much larger CR flux than estimated in a previous study (Gehrels et al., 2003), which lacked information recently available. The flux we find at 50 pc is comparable with but has higher energy CRs than assumed in that previous study. The effects are correspondingly greater at Earth's surface and in the oceans.
A second step was the convolution of the galactic cosmic rays spectrum with an updated version of the tables from Atri and Melott (2011) designed for the calculation of the muon fluxes on Earth's surface. Those tables were originally obtained by performing simulations of the propagation of primary particles with fixed energy on the top of the atmosphere using the CORSIKA software (Pierog et al., 2017), which is a specific code for simulating air showers that allows the use of the EPOS model for high-energy hadronic interactions and FLUKA model for the low-energy hadron–nucleons interactions (≲100 GeV). A conservative lower end of 10 GeV was chosen for the proton primaries as simulation results are known to match available atmospheric muon flux data well (Hebbeker and Timmermans, 2002).
It is interesting to note that the Gauss–Matuyama boundary (Cox and Dalrymple, 1967), when a reversal of the magnetic poles on Earth took place, also happened around 2.6 Ma ago meaning that the geomagnetic field at the time could be substantially lower than the current value in the first few thousand years (Clement, 2004) after the SN event. This would increase the amount of low-energy muons (up to ∼3 GeV) at the surface during this period, accounting for a higher dose than that calculated here in the ocean's shallow waters (first ∼15 m of water), making a stronger case for the proposed hypothesis but not affecting our numerical estimates as depth increases.
It was found, based on more recent observations, that the immediate flux of gamma rays, X-rays, and UV photons from 50 pc is too small to be significant. It was found that the flux of blue light from the remnant is large enough to be detrimental to wildlife if in the night sky, but only for a timescale of order 1 month, too short to be visible in the fossil record.
CR propagation in the turbulent field leads to a time-dependent flux at Earth. We reproduce here as Figure 1, Figure 1B from the work of Melott et al. (2017). The units of this figure are adjusted so that equal areas under the curve correspond to equal energy flux at Earth. The zero of time is taken to be the arrival of the first prompt photons at Earth. Finally, the boundary conditions are taken to be open, so that the CRs continue past Earth. However, in the case of the Local Bubble, the CRs should reflect off the boundary of the region, and establish an approximately steady-state inside the region. The flux shown exceeds the current “galactic cosmic ray” flux at Earth by more than two orders of magnitude at PeV energies.
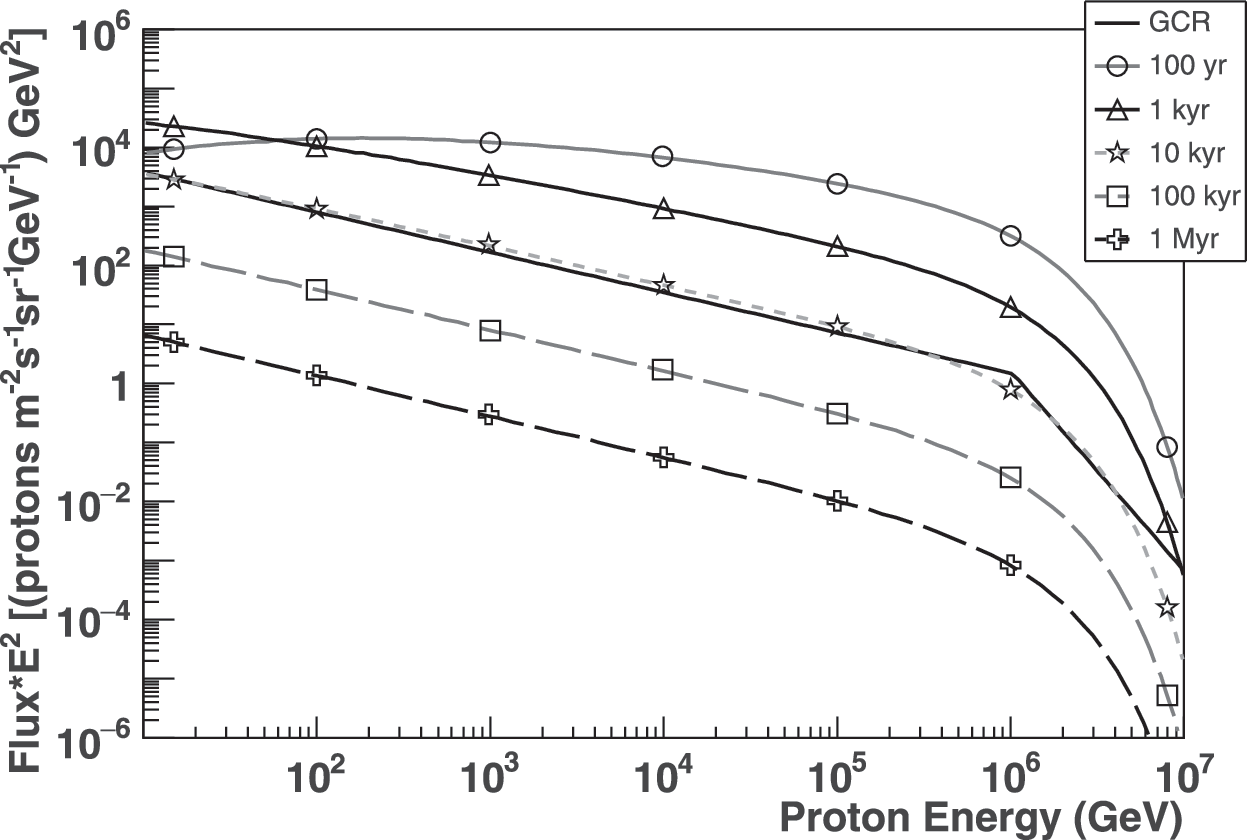
This is a very slightly modified reproduction of Figure 1B from Melott et al. (2017), the time-dependent cosmic ray flux at the Earth from a SN at 50 pc, propagating diffusively through a tangle 0.1 μG magnetic field. It takes 10,000 years for the flux to return to normal levels (solid black line). However, a steady state would be reached inside the Local Bubble with magnetic field compressed into the walls. Reproduced courtesy American Astronomical Society. GCR, galactic cosmic rays; SN, supernova.
For many decades, the dominant effect considered for terrestrial life from a nearby SN was O3 depletion. High-energy photons and CR can ionize and dissociate molecules in the atmosphere, notably N2. Through a complicated chain of chemical reactions (Thomas, 2005), the resultants catalyze the depletion of O3 with a recovery timescale of 5–10 years after the ionizing flux ends. In the recent study, the CR flux was taken to be constant at the level of 100 years. In this case, a globally averaged ozone depletion of order 25% was established as the equilibrium result (Melott et al., 2017). It was estimated that this would result in an ∼50% increase in UVB at the surface. This is much larger than the few percentage increase induced by chlorofluorocarbons in the recent past. It would no doubt be detrimental, but not a mass extinction level event. Rainout would contribute a slow but steady addition of nitrate fertilizer to the ground (Gehrels et al., 2003). Ionization in the troposphere might contribute to an increase in cloud-to-ground lighting (Chilingarian et al., 2017), but consideration of this is beyond the scope of this article.
Radiation on the ground will consist primarily of neutrons and muons. Although the neutron flux increased, the amount at ground level would constitute a very small radiation dose. The tables of Atri and Melott (2011) were convolved with the resultant CR spectra to determine muon flux on the ground. This muon dose was found to increase by a factor of ∼150 at the 100 year CR flux level, and would build up to ∼1 Sv per 30 years, which would have a substantial effect on the cancer and mutation rates. Overall, this is ∼14 times higher than the average total radiation dose from all sources currently experienced on Earth's surface. A quantitative risk assessment for marine megafaunal species due to the CR flux level increase is not possible as there are no specific studies available. However, the risk estimation as a function of dose is a relatively developed procedure for human beings in cases of doses more than several 100 mSv with acute and chronic exposures for solid tumors. For instance, the NCI radiation risk assessment tool indicates an excess lifetime risk of developing cancer of 16–40% with respect to the expected baseline future risk for a 1 Sv chronic exposure for 30 years with a 90% confidence interval (C.L.) (Gonzalez et al., 2012). Larger and longer lived organisms will experience a greater relative increase in radiation dose, which may be related to a marine megafaunal extinction at the PP boundary where 36% of the genera were estimated to become extinct (Pimiento et al., 2017).
We note that muons will dominate the dose at the ground and the ocean (UNSCEAR Report, 1996; O'Brien et al., 1998; Simonsen et al., 2000). They produce the largest ionizing dose of any secondary component from CRs (Marinho et al., 2014) and this effect will increase with depth in the ocean. Therefore, it is appropriate to focus on the muon dose.
3. Computing the Muon Dose in the Oceans
To estimate the radiation dose caused by CR muons as a function of the depth in the oceans, we employed a 3D Monte Carlo approach to characterize the energy deposition of these particles along their trajectories, using data from Melott et al. (2017) as the initial conditions at the surface of the oceans. For this we used the Geant4 framework (Agostinelli et al., 2003), which provides all functionalities necessary to simulate the radiation–matter interactions in water with a few percentage precision and over the whole energy range considered (Bogdanov et al., 2006). Muons can transfer part of their energy to the material directly or through production of secondary particles close to their trajectory through ionization, Bremsstrahlung, pair production, and nuclear processes, which were all taken into account in our calculations. In this method, the trajectories can be resumed by the occurrence of the particle decay or due to capture at rest. As shown in Marinho et al. (2014), the generated secondaries are mostly electrons and gamma rays and they will likely cause a lateral displacement of ∼1 m so still typically inside the large volumes we are interested in.
The geometry adopted for the simulation was a water column with 100 km of height and 30 km wide. The starting muon positions were homogeneously sampled within a horizontal area of 2 × 2 km2 centered on top of the column to ensure particles always propagating within the material and to avoid unwanted boundary effects. This choice of geometry does not introduce any effect of significance considered its dimensions with respect to Earth's curvature. Propagation directions were sampled according to the muon angular distributions on Earth's surface (Patrignani et al., 2017). After propagating the muons through the material and fixing all with the same initial energy E, the average deposited energy per particle ΔE′(E,z) was calculated in smaller volumes positioned at different z depths in the water column. These were block volumes of area A = 1 × 1 km2 also centered in the column z axis and with a thin h = 1 m height such that the dose rate due to a flux ϕ(E) could be obtained as function of depth. The dose rate was then calculated as
where ρ is the water density and Emin and Emax configure the energy range of the fluxes as from Melott et al. (2017).
4. Results of Muon Computations
Figure 2 shows the values obtained for annual dose as function of depth. The solid black line without markers shows the typical annual dose at the present time. The dose from muons in the ocean exceeds the present dose for 10 kyr with open boundary conditions on the CRs from the SN. It even exceeds the average dose from all sources at Earth's surface for up to 1 kyr depending on depth—for depths from 100 m to 1 km. Again, with the CR confining boundary of the Local Bubble, the dose can be expected to last longer.
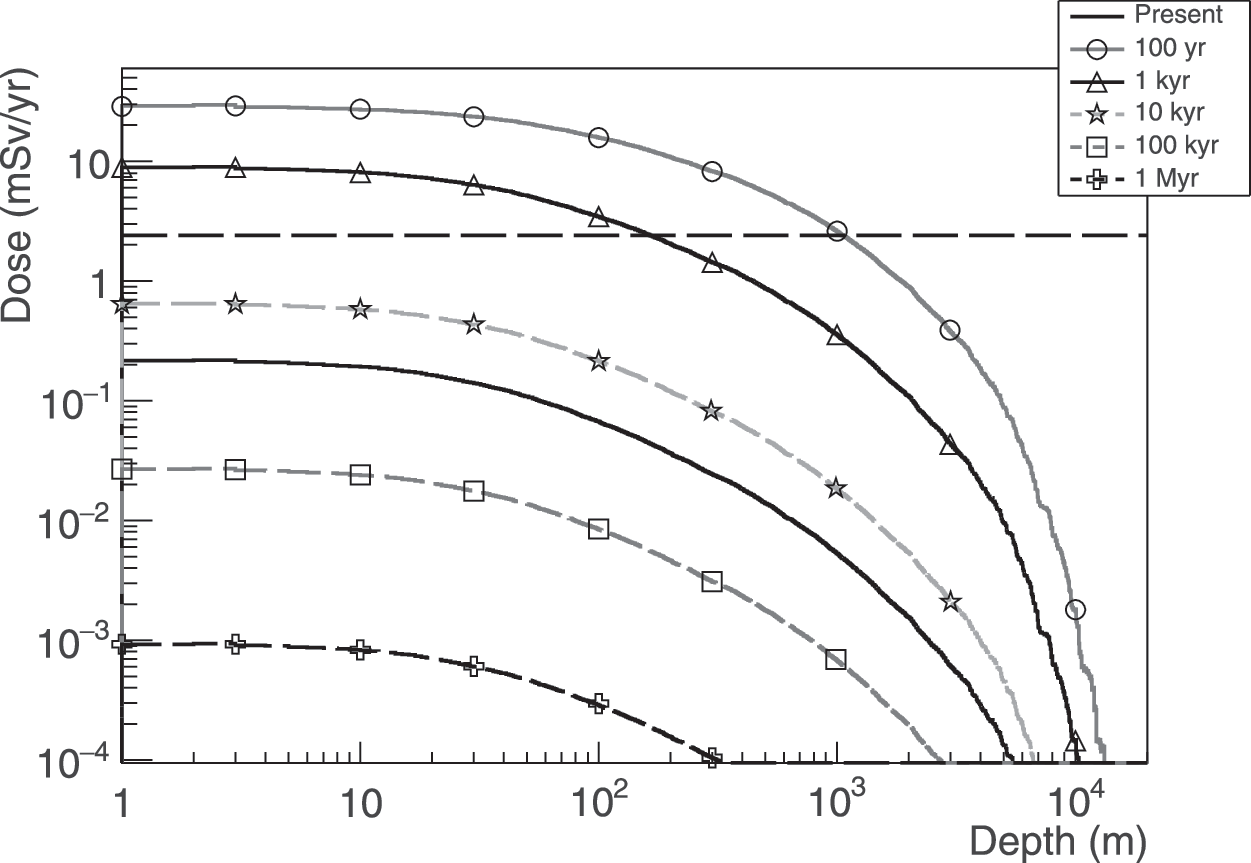
Estimated annual dose caused by muons in the oceans due to cosmic ray flux from an SN at 50 pc. The horizontal dashed line indicates the current total dose from all sources at Earth's surface while the solid black line without markers indicates current muon's dose in the ocean from the SN as function of depth.
Muons' dose can also be characterized as a function of their energy at a certain depth instead of the initial energies at the surface. Figure 3 presents the differential dose as a function of energy for when the flux reaches its maximum (100 years after the SN event) for two different oceanic depths and also at the surface. The differential dose due to the present muon flux at the surface is also shown for comparison. The small contribution to the dose from the very low-energy part of the spectrum (<1 GeV) increases with depth surpassing the surface contribution as can be observed at z = 250 m. This is due to the muons' energy loss as they traverse water, shifting muons at mid energy range to lower energies. This was also noticed in a similar analysis by Marinho et al. (2014). However, this contribution will decrease faster with higher depths such that it goes below the surface curve again at z = 500 m. This energy loss also renders the flattening and decrease of both underwater curves observed up to ∼100 GeV.
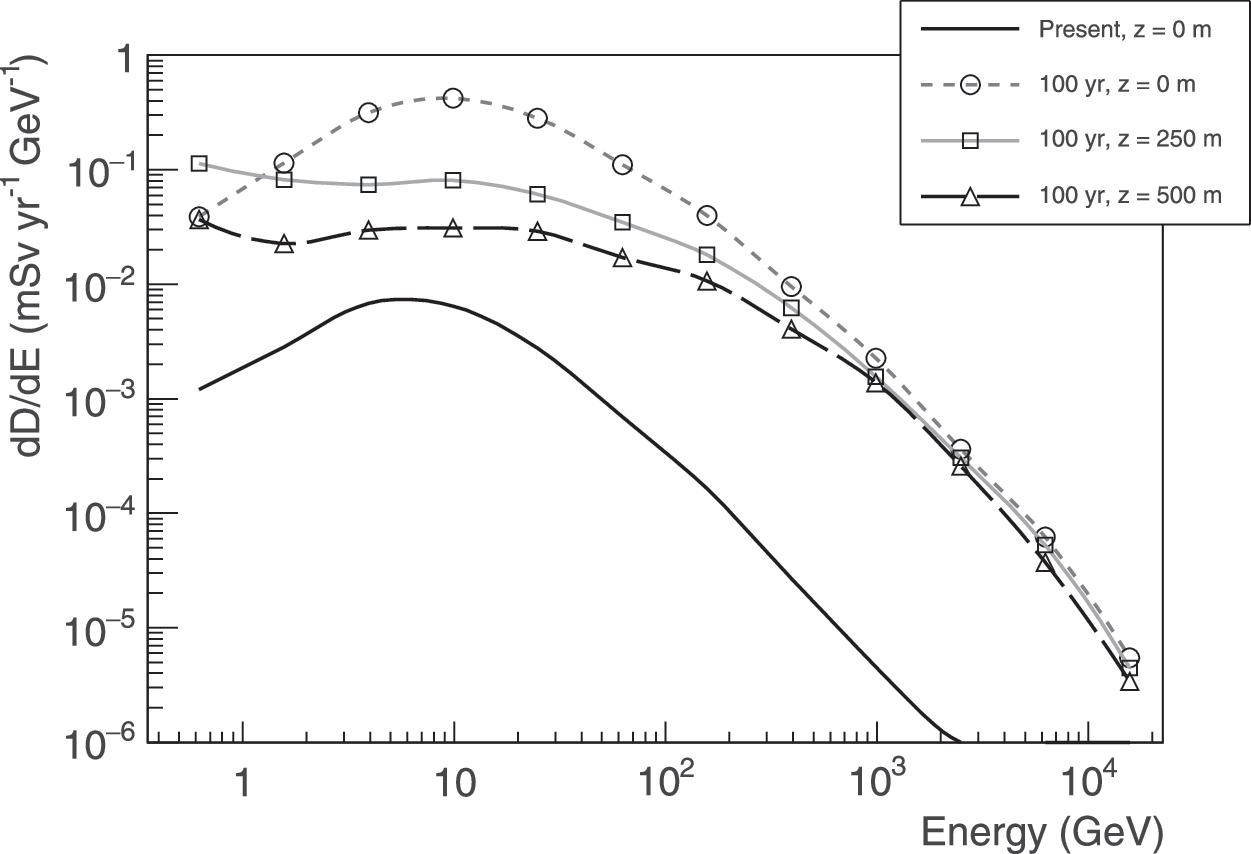
Estimated differential dose caused by muons in terrestrial oceans due to cosmic ray flux after 100 years from an SN at 50 pc distance for different depths. The present differential dose is shown for comparison.
The muon stopping power is within the same order of magnitude across the whole energy range considered in this analysis (Melott et al., 2017) with a steep increase only below the minimum and above the maximum energy values shown (Bogdanov et al., 2006; Patrignani et al., 2017). The simulation indicates that only muons arriving at water surface with energy more than ∼64 and ∼125 GeV reach z = 250 m and z = 500 m depths, respectively. This is in agreement with the stopping power estimate of ∼2.5 MeV/cm for these energies. Muons with energies >200 GeV contribute 24%, 42%, and 52% of the deposited dose for z = 0, 250 m, and 500 m, respectively, after 100 years from the SN event. Therefore, high-energy muons can reach deeper in the oceans, they being the more relevant agent of biological damage as depth increases. In contrast, this contribution to the present dose at the surface amounts to only 7.7%.
5. Estimates of Biological Effects and the PP Extinction
The PP event qualifies as a mass extinction by one quantitative analysis (Melott and Bambach, 2014), but analysis here is complicated by the fact that there were a number of simultaneous changes, including a marine megafaunal extinction (Pimiento et al., 2017), extinction of bivalves in the western Atlantic area (Stanley, 1986), and extinctions, vegetation changes, and hominid evolution in Africa (deMenocal, 2004).
Causes generally associated with PP are climate change (many glaciations and a generally cooler climate in the Pleistocene) and the closing of the Isthmus of Panama as North and South America joined. The latter caused changes in ocean currents, affecting temperatures and nutrient levels in the Caribbean and western Atlantic Ocean. It also caused an exchange of fauna between North and South America. The two had evolved in isolation from one another, and many extinctions occurred as species out-competed one another. Deforestation in northeast Africa may have been related to climate change. For all these reasons, evaluation of effects from the SN is complicated. The possible rise on the ionization levels on the atmosphere due to the increased CR flux caused by the SN explosion may possibly be connected to climate change (Svensmark et al., 2017), but this is a controversial claim. Here, we are concerned with the effects of the muons.
Muons normally constitute a variable ∼10% of the radiation dose on the ground. Figure 2 shows that this dose goes up by more than two orders of magnitude as a result of secondaries from the supernova cosmic rays (SNCRs). The dose from various sources to organisms in the ocean should be less than that on land, due to the short range of various emissions. Alpha particles from 22Rn, a primary source on land, should be reduced. The mass fraction of this isotope in water above the thermocline (about the top kilometer) is comparable with that in air (Broecker et al., 1967). The muons, which are highly penetrating, will constitute a relatively much larger increase in radiation dose in the upper hundreds of meters of water than they will on land.
There will also be a differential effect based on the size of organisms. Again, most natural radiation is not penetrating, and will constitute a surface effect. Muon irradiation will effectively penetrate any organisms, and so constitute a volume effect. Larger organisms are largely self-shielded from most external natural radiation sources, but not from muons. The larger the organism, the larger will be the relative increase in radiation dose.
Although it can be argued that the muons generally constitute a small increase in the radiation dose inducing mutations and cancer (Melott et al., 2017), large organisms in the top few hundred meters of the ocean will experience a much larger relative increase in radiation dose during the period of SNCR irradiation. It is, therefore, tempting to associate this with the PP megafaunal extinction, which was concentrated in coastal waters (Pimiento et al., 2017). Both large size and a habitat in the upper ocean would constitute high risk factors, as the organisms would experience a greater relative increase in radiation dose from the muons.
Footnotes
Acknowledgments
Research support for ALM was provided by NASA under research grant NNX14AK22G. We thank the referees for their comments helpful in clarifying certain aspects of the article.
Author Disclosure Statement
No competing financial interests exist.
Abbreviations Used
Associate Editor: Norman Sleep