
Abstract
The detection and identification of biosignatures on planetary bodies such as Mars in situ is extremely challenging. Current knowledge from space exploration missions suggests that a suite of complementary instruments is required in situ for a successful identification of past or present life. For future exploration missions, new and innovative instrumentation capable of high spatial resolution chemical (elemental and isotope) analysis of solids with improved measurement capabilities is of considerable interest because a multitude of potential signatures of extinct or extant life have dimensions on the micrometer scale. The aim of this study is to extend the current measurement capabilities of a miniature laser ablation ionization mass spectrometer (LIMS) designed for space exploration missions to detect signatures of microbial life. In total, 14 martian mudstone analogue samples were investigated regarding their elemental composition. Half the samples were artificially inoculated with a low number density of microbes, and half were used as abiotic controls. The samples were treated in a number of ways. Some were cultured anaerobically and some aerobically; some abiotic samples were incubated with water, and some remained dry. Some of the samples were exposed to a large dose of γ radiation, and some were left un-irradiated. While no significant elemental differences were observed between the applied sample treatments, the instrument showed the capability to detect biogenic element signatures of the inoculated microbes by monitoring biologically relevant elements, such as hydrogen, carbon, sulfur, iron, and so on. When an enrichment in carbon was measured in the samples but no simultaneous increase in other biologically relevant elements was detected, it suggests, for example, a carbon-containing inclusion; when the enrichment was in carbon and in bio-relevant elements, it suggests the presences of microbes. This study presents first results on the detection of biogenic element patterns of microbial life using a miniature LIMS system designed for space exploration missions.
1. Introduction
The detection and identification of biosignatures on Mars in situ are important challenges in astrobiology and space science (e.g., Grotzinger et al., 2012; Westall et al., 2015; Vago et al., 2017). A positive detection would have a tremendous impact on the perception of our society, as the question “Is there life beyond Earth?” could be answered, a “research topic” that started with the Viking missions on Mars in the 1970s (e.g., Soffen and Snyder, 1976; Klein, 1978, 1979). Past and current missions have demonstrated that the in situ detection and identification of traces of life on Mars are extremely challenging. A positive detection of life will depend on many different factors, ranging from the selection of the most promising field site, which may host or preserve biomarkers, to the application of sensitive instrumentation with appropriate measurement capabilities.
Recently, the habitability and the potential for biosignature preservation in terrestrial analogues of five key martian environments (hydrothermal spring systems, subaqueous environments, subaerial environments, subsurface environments, and iron-rich systems) were reviewed in detail (Hays et al., 2017). The review demonstrates the complexity of each environment and that a better understanding of currently available space instrumentation is required to determine what can be measured in situ on Mars. Complementary to the achievements of bulk chemical analysis methods conducted in the field sites, sensitive spectroscopic, spectrometric, and imaging instrumentation with micrometer-level spatial resolution are of high interest for future exploration missions. At best, the instrumentation should have the ability to, for example, differentiate biotic and abiotic signatures (Cady et al., 2003; Hays et al., 2017).
Various potential biosignatures and their response to time and change in environment have been discussed in the literature, ranging from organic biomolecules (e.g., amino acids, lipids) to microscopic structures (e.g., microfossils, cherts) (e.g., Boston et al., 2001; Cady et al., 2003; Mustard et al., 2013; Aerts et al., 2014; Marshall et al., 2017; Vago et al., 2017). The Mars2020 Science Definition Team has identified six major groups of signatures of life: organic molecules, minerals, macrostructures and macrotextures, microstructures and microtextures, chemistry, and isotope fractionation (Mustard et al., 2013). Detecting and analyzing microscale structures in situ, textures and chemistry of biological features such as biofilms, microfossils or even single organisms require sensitive measurement techniques that provide spatial resolution at micrometer scale. Instrumentation designed for in situ bulk chemical analysis might not detect micrometer-scale signatures because the specific chemical information of these features is not significant within the surrounding host material.
To date, various laboratory measurement techniques and instrumentation devoted for the detection of signatures of life exist. Biomolecules, such as amino acids or lipids extracted from, for example, meteoritic material, can be analyzed with laboratory instrumentation such as gas chromatography–mass spectrometry (GC-MS), liquid chromatography–mass spectrometry (LC-MS) (Botta et al., 2002; Aerts et al., 2019), or matrix-assisted laser desorption/ionization mass spectrometry (MALDI) instrumentation. Geomatrix-assisted laser desorption/ionization mass spectrometry (GALDI, based on MALDI) coupled to a Fourier transform mass spectrometer (FT-MS) represents an instrumentation that has the measurement capabilities for direct biomolecule detection in mineral matrixes or solids (Scott and Tremblay 2002; Yan et al., 2007; Kotler et al., 2008). Resources needed by such instruments make most of them unsuitable for a space application. However, instrumentation designed for space exploration devoted to the detection of signatures of life has been developed. The Sample Analysis at Mars instrument (SAM, on the Curiosity rover), which is equipped with several GC columns coupled to a quadrupole mass spectrometer (QMS) (Mahaffy et al., 2012), or the Mars Organic Molecule Analyser (MOMA, on ExoMars rover) instrument suite that consists of laser desorption/ionization QMS (Goesmann et al., 2017; Li et al., 2017) are two of the prominent flight instrumentation that are currently employed in space exploration on Mars or will be in the future. Each of these techniques differs in its advantages and drawbacks by means of, for example, detection sensitivity, measurement speed, and spatial resolution. We refer to the provided citations for further details.
In this contribution, we present the current measurement capabilities of a miniature laser ablation ionization mass spectrometer (LIMS) for the detection of elemental signatures of microbial life inoculated in an analogue of martian mudstone. The system used is designed for in situ characterization of the elemental, chemical, and isotope composition of solid samples on planetary surfaces with a high spatial resolution (lateral and vertical resolution at the micro- and nanometer level, respectively) and has proven capabilities identifying, for example, putative micrometer-sized fossil structures embedded in a host mineral matrix (Tulej et al., 2015; Wiesendanger et al., 2018) and mineral phases within geological materials (Neubeck et al., 2015). The measurements conducted for this study demonstrate that identifying single cells is feasible using this instrument by monitoring major biologically relevant elements.
2. Experimental
2.1. Sample material and preparation
The analogue material used in our sample preparation and the microbial inoculation is described in full detail in previous publications (Stevens et al., 2018, 2019). Therefore, only a brief discussion is given below.
The martian analogue mineral matrix, which is the same for all the samples investigated in this study, is an artificially produced martian mudstone analogue (Y-Mars) that is a mixture of powdered commercially available minerals (albite, saponite, augite, magnetite, enstatite, dunite, anhydrite, sanidine, pyrrhotite, and selenite). These minerals were chosen to match in situ measurements of martian drill samples (Vaniman et al., 2014).
In total, 14 samples were investigated by using our LIMS system. Half of the mudstone analogue samples were artificially inoculated with an environmental microbial sample from a lake (cell counting led to a density in the order of 106 cells/cm3). Negative controls with no microbial inoculation were prepared with dry analogue material or with water under the same aerobic or anaerobic atmospheres. Following inoculation and culture under 96% N2/4% CO2 for 9 months, samples were dried and pressed into pellets. The sample pellets were then exposed to different radiation conditions (cobalt-60 gamma ray source), with some samples receiving a dose of 101.5 kGy γ radiation approximating a dose at Mars of 100 Ma under a dose rate at a burial depth of 3 m of 1.8 mGy yr−1. See the work of Stevens et al. (2019) for full details.
Various analytical techniques were used for the characterization of the sample material, including DNA sequencing, bulk analysis mass spectrometry, high-resolution Raman spectroscopy, and Fourier transform infrared spectroscopy. The scientific findings acquired by using these techniques are discussed in detail in the work of Stevens et al. (2019), which concluded that only techniques offering sufficiently high spatial resolution allow for the detection of biological signatures from such samples.
For the LIMS analysis of the samples, the pellets were cut in millimeter-sized pieces and fixed in cavities on two sample holders (H1 and H2) with ultra-high-vacuum compatible copper tape. Sample handling and preparation were conducted in a clean room (ISO 5) to avoid environmental contamination. Figure 1 shows the two sample holders with the accommodated samples. Table 1 gives an overview of the sample material investigated by using the LIMS system including sample treatment. For biologically cultured materials (samples on sample holder H1), multiple samples were prepared per treatment, which is represented by the number given in the acronym (e.g., AN3I). Samples not listed were used with other analytical techniques (Stevens et al., 2019).
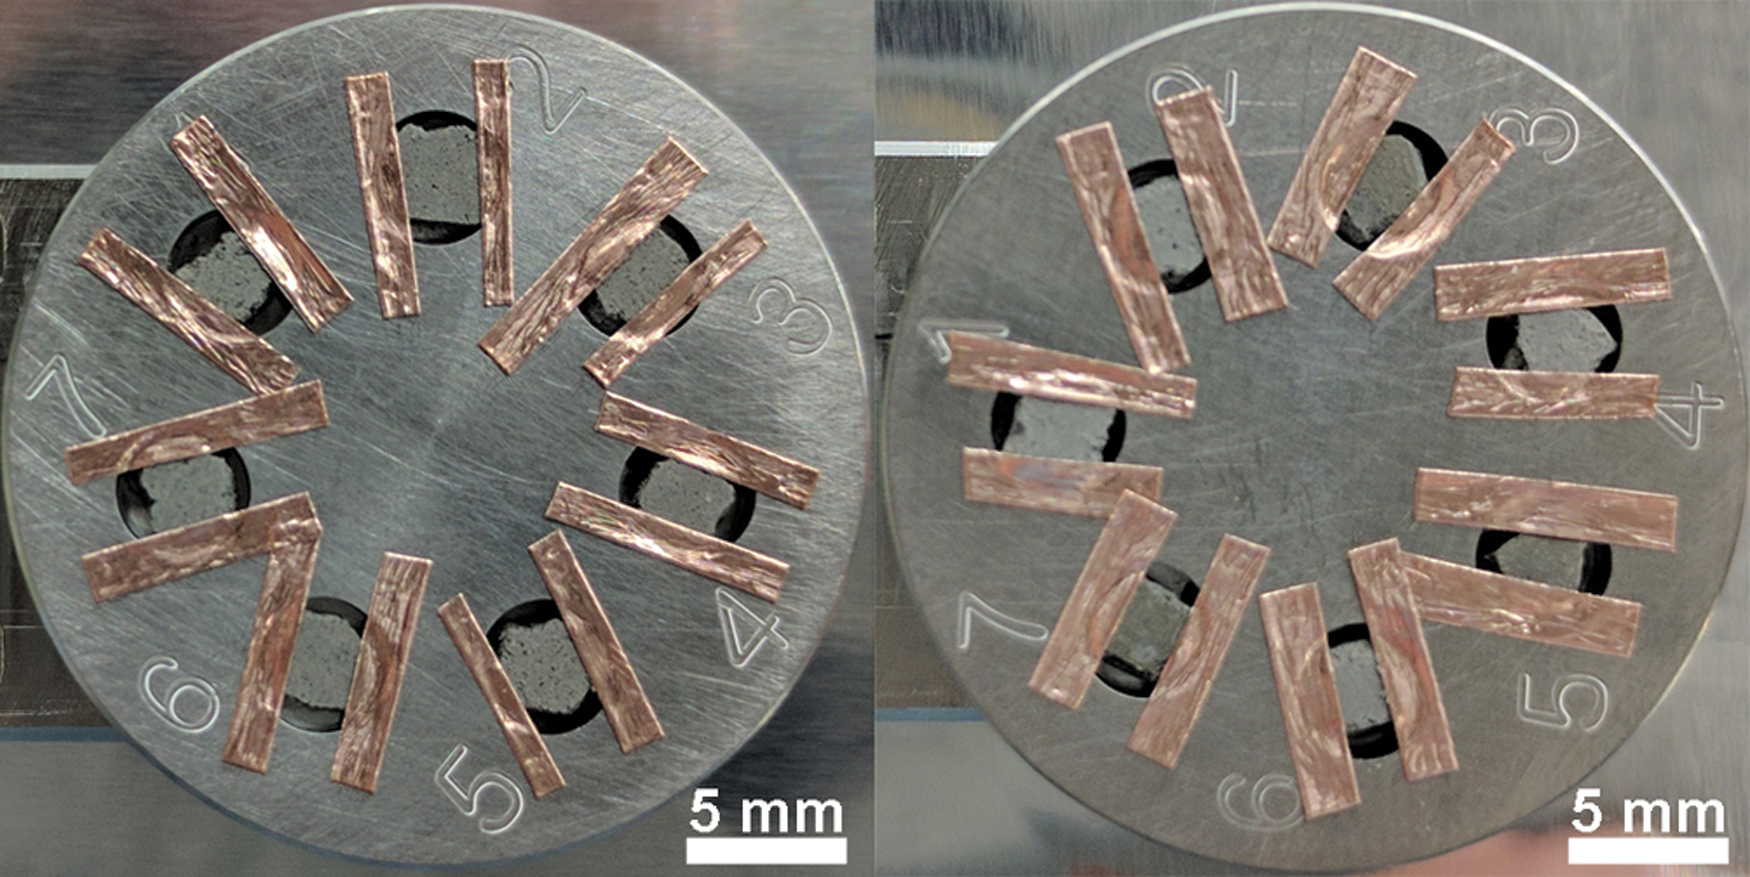
Two LIMS sample holders are shown with the mudstone analogues installed. The materials were cut with a surgical blade in fragments of millimeter dimensions and fixed on the sample holders with ultra-high-vacuum compatible tape. A total of 14 different samples were measured, where half of the analogue materials contained microbes at low concentrations (on the order of ∼106 cells/cm3). Color images are available online.
Investigated Sample Material and Sample Treatment
AE = aerobic; AN = anaerobic; D = dry; I = irradiated; U = un-irradiated; W = wet.
After LIMS analysis, energy dispersive X-ray (EDX) spectroscopy measurements (Hitachi, S300N instrument, working distance ∼17.1 mm, acceleration voltage 25 kV, image size 512 × 384 px) were conducted on three samples (H1S2, H1S3, and H1S6, randomly selected) to investigate the porosity (voids) and chemical homogeneity of the mudstone analogues. In Fig. 2, element maps of O, Al, and Si (other element maps show the same characteristics) are shown of the sample H1S2. Some localized voids due to sample porosity are clearly visible. In case a void appears directly at the surface and has dimensions close to the spot size (10–20 μm) and focal depth (up to about 100 μm, pulse energy dependent) of our focused laser beam, a reduced signal is recorded with our system. In those cases, the measurement was repeated at the same instrument setting at a new and fresh sample location. Further, while the element maps of Al and Si show a high chemical homogeneity of the samples, there are a few locations with slightly increased O. The latter may point to single mineral grains that may still be present in the martian analogue material. Such mineral inclusions result in a temporally increased signal intensity of mineral-specific elements when using LIMS (Neubeck et al., 2015).
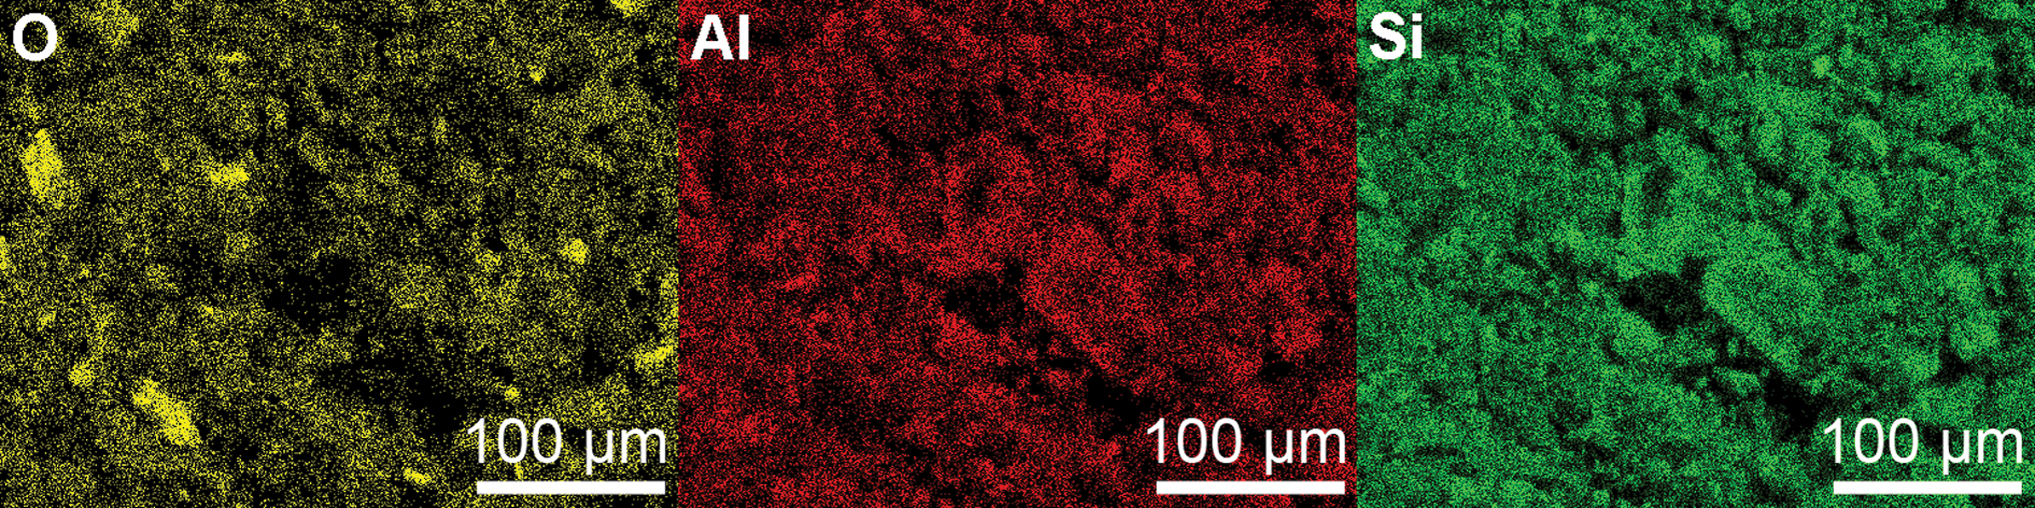
EDX measurements of sample H1S2 after LIMS measurements. From left to right, the elemental maps of O, Al, and Si are shown. Color images are available online.
2.2. LIMS measurement protocol
The measurement principles and figures of merit of the miniature LIMS system used in this study are discussed in detail in previous publications (Riedo et al., 2013a, 2013b; Grimaudo et al., 2015, 2017; Neubeck et al., 2015; Tulej et al., 2015; Wiesendanger et al., 2017, 2018). Therefore, only a brief description of the system is given in the following.
The LIMS system consists of a miniature (160 mm × Ø 60 mm) reflectron-type time-of-flight (R-TOF) mass spectrometer that is coupled to a femtosecond laser system (λ = 775 nm, pulse width of ∼190 fs, 1 kHz laser pulse repetition rate) used for ablation and ionization of sample material (Riedo et al., 2013a, 2013b). The mass spectrometer is located inside a vacuum chamber with a typical base pressure at the mid 10−8 mbar level. The laser system is located outside the vacuum chamber, and a beam guiding system is used for beam delivery to the mass spectrometer. A lens system installed just above the mass spectrometer, inside the vacuum chamber, allows focusing the laser pulses through the mass spectrometer toward the sample surface to spot sizes with a diameter in the range of about 10–20 μm (depending on sample material and applied laser pulse energy). The sample holders are placed on a 3D translation stage with a position accuracy of ∼2 μm. A microscope camera system with resolving power of 1 μm allows accurate positioning of the samples below the mass spectrometer (Wiesendanger et al., 2018). Each laser pulse induces material ablation and ionization, and only positively charged species can enter the mass spectrometer. After acceleration, confinement, and focusing of the ions toward the field-free drift path, the ions are reflected at the ion mirror toward the detector system (Riedo et al., 2017) by passing a second time the field-free drift path. Therefore, for each laser pulse applied to the sample surface a full time-of-flight (TOF) spectrum is recorded. The ions arrive in time sequences at the detector system according to their mass-to-charge ratio (time-of-flight measurement principle, separation occurs in the field-free drift paths), and a quadratic equation m(t) = k 0 (t - t 0)2 is used for the conversion between TOF and mass spectrum, where k 0 and t 0 are fit constants (Riedo et al., 2013a). A high-speed analogue-to-digital-converter card is used for signal acquisition (2 channels, each with a sampling speed of up to 2 GS/s, 8 bit vertical resolution). An in-house written software suite (Matlab) is used for the conversion between TOF to mass spectra and subsequent data analysis. A detailed description of the software can be found in a previous publication (Meyer et al., 2017).
As the primary goal of this study was the detection of elemental signatures of microbial cells within the mudstone analogue, the same measurement methodology based on spot-wise chemical depth profiling was used as developed earlier for the same LIMS instrument (Grimaudo et al., 2015). This measurement protocol has previously been applied to successfully identify fossil structures of micrometer dimensions in a host mineral matrix by monitoring biologically relevant elements (Tulej et al., 2015; Wiesendanger et al., 2018), mineral phases in geological sample by monitoring mineral-specific elements (Neubeck et al., 2015), and layering structures of nanometer dimensions containing residues of additives used in the electroplating processes (Riedo et al., 2015; Moreno-García et al., 2016). In this measurement protocol, a number of TOF spectra (here 500) are accumulated first on board by the data acquisition system and subsequently saved as one file on the host computer. In this study, at each instrument setting 60,000 laser shots were applied on a new sample location, resulting in 120 accumulated TOF files. Each file represents a layer of ablated sample material, and in total tens of micrometers are ablated with this number of total laser shots, depending on the laser power used (Tulej et al., 2015). By using this measurement principle, a laser irradiance campaign (2.0, 2.4, 2.8, 3.3, 4.0, 4.7, and 5.2 TW/cm2) was conducted on each sample, corresponding to applied laser pulse energies measured at sample surface of ∼0.7–1.7 μJ, that allows the identification of optimal conditions in terms of signal-to-noise ratio and mass resolution of recorded spectra. Measurements conducted at laser irradiances in the range of 2.4–4.7 TW/cm2 (corresponding to pulse energies within ∼0.8–1.6 μJ) showed best measurement results and were used for subsequent data analysis.
3. Results
3.1. Bulk chemical analysis
The chemical depth profiling procedure discussed in the previous sections allows us not only to have spatially resolved chemical information of the investigated sample but also to have a bulk view of the chemical composition by accumulating a large number of such files from the same surface position (e.g., Neuland et al., 2014). Small variations in signal intensities, due to, for example, sample morphology and local mineralogy, are averaged out by this procedure, which increases the reliability and representability of chemical information for the bulk matrix. This accumulation of a large number of such files was conducted to investigate whether any differences between the sample treatments could be observed (wet to dry, anaerobic to aerobic, irradiated to un-irradiated).
In Fig. 3, a typical overview, bulk-like mass spectrum for the mass range of interest—carbon to iron—of sample H2S6 (abiotic, dry, un-irradiated) is shown. Here, the mass spectrum is an accumulation of 71 files, which corresponds to a total accumulation of 35,500 single mass spectra (71 × 500 mass spectra). Spectra that showed a poor mass resolution were removed (Wiesendanger et al., 2019).
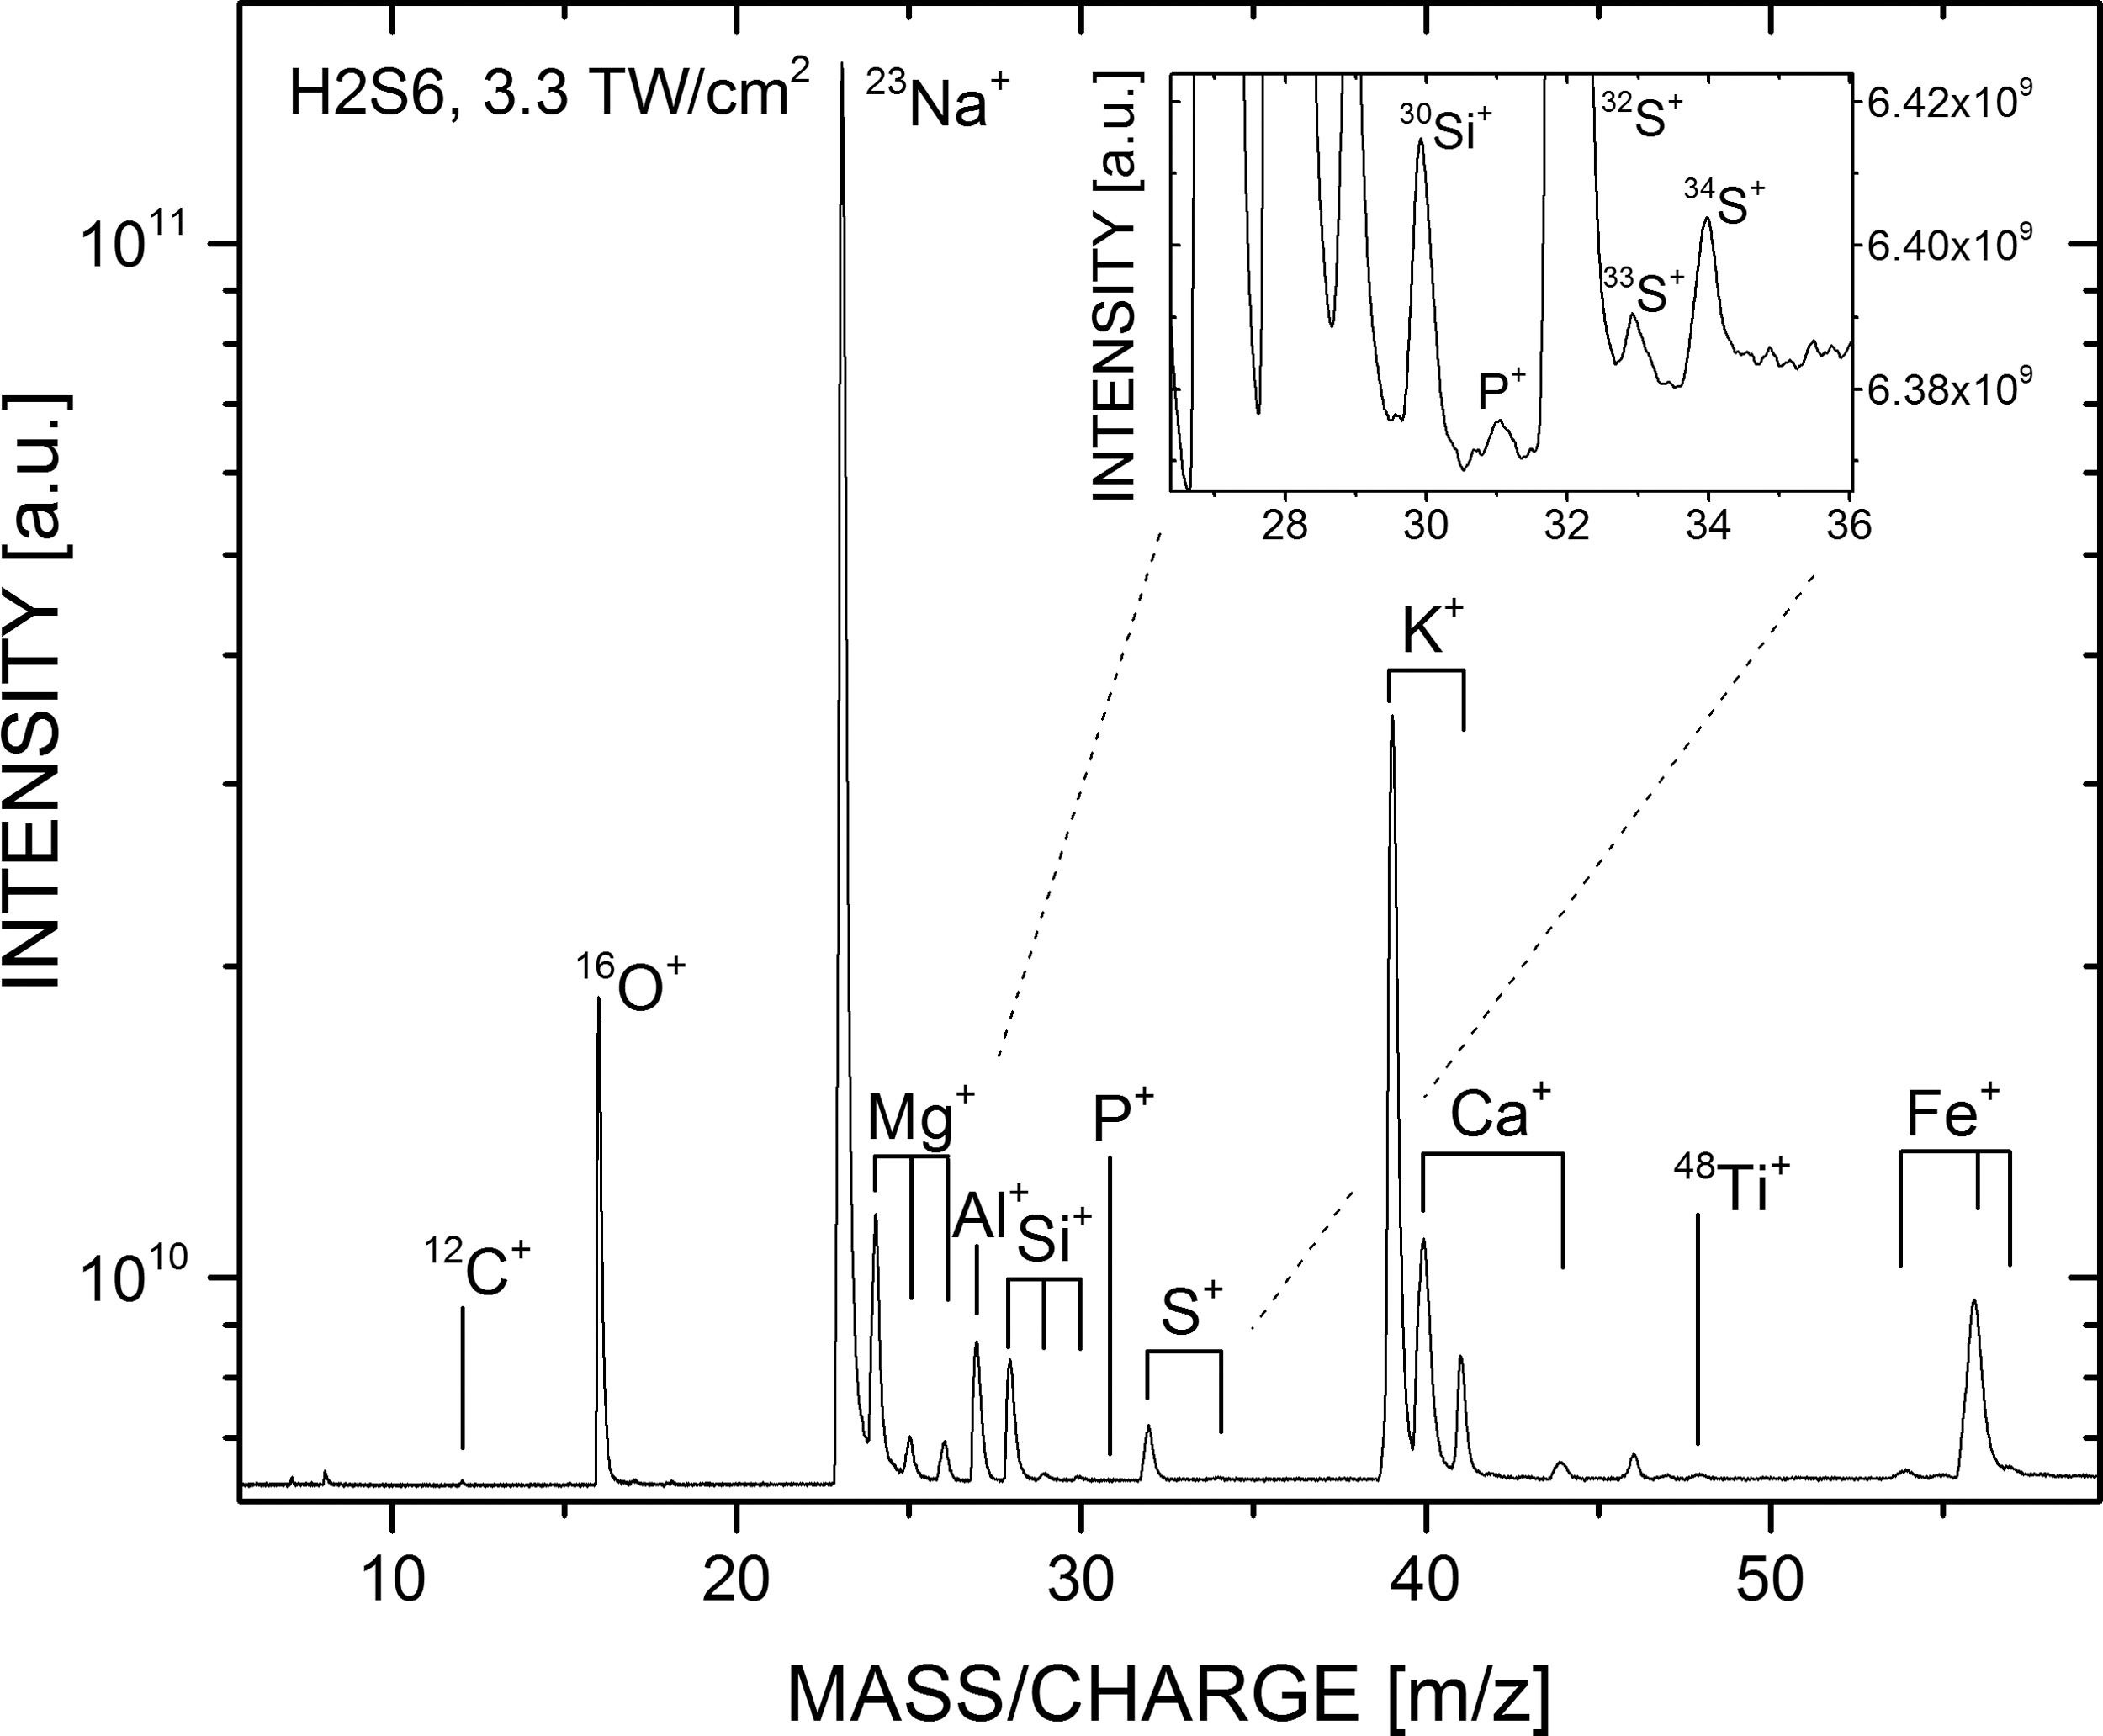
Typical bulk-like overview mass spectrum of the martian analogue matrix (sample H2S6) showing the mass range of interest between the elements carbon and iron. Here, the shown mass spectrum is an accumulation of 71 files, each consisting of 500 spectra, which results in a total compilation of 35,500 LIMS spectra. In the inset, showing the mass/charge range of ∼27–36, phosphorus with an abundance of ∼60 ppm (at. fract.) is clearly visible.
3.2. Identification of carbon-rich layers
In analytical measurement techniques that involve laser ablation ion sources, for example, laser-induced breakdown spectroscopy (LIBS), laser ablation ionization mass spectrometry (LIMS), or laser ablation inductively coupled mass spectrometry (LA-ICP-MS), shot-to-shot signal variations are expected (e.g., Cui et al., 2012; De Bonis et al., 2014; Gutierrez-Gonzalez et al., 2015). Such variations may arise from various factors, including instability of the used laser system, sample morphology and porosity (voids), and local variations in chemical composition. Fortunately, in the instrument setup used in this study, the factor “laser stability” is negligible, as the system has an excellent pulse-to-pulse energy stability at the per mill level. Therefore, changes in the observed signal intensities can be attributed to changes in the morphology and chemistry of the investigated sample.
Contrary to the bulk chemical analysis of the mudstone analogue sample shown in Fig. 3, the advantage of the chemical depth profiling measurement methodology is demonstrated in Fig. 4. Here, intensity variations of a subset of user-defined elements within a recorded file range of ∼50–110 are shown. Note that each file represents the accumulated mass spectrum of a layer of sample material ablated by 500 laser shots; for each laser shot, a TOF spectrum is recorded, and the spectra accumulation is realized on board the data acquisition system. When using this measurement procedure, regions of scientific interest can be identified, and the subset of measured data can be used to further investigate the local chemical composition; contributions from the mudstone analogue material can be therefore reduced. At around file number 76, a carbon-rich layer is identified where carbon shows about a tenfold increase in comparison to the surrounding mudstone host material.
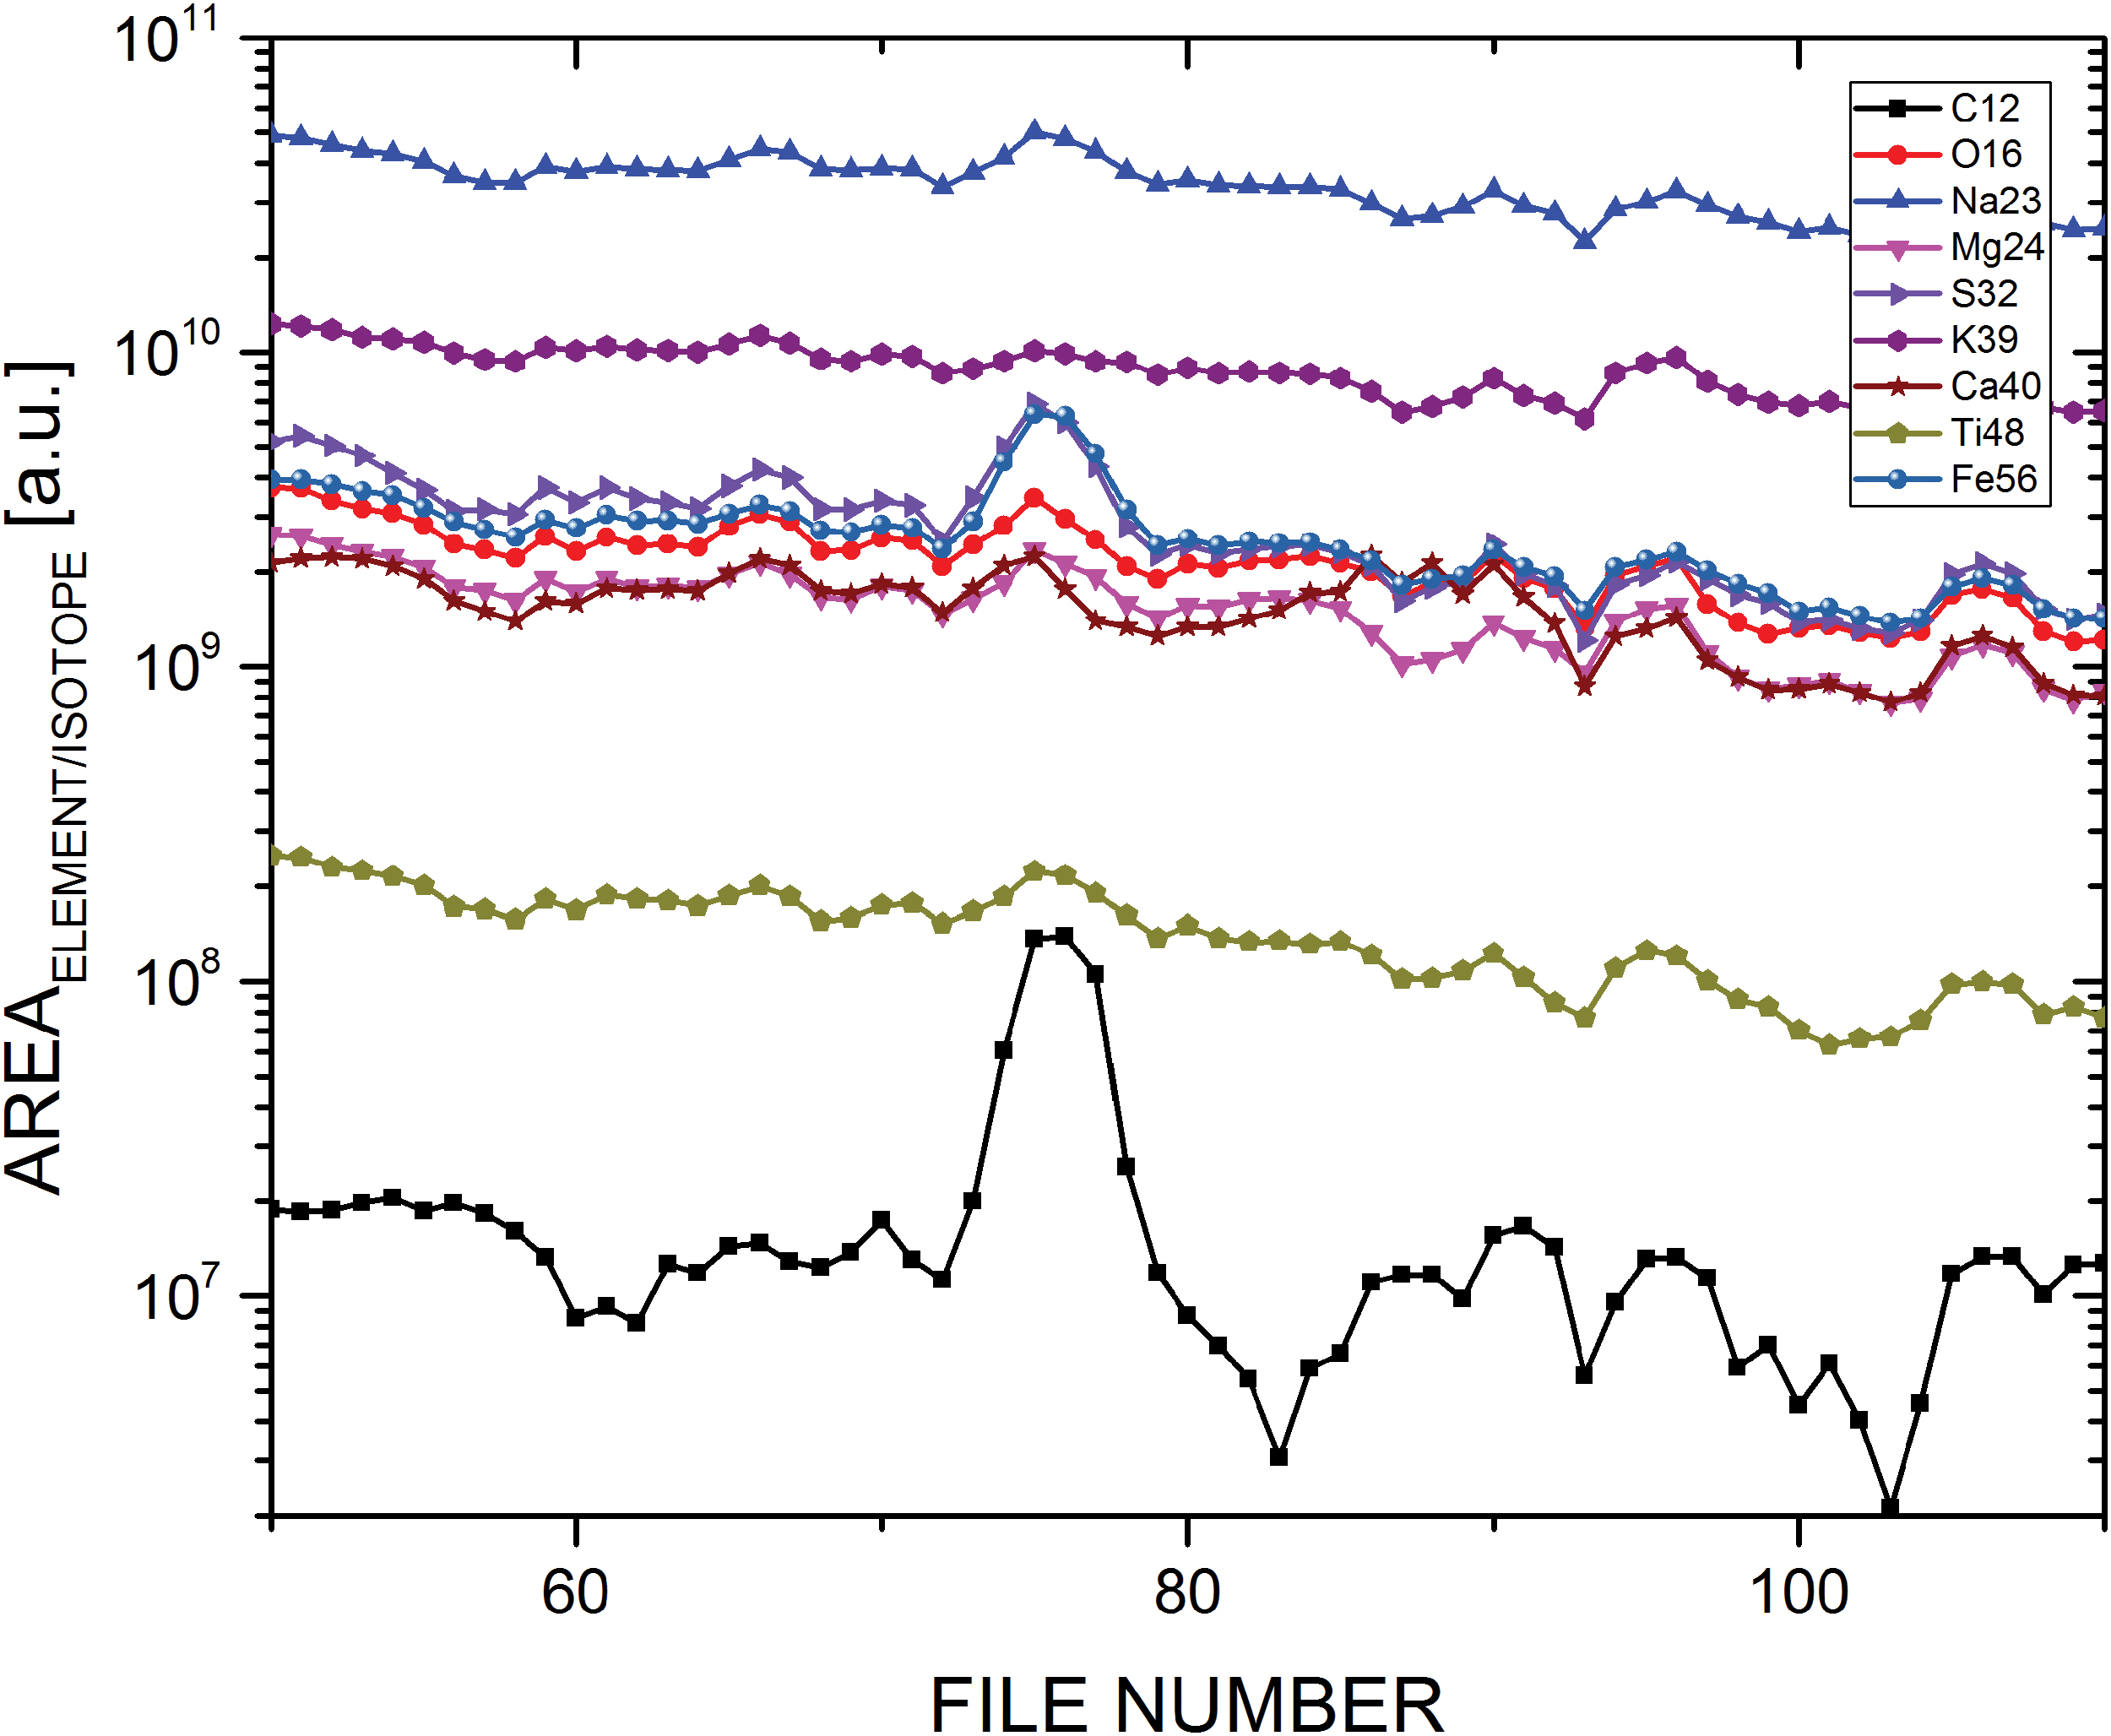
Peak area variations of a group of elements measured in sample H1S6 as function of depth, i.e., the recorded file number. Slight abundance variations for the elements are expected, given the heterogeneous nature of the sample, but around file number 76 carbon shows a tenfold increase in intensity. For elements such as S, Fe, and to a lesser extent O, a significant increase can be observed as well whereas the other elements stay almost constant (note the logarithmic scaling). This element monitoring allows the identification of regions of interest, here a carbon-rich layer. Color images are available online.
The mass spectrum for a carbon-rich layer described in Fig 4. is shown in Fig. 5. In red (pointing downward) the mass spectrum of the layer enriched in carbon is shown, whereas in black solid and orange dashed (both pointing upward) the mass spectra of the surrounding mudstone analogue, above and below the observed carbon-rich layer (accumulation of 10 layers), are displayed for comparison. To compensate for any signal intensity variation induced by laser ablation and to account for the reduced recorded signals of the carbon-rich layer (only one layer in comparison to the 10 layers of the matrix), the three displayed spectra are normalized to Na. In this carbon-rich layer, only a significant increase of carbon can be observed, whereas in comparison to the surrounding host material, the other elements remain at about the same level. Moreover, note that the spectra of the analogue material measured above and below the carbon-rich layer are almost identical, which illustrates the stability of our LIMS measurements.
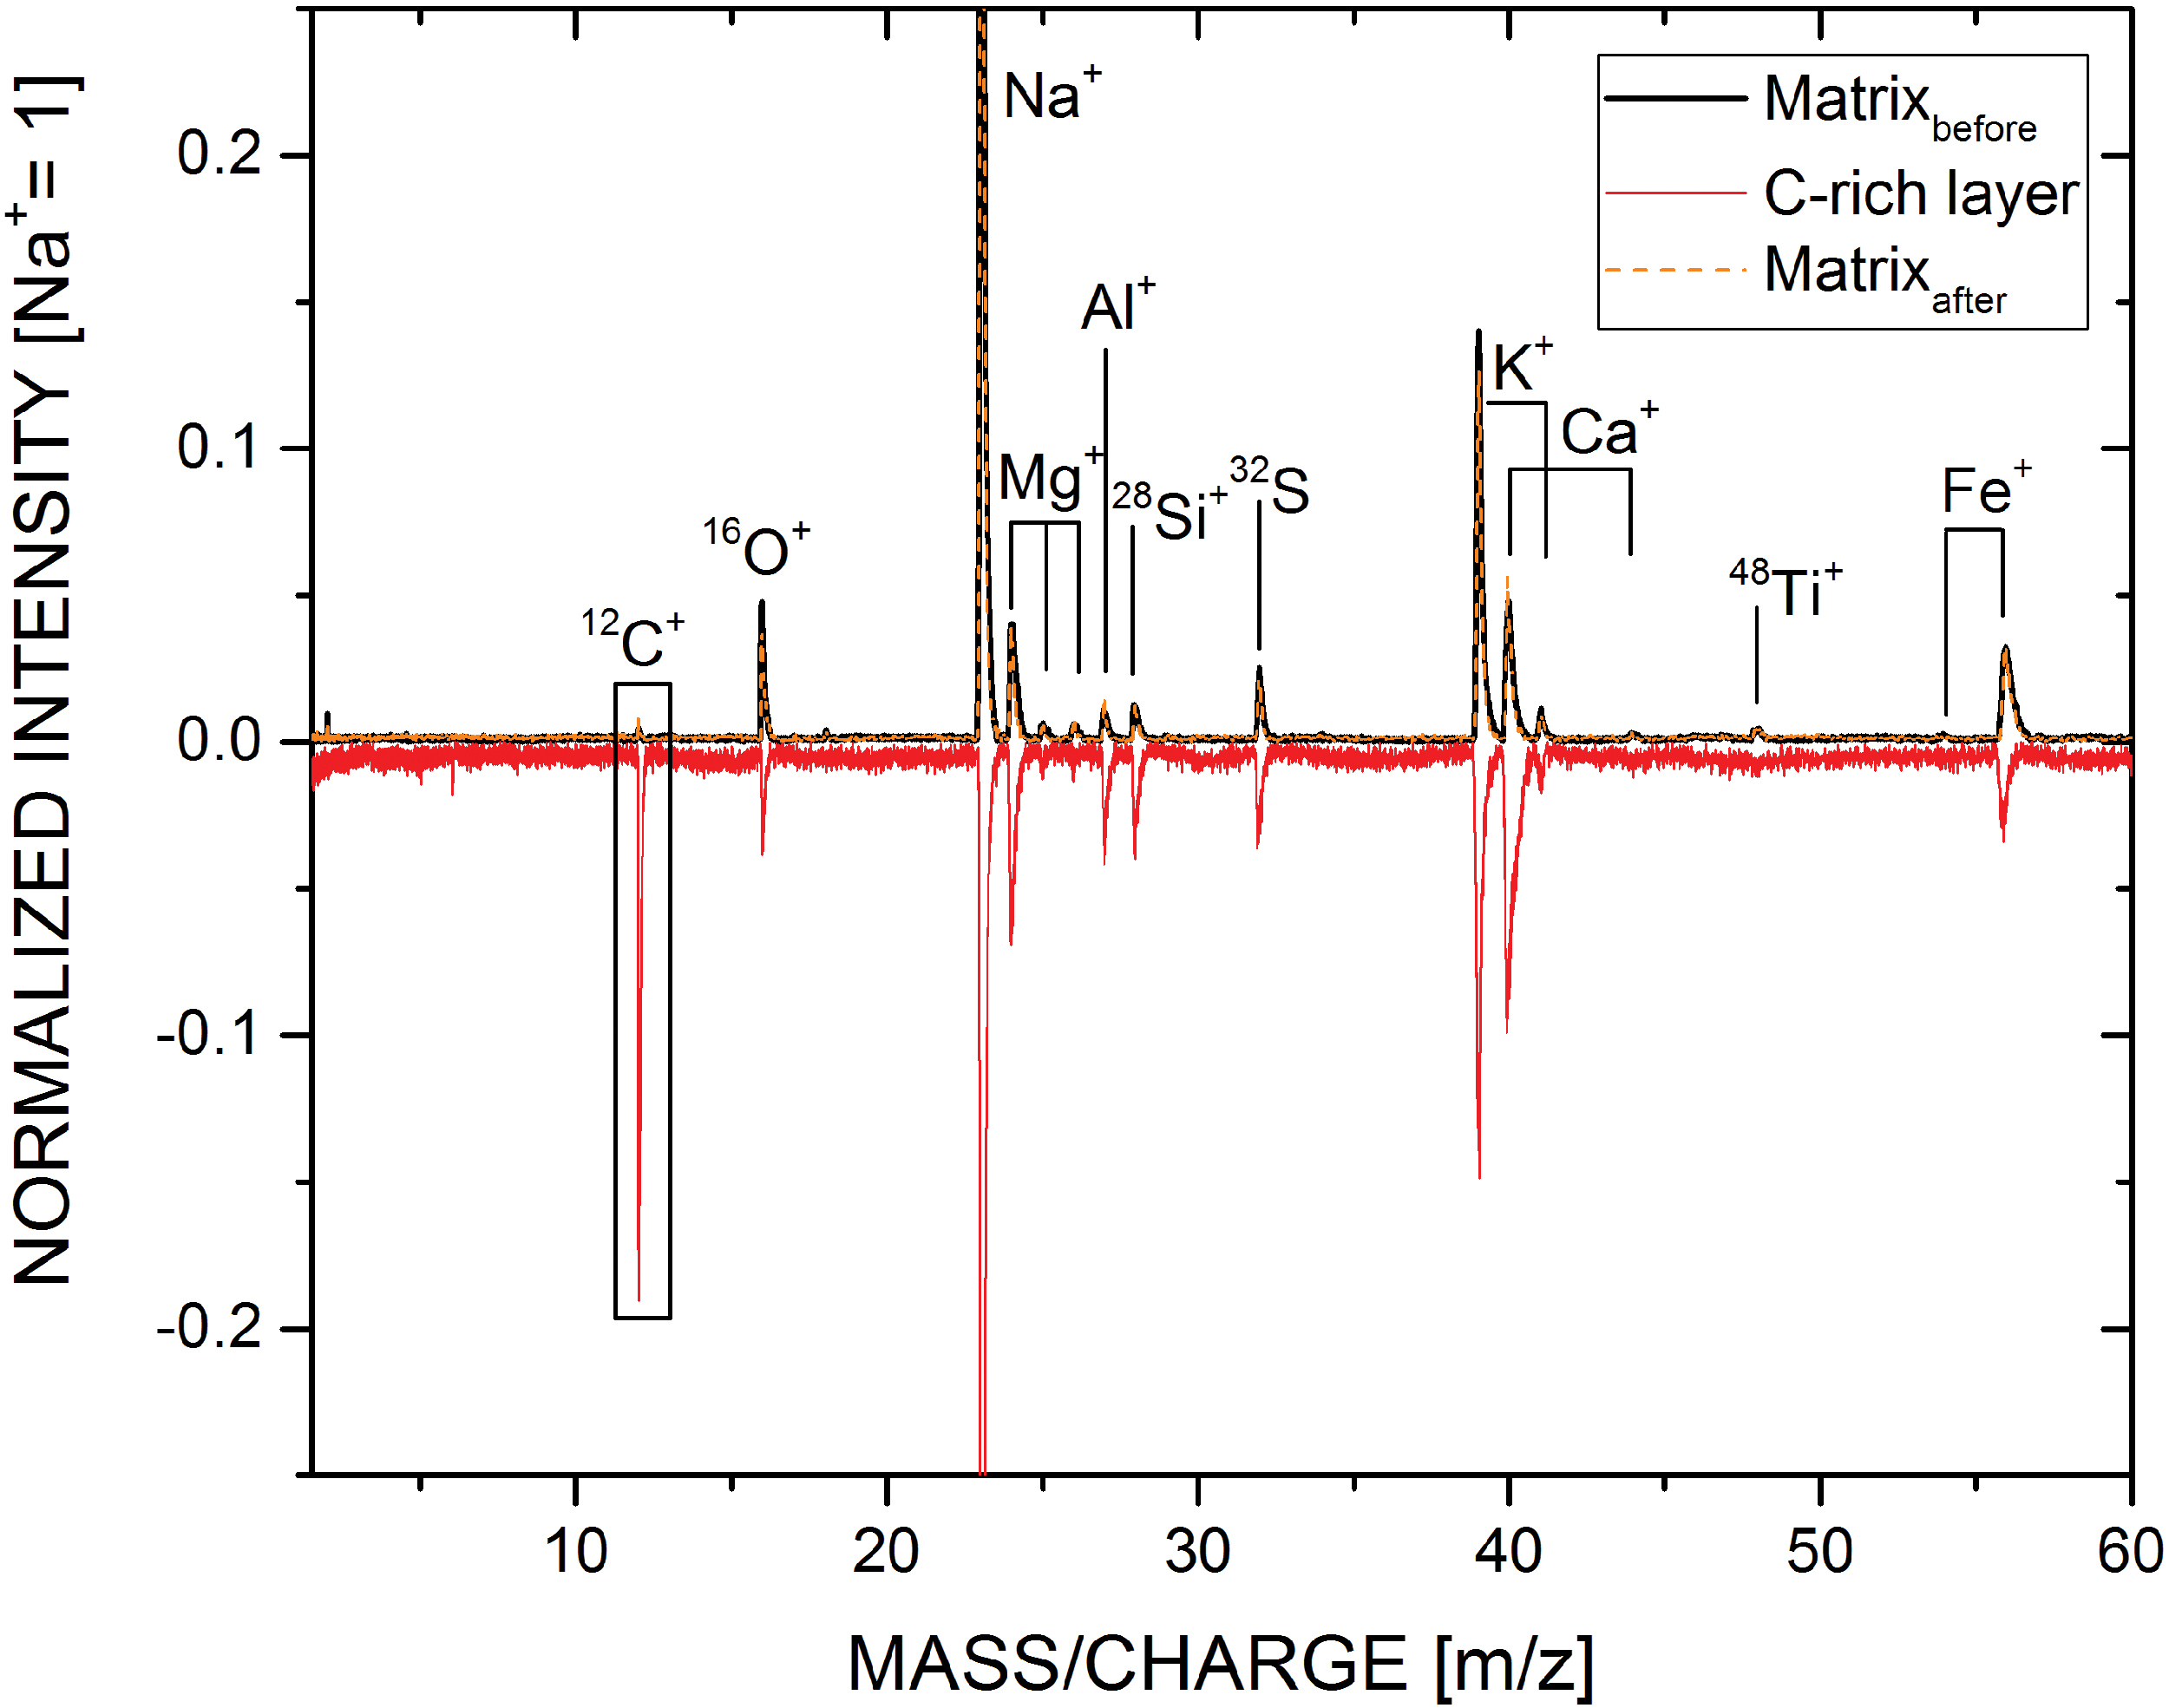
Mass spectra of a carbon-rich layer (red line, pointing downward) identified in sample H2S6 (abiotic sample, anaerobic, dry, un-irradiated) and of surrounding analogue material (black solid line: accumulation of 10 files above carbon-rich layer; orange dashed line: accumulation of 10 files below carbon-rich layer) are shown. Here, only a significant increase of carbon can be observed whereas the intensities of the other elements remain about the same level. Color images are available online.
3.3. Identification of biologically relevant inclusions
In Fig. 6, a mass spectrum from another carbon-rich layer is shown. Similar to Fig. 5, the carbon-rich layer (red) and the surrounding analogue (black and orange) are displayed, and all spectra are normalized to Na. Again, both spectra of analogue material measured above and below the carbon-rich layer agree with each other, and no significant differences in element intensities were observed. For the parts of the mass spectrum shown for the low abundant elements N and P (right two panels), a moving average filter with fixed window size (30 data points) was used for noise filtering. In comparison to the carbon-rich layer shown in Fig. 5, biologically relevant elements such as hydrogen, nitrogen, phosphorus, and sulfur showed a significantly increased intensity in this measurement.
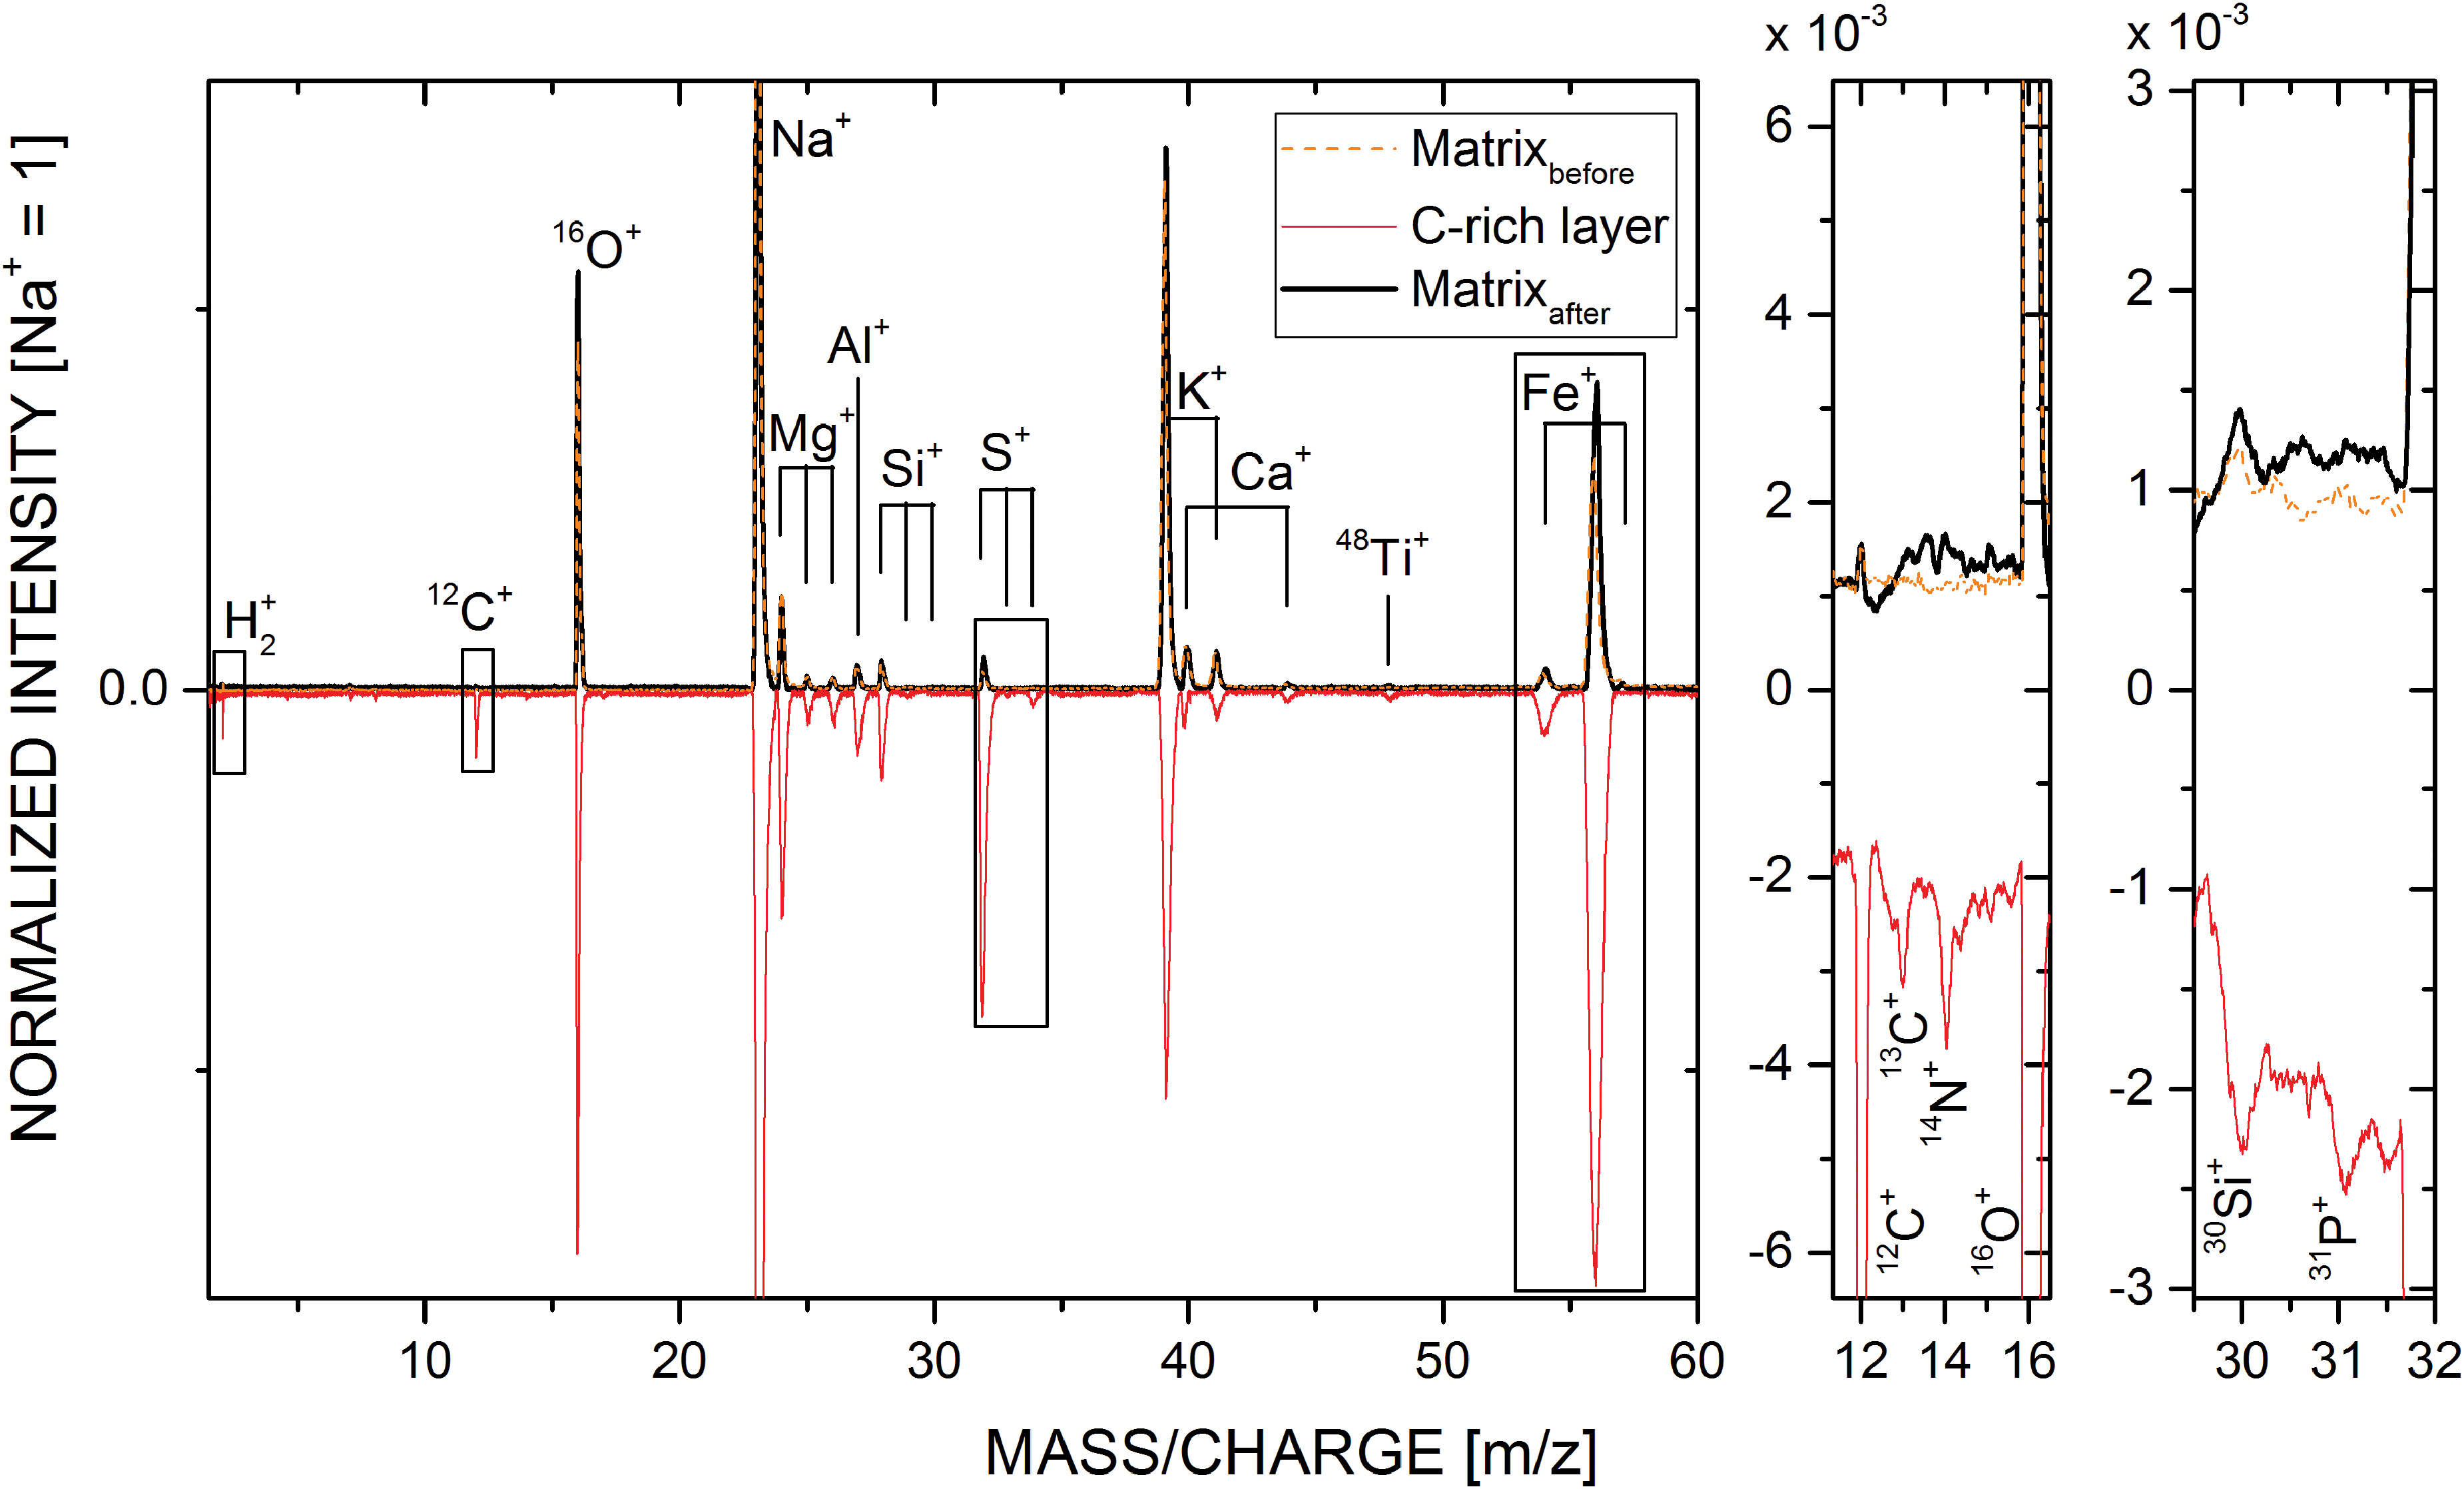
Mass spectra of a carbon-rich layer (red line, pointing downward) where a simultaneous increase of biologically relevant elements such as H, N, P, S, and Fe is observed. Upward (black solid and orange dashed lines) the mass spectra of 10 and 9 accumulated layers above and below the carbon-rich layer, respectively, are displayed for comparison. Note the high measurement reproducibility of both analogue spectra; no significant deviations in other elements can be observed. Sample investigated: H1S5 (biotic sample, anaerobic, un-irradiated). Color images are available online.
In Fig. 7, the intensity variations of a subset of elements of the special case of the detection of two subsequent biotic layers are shown. Here, layers 2 and 4 correspond to the putative biotic layers, while layers 1 (accumulation of 10 layers above carbon-rich layer), 3 (accumulation of 9 layers between carbon-rich layers), and 5 (accumulation of 10 layers below second carbon-rich layer) correspond to the surrounding analogue material. Further information can be found in the Discussion section below.
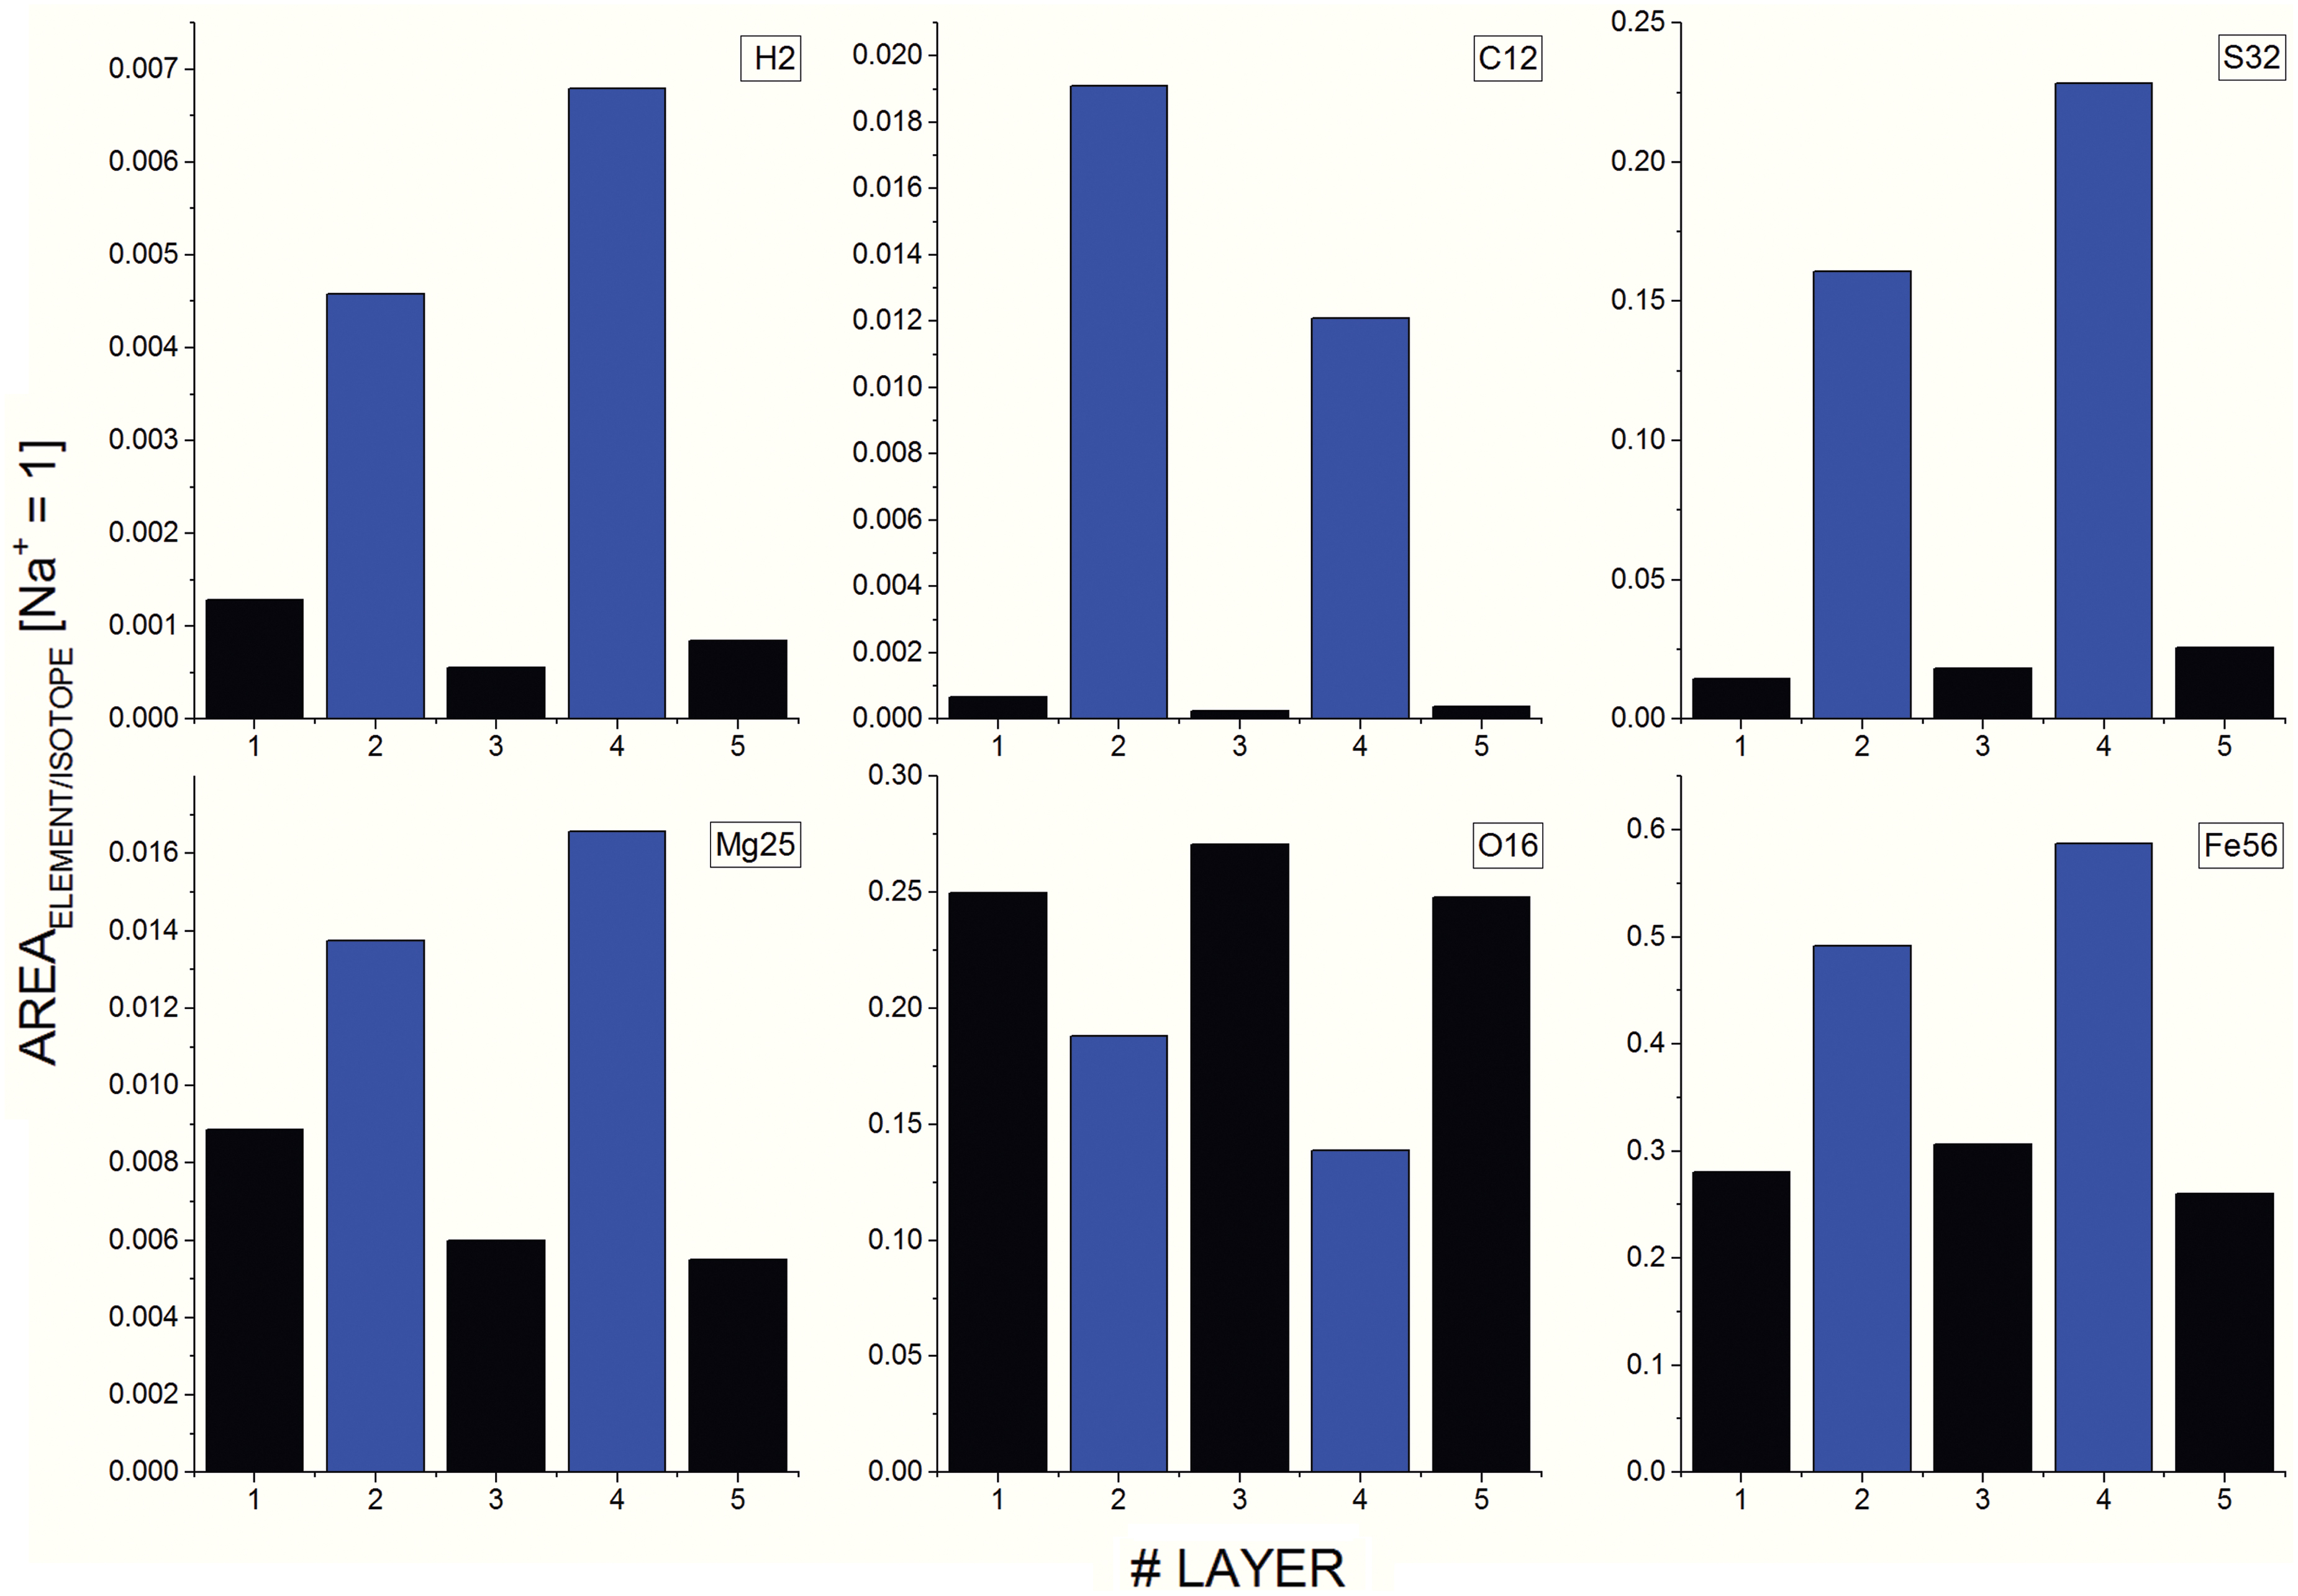
Intensities of biologically relevant elements, H, C, S, Mg, O, and Fe of abiotic (black) and biotic (blue) layers are shown. All but O follow the same trend of increased abundances at biotic layers. Sample investigated: H1S5 (biotic sample, anaerobic, un-irradiated). Color images are available online.
4. Discussion
4.1. Bulk chemical analysis and sample treatment
The kinetic energy distribution of ions generated during the ablation process or changes thereof and space charge effects (sample surface charging and/or columbic repulsion effects) limit the mass resolution of a recorded TOF spectrum. In this study, the local porosity of the material or the formation of the laser ablation crater affects the geometry of the induced plasma plume and therefore the mass resolution of recorded spectra in certain cases. Mass spectra showing a poor mass resolution were not considered for the accumulated spectrum shown in Fig. 3. In the accumulated mass spectrum shown in Fig. 3, which represents a bulk chemical analysis of the host, all major to minor elements, such as O, Si, to Fe, are detected. The spectral data revealed that even the trace elements at the part-per-million level, such as phosphorus with around 60 ppm abundance (atomic fraction, at. fract.) (see inset) could be detected.
No significant differences in the elemental composition of the samples when using different sample treatments were observed. Comparing wet and dry sample treatments, no increased H or O abundance was observed, as expected; since the measurements were conducted under ultra-high-vacuum conditions (at the 10−8 mbar level), all remaining residual water in the mudstone analogue should have evaporated before initiation of the measurements. The same holds for the case of anaerobic and aerobic sample handling: no significant difference in the abundance of O was detected. Moreover, gaseous oxygen is not expected to change the atomic element composition of the mudstone analogue, which is in line with our observation. Further, no significant changes in elemental abundances were observed for the irradiated analogs. This is expected as the radiation source may induce only element isotope fractionation. However, no significant isotope fractionation was observed in a previous study on irradiated and not-irradiated martian mudstone sample material when using state-of-the-art isotope ratio measurement techniques (Stevens et al., 2019).
4.2. Identification of carbon-rich layers
The decreasing trend in element peak areas of elements shown in Fig. 4 with increasing depth can be attributed to a decreased ablation rate with depth and reduced probability for ions to leave from the base of the ablated crater (Grimaudo et al., 2018). The variations superimposed on the general decreasing trend were attributed to local changes in sample morphology, including physical and chemical characteristics. Similar to observations made in a previous study (see Tulej et al., 2015), each recorded file corresponds to an ablated sample layer with a thickness of a few hundred nanometers (depending on laser pulse energy). For in situ application of the depth profiling protocol, precise quantification of ablation rate with depth can be realized with measurements conducted on reference materials that mimic the chemical and physical composition of the analyzed sample and sophisticated methods for crater analysis (Grimaudo et al., 2018). Complementary measurement techniques that are typically on board a spacecraft, such as the CheMin X-ray diffraction instrument on Curiosity (Blake et al., 2012), could pre-assess the material and enable a strategy for switching to optimal measurement settings for subsequent analysis using LIMS.
As the main goal of this study was the localization of microbial life in the sample, we chose the element carbon for data screening, as this element is abundant in bacterial life and is not supposed to be present in the mudstone analogue used in this study (see minerals used to simulate the martian mudstone). In Fig. 4 (note the logarithmic scale) where element intensity variations along sample depth are displayed, we observed an increase in signal intensity of carbon of about ten times at file number 76, when compared to the measurements acquired above and below the localized region with the increased carbon signal. For elements such as S and Fe, and to a lesser extent for O, an increased signal was observed as well but not at the same order of magnitude. Other major elements, such as Ti and K, did not show a deviation in signal intensity in file number 76, but rather remained at relatively constant signal intensity throughout the measurement. Note that the observed peak-like shape in Fig. 4 is the result of a moving average with a fixed window size of 3, which was applied for easier identification of such localized signal increase. The significant increase of carbon signal points to a location in the sample highly enriched in carbon. Since the laser pulses are focused to spot sizes of about 20 μm in diameter, an object with significantly different chemical composition that is localized within the ablated layer can introduce such a deviation in signal intensity. However, carbon enrichment alone is not enough to assign this inclusion to a biological origin. For a conclusive interpretation of this carbon-rich layer, the chemical composition of this layer needed to be investigated in more detail; for example, can specific biorelevant elements with an increased intensity be observed as well.
In Fig. 5, the mass spectrum of this carbon-rich layer is shown. As can be clearly observed, carbon is the only element significantly increased relative to the surrounding analogue material, and other element intensities remained about the same. As no significant changes in other element intensities were observed, the mass spectrum of this carbon-rich layer may represent a carbon grain inclusion rather than a local inhomogeneity of the analogue material.
4.3. Identification of biologically relevant inclusions
In Fig. 6, the mass spectrum of another carbon layer is shown. In comparison to the spectrum shown in Fig. 5, however, we observed a significant increase of a suite of biologically relevant elements, which included H, S, and Fe. Careful inspection of the mass spectrum shows an increase in the less abundant elements such as N and P as well (see the two panels to the right). In total, eight such layers significantly enriched in carbon in comparison to the analogue material were identified (like in Figs. 5 and 6) during the conducted measurements. We could not identify a significant trend between sample treatments, such as wet or dry, anaerobic or aerobic, or the applied laser pulse energy. Further, the identified carbon-rich layer showed no systematic appearance at a certain layer, neither within the sample nor at the sample surface (e.g., carbon-rich layers were identified at layers 22 and 71 in samples H1S1 and H1S6, respectively). Carbon-rich layers identified at the sample surface could have been attributed to sample surface contamination during sample preparation or handling. Of these eight cases, five were found in biotic samples, whereas the remaining three were detected in abiotic samples. Figure 6 shows a typical case for the biotic sample material, whereas Fig. 5 shows a typical case for an abiotic sample.
For the carbon-rich layers detected in samples that contained microbial communities, four out of five showed a significant and simultaneous increase of major and minor biologically relevant elements, such as H, O, S, and Fe (Wackett et al., 2004). In the fifth case, the abundance of H, C, S, and Fe are observed to increase simultaneously, while O decreased slightly. This behavior might be explained by the oxygen-rich surrounding analogue material (XRD measurements showed atomic fractions at the level of ∼60%), which could give the impression of a decreasing oxygen content. In all abiotic samples, only a significant increase of carbon was observed, while all other elements stayed constant in comparison to the surrounding mudstone analogue. This means that no false positive (detection of microbial life in an abiotic sample) was made.
Knowing that the martian analogue materials for all investigated samples were identical and that the only difference between biotic and abiotic samples was the presence of microbes, the consistency of finding layers with significantly increased abundances of biologically relevant elements exclusively in analogues containing microbes already strongly implies that biological material was detected reliably. Furthermore, the number of positive detections, assuming that each detection represents a single microbe, is close to the occurrence of microbes within the sample material (in the order of around 106 cells/cm3) and the number of conducted measurements. In total, four measurements were conducted on each biotic material (at four different pulse energies); on each biotic sample a total volume of about 4 × 10⁻⁷ cm3 was investigated (for crater diameter of ∼20 μm, depth of about 50 μm, lateral distance between each measurement on the sample surface was 100 μm). Therefore, a total volume of ∼2.8 × 10⁻⁶ cm3 over all biotic materials was investigated. In that estimated ablated volume around 2–3 cells should be detected, which compared well with our five detections for life. This low number of positive detections is further in line with a complementary study comparing various analysis methods (Stevens et al., 2019), which reported that bulk measurement techniques, including mass spectrometry for bulk analysis, showed no indications of microbes at the same concentration. Only spatially resolved sensitive measurement techniques like high-resolution Raman spectroscopy, and here LIMS, identified a biogenic signature. It is interesting to note that if we would accumulate all of our mass spectra in one final mass spectrum, that is, emulating bulk analysis, we also would not see biogenic signatures. On the other hand, we might assume that the observed elemental pattern belongs to a carbon-containing mineral. However, we screened the mineral database mindat.org in search of minerals containing the elements with a significant increase (here H, C, S, Fe; O is not included as it showed in one sample a slightly decreasing trend, see comments above) and found only minerals containing additional other specific elements, such as Zn, which do not match our observations. In Fig. 7, the intensity variations of a subset of elements of the special case of the detection of two subsequent biotic layers are shown. In the top row, the intensities of the most significant elements H, C, and S are displayed. The variations between both biotic and abiotic layers can be clearly observed in these elements, and the element intensities detected for both layer types are highly reproducible in view of the nature of these samples. In the second row, the intensities of Mg, O, and Fe are displayed. The elements Mg and Fe follow the same trend as the elements H, C, and S, which is expected since they participate in the chemistry of living organisms. However, and as stated earlier in the text, O shows a consistent, though opposite, trend by means of a decreased element abundance in the biotic layer. This observation may be attributed to the fact that O is highly abundant in the analogue material at about ∼60% (atomic fraction), whereas in biotic material the O abundance is about 20%, and thus the overall measured abundance appears to be lower. A similar trend is observed for K (i.e., a decrease of K in the carbon-rich layer, see Fig. 6), which can be attributed to the lower K abundance in microbes compared to the mineral analogue. Thermal diffusion effects, which may lead to the diffusion of elements, for example, oxygen in the microbes, into the surrounding material are not expected to occur as a result of femtosecond laser irradiation. The temporal width of femtosecond laser pulses is significantly below the timescale of the phonon frequency, which is one of the reasons why material ablation is more confined than for longer pulsed systems, such as a nanosecond laser system (see, e.g., Hergenröder et al., 2006; LaHaye et al., 2015).
5. Conclusions
Past and current in situ space exploration missions devoted to the detection of biogenic signatures of extinct or extant life on Mars have shown that identifying organic signatures is extremely challenging. Multi-instrument efforts are required to provide conclusive results and distinguish whether a potentially detected signature is biological in origin or was produced by geochemical processes. Various laboratory studies have further shown the necessity of sensitive measurement techniques that provide information on the chemical composition of solids with high spatial resolution at the micrometer level. Biosignatures, or remnants of life, can be expected at these spatial dimensions, including, for example, fossilized cellular remnants.
In this contribution, martian mudstone analogues that were exposed to wet or dry, anaerobic or aerobic, irradiated or un-irradiated, and abiotic or biotic conditions were chemically (elements) analyzed with a spatial resolution at the micrometer level by using a miniature LIMS system designed for in situ space exploration. Whereas no significant differences in the element composition between different sample treatments were identified, we demonstrated that the chemical depth profiling measurement protocol allowed the identification and distinction of biotic and abiotic carbon-rich layers within the investigated sample material. In abiotic layers, a significant increase of carbon was detected, whereas the other elements remained constant in concentration (consistent with the surrounding analogue material). In biotic layers, the signal intensities of various biologically relevant elements, including, for example, H, C, N, S, increased simultaneously. The knowledge that the only difference between biotic and abiotic samples is the presence of microbes at low number density strongly implies that microbial life was detected. Furthermore, the number of biotic detections is in line with the estimated density of microbes expected to be detected in the analyzed material. Therefore, knowledge of the chemical composition of the martian analogue (considered as background, averaging over the entire measurement campaign) and a potential observation of a simultaneous increase of elements associated with biology resulted in a reliable in situ identification of microbial life in such sample material.
These detections were only possible because of the high detection sensitivity of the miniature LIMS system coupled with the measurement capability to chemically investigate a solid with a spatial resolution at the micrometer level. For future studies, it is planned to investigate potential isotope signatures of biologically relevant elements to complement the elemental analysis discussed in this contribution. Nevertheless, the presently accomplished capability is highly promising for the detection of microbial life at micrometer dimensions on planetary surfaces. A measurement suite that combines high-resolution imaging and chemical composition analysis at micrometer level, such as the presented LIMS system, would be advantageous for future space exploration missions devoted to the detection of signatures of life at micrometer dimensions.
Footnotes
Acknowledgments
A.R. acknowledges support from the European Union's Horizon 2020 research and innovation programme under the Marie Skłodowska-Curie grant agreement No. 750353. P.W. acknowledges support by the Swiss National Science foundation (SNSF). A.H.S. and C.S.C. were supported by Science and Technology Facilities Council grant No. ST/R000875/1.
Author Disclosure Statement
No competing financial interests exist.