
Abstract
The Mars 2020 Perseverance rover landed on February 18, 2021, and has started ground operations. The ExoMars Rosalind Franklin rover will touch down on June 10, 2023. Perseverance will be the first-ever Mars sample caching mission—a first step in sample return to Earth. SuperCam and Scanning Habitable Environments with Raman & Luminescence for Organics & Chemicals (SHERLOC) on Perseverance, and Raman Laser Spectrometer (RLS) on Rosalind Franklin, will comprise the first ever in situ planetary mission Raman spectroscopy instruments to identify rocks, minerals, and potential organic biosignatures on Mars' surface. There are many challenges associated when using Raman instruments and the optimization and quantitative analysis of resulting data. To understand how best to overcome them, we performed a comprehensive Raman analysis campaign on CanMars, a Mars sample caching rover analog mission undertaken in Hanksville, Utah, USA, in 2016. The Hanksville region presents many similarities to Oxia Planum's past habitable conditions, including liquid water, flocculent, and elemental compounds (such as clays), catalysts, substrates, and energy/food sources for life. We sampled and conducted a complete band analysis of Raman spectra as mission validation analysis with the RLS ExoMars Simulator or RLS Sim, a breadboard setup representative of the ExoMars RLS instrument. RLS Sim emulates the operational behavior of RLS on the Rosalind Franklin rover. Given the high fidelity of the Mars analog site and the RLS Sim, the results presented here may provide important information useful for guiding in situ analysis and sample triage for caching relevant for the Perseverance and Rosalind Franklin missions. By using the RLS Sim on CanMars samples, our measurements detected oxides, sulfates, nitrates, carbonates, feldspars, and carotenoids, many with a higher degree of sensitivity than past results. Future work with the RLS Sim will aim to continue developing and improving the capability of the RLS system in the future ExoMars mission.
1. Introduction
One of the most recent developments to explore other planets has been the rover missions. These agile exploration platforms can help us establish the local geological context, geochemistry, and seek evidence of past or present life (Williford et al., 2018). The identification and quantification of geologic features, minerals, and organic material are of particular interest (Williford et al., 2018; Edwards et al., 2021). Finding signs of possible life requires comprehensive knowledge of the depositional context of the local geology (Vítek et al., 2014; Hughes et al., 2019).
Raman spectroscopy is a nondestructive vibrational spectroscopy method used extensively to identify minerals on Earth. It can provide the “fingerprint” of a mineral in many cases (Sharma et al., 2003).
Raman spectroscopy has also been applied to the detection of organic materials for astrobiological purposes (Jones et al., 1985; Dickensheets et al., 2000; Schopf et al., 2002; Pasteris and Wopenka, 2003; Marshall et al., 2010; Eshelman et al., 2014; Jehlička et al., 2014; Beegle et al., 2015; Lalla et al., 2016, 2019; Stromberg et al., 2019). These capabilities make it a favorable technique to use in planetary exploration. Raman spectroscopy has been implemented as part of the National Aeronautics and Space Administration (NASA's) Mars 2020 Perseverance rover mission in the Scanning Habitable Environments with Raman & Luminescence for Organics & Chemicals (SHERLOC) and SuperCam (Wiens et al., 2020; Maurice et al., 2021) instruments. Raman spectroscopy is also part of the Pasteur payload on the upcoming European Space Agency's (ESA) ExoMars mission—the Raman Laser Spectrometer (RLS) instrument (Rull et al., 2017).
The interpretation of Raman spectroscopy data often requires sophisticated statistical methods (Lopez-Reyes, 2015). Moreover, Raman spectroscopy, like many analytical tools, has specific operational and design requirements, which have to be respected to ensure its success on mission payloads.
To study the synthesis of information obtained by using multiple instruments, various analog mission simulations have been conducted in recent years, in which aspects of future missions have been tested (Edwards et al., 2013; Wiens et al., 2016; Sauro et al., 2018; ESA, 2019; Osinski et al., 2019). Analog mission studies have contributed to decisions for subsequent robotic and crewed missions.
In this work, we have analyzed 10 samples collected during the CanMars mission—a Mars analog mission conducted in Hanksville, Utah, USA, in 2015–2016 (Osinski et al., 2019; Stromberg et al., 2019)—using the RLS ExoMars Simulator (RLS Sim). The RLS Sim is a laboratory breadboard designed at the University of Valladolid (UVa), Spain, that emulates the capabilities of the ExoMars' Sample Preparation and Distribution System (SPDS) (Lopez-Reyes et al., 2013; Lopez-Reyes, 2015) and the combined working conditions with other instruments in the Analytical Laboratory Drawer (ALD).
Like the RLS system for ExoMars, the RLS Sim uses a continuous wavelength laser at 532 nm, a spot size of 50 μm with an autofocus system in a range of 1 mm (minimum), and a laser irradiance on the target around 0.5 kW/cm2. The RLS uses a 2048 × 512 pixels CCD cooled down by means of a Thermoelectric cooling device and covers the spectral Raman shift from ∼150 to 3800 cm−1 with an average spectral resolution of ∼7 cm−1. Furthermore, the RLS will measure at least 20 points randomly selected on the surface of the powdered samples (Rull et al., 2017). During the mission, the RLS operational concept analyses that RLS can perform are (1) autonomous operation (spots chosen randomly), (2) taking target inputs from the MicrOmega instrument, or (3) a combination of the above two approaches.
The analysis strategy will consider the sample's nature and the rover's available resources (energy, time, and data bandwidth). The RLS automated routines will adjust to the operational modes and parameters decided by human operators on the Earth for each particular measurement or standard procedure (Rull et al., 2017).
The RLS Sim can provide mineralogical, geochemical, and biochemical information of the samples under study to help validate the RLS for planetary exploration (Lopez-Reyes et al., 2021). We compare the results obtained from the RLS analysis on the suite of samples from the CanMars mission with previous Raman spectroscopy, reflectance spectroscopy, and sample compositions determined by X-ray diffractometry, laser-induced breakdown spectroscopy (LIBS), and X-ray fluorescence (XRF) spectroscopy (Stromberg et al., 2019). Konstantinidis et al. (2020) subsequently carried out an LIBS quantification using a linear mixture model developed by Konstantinidis et al. (2019a) from LIBS spectra obtained by the LIBS Raman Sensor (LiRS) system.
Section 2 presents a brief geological description of the test site, a summary of the collected samples, and an overview of the Raman instrument. Section 3 discusses the spectra and the determinations resulting from the RLS measurements. Lastly, Section 4 addresses the results from the preceding section in a martian context. An additional goal of using the RLS system was to provide new mineral information on the CanMars samples. Finally, we used the RLS system to provide insights into the abilities of Raman spectroscopy for detecting and characterizing organics in the samples.
2. Background
2.1. ExoMars mission and RLS
The Rosalind Franklin rover is part of the astrobiology program established by ESA to search for life in the solar system, particularly for past martian life (Vago et al., 2017). The Rosalind Franklin rover mission will also demonstrate new technologies and provide results that may inform the selection of samples for the Mars sample return (MSR) collaboration between ESA and NASA (Muirhead et al., 2020). Among the main capabilities of the mission, the in situ technologies developed include (1) entry, descent, and landing onto the surface of Mars, (2) a novel surface mobility system, (3) access to the subsurface to acquire samples with a drilling unit having a 2 m reach and an infrared (IR) downhole reflectance spectrometer (Mars Multispectral Imager for Subsurface Studies: Mars multispectral imager for martian subsurface [Ma_MISS]), and (4) sample acquisition, preparation, distribution, and analysis unit—the ALD, equipped with several instruments, including the RLS system.
Some other scientific instruments on the Rosalind Franklin rover are as follows: (1) Panoramic Camera (PanCam)—a high-resolution camera with wide-angle, stereo, and monoscopic cameras; (2) Infrared Spectrometer for ExoMars (ISEM)—a point spectrometer coregistered with PanCam; (3) Ma_MISS; (4) CloseUp Imager (CLUPI)—a camera that will provide the context and texture of the sample core before crushing it;—instruments of the ALD; (5) MicrOmega (visible+near infrared [VIS+IR] spectrometer); and (6) Mars-Organic Molecule Analyzer (MOMA)—a gas chromatography, laser desorption/mass spectrometry (GCMS/LDMS). The three ALD instruments—MicrOmega, RLS, and MOMA—can perform onboard collaborative science to analyze the samples in the exact same spots (Pilorget and Bibring, 2014; Rull et al., 2017; Vago et al., 2017; Lopez-Reyes et al., 2020). The RLS instrument will perform Raman spectroscopy on powdered samples inside the ALD. For details of the RLS unit, see Rull et al. (2017).
The UVa developed the RLS Sim breadboard with which it is possible to perform experiments with the rover methodology framework and address scientific and technical requirements. The RLS Sim is capable of simulating ExoMars' SPDS, and RLS combined functions under laboratory conditions. The basic configuration of the RLS Sim is an XYZ positioning system equipped with an optical head on the Z-axis and a refillable sample container attached to the XY positioners enabling automatic analysis (Lopez-Reyes and Rull Pérez, 2017).
The RLS Sim system relies on automatic functions, such as spectra acquisition, autofocus, smart positioning, automatic positioning, and analytical procedure. The automatic mode is a dynamic methodology that can be (re)programmed to fit each experiment's needs and fulfill the necessities of combined analysis with the other instruments from the ALD (Lopez-Reyes and Rull Pérez, 2017). To this end, the automatic mode of the RLS Sim automatically performs positioning, autofocus, fluorescence monitorization, and elimination by using a dedicated fluorescence spectrometer to collect a fluorescence spectrum, acquisition parameter adjustment (an algorithm to optimize the spectrum acquisition quality), and spectrum acquisition (Lopez-Reyes and Rull Pérez, 2017; Veneranda et al., 2020a).
2.2. Oxia Planum
The selected landing site for the ExoMars mission is Oxia Planum, located in the lower part of an extensive clay-bearing plain, nearly 300 km across, straddling the crustal dichotomy on the margins of Chryse Planitia (Fairén et al., 2010; Vago et al., 2018). The large phyllosilicate-bearing units have been crater-dated at 4.1–4.0 Ga—from the (middle to late) Noachian period. They are overlain by a 3.9 Ga delta fan and capped a much younger, 2.5 Ga, dark, resistant unit. The region contains a rich geological history, including volcanic activity and alteration of volcanic material, which has resulted in large deposits of clay-rich mineralization, all indicating the presence of water (Vago et al., 2017).
These wet environments could have resulted in prolonged habitable conditions where the biosignatures might have been preserved if life had been present. The prevailing layered, phyllosilicate-bearing units constitute the main target of interest, but given the ancient age of the landing site, it is likely that there may have been hydrothermal springs active. The entire region was buried under many tens of meters of sediments, which have been denuded by wind erosion. It is in the subsurface deposits that possible molecular biosignatures may have been preserved against the planet's extreme conditions, such as radiation and oxidation (Vago et al., 2018).
The region to be investigated by the Rosalind Franklin rover possesses characteristics of habitable conditions suitable for life, including liquid water, flocculent material as loosely aggregated particles, elemental compounds such as clays, and powerful catalysts, substrates, and energy/food sources for life (Fairén et al., 2010; Marzo et al., 2010; Mahaney et al., 2012; Ehlmann and Edwards, 2014; Vago et al., 2018).
2.3. Overview of the CanMars mission
The CanMars Mars Sample Return Analogue Deployment (MSRAD) was a simulated rover mission that utilized the Canadian Space Agency's (CSA) Mars Exploration Science Rover (MESR), depicted in Fig. 1. The MESR was deployed in Hanksville, Utah, USA, at a Mars-analog field site containing features such as fluvial deposits and clay-rich minerals (Osinski et al., 2019). This site was considered for CanMars due to its geomorphological similarities to Jezero crater, NASA's Mars 2020 rover mission landing site, and Oxia Planum (Caudill et al., 2019; Lakdawalla, 2019).
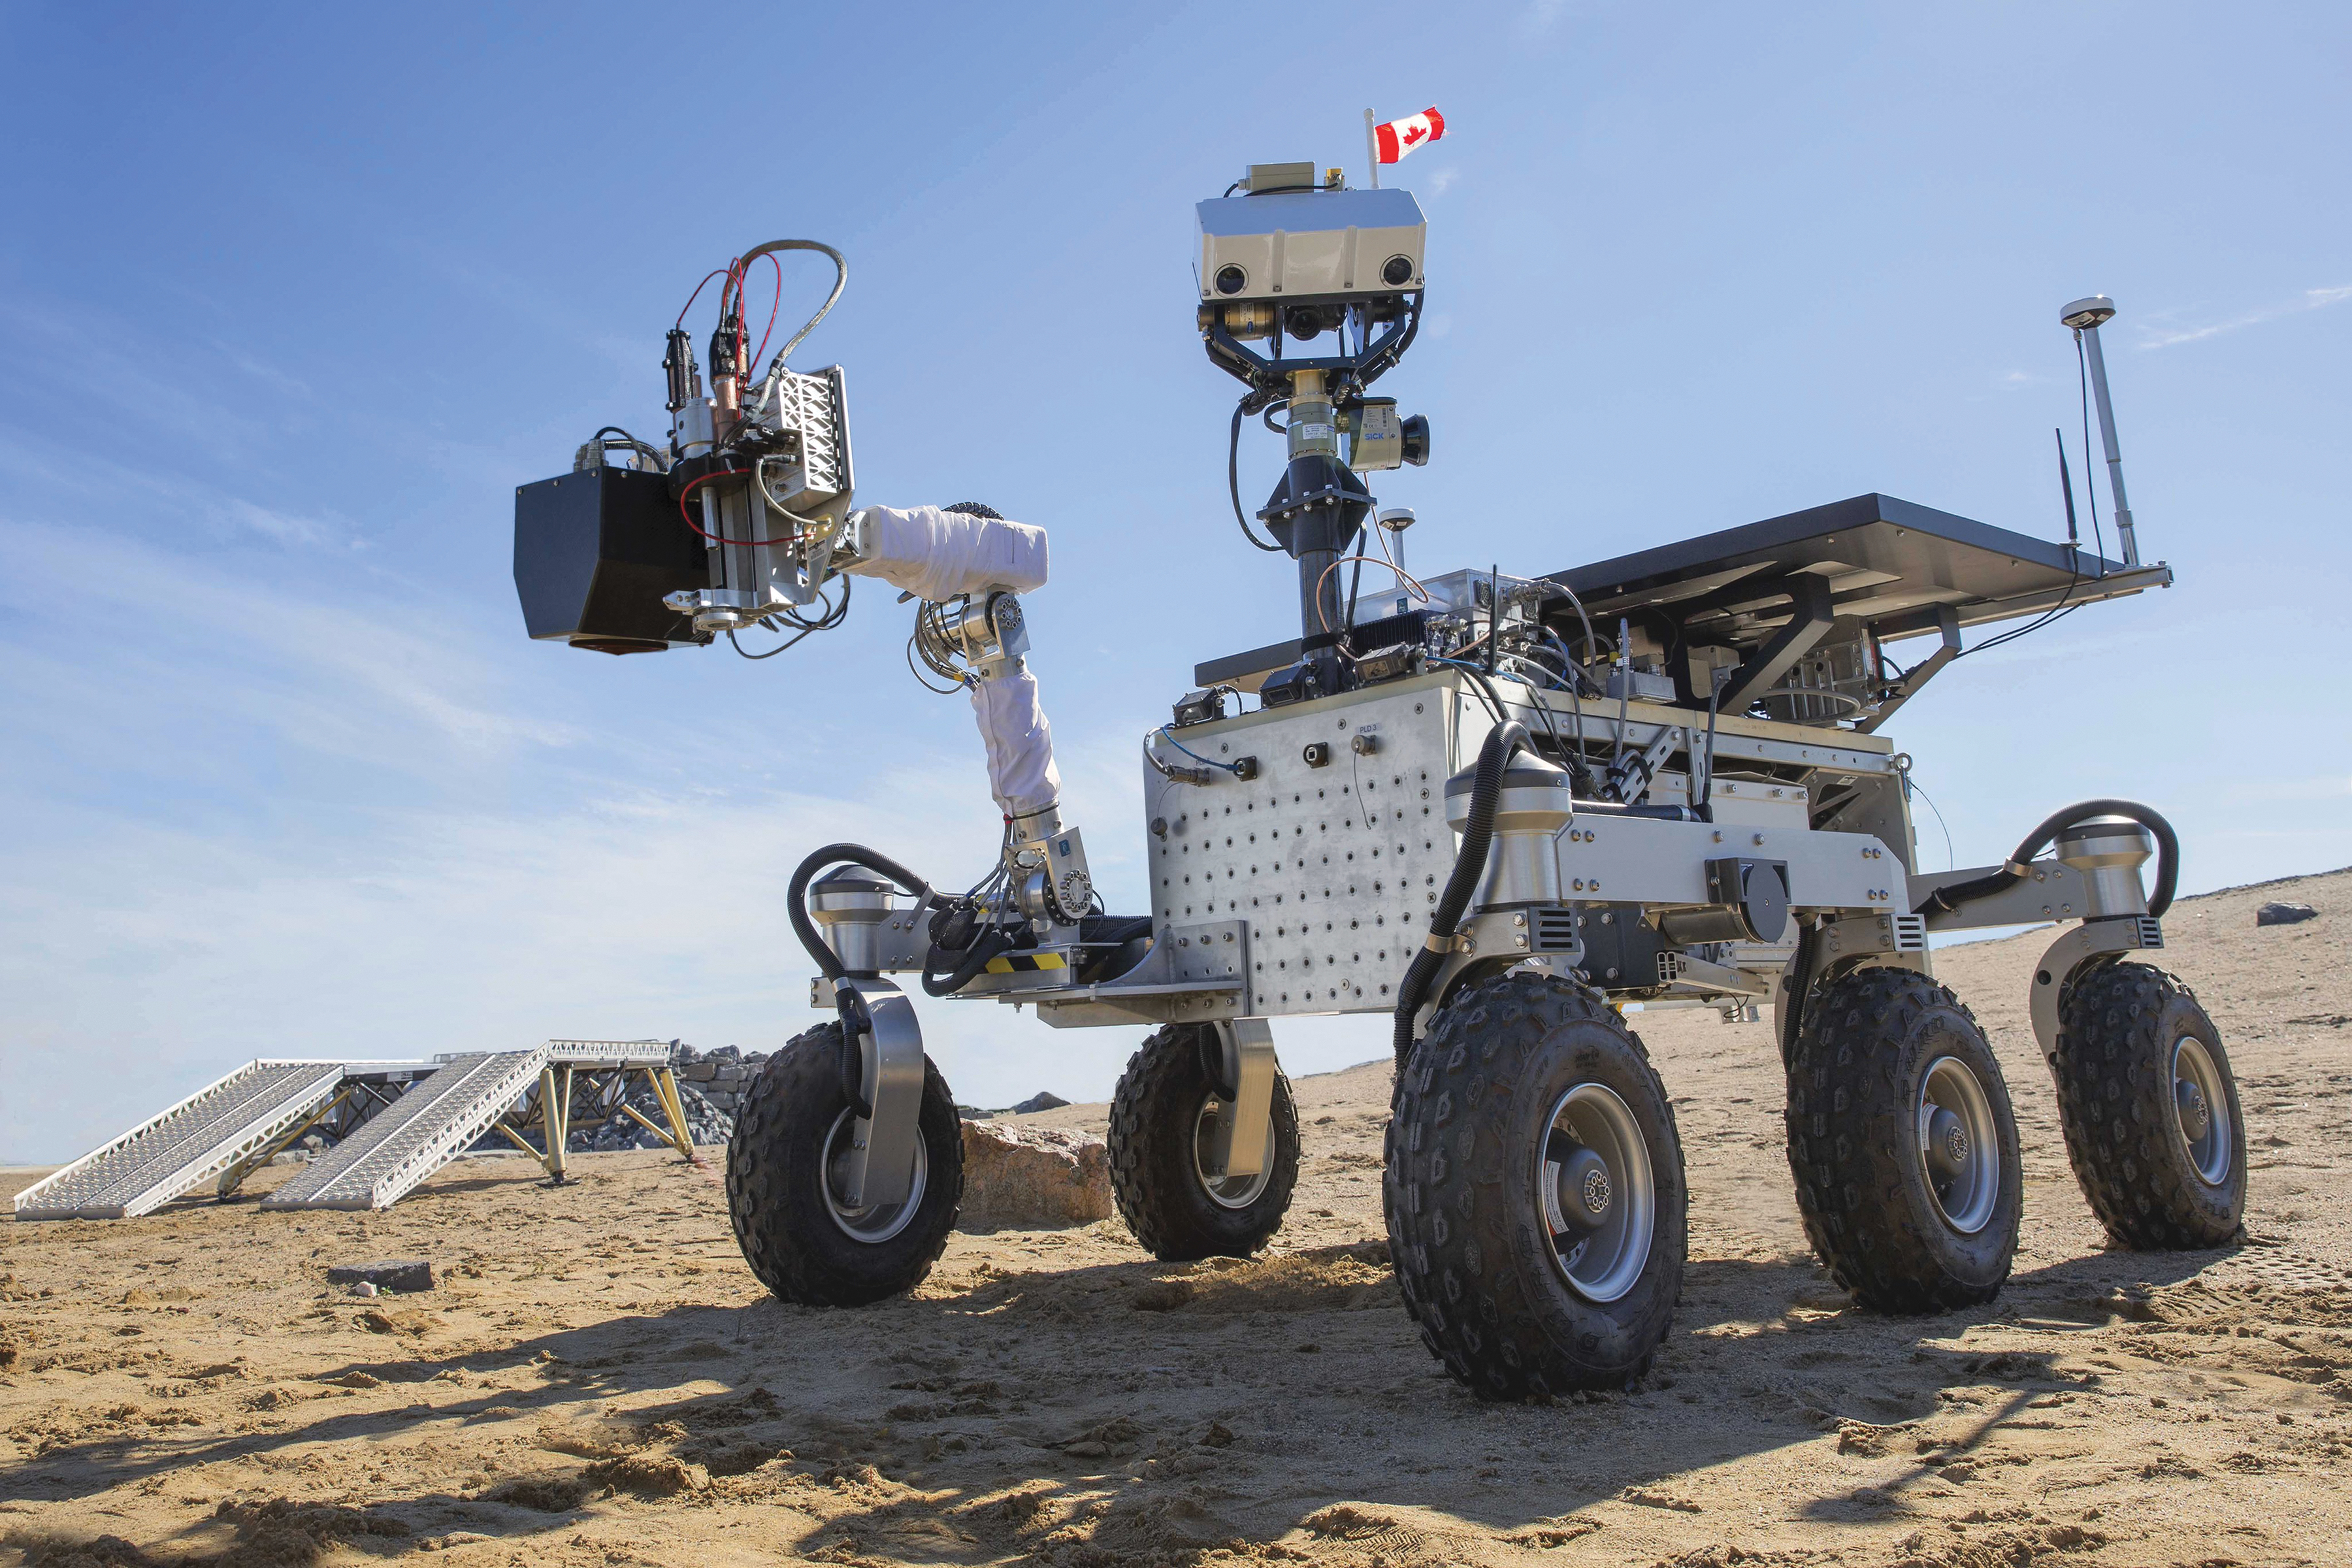
CanMars Rover deployment using CSA's MESR in Hanksville, Utah, USA (Credits: CSA). CSA, Canadian Space Agency; MESR, Mars Exploration Science Rover.
The CanMars mission was conducted in November 2015 and continued over 3 weeks from October to November 2016 with the mission control team located at the University of Western Ontario (Western University), Ontario, Canada. The main goal of the simulated mission was to test (1) the accuracy of selecting organic-bearing samples remotely by using rover data versus a traditional human field crew, (2) the efficiency of remote science operations with periodic preplanned strategic observations (Strategic Traverse Days), and (3) to assess the utility of realistic autonomous science capabilities for the remote science team (RST).
We investigated the factors that could affect the quality of sample selection decisions in the context of MSR (Osinski et al., 2019). The CanMars mission was designed following the principal characteristics of the MSR mission pursued by ESA and NASA. The current scenario for MSR is defined by three main operation scenarios also represented in CanMars: “sample cache,” “fetch,” and “retrieval.” The structure of the mission control center and operation methodology were based on a combination of the experience learned from the Phoenix and Mars Exploration Rover (MER) missions and on other analog missions led by Western University and the mission control team (science and planning team roles).
CanMars simulated the cache component of an MSR mission and resolved science questions at a Mars-relevant analog site that was unknown to the mission control team (Caudill et al., 2019; Pilles et al., 2019). Our results offer a comparison between in situ and postmission (laboratory) results for addressing Mars exploration goals, as detailed in the works of Beaty et al. (2019), Caudill et al. (2019), Osinski et al. (2019), and Stromberg et al. (2019). The lessons learned and results from the CanMars Mission are also detailed in the above listed works.
2.4. Geological description and relevance to Mars
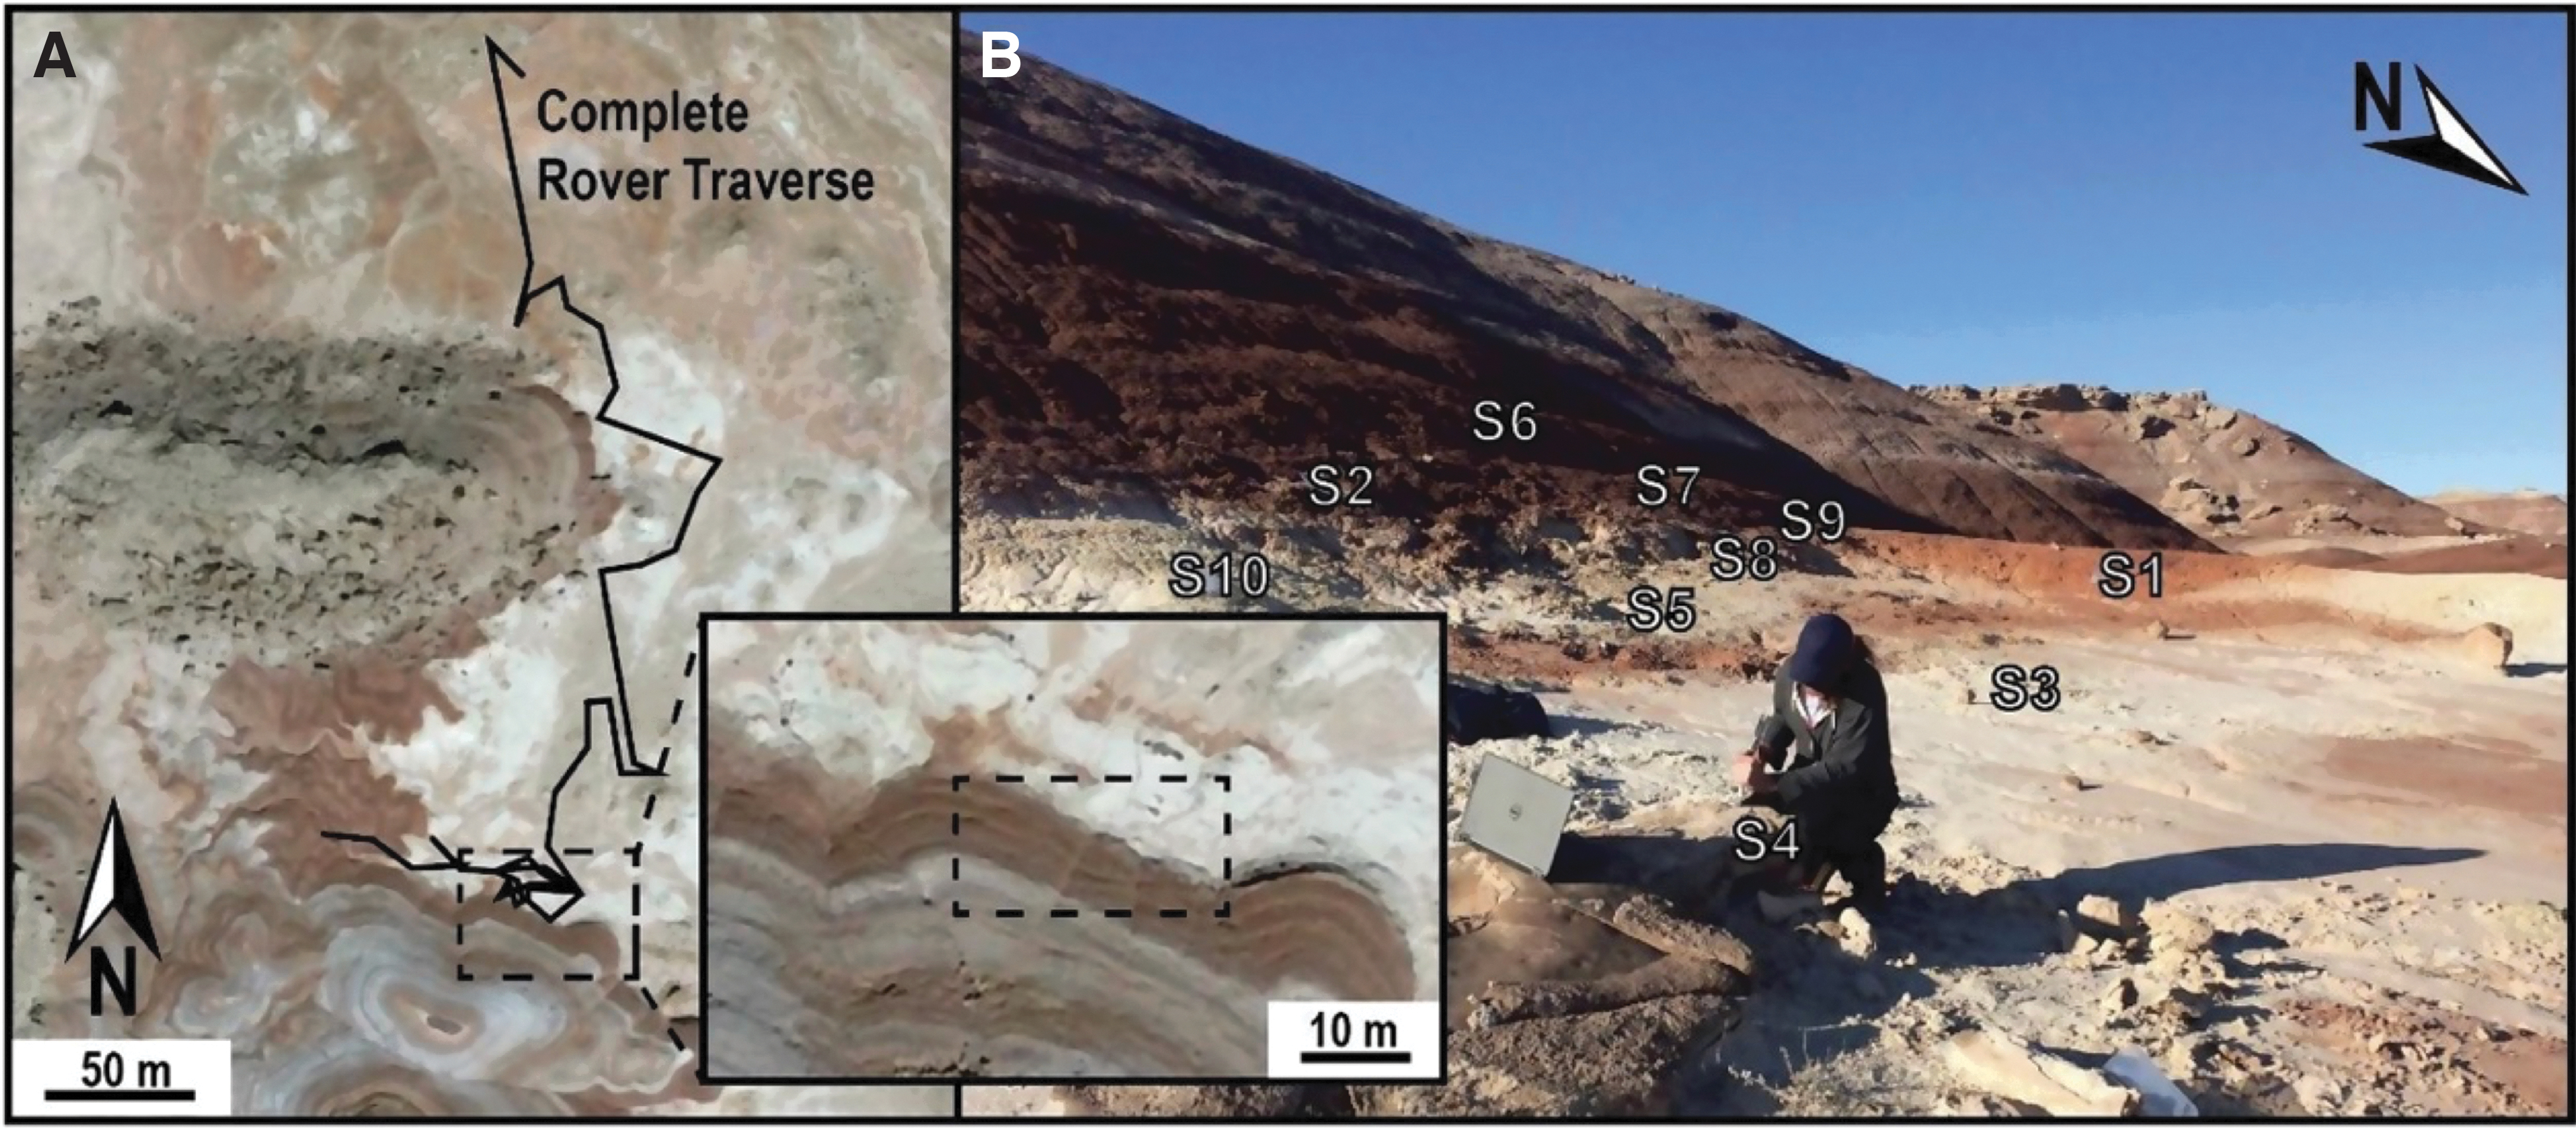
The samples from the CanMars missions, which were analyzed by the RLS Sim (Table 1), were collected from an inverted fluvial paleochannel during a planned rover traverse (Fig. 2) using image-guided region selection (Caudill et al., 2019; Stromberg et al., 2019). A full description of the criteria for sample selection is detailed in the works of Caudill et al. (2019) and Pilles et al. (2019).
Summary of Samples Collected by the CanMars Rover and Studied by Laboratory Analysis
Source: Stromberg et al
The analog site is located ∼8 km northwest of Hanksville, Utah, on the Colorado Plateau (Fig. 2). The stratigraphy of the region is principally dominated by Jurassic age sandstones and shales of the Morrison Formation (Williams et al., 2009). The inverted fluvial sediments are representative of an anastomosing paleochannel, observed as fused vein-like interconnected networks of the fluvial sediments. The inverted paleochannels result from differential erosion and are thus manifested as local topographic highs in the landscape (Miall and Turner-Peterson, 1989; Williams et al., 2009).
This regional erosion has produced a landscape dominated by mesas and scarp-bounded surfaces. The local geology comprises the Brushy Basin Member of the Morrison Formation, which is dominated by sandstones and red, pink, yellow, white, purple, and green mudstones with weathered surface textures (Miall and Turner-Peterson, 1989). The calcite-cemented arkosic sandstone (i.e., a mixture of quartz, potash feldspar, and granitic rock fragments) in the northern part of the field site presented a pink-bluff-color and medium grain sizes. The yellowish formation belongs to a lenticular quartz arenite with sedimentary formation and laminar crossbeds. Whitish to greenish coloration is due to clay-rich siltstone bentonite populated with gypsum lenses and popcorn texture with orange weathered surfaces (Demko et al., 2004). Also, the clay-rich bentonite presents a red-purple coloration with popcorn erosional textures, local laminar tuff-outcrops, and other evaporite weathering material (Demko et al., 2004).
Furthermore, popcorn textures and mudstones are clay-rich, indicative of a tuffaceous origin and aqueous alteration of silicic volcanic ash from volcanic emplacement in the lakes from several western and southwestern sites from the outcrop (Demko et al., 2004). A full geologic description of the region can be found in Beaty et al. (2019) and Demko et al. (2004).
The relevance to Mars of the Hanksville formation is based on similarities with the geomorphology and mineralogy of the landing sites in Jezero crater and Oxia Planum (Caudill et al., 2019; Lakdawalla, 2019), such as the abundance of clay-rich deposits and the geomorphology of the region. The selected and proposed martian landing sites include fluvial and inverted fluvial channels of various ages, whereas the Jezero and Oxia Planum regions represent fluvial activity from the Noachian to Early Hesperian periods (see Lakdawalla, 2019 and references therein). The evidence of past water in upcoming as well as previous Mars rover landing sites, as well as the presence of evaporite minerals (carbonate, chlorides, and sulfates) and clays, is relevant for habitability and preservation of potential biosignatures (McCollom and Hynek, 2005; Summons et al., 2011; Lalla et al., 2016; Rice et al., 2017; Shkolyar and Farmer, 2018).
These factors make the selected test site a relevant terrestrial analog for testing and benchmarking new instrumentation, such as the RLS of the ExoMars mission. Also, these samples support the development of protocols for biosignature preservation, detection, and characterization of life (past and present).
2.5. Sample descriptions and previous results
The sampling methods and criteria are explained in the works of Caudill et al. (2019) and Stromberg et al. (2019). The 10 samples characterized in this study are described in Table 1 and depicted in Fig. 3. The selected sampling locations are shown in Fig. 1. The primary mission objective for sample selection was to characterize potentially habitable past environments and explore for evidence of extinct or extant life. The science team selected the sample suite according to the following priorities: (1) select sample site with potential habitability and evidence of past fluvial activity at the surface and (2) collect samples with the highest potential of preserved ancient biosignatures (i.e., organic-rich carbon) (Caudill et al., 2019; Osinski et al., 2019). The field team performed a geological assessment before the simulated CanMars mission, and the science team conducted laboratory and analytical measurements.
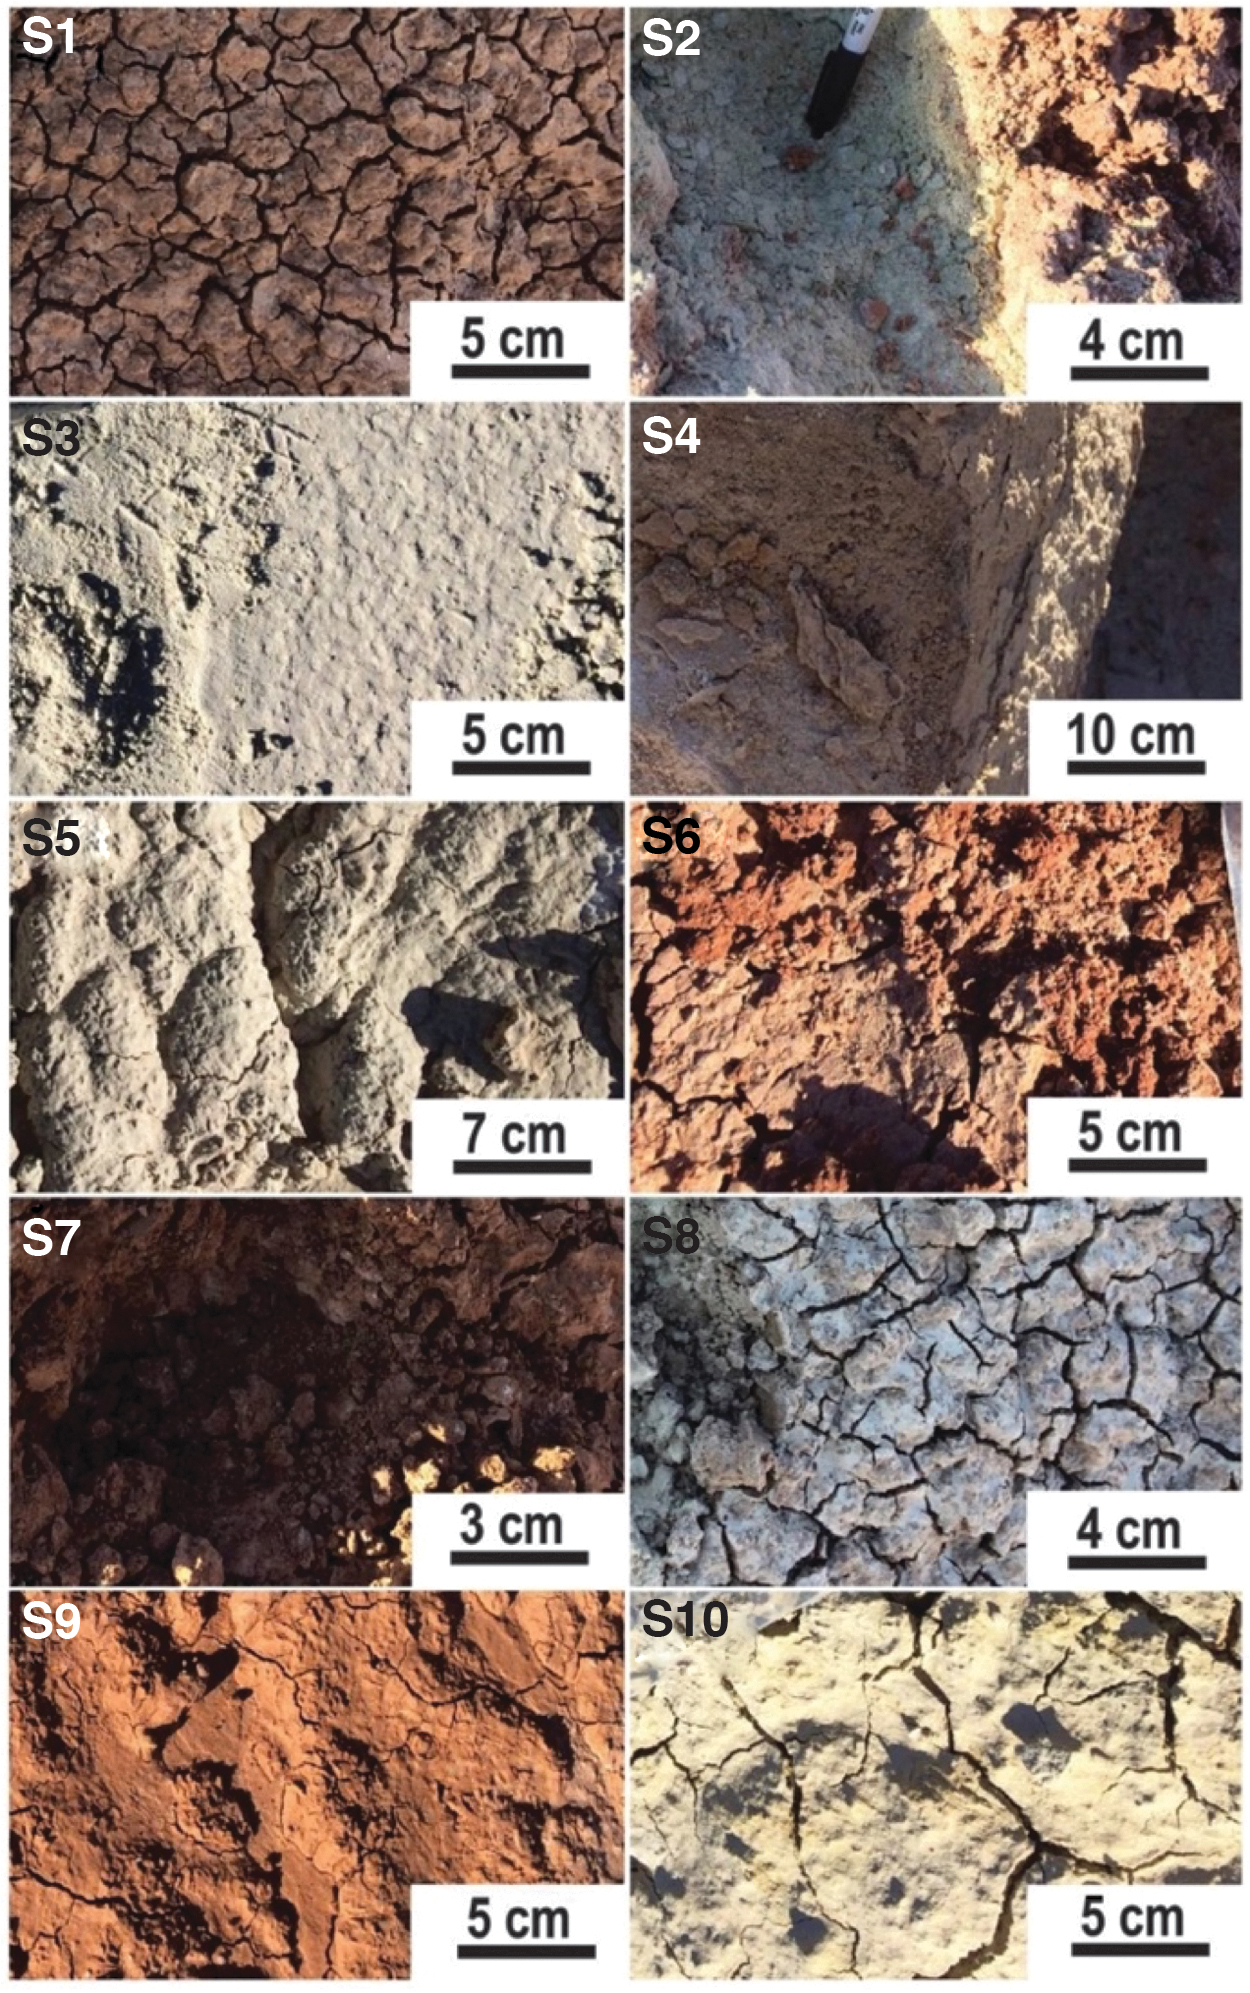
Photographs of the sample textures for samples
The 10 Hanksville samples were previously studied by using several laboratory-based techniques, many of which simulated rover payload instruments, including LIBS, 532 nm (green) Raman spectroscopy, Time-Resolved Raman spectroscopy (TR-Raman), ultraviolet-visible-near infrared (UV-Vis-NIR) spectroscopy, Fourier-transform infrared (FTIR) spectroscopy, X-ray diffraction (XRD), XRF, Mössbauer spectroscopy, and ultraviolet (UV)-Raman spectroscopy (Stromberg et al., 2019).
In the past analyses, the bulk rock mineralogy of the samples, determined by XRD, was shown to be dominated by the presence of quartz and clay minerals (montmorillonite and nontronite) with minor evaporites (calcite and gypsum) and plagioclase feldspar (albite). These XRD results were confirmed by Raman spectroscopy analyses (at 266 and 532 nm laser excitation). In addition, previous Raman spectroscopy detected organic matter assigned to carotenoids, as well as other minor accessory mineral phases including phosphate (Stromberg et al., 2019).
The UV-Vis-NIR reflectance spectra of all samples were dominated by the overtones and combinations of stretching and bending fundamentals of OH and H2O, phyllosilicate phases (phengite and montmorillonite), sulfates (likely gypsum), and absorption features of carbonates (calcite). UV-Vis-NIR reflectance also detected evidence of pigments (i.e., chlorophyll) in the samples produced by cyanobacteria resulting in an absorption feature near 670 nm (Stromberg et al., 2019). The geochemistry of the samples was also characterized by other techniques such as light element analysis, resulting in total organic carbon, N, and S determinations (Stromberg et al., 2019).
Finally, Cote et al. (2019) and Konstantinidis et al. (2019a, 2019b) characterized the samples by LIBS. The results of the LIBS-elemental quantification versus CanMars XRF predictions resulted in a root-mean-squared error of prediction of <5%, suggesting relatively accurate quantifications and identifications (Cote et al., 2019; Konstantinidis et al., 2019a).
3. Experimental Setup
3.1. Sample preparation
The collection, sampling, cataloging, and field analyses of the 10 samples (S1–10) with the subsequent geological interpretation are detailed in the works of Caudill et al. (2019) and Stromberg et al. (2019). Samples were crushed, homogenized, and subdivided into aliquots (10 g) to ensure representative data. Aliquots were dried and sieved to obtain grain sizes of <1 mm after initial drying at 70°C overnight. The collected materials were further crushed and subsequently dry-sieved to grain sizes between 45 and 150 μm.
The grain size required by the design of the Rosalind Franklin rover (<500 μm)—both for the RLS and other operational requirements of ALD (Pilorget and Bibring, 2014; Rull et al., 2017; Vago et al., 2017; Lopez-Reyes et al., 2020), is such that the present samples did not require any additional preparation. Furthermore, the results, supplementary data, and comparable data sets from the previous analyses can be found in the work of Stromberg et al. (2019).
For reference, the mission's rock crusher has two curved jaws. One is fixed, and the other swings up and down to perform the sample crushing. As a result of this motion, the separation between the two jaws at their closest point changes, oscillating between 250 and 500 μm. At any time during the stroke, this gap determines the maximum particle size that the crusher can let through. The resulting particle size distribution is 1–500 μm. Depending on the nature of the mineral, the crushed population has a peak somewhere in the 200–300 μm range, found to be optimal by the development team for both organic and mineral analyses. (For studying organic molecules, the smallest particles possible are desirable since extraction is optimal when the grain's exposed external surface is largest, but for mineralogy investigations, large mineral grain assemblages, as unperturbed as possible, are preferred).
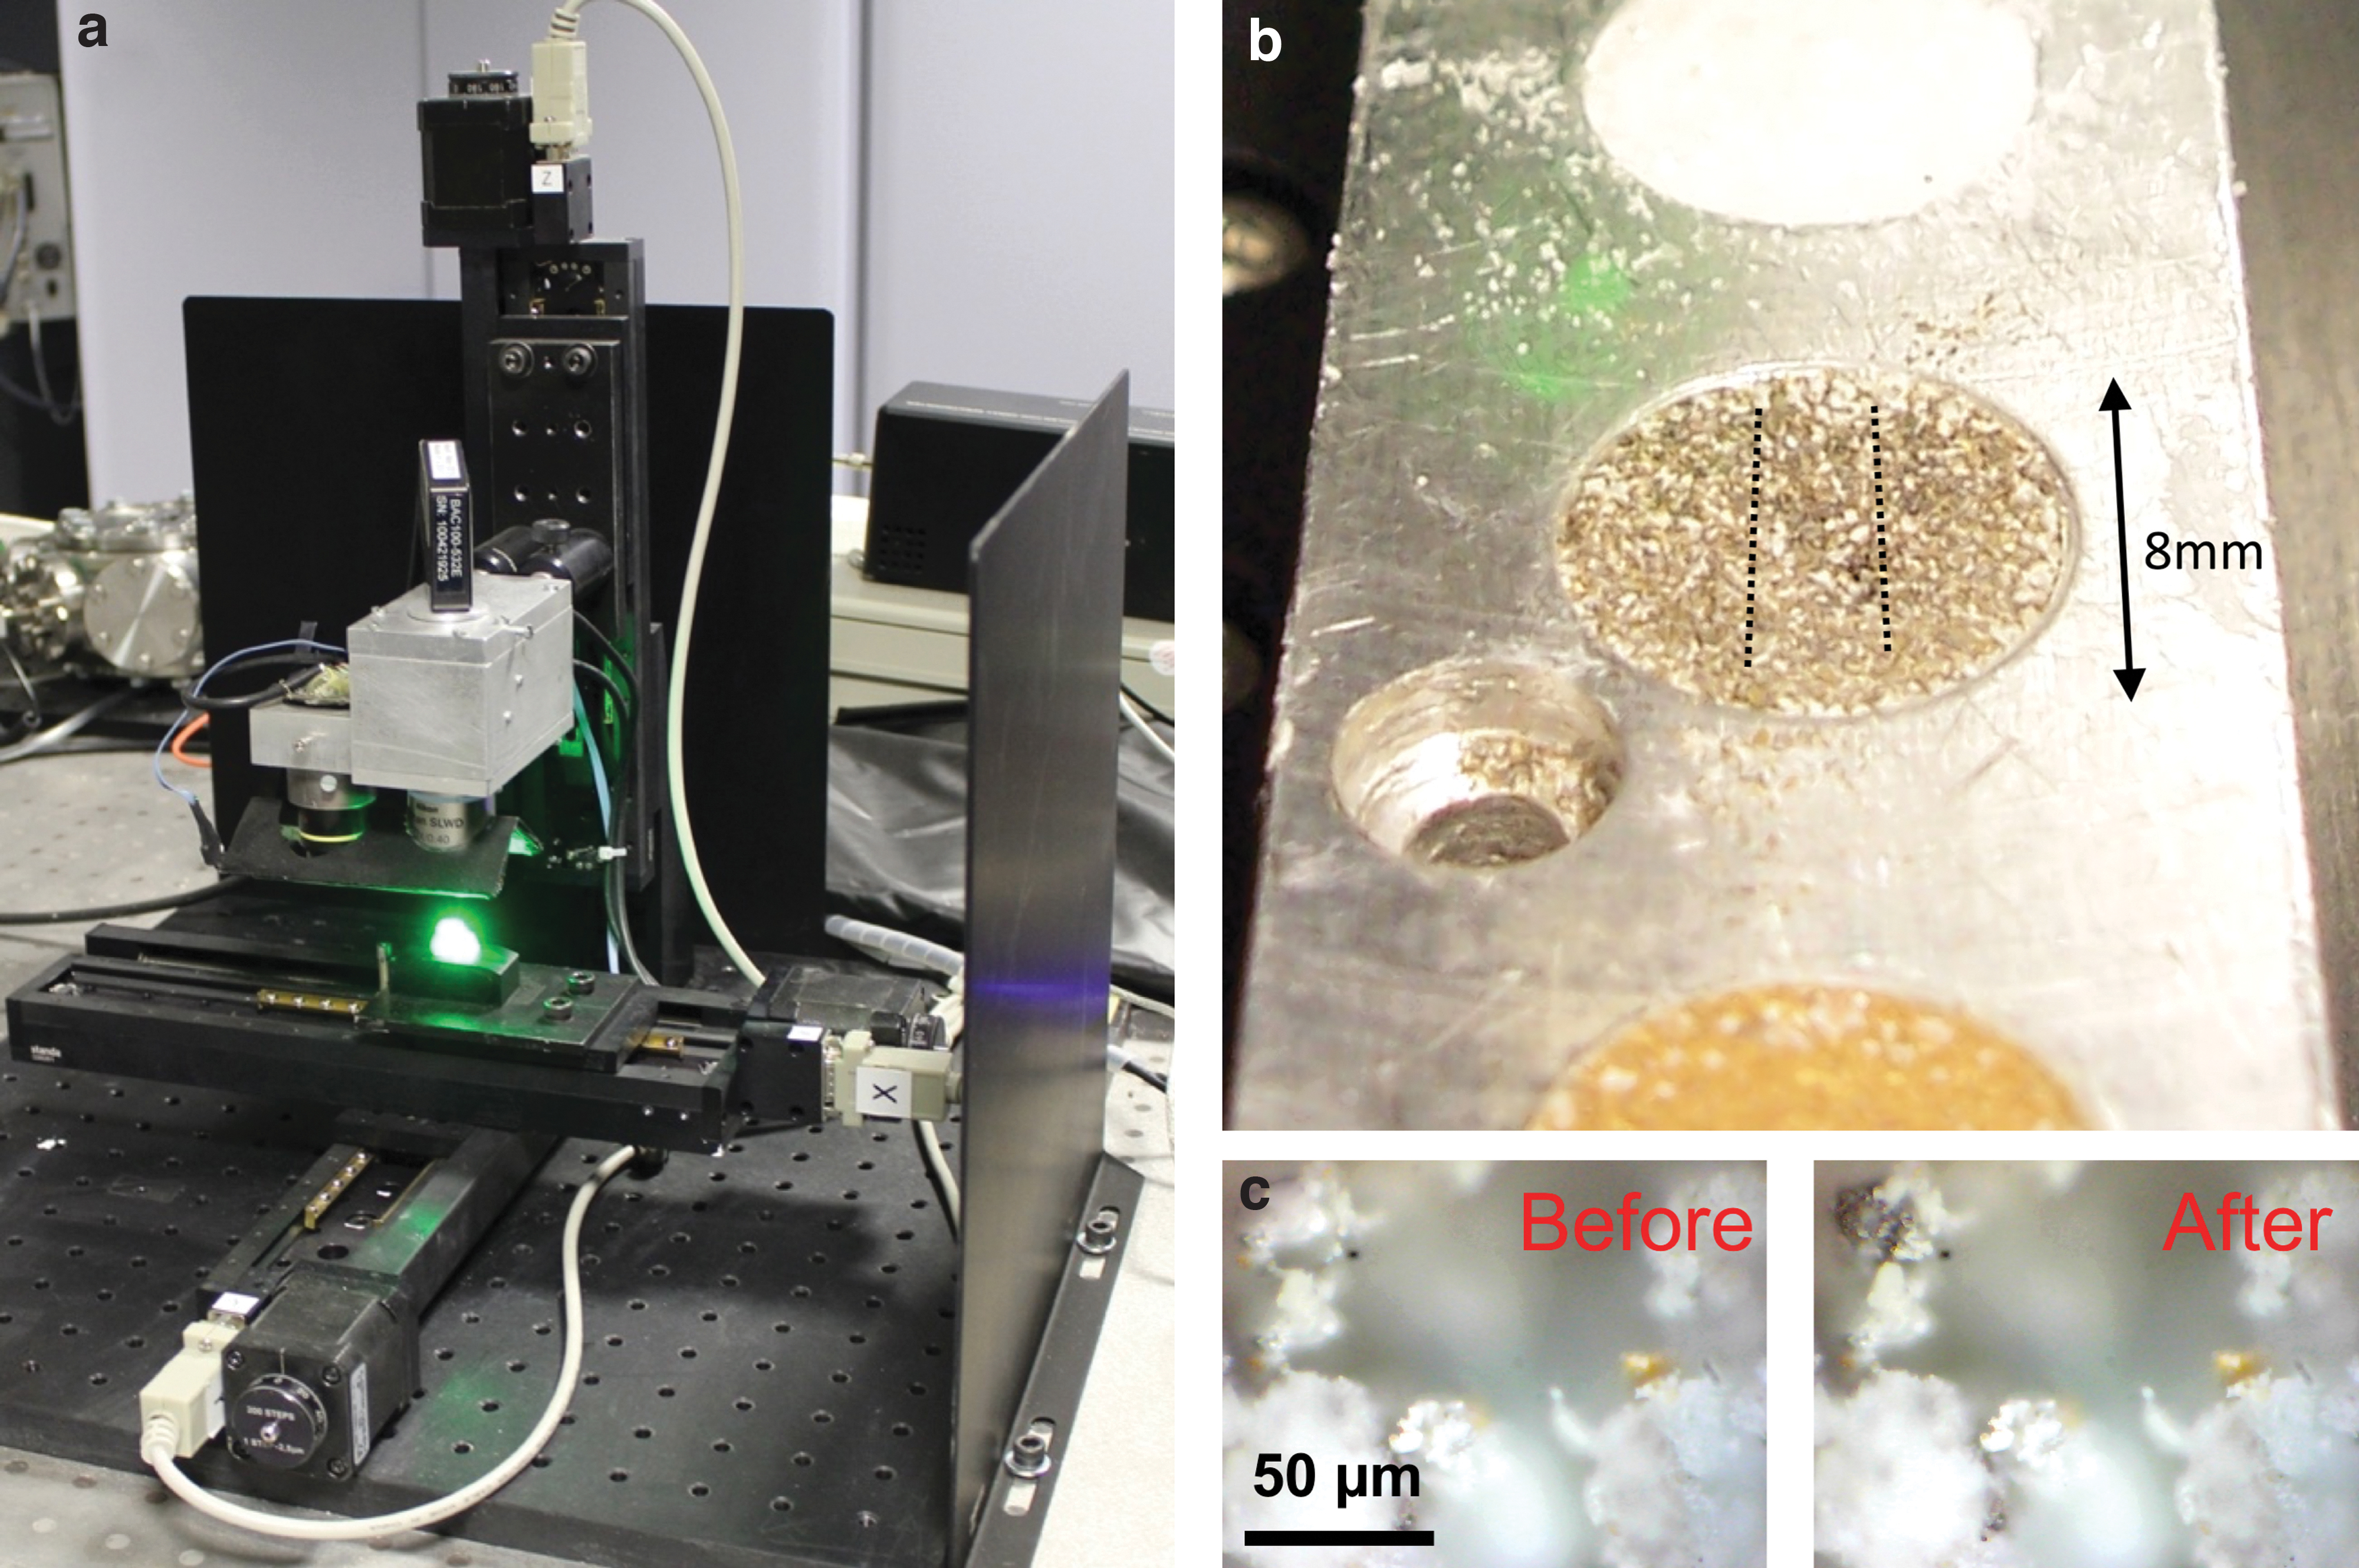
The samples were carefully deposited onto different sample holders, as observed in Fig. 4. An internal camera permitted imaging the sample through the same optical path. Apart from the imaging external camera coupled to the Raman optical head, the system is also designed to flatten the sample powder with an SPDS-like design and position the sample under the instrument's optical head, which will automatically focus on the sample surface. Thus, the deposited sample was flattened automatically before carrying out the Raman analysis. The RLS Sim was used to analyze the dried samples without any additional preparation following the measuring conditions, as indicated in Section 3.2 in the work of Rull et al. (2017).
3.2. RLS ExoMars Simulator
Samples were analyzed using the RLS Sim. This instrument was developed by the UVa-Centro Superior de Investigaciones Científicas-Centro de Astrobiología (CSIC-CAB) Associated Unit—Espectroscopía Raman e Infrarroja aplicado a Cosmogeoquímica y Astrobiología (ERICA, Spain) by assembling commercial components. For hardware, the range of analysis (70–4200 cm−1), the working distance (≈15 mm), excitation wavelength (532 nm), laser power output (20 mW), spectral resolution (6–10 cm−1), and spot size of analysis (≈50 μm) are equivalent to the RLS instrument.
The RLS Sim software integrates an algorithm used by the RLS to autonomously operate on Mars, such as autofocus, fluorescence quenching, and acquisition parameter optimization (Lopez-Reyes and Rull Pérez, 2017). The spectrometer is coupled to the XYZ positioning system, as described above, to replicate the SPDS of the Rosalind Franklin rover, allowing the sequential analysis of powdered materials (Veneranda et al., 2019, 2020a).
We automatically collected a raster of 39 spots on each CanMars terrestrial analog sample. Data acquisition was performed with a custom-developed software based on LabVIEW 2013 (National Instruments) (Lopez-Reyes et al., 2018). Figure 4 shows the RLS Sim with the mapping methods using the three-dimensional stages emulating the SPDS carousel and a context macro- and microimage of each point measured on the samples.
3.3. Spectral data processing and Raman analysis
Each Raman spectrum was manually corrected following the standard procedure available on the OPUS software from Bruker. A background subtraction was done by using the Rubber band correction method and 65 baseline points. For proper band identification in noisy spectra, normalization to the maximum value was carried out, and Savitzky–Golay spectral smoothing was used. Curve-fitting was done with the Levenberg–Marquardt method available on the OPUS software from Bruker when several mineral Raman bands were overlapping.
Furthermore, Voight and Gaussian fittings were also used to deconvolve the main spectral features when the Raman bands of several minerals overlapped. Mineral identification was performed by comparison with the RRUFF Database using Crystal Sleuth and the database available in the Planetary Terrestrial Analogues Library (PTAL) (Downs et al., 2015; Veneranda et al., 2020b). Also, mineral references were considered for spectral identification where appropriate and detailed in the results.
4. Results
As observed in Fig. 3, the samples presented variability in color and texture, ranging from friable (e.g., S2) to a cemented sandstone boulder (S4).
The results from the RLS measurements and our discussion are presented following Dana's classification methodology, where the detected minerals are classified by their chemical nomenclature and their atomic or symmetry structure (Palache et al., 1952). We proceed in this article by discussing results in the following order: (1) Ti-oxides (anatase and rutile), (2) carbonates (calcite), (3) sulfates (gypsum, bloedite, and thenardite), (4) nitrates (nitratine), (5) silicates (quartz), (6) feldspars (K-rich and plagioclase), and (7) organics.
Table 2 summarizes the minerals detected in the samples from (1) the RLS Sim and (2) previous studies (Ehrenfreund et al., 2011; Kotler et al., 2011; Stoker et al., 2011; Stromberg et al., 2019). The results from the work of Stromberg et al. (2019) were obtained by using several Raman systems (Tele-Raman, and Micro-Raman) at various wavelengths (266, 532, and 632 nm). Furthermore, future flight concept systems currently in development were used, such as the LiRS, a breadboard instrument concept and standoff Raman (Sharma et al., 2007, 2020; Cote et al., 2019).
Minerals and Organic Molecules Detected on the CanMars Samples by European Space Agency ExoMars Raman Laser Spectrometer ExoMars Simulator
Results from Stromberg et al. (2019).
Mineral detected but not possible to classify it.
More Raman bands are needed for better identification.
RLS = Raman Laser Spectrometer; XRD = X-ray diffraction.
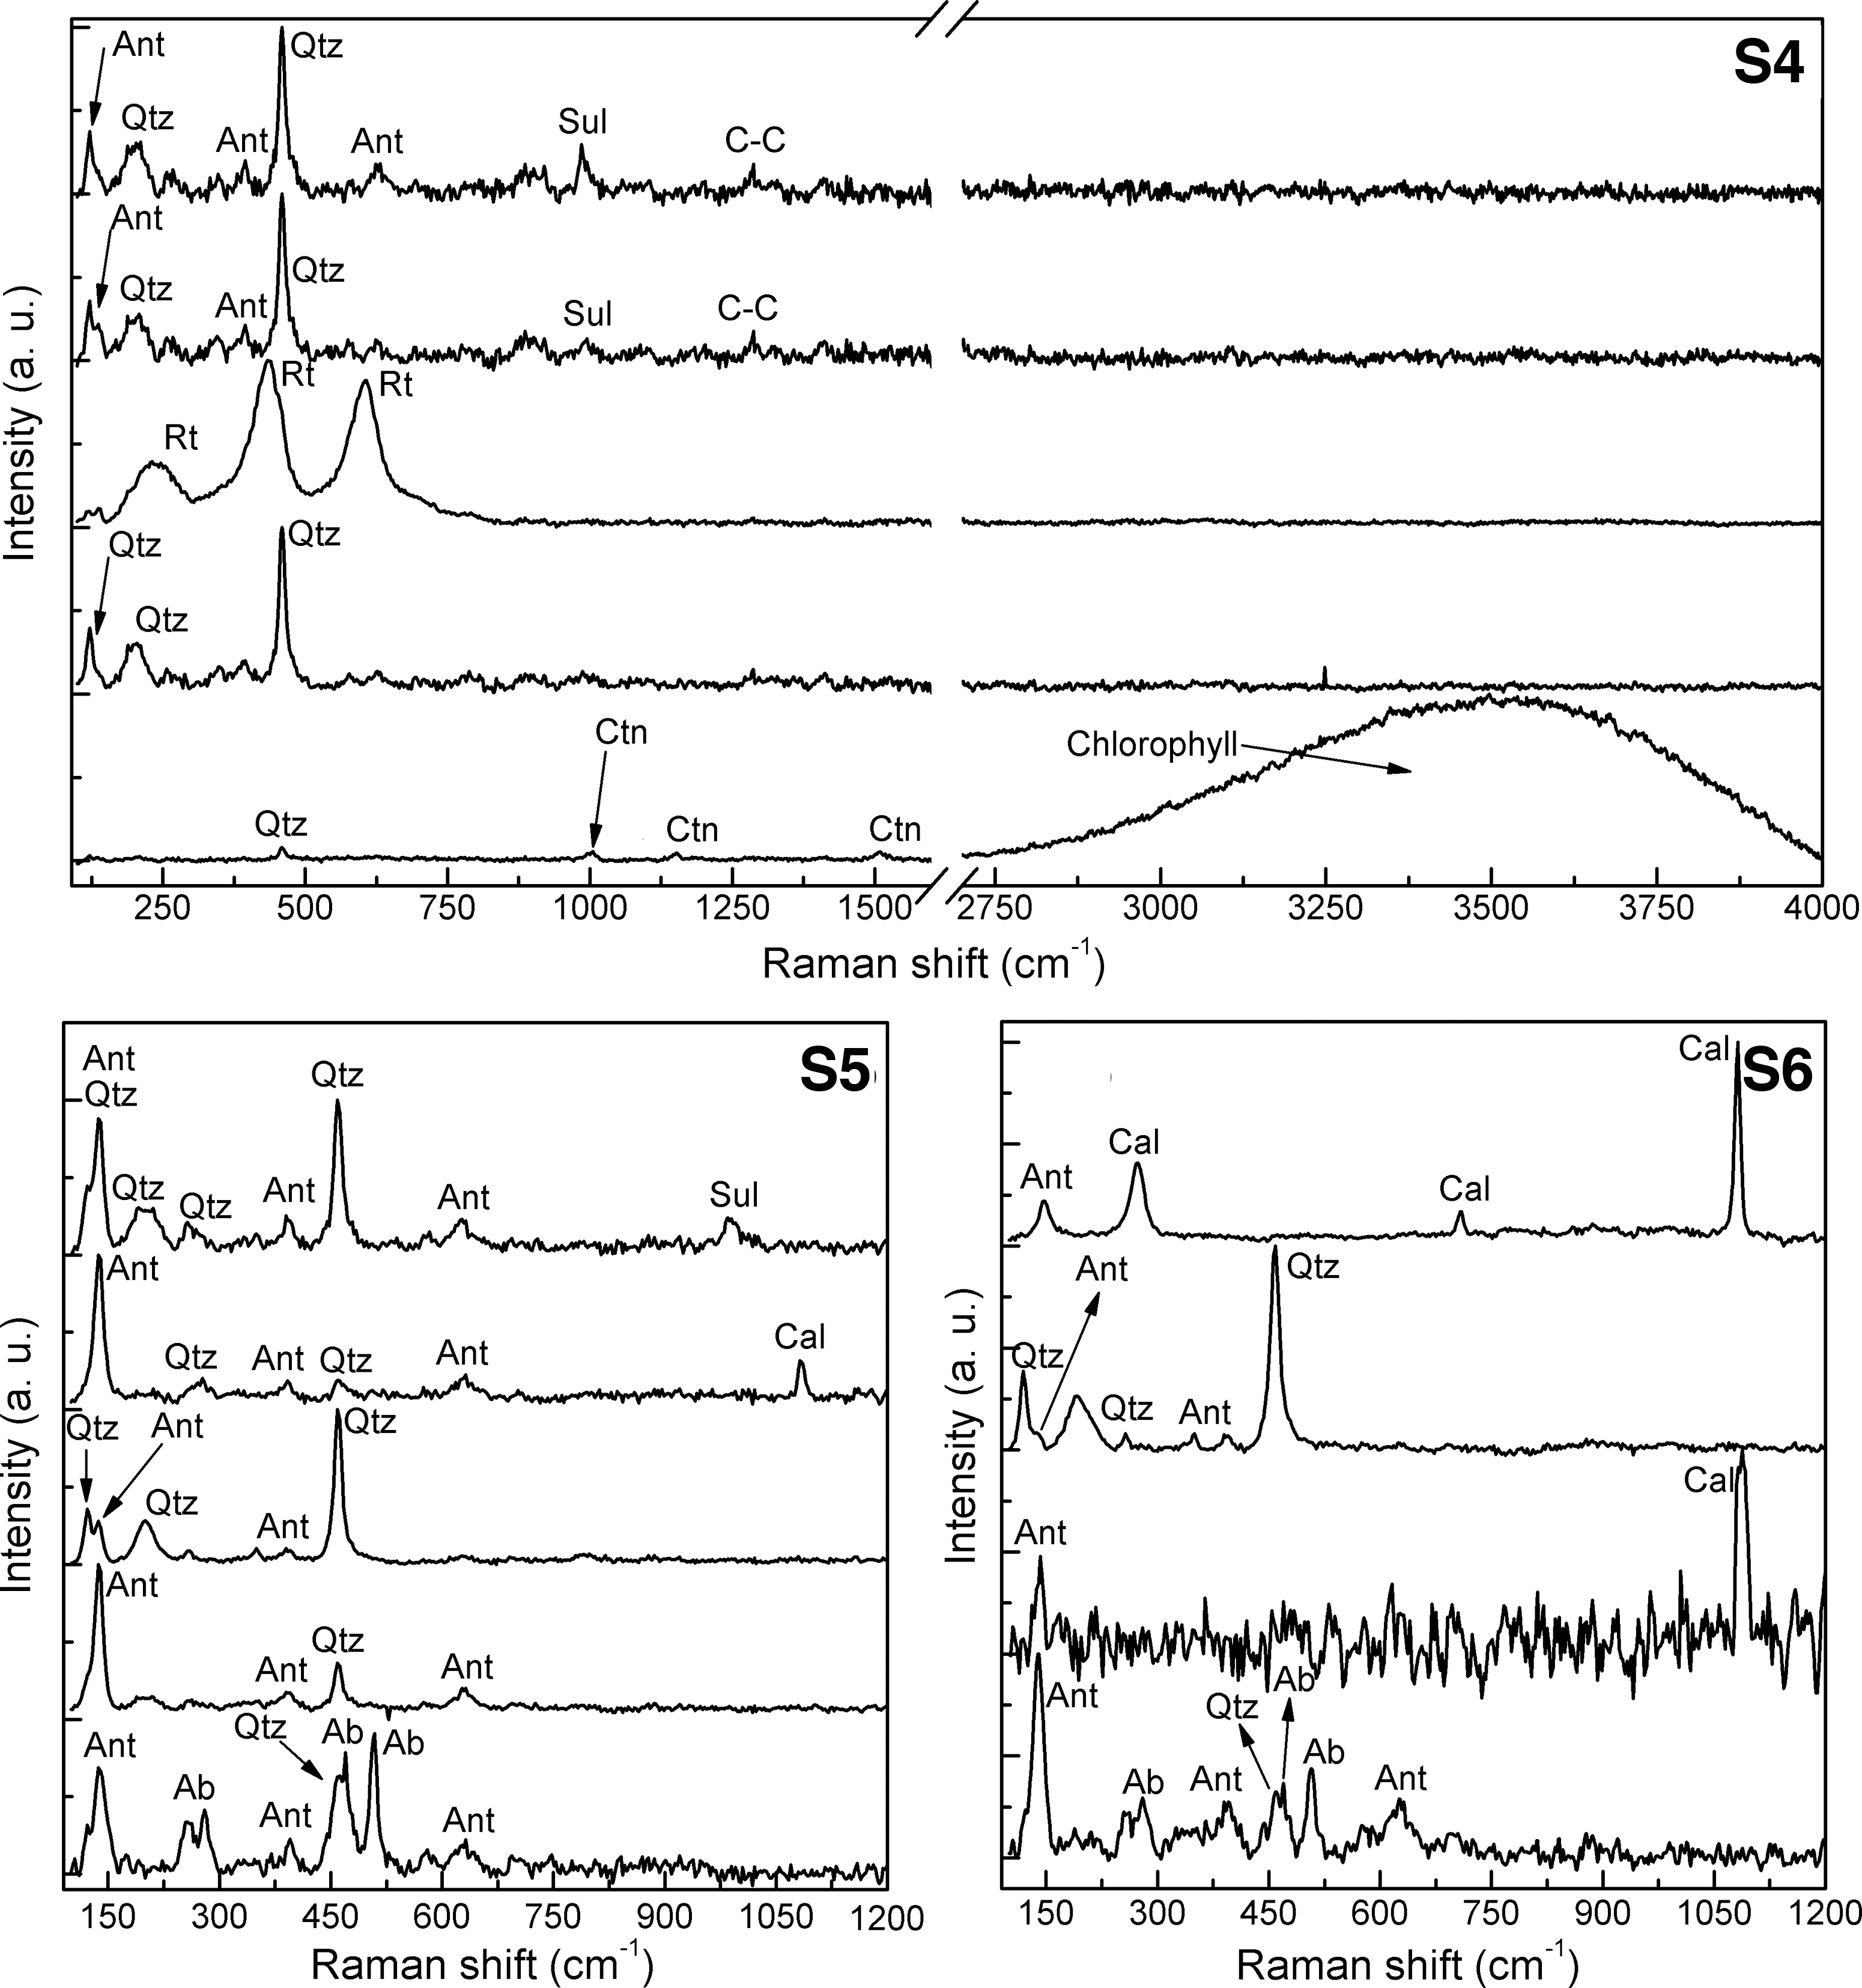
In addition, we compared our results with other results obtained from surface and subsurface soil cores at the Mars Desert Research Station (Utah) and different geological formations such as the Tununk Member, Brushy Basin member, Dakota Sandstone, Blue Gate, Ferron Sandstone, and Summerville Formation (Ehrenfreund et al., 2011; Kotler et al., 2011; Stoker et al., 2011). The mineralogy and elemental composition of the different sections of the cores and samples from the aforementioned analyses were obtained by XRD, X-ray photoelectron spectroscopy (XPS), FTIR, and inductively coupled plasma atomic emission spectrometry (ICP-AES) (Ehrenfreund et al., 2011; Kotler et al., 2011; Stoker et al., 2011). The order in which figures and tables are presented follows the cataloging and labeling from Stromberg et al. (2019). Representative Raman spectra of the different detected minerals from samples S1–S10 reported and listed in Table 2 are presented in Figs. 5–7.

Representative Raman spectra of the main minerals and organics detected in
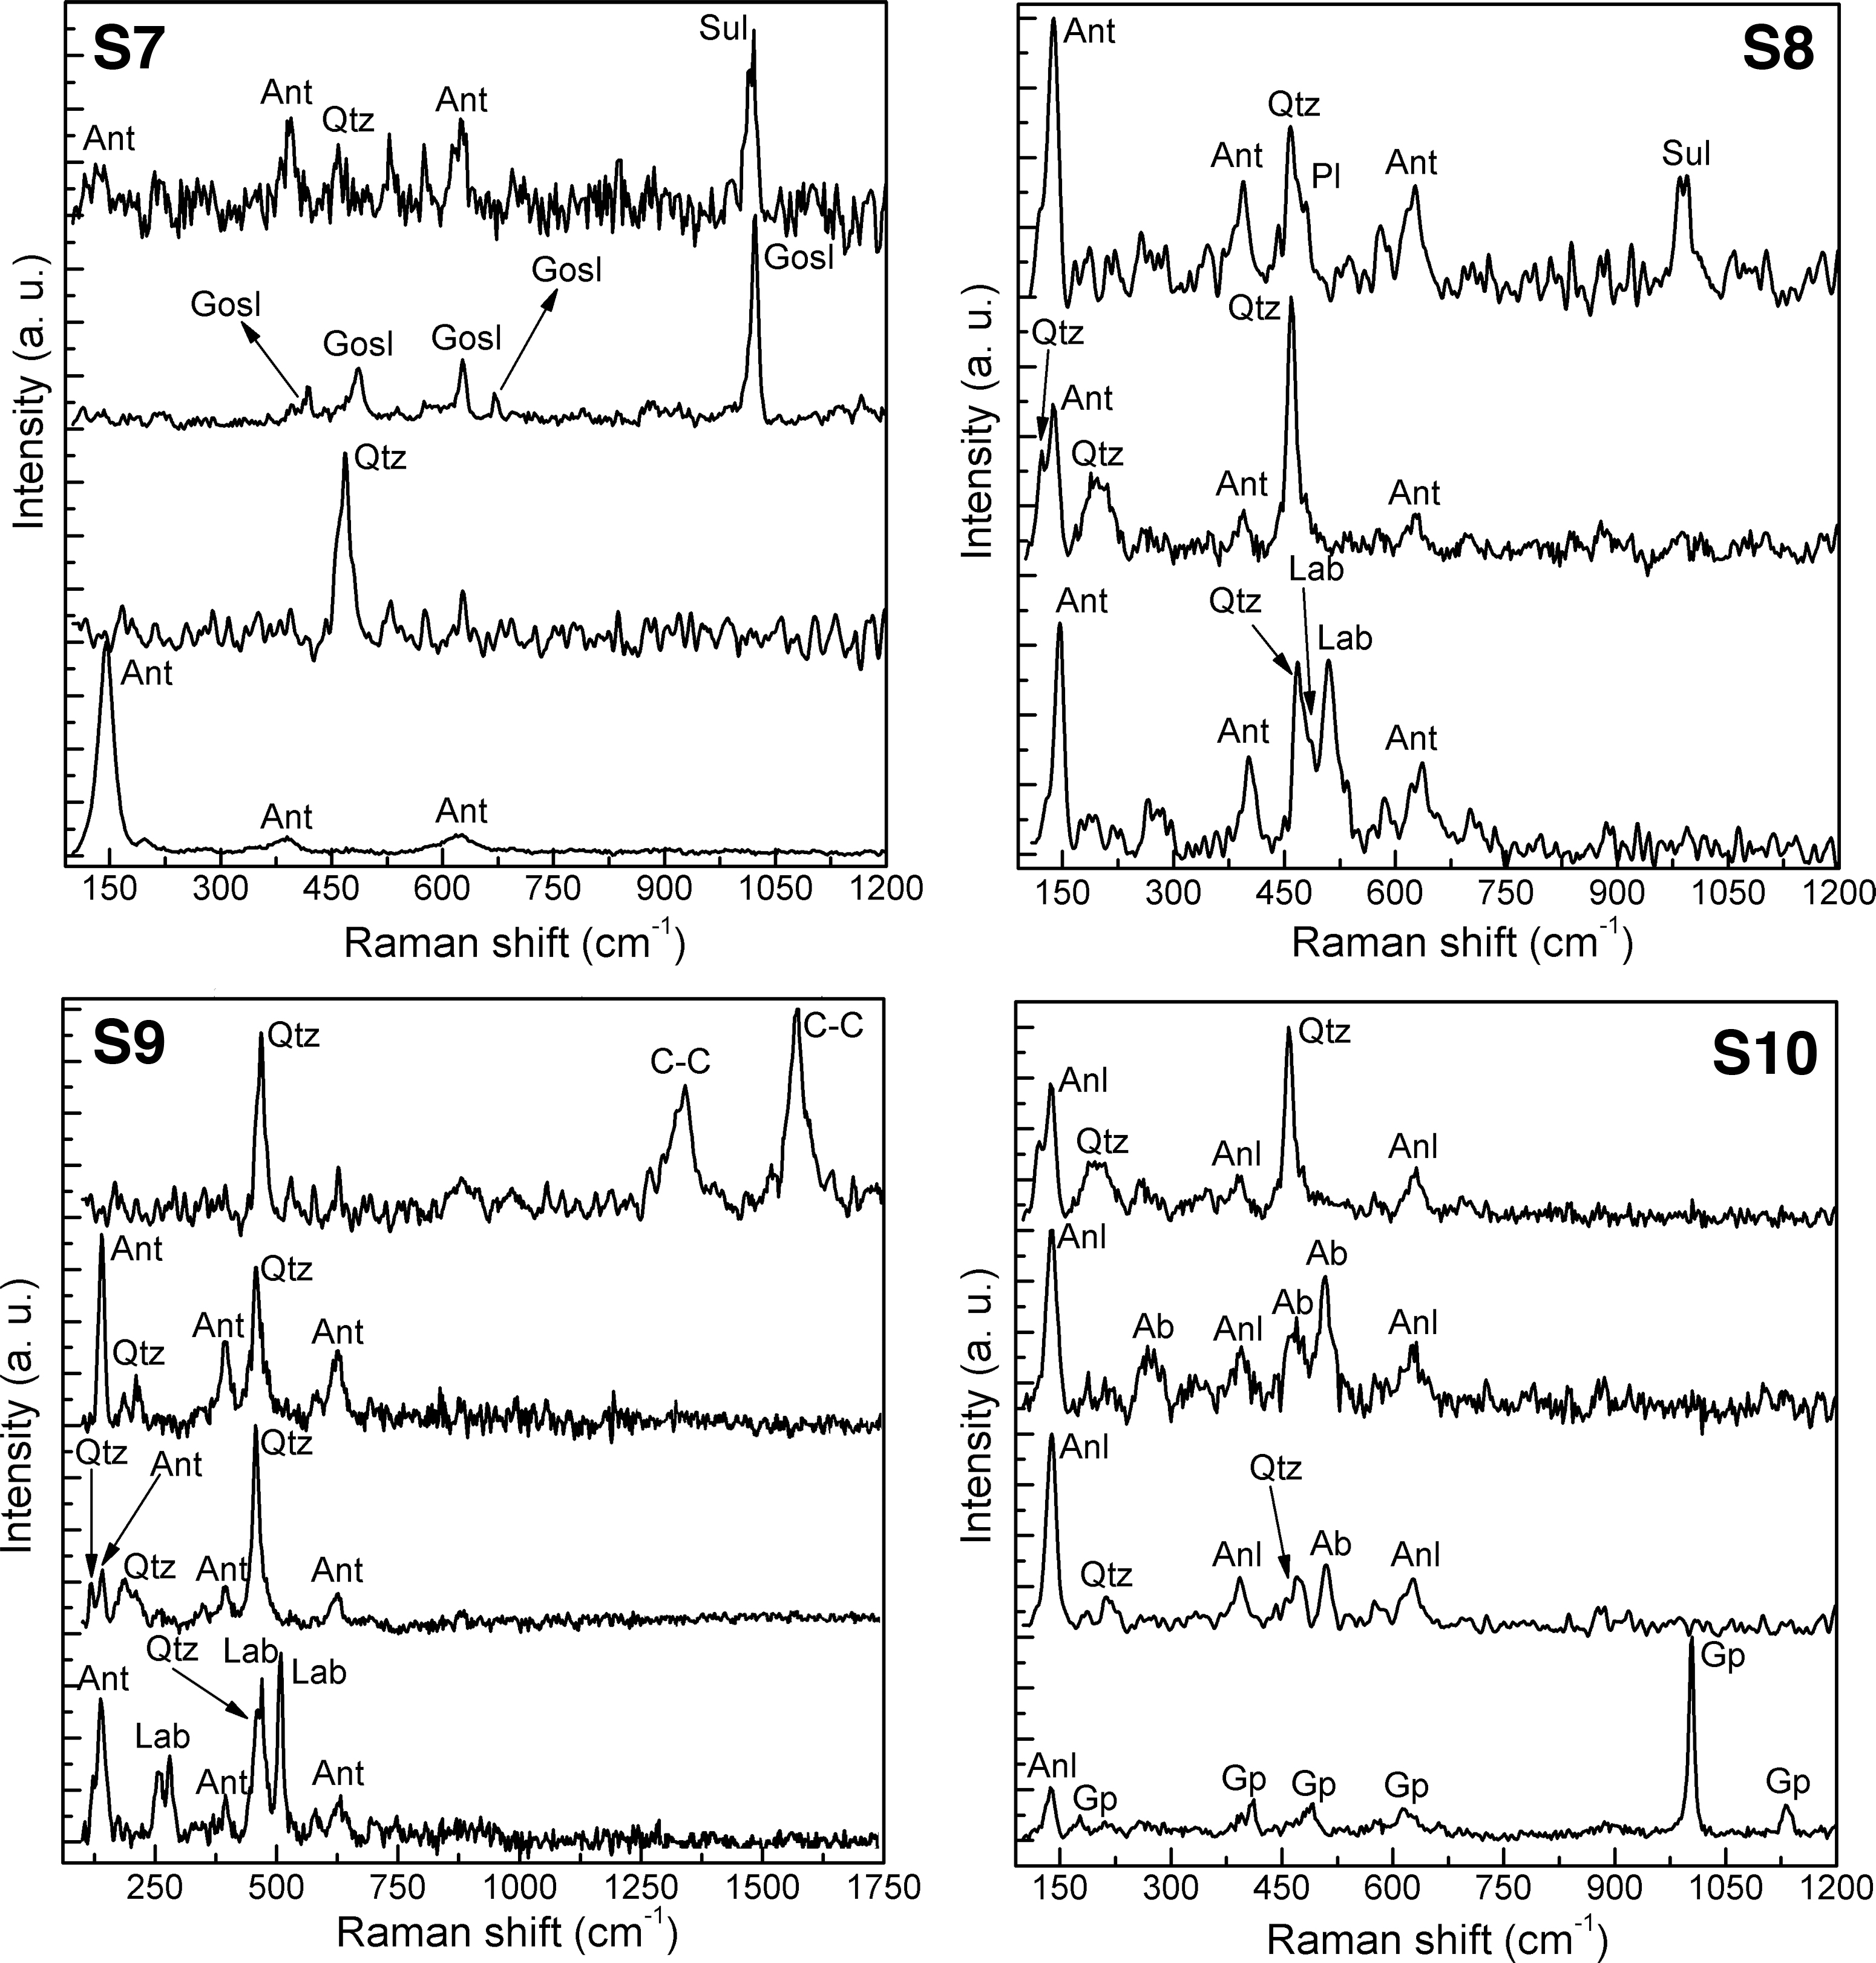
Representative Raman spectra of the main minerals and organics detected on
4.1. Ti-oxides
Many of the spectra from the RLS Sim included a Raman band at ∼145 cm−1 (from S1 to S10), as seen in Figs. 5–7. This signal could be assigned to either anatase (TiO2) or kaolinite [Al2Si2O5(OH)4]. The spectra with the best signal-to-noise ratio displayed additional secondary peaks at 397 and 638 cm−1, confirming the presence of titanium oxide (Fig. 5), given that the main anatase Raman band positions occur at 393, 512, and 635 cm−1 (corresponding to B1g, A1g, and Eg active vibrational modes (Balachandran and Eror, 1982; Lukačević et al., 2012). Similarly, kaolinite has a combination of several bands from 100 to 4000 cm−1 corresponding to (1) the TOT bending deformation bands (T = Si, Al) at ∼120, 196, and 400 cm−1; (2) the OTO bending + TO stretching from 400 to 700 cm−1; and (3) SiO2 stretching, Si-translation, and OH-framework from 700 to 1000 cm−1 (Bougeard et al., 2000).
Furthermore, the other observed TiO2 phase detected in S4 corresponds to rutile, whose primary Raman bands occur at ∼240, ∼440, and ∼609 cm−1 corresponding to the B1g, Eg, and A1g, respectively, and a shoulder at 810 cm−1 (B2g) (Balachandran and Eror, 1982; Lukačević et al., 2012). Results from XRF (Stromberg et al., 2019) and LIBS (Konstantinidis et al., 2020) reveal an elemental abundance of TiO2 ranging between ∼0.1% and ∼0.6% in all the samples, consistent with our results.
4.2. Carbonates
The carbonate minerals in these samples are dominated by peaks attributable to calcite (Buzgar and Apopei, 2009; Rividi et al., 2010; Cote et al., 2019). Carbonates have three distinctive Raman regions: (1) 1080–1090 cm−1 attributed to symmetric stretching of the CO3 2− group, (2) 700–730 cm−1, generated by the asymmetric bending Raman active mode of the CO3 2− group, and (3) 280–290 cm−1, attributed to a combination of external vibrations and in-plane deformation of the CO3 2− group. In the S2, S3, S5, and S6 samples, the carbonate Raman bands correspond to calcite (with the most intense band at ∼1086 cm−1 and weaker bands at ∼712 and ∼286 cm−1). Some small Raman shift variations of approximately 2–3 cm−1 were observed on oscillations of symmetric stretching, asymmetric bending, and external vibrations. These variations are likely due to differences in cation content in calcite stoichiometry (Buzgar and Apopei, 2009; Rividi et al., 2010; Cote et al., 2019).
4.3. Sulfates
The RLS results show a large number of possible sulfate mineral species in the CanMars samples (Figs. 5–7). Sulfates can be identified by their H2O vibrational modes and the SO4 tetrahedra group vibrational modes (Wang et al., 2006). The following principal modes characterize the SO4 tetrahedron: (1) the nondegenerate ν1 symmetric stretching between ∼970 and ∼1060 cm−1; (2) the doubly degenerate ν2 symmetric bending at 450–500 cm−1; (3) the triply degenerate ν3 asymmetric stretching from 1060 to 1250 cm−1; and the (4) the triply degenerate ν4 asymmetric bending at 610–700 cm−1 (Buzgar et al., 2009). Variations in the Raman bands and their band shifts are mainly caused by crystal structural modification because of water content (e.g., amount of hydrogen bonding), and, like in the carbonates, differences in cation types (Mg, Fe, Ca, Na, and Zn) (Wang et al., 2006). Gypsum was detected in S2 and S3 based on the ν1 symmetric stretching at approximately 1005–1008 cm−1, the ν2 asymmetric stretching at ∼445 cm−1, and ν4 asymmetric bending at ∼625 cm−1.
Other minor bands that would confirm gypsum were not detected, possibly because of masking by the presence of high fluorescence in the raw spectra (before spectral correction) or other minerals. In the case of S10, gypsum was identified through the presence of all of the SO4 tetrahedra-Raman active vibrational modes.
Other sulfate minerals have been detected by the RLS, which in the current study are consistent with the high concentrations of Na and Mg in many of the Hanksville samples, further substantiated by previous work in Hanksville County (Bullock, 1981). These Mg-Na sulfates could correspond to different sulfates such as epsomite (Mg2SO4·7H2O), bloedite [Na2Mg(SO4)2·4H2O], and thenardite (Na2SO4). According to the literature, epsomite presents the nondegenerate ν1 symmetric stretching at ∼984 cm−1 (Wang et al., 2006). The triply degenerate ν3 asymmetric stretching from 1060 to 1250 cm−1 is located at ∼1095, ∼1134, and ∼1060 cm−1 (Wang et al., 2006). Other vibrations related to the doubly degenerate ν2 symmetric bending and the triply degenerate ν4 asymmetric bending are detailed in the work of Wang et al. (2006).
Na-Mg sulfates such as bloedite present shifted bands caused by Na cation content. Bloedite has the most intense bands at ∼1188, ∼991, ∼617, and ∼454 cm−1. Thenardite presents a double degenerate band at ∼448 and ∼463 cm−1, a triple degenerate band at 620, 631, and 645 cm−1, a single intense band at 992 cm−1, and a triply degenerate band at 1099, 1129, and 1151 cm−1 (Downs et al., 2015; Shkolyar and Farmer, 2018; Hamilton and Menzies, 2010).
According to the band analysis, the RLS measurements detected a band in the S4, S5, S6, and S8 sample spectra that correspond to SO4-tetrahedra (ν1) symmetric stretching located at approximately 990–995 cm−1. The ν1 band may be assigned to high sodium sulfates such as bloedite or thenardite, but more bands are needed to conduct a proper assignment of such sulfates, including ν3, ν2, and ν1 (which were not detected likely due to background fluorescence).
The results from our Raman analysis are in agreement with those reported previously from XRD by Stoker et al. (2011) and by XPS from Kotler et al. (2011), where high Na and Mg (atom %) are present in the outcrop (Ehrenfreund et al., 2011; Kotler et al., 2011; Stoker et al., 2011). The existence of such sulfates has also been reported in this region, suggesting evidence of strong acidic aqueous alterations (Ehrenfreund et al., 2011; Kotler et al., 2011; Stoker et al., 2011).
The RLS Sim also detected a possible Zn-sulfate phase in sample S7. This mineral has principal bands at 1022 (ν1), 670 (ν4), 627 (ν4), 485 (ν2), and 420 (ν2). According to Buzgar and Apopei (2009), goslarite sulfate (ZnSO4•7H2O) is a candidate that matches our data most closely, having translational modes (T) of the cation zinc (Zn) with the oxygen from water T(Zn,H2O) bands at 223 and 281 cm−1. The (ν2) bands for goslarite are at 423 and 510 cm−1, (ν4) bands at 626 and 671 cm−1, (ν1) bands at 1024 cm−1, and (ν3) bands at 1084 cm−1 (Buzgar et al., 2009). A less likely Zn-sulfate candidate is gunningite [(Zn, Mn)SO4•(H2O)], with T(M,H2O – M = metal cation) bands at 220 and 275 cm−1, (ν2) bands at 428 and 503 cm−1, (ν4) band at 625 and 668 cm−1, (ν1) bands at 1028 cm−1, and (ν3) bands at 1082 and 1199 cm−1.
Our band analysis and that presented by Buzgar et al. (2009) indicate that the Raman results for sample S7 correspond to the presence of goslarite, with possible shifting due to variation in stoichiometry. This is consistent with the survey carried out by Bullock (1981), which showed that the Hanksville outcrop presents gunningite and goslarite with variable cation proportions of Zn and Fe. Moreover, the Raman-shift variations between our results and those of Buzgar et al. (2009) may result from a combination of the increase of mean force constants, attributed to the substitution of larger cations in the M sites and the atomic mass of the cations (Buzgar et al., 2009). This is likely because the analyses presented by Buzgar and Apopei (2009) were carried out on synthetic samples, while the analyses from the present work were carried out on natural samples.
4.4. Nitrates
Raman spectra from samples S2 and S4 indicate the presence of nitrate phases. The collected spectra from the RLS Sim displayed clear bands at ∼185, ∼726, ∼1068, and ∼1381 cm−1, which are consistent with nitrate minerals such as nitratine (NaNO3). The detected bands correspond to those observed for nitrates with NO3 ions in the C1 site and occupy positions of low symmetry (Brooker et al., 1970). Thus, we can assign the band at ∼1069 cm−1 to the corresponding ν1 symmetric stretching, which is shifted 5 cm−1 compared with those reported by others (Brooker et al., 1970; Xu and Chen, 1999). The triply degenerate ν4 asymmetric bending mode corresponds to the band at ∼726 cm−1. In addition, the ν3 asymmetric stretching mode corresponds to the band at ∼1381 cm−1.
Moreover, Brooker et al. (1970) reported that the degenerate ν2 symmetric bending generates a band at ∼828 cm−1, which was not observed on the CanMars samples. The band at ∼185 cm−1 is assigned to the external modes of the NO3 associated with the ions in the C1 site. Xu and Chen (1999) reported that ν3 asymmetric stretching has a strong dependence on the cation molar ratio of the following form: Na1−xKxNO3, where X is the molar fraction between sodium (Na) and potassium (K) in stoichiometry. Thus, when K increases, the single band transitions into two, at 1353 and 1447 cm−1. In our results, such a transition was not observed (i.e., Fig. 7), indicating the high concentration of Na.
4.5. Si-oxides
Quartz was detected in all samples, identified by the bands generated from the Raman active vibrational modes 8E+4A1 (Figs. 4–6). The vibrational modes are located at ∼103 (ELO+TO), ∼205 (A1), ∼464 (A1), and ∼495 (ELO+TO) cm−1 (Asell and Nicol, 1968; Enami et al., 2007). All bands diagnostic of quartz were detected; however, in some instances, such as S8 and S9 in Fig. 7, the quartz spectra overlapped with Raman peaks of other minerals, such as K-feldspars and plagioclase feldspars, or the quartz mineral grains were too small to establish a full identification.
Representative Raman spectra of the main minerals and organics detected on
Conventional Micro-Raman systems use ultrasmall laser spot sizes (5–10 μm) for analyzing these kinds of samples. The laser spot size of the RLS Sim is 50 μm (Fig. 4c), which results in detecting a mixture of several minerals. The advantage of this larger spot size is the ability to detect multiple mineral phases simultaneously in a sample. The disadvantage is that low-abundance organic components may be harder to detect when strongly scattering minerals are present.
4.6. Feldspar minerals (alkali and plagioclase)
The feldspar minerals (alkali and plagioclase feldspars) belong to the tectosilicate group and have specific Raman bands below 1000 cm−1. The Raman spectra of feldspar minerals can be divided into different regions where the active Raman modes can be observed (Freeman et al., 2008). The Raman bands of K-feldspars and plagioclase feldspars are produced by the structure of the Al-SiO4 group, with structural bands located below 600 cm−1. The most intense bands are located between 450 and 515 cm−1, and they appear as a triplet or a doublet, with the strongest band at approximately 505–515 cm−1 (Freeman et al., 2008). This doublet or triplet is inversely correlated with the size of the ring made by the Al-SiO4 tetrahedra structure.
Also, other regions have to be considered for the most precision in mineral identification as follows: (1) the region between 200 and 400 cm−1 corresponding to the rotational–translational modes; (2) the region between 600 and 800 cm−1 corresponding to the deformation modes of the tetrahedral pyramid; and (3) the region between 900 and 1200 cm−1 corresponding to the stretching mode of the Al-SiO4 (Freeman et al., 2008; Berlanga et al., 2019).
Plagioclase and K-feldspar phases have been detected in S3, S5, S6, S8, S9, and S10. The minerals detected in S3 and S10 present their main band as a doublet at ∼508 and ∼475 cm−1 and correspond to albite, the Na endmember feldspar. Also, this mineral classification has been confirmed with other secondary bands, such as the rotational–translational modes at ∼285 cm−1. In the S8 sample, in addition to albite, there are other plagioclase feldspars. Plagioclase feldspars with bands at ∼507 and ∼478 cm−1 may correspond to labradorite (Freeman et al., 2008) or oligoclase (by comparing with the RRUFF mineral database); however, more bands from Al-SiO4 rotational–translational modes are needed to identify the specific phases properly (Freeman et al., 2008).
Considering the general formula of plagioclase feldspars (Na,Ca)(Si,Al)4O8 and their crystal structure, the Al-SiO4 tetrahedra have different band positions where the Al cations can replace the Si anions, and Na and Ca are located in the tetrahedral sites (Ashcroft and Mermin, 1976). As such, structural and chemical variability may create small shifts in the Raman bands. Befus et al. (2018) reported that in potassium and plagioclase feldspars, Raman spectra may vary due to geological and physical conditions such as mafic magma composition, medium- to high-grade metamorphic facies, and feldspar-bearing mantle environments.
4.7. Organics
The RLS Sim detected several kinds of organics in the CanMars samples, consistent with analyses to detect biosignatures at the site (Malherbe et al., 2017; Maggiori et al., 2020). First, a carotenoid signature was present in samples S3 and S4. Raman spectra from samples S3 and S4 display strong bands at ∼1004, ∼1156, and ∼1514 cm−1 from Figs. 5S3 and 6S4. According to Jehlička et al. (2014), several biosignatures based on carotenoid signatures from different microorganisms can be differentiated by Raman spectroscopy and subsequently categorized. The Raman spectra of such microorganisms (such as Phormidium cf. subfuscum, Porphyridium cruentum, Balbiania investens, and Ectothiorhodospira) show the following features: (1) C = C stretching in the region around ∼1520 cm−1, (2) C-C stretching at ∼1150 cm−1, (3) C-H bending between 1000 and 1100 cm−1, and (4) a weak broad C-H band around ∼2950 cm−1 (Jehlička et al., 2014).
We observed that such Raman spectra retrieved from CanMars are more similar to Ectothiorhodospira (spirilloxanthin-like carotenoids)-type Raman spectra (Jehlička et al., 2014; Malherbe et al., 2017). It is important to note that inherent differences in the microorganism classification may be due to the specificity of the different analytical techniques and calibration, the variability of samples, and laser power that may thermally degrade such microorganisms, or bond breakage at 532 nm laser excitation. Furthermore, other potential candidates contain carotenoid signatures such as cyanobacteria, algae, and other microbes; however, these cannot be confirmed since we were limited to basing our analyses on those candidates presented in previous similar studies (Malherbe et al., 2017; Maggiori et al., 2020).
Furthermore, the C-H band at ∼2950 cm−1 was not detected or was too weak to be discriminated from the background (Figs. 6 and 7). This may be due to limitations in the limit of identification (LOI) (Vítek et al., 2013; Jehlička et al., 2014) and the nonmonotonic time dependence of the background intensity (Huang et al., 2010). Considering the LOI, the C-C and C = C bands are five times stronger than the C-H bands; this likely accounts for why the C-H bands in Figs. 5 and 7 cannot be discriminated in the spectra.
Despite the limited amount of Raman data obtained on the bands between ∼1300 and 1600 cm−1, we can assign the lower region bands D1 and D2 to C-C bonds from macromolecular carbon, or MMC at ∼1340 cm−1 and to the G band at ∼1577 cm−1 with a shoulder at 1621 cm−1 (i.e., Fig. 7S9) (Marshall et al., 2010; Shkolyar et al., 2018). MMC bands represent an aromatic structure tending toward disorderd graphite, depending on the maturity and degradation extent, but its biogenic or abiotic provenance is unable to be determined from a Raman spectrum alone (Pasteris and Wopenka, 2003). The bands from the C-C vibration in S4 (Fig. 7) are too weak to assign the C-C bands properly.
Subsequently, more highly resolved bands in this region and C-H bands at higher wave numbers (i.e., 2900 cm−1) are required to identify the kind of organic (C-C) bands and possibly distinguish the vibrational features from an organic functional group such as aromatic amino acids (AAA), α-amino acids, or hydrocarbons.
4.8. Organic fluorescence signature
In addition, the broad fluorescence bands detected between 2500 and 3500 cm−1 may be assigned to chlorophyll features. Even though the use of a 532 nm excitation wavelength has a resonant effect that greatly increases the signal of the carotenoid signatures with Raman spectroscopy (which results in the detection of the carotenoid peaks at ∼1004, ∼1156, and ∼1514 cm−1, as described before), it is nevertheless not surprising that a strong fluorescence from organic pigments can occur, where the chloroplasts containing the carotenoids are activated and produce abnormally high fluorescence.
In effect, this overwhelms the expected Raman bands produced by the C-H from the carotenoid signature at ∼2950 cm−1 (Vítek et al., 2013; Jehlička et al., 2014). In such cases, one potential mitigation strategy is to carry out a fluorescence quenching of the molecules to decrease the fluorescence and detect the C-H with a 532 nm excitation laser Raman instrument such as the RLS Sim (Huang et al., 2010).
The chlorophyll signal (S3 and S4) can be easily detected from the high fluorescent bands in the visible region, especially from 500 to 1000 nm with a doubled broad peak between 600 and 800 nm (Figs. 4 and 5). In general, the chlorophyll signal is emitted by its green pigmentation, such as that associated with the possibly assigned Ectothiorhodospira (spirilloxanthin), which absorbs UV light for photosynthesis. A small portion of the absorbed light is re-emitted as fluorescence in the visible spectrum.
The broad bands produced by chlorophyll can be observed from ∼2500 cm−1 onward and peak at ∼3500 cm−1 (from 620 nm) with 532 nm Raman excitation wavelength. This emission from chlorophyll may mask the C-H and water bands at ∼2900 cm−1 (Pedrós et al., 2008).
4.9. Heterogeneity of the minerals in the CanMars samples
The frequency of each mineral identified over the 39-point spectra by using the RLS Sim is summarized in Table 3 and illustrated in Fig. 8 for all samples (from S1 to S10). The individual minerals have been grouped through their general classification.
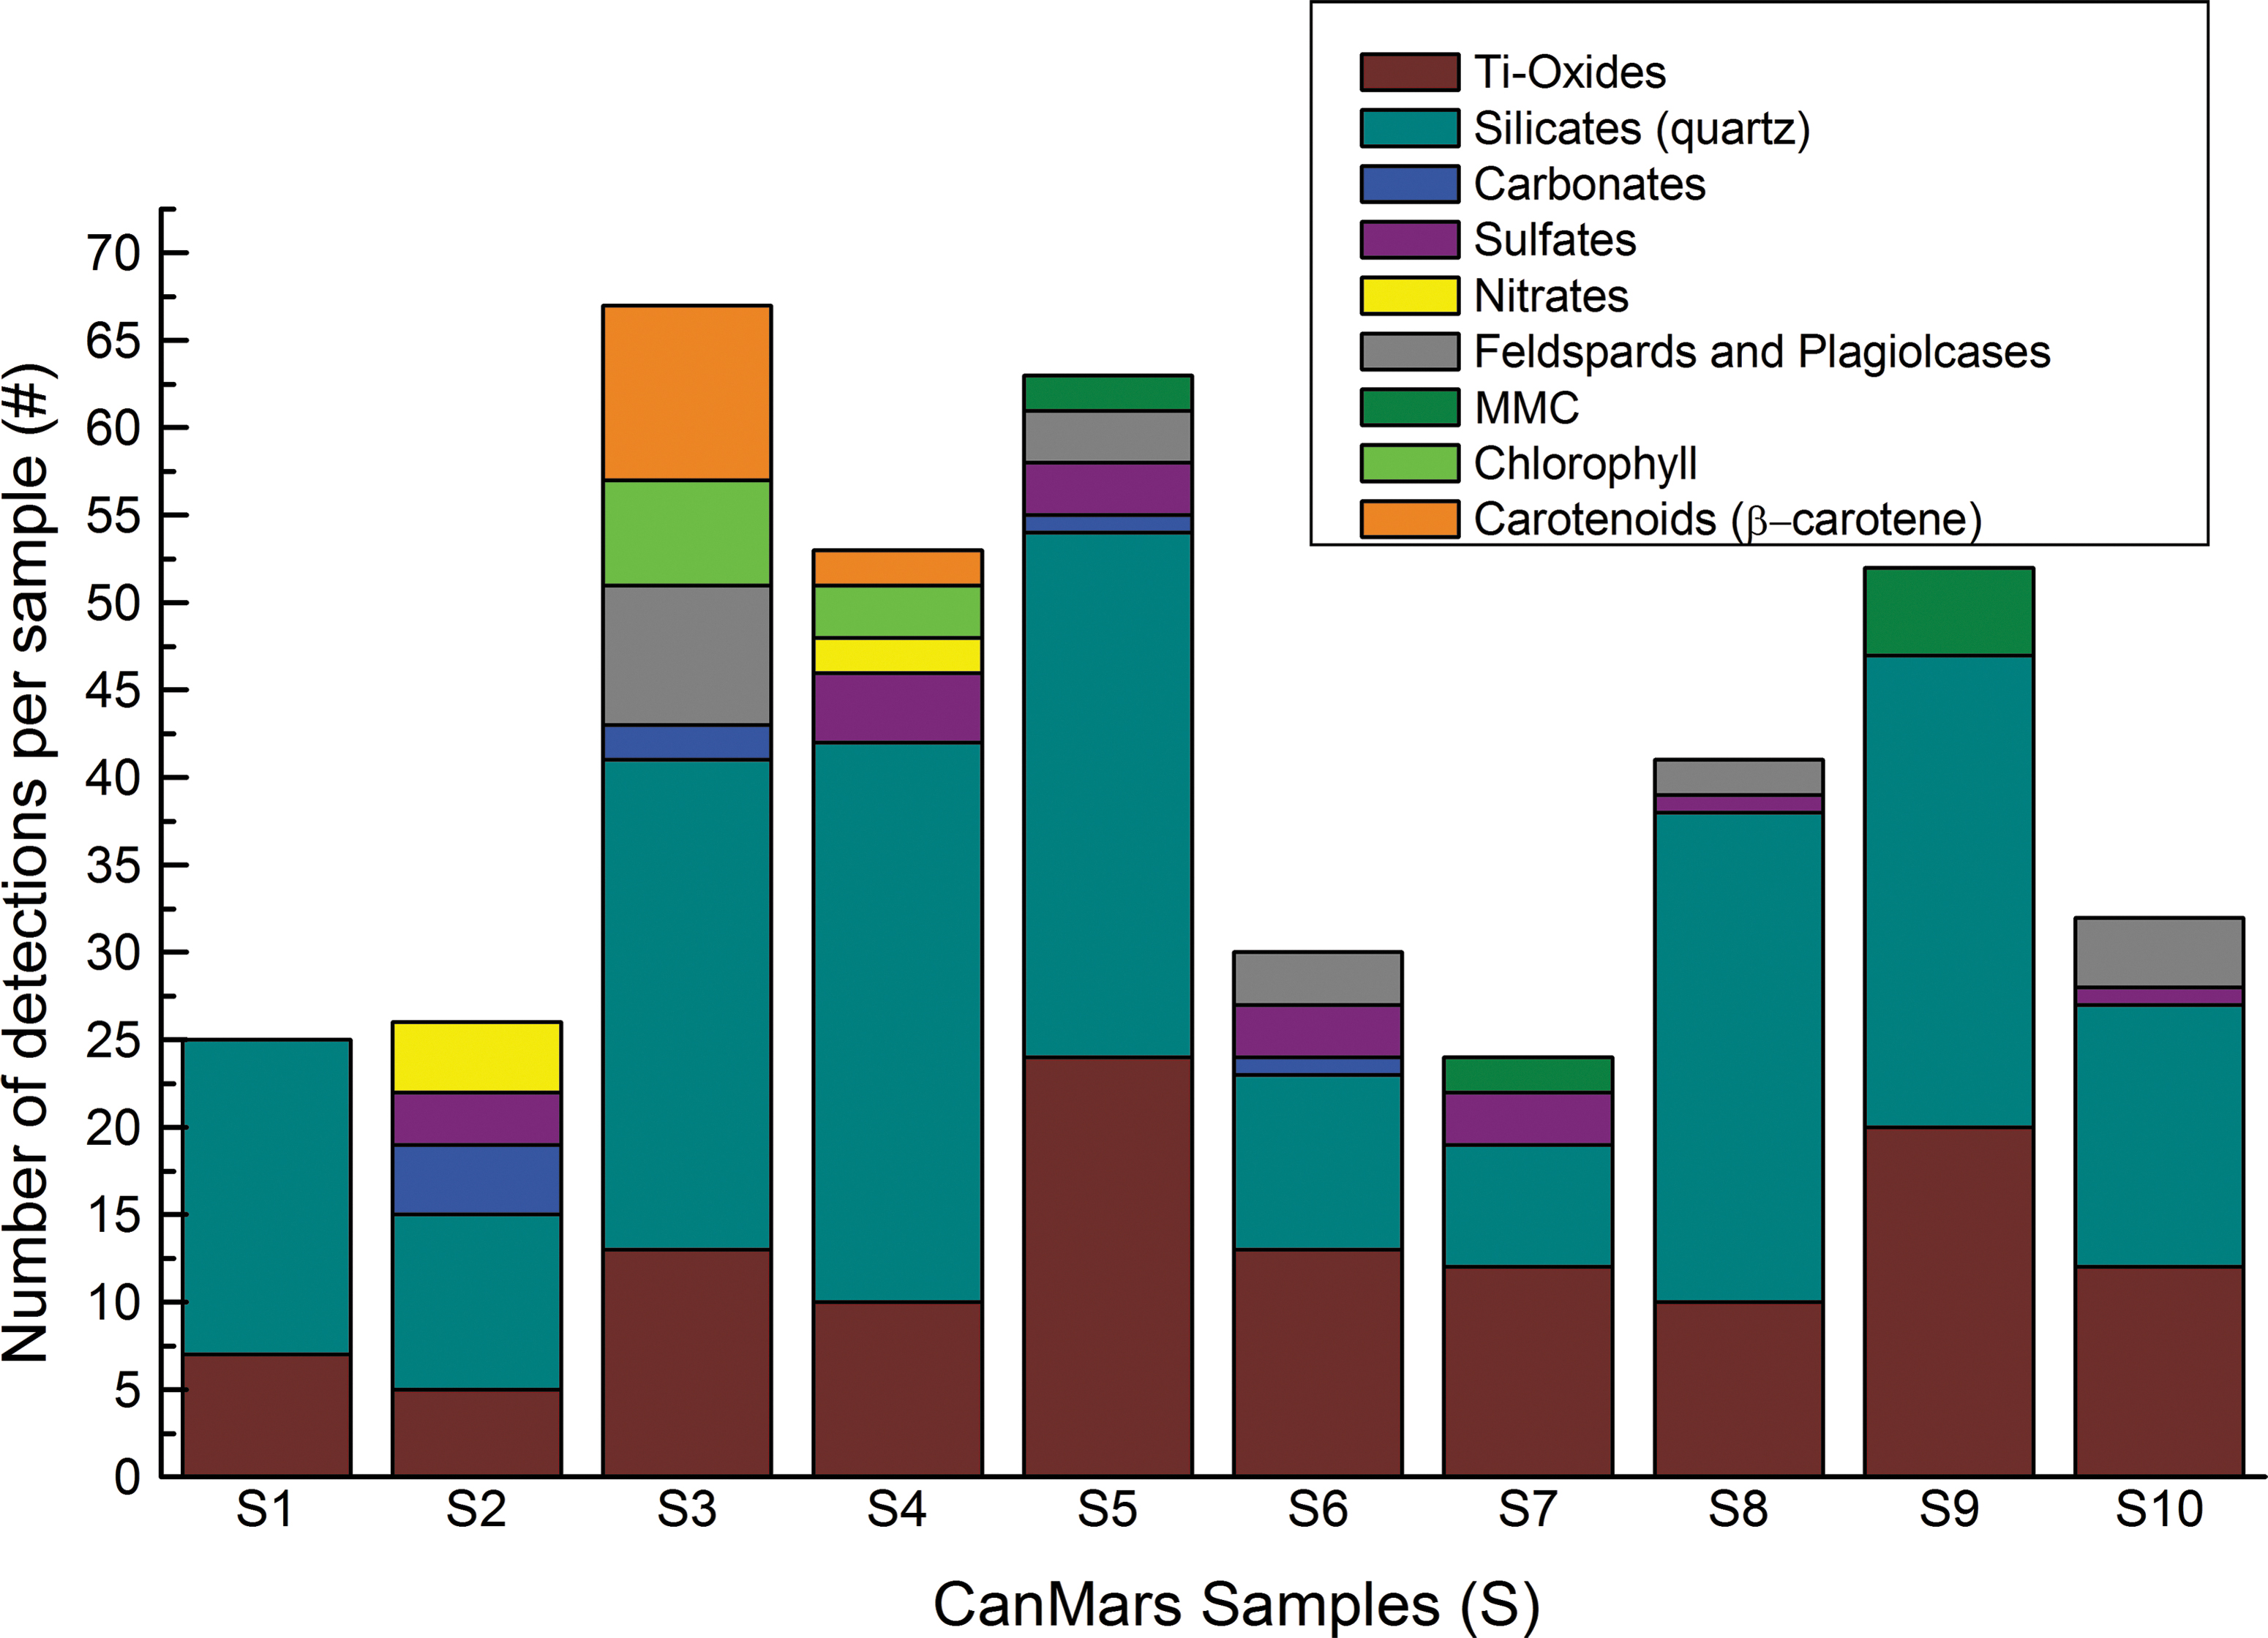
Summary of the minerals detected by Raman analyses using the RLS Sim with the corresponding number of detections per sample in 39 automatic pointing analyses. MMC, macromolecular carbon.
Summary of Mineral Detections by Raman Analyses Using the Raman Laser Spectrometer ExoMars Simulator with the Corresponding Number of Detections per Sample in 39 Automatic Pointing Analyses per Sample
More Raman bands are needed for better identification.
Other supporting measurements with non-Raman feature.
5. Discussion
The RLS Sim enabled the detection of previously unidentified phases in the Hanksville field samples by Raman spectroscopy, such as sulfates, nitrates, other feldspar-phases, and carotenoids, compared with past work in the site (Caudill et al., 2019; Stromberg et al., 2019) and nearby regions such as Dakota sandstone, Morrison formation, and Summerville formation (Ehrenfreund et al., 2011; Kotler et al., 2011; Stoker et al., 2011), as seen in Table 2. To better understand the results, we divide the discussion into the following parts: (1) detection of minerals with the RLS, (2) organic detection and biosignature preservation, (3) combined analyses and data fusion, and (4) martian astrobiology.
5.1. Detection of minerals with the RLS
The characterization results of the CanMars samples by the RLS Sim in the present study allowed for identification of several mineral phases that were not reported previously. These minerals include sulfates (i.e., bloedite, thenardite, and goslarite), nitrates (i.e., nitratine), and Ti-oxides (i.e., anatase and rutile). The origin of these secondary minerals is postemplacement from diagenetic environments (Caudill et al., 2019). Furthermore, Caudill et al. (2019) proposed that the minerals in question are important for metabolically significant organisms that can be formed via a biologically induced and controlled process (Mojzsis and Arrhenius, 1998; Gramp et al., 2010).
Considering the CanMars and EuroGeoMars simulated missions from the Utah Desert (the latter an analog mission with a complementary mandate to CanMars), the presence of the aforementioned minor phases (sulfate and carbonates) in the samples indicated processes that involved long-duration aqueous conditions such as the reported aqueous alteration of silicic volcanic ash from volcanic emplacement in the lakes from several western and southwestern sites from the outcrop (Demko et al., 2004). Such analyses, combined with organic detections (next section), improve the utility of terrestrial analog studies such as this one for informing biosignature analyses on Mars in habitable environments (Ehrenfreund et al., 2011; Caudill et al., 2019).
Although the RLS Sim detected additional minor mineral phases and compounds compared with the reported results from the work of Stromberg et al. (2019), it failed to detect the reported clays present in the samples, which were detected by XRD and reflectance spectroscopy. This is in accordance with the results from the work of Stromberg et al. (2019). Furthermore, reflectance spectroscopy detected characteristic bands of a phyllosilicate phase based on a combination of Al–OH and metal-OH bands (Stromberg et al., 2019).
Given the geology of Oxia Planum, the detection of clays could be important for the ExoMars mission. Although RLS is well suited for detecting several minerals, such as silicates, carbonates, or sulfates, it is known that clay detection is challenging from an instrumental point of view, especially for 532 nm excitation wavelengths. This is particularly true in samples such as those from the CanMars suite due to the following factors: (1) the low Raman backscattering efficiency of clays, especially when minimally abundant clays are mixed with efficient Raman scatterers (such as sulfates, carbonates, or silicates) (Chryssikos, 2017); and (2) the small grain size when compared with the Rosalind Franklin rover granulometry, which can negatively affect the spectra by increasing the already high fluorescence background of these types of samples associated with Fe3+-induced fluorescence (Schroeder et al., 2003).
Furthermore, automatic analysis (in contrast to the manual mode of the simulator) allowed for the detection of other phases that are not typically visually differentiable when conducting manned measurements. From this, we observe that the automatic analysis increases the chances of identifying minor phases in each sample such as oxide (rutile), certain sulfates (i.e., goslarite), nitrate (nitratine), and feldspars (labradorite, oligoclase, and albite), as observed in Table 2. However, there is a trade-off between general instrument performance and the risk of damaging thermolabile phases (including organics).
Nevertheless, the power of the RLS Sim (12 mW) has been chosen to ensure a good trade-off, considering the lower heat dissipation expected in the low-pressure martian atmosphere. In the RLS system, the 532 nm excitation wavelength presents higher photon bombardment to the structure, creating more fluorescence and probably bond-breakage of certain minerals or organic compounds compared with other less energetic wavelengths (i.e., 632, 785, and 1064 nm) (Marucci et al., 2018).
However, 532 nm excitation wavelength presents more sensitivity in the Raman shift region because it allows covering of the entire range from 150 to 3800 cm−1, which is crucial for organic (C-H), other mineral bonding (-NH), and water detection (-OH and H2O). Also, excitation sources lower than 632 nm, such as the RLS wavelength, are advantageous for better band detections when the wavelength is close to the electronic absorption wavelength of minerals, resulting in increased resonance enhancement (Marucci et al., 2018).
Furthermore, Raman intensity varies with the fourth power of the observed frequency (which is related to the inverse of the excitation wavelength) (McCreery, 2001). In other words, the selection of lower wavelength excitations increases the Raman emission efficiency of the system. The ExoMars RLS features a high efficiency excitation wavelength, 532 nm, to avoid excessive induced thermal damage and reduce the probability of bond breaking of photosensitive minerals, while also maximizing the Raman emission with minimum energy consumption by the instrument.
5.2. Organic detection and life preservation
The Jotunheim formation in Hanksville, ∼200 m from the sampling site presented here, is a paleochannel environment rich in quartz, calcite, and gypsum (Caudill et al., 2019; Maggiori et al., 2020). Maggiori et al. (2020) reported that samples from Jotunheim formation were able to host a wide variety of microorganisms, including numerous cyanobacteria and sulfate-reducing bacteria. Our results are consistent with those from the work of Maggiori et al. (2020), confirming the detection of the bacteria and their possible association with nitrates and sulfates (goslarite or Mg-sulfates).
The RLS Sim detected several different kinds of organic compounds. In the present results, the Raman analysis and Gaussian fitting identified carotenoid signatures, perhaps corresponding to Ectothiorhodospira—a sulfur-metabolizing bacteria of the spirilloxanthin type based on previous results from the works of Jehlička et al. (2014), Malherbe et al. (2017), and Maggiori et al. (2020). This strengthens the confidence of the initial carotenoid signature detection by Stromberg et al. (2019), whose analyses were limited due to background noise and/or fluorescence.
Maggiori et al. (2020) studied some of the CanMars samples, as well as other samples, including endolith-bearing sediments and rocks from Hanksville. They detected several spectral bands in Raman and reflectance spectra indicting the existence of bacteriorhodopsin, bacterioruberin, astaxanthin, and lutein (Maggiori et al., 2020).
We conclude that the organics detected in the samples may be the preserved evidence of past microorganisms. The origin of the C-C bands is most likely the result of macromolecular (kerogenous) carbon in samples originating from preserved biogenic organics or the thermal degradation of biomolecules such as carotenoids, based on the well-established microorganism-rich context of the site (Maggiori et al., 2020).
Compared with the results from the works of Martin et al. (2020) and Stoker et al. (2011), which were obtained in the Tecopa Basin and carried out with SuperCam and SHERLOC simulators, our results indicate that organics may be partially pristine and thermally immature. There was a lack of detectable organic matter in several cases, suggesting that organic abundances fall below the detection limits of the various analytical techniques applied to the samples.
Furthermore, the broadness of the C = C band indicates almost no graphitization and amorphous behavior, compared with the results of Martin et al. (2020). This makes abiotic graphite production an unlikely source for the carbonaceous compounds detected, as hydrothermal and metamorphic influences necessary to produce it are absent. A complete analysis of the hypotheses about the detection of organics exceeds the scope of this work. Thus, we refer to the works of Stoker et al. (2011) and Maggiori et al. (2020) for a more detailed discussion of the astrobiological context of the Hanksville site.
No definitive origin of the organics can be surmised, which demonstrates the known limitations in determining the biogenicity of the MMC in samples by using Raman spectroscopy (Pasteris and Wopenka, 2003; Marshall et al., 2010). In the context of planetary missions such as ExoMars or Mars 2020, the possible detection of organic carbon will indicate the presence of a potential biosignature-containing sample to be investigated further for provenance with other onboard in situ techniques (Harris et al., 2015) or after cache and return to Earth for biogenicity analysis.
As mentioned previously, the wavelength and power of the laser can produce thermal damage and photochemical modifications such as bond breakage. The sample will dictate whether fluorescence suppression is required, to what degree, and how sensitive the sample is to damage. UV excitation wavelengths such as those employed by SHERLOC or LiRS systems have very high scattering intensity and no interference with the fluorescence effect (Eshelman et al., 2014; Lalla et al., 2021a).
However, high-energy UV photon bombardment may burn or degrade the sample in question by several effects such as photobleaching and bond breaking. A higher excitation wavelength in the IR, such as 785 and 1064 nm, has the advantage of fluorescence suppression, but lower Raman scattering intensity, more complicated instrumentation, and a narrower Raman-shift range (Sato et al., 2001; Marucci et al., 2018; Jehlička et al., 2019).
Comparably, visible wavelengths such as 532 nm in the RLS system can provide high Raman scattering and a higher fluorescence background with a lower risk of damaging the organic target when using accurate measurement configuration. With the 532 nm wavelength Raman system at the corresponding laser power (20 mW), fluorescence quenching configuration and optimized measurement time have significant advantages for space exploration. Laser power lower than 100 mW and long exposure at different wavelengths have been found to avoid photochemical damage and photobleaching, and our results plus those of similar studies (Shafer-Peltier et al., 2002; Stöckel et al., 2016; Marucci et al., 2018) show that this power and configuration are suitable for the detection of carotenoids.
However, other studies have found that laser powers close to those used by RLS (∼31 mW) are still high enough to degrade immature organics, such as cyanobacterial components (i.e., lichen) (Som and Foing, 2012).
5.3. Combined analysis and data fusion
The analysis presented here also shows several other features to be considered, such as the combination of Raman spectroscopy with other analytical techniques. In particular, we observe that the RLS Raman measurements are complementary to other methods such as XRD, UV-Vis-NIR reflectance methods, and LIBS (Ehrenfreund et al., 2011; Kotler et al., 2011; Stoker et al., 2011; Stromberg et al., 2019; Konstantinidis et al., 2020).
Determining how to proceed in a synergistic approach with respect to target selection and subsequent analyses to be conducted is critical for rover missions. For example, in the Rosalind Franklin payload, several of the nine instruments will work in direct combination with the RLS system at different scales in unison to meet the ExoMars mission's science goals. Among the essential payloads in the combined operations with the RLS system will be PanCam for wide-angle, stereo, monoscopic imaging, ISEM, a point spectrometer boresighted with PanCam, Ma_MISS for analyzing the borehole while drilling, and CLUPI for providing the context and texture of the sample core before crushing it.
In addition, the instruments of the ALD, including MicrOmega and MOMA, will be used with the RLS instrument for onboard collaborative science to analyze the samples in the same spots (Pilorget and Bibring, 2014; Rull et al., 2017; Vago et al., 2017; Lopez-Reyes et al., 2020). These combined measurements will provide the general guidance for automatic analysis, such as the priority order for the different targets, target associations to be further investigated by the ExoMars science team, and the degree of automatic guidance.
As observed in Table 2, UV-Vis-NIR reflectance spectra are relevant to PanCam and ISEM, from which the detection of carbonates, sulfates, clays, and organics was confirmed and subsequently verified by Raman spectroscopy and vice versa (Pilorget and Bibring, 2014; Rull et al., 2017; Vago et al., 2017; Lopez-Reyes et al., 2020). Many of the results obtained from the RLS can be supported by complementary measurements such as XRF, LIBS, and reflectance spectroscopy.
However, no one technique was able to identify all phases present in the Hanksville samples. For many phases, only a single technique was able to identify them. For example, nitrates were detected only with the RLS measurements, whereas clays were detected only by XRD. Similarly, high S in S2, S4, S6, S7, and S8 can be assigned to sulfates by RLS, in the form of detection of the different sulfates (Tables 2 and 3) and previous XRD results (Stromberg et al., 2019). Lastly, the detected anatase and rutile on the samples were inferred via the presence of Ti, obtained by LIBS (Konstantinidis et al., 2019b; Stromberg et al., 2019).
Current and past Raman spectroscopic analyses at different wavelengths and laser types (i.e., continuous-wave or pulsed), and reflectance spectroscopy, showed more sensitivity than XRF and LIBS in the detection of organic material such as carotenoids, chlorophyll fluorescence, and MMC (Villar et al., 2005; Stromberg et al., 2019; Lalla et al., 2021b). Other studies performed with SHERLOC-like (248.1 nm wavelength) and SuperCam-like (532 nm wavelength) Raman instruments have studied the mineralogy, chemistry, and organics from clay-rich lacustrine-volcanic outcrops (Martin et al., 2020). Their results show that the synergies between these instruments through combined data fusion methods might improve the results on the upcoming Mars 2020 mission (Martin et al., 2020).
Similarly, Shkolyar et al. (2018) showed that combined laser spectroscopy analyses using SHERLOC-like Raman and fluorescence data (at 266 nm wavelength) on MMC improve the confidence of a biosignature detection in Mars analog samples.
Spectroscopic data such as those obtained by the abovementioned techniques are ideal candidates for analysis by multivariate analytical techniques. The use of Multivariable Analysis (MVA) with Raman and LIBS spectroscopy data has provided useful results in the past (Lopez-Reyes et al., n.d.; Clegg et al., 2009; Schröder et al., 2013; Konstantinidis et al., 2019a; Manrique-Martinez et al., 2020), shifting the analytical paradigm into the application of these kinds of techniques to perform qualitative and quantitative analysis of Raman data. Such information as provided by Raman spectroscopy and LIBS (or other elemental detection instruments) is complementary, making these two techniques ideal candidates for applying multivariate data fusion.
The multivariate analysis of fused data of Raman and LIBS was proposed for Perseverance by Clegg et al. (2009) and future missions by Manrique-Martinez et al. (2020). Indeed, multivariate analysis shows that a potential improvement of the classification of samples can be obtained by jointly analyzing Raman and LIBS data (Anderson et al., 2015; Cote et al., 2019; Konstantinidis et al., 2019a, 2019b). Similarly, the XRF, mass spectrometry, and LIBS results from the work of Stromberg et al. (2019) highlight the advantages of incorporating detailed elemental composition analyses from two or more instruments, such as MOMA-LDMS from ExoMars with Raman spectroscopy (Vago et al., 2018).
Combined spectroscopic, geological, and mineralogical research, as carried out in the CanMars and other analog missions (Ehrenfreund et al., 2011; Caudill et al., 2019), has shown the ability of multi-instrument data analysis to strengthen interpretations of geological features and their relevance to possible past or present life on Mars. For example, characterization of the stratigraphy, the structural and textural geological context, and microscopic examinations (such as grain mineral matrix properties) were performed by Osinski et al. (2019) to strengthen the interpretation of the geology of the Hanksville site.
Micro-Raman analysis carried out by the RLS system in the present study complemented previous studies, that is, by identifying previously undiscovered sulfates, carbonates, and nitrates, whose astrobiological importance is discussed in the next section.
5.4. Martian astrobiology
In general terms, martian sites considered habitable and targeted for biosignature studies often consist of high amounts of phyllosilicates and clays (e.g., montmorillonite and nontronite), evaporitic sulfates, oxides (e.g., Fe-oxides and Ti-oxides), iron oxyhydroxides (e.g., goethite and ferrihydrite), and carbonates (Fe-carbonates) (Fairén et al., 2010; Marzo et al., 2010; Mahaney et al., 2012; Ehlmann and Edwards, 2014; Vago et al., 2018). Of particular importance to astrobiology are sulfates, carbonates, and phyllosilicates. Clays and phyllosilicates originated by the alteration of the oldest silicate formations (from the Noachian period). Moreover, sulfates are derived from rock alteration caused by variations in water and pH conditions (from neutral to acidic) (Fairén et al., 2010; Vago et al., 2017).
Many studies have emphasized that the strategies of the search for life must be focused on the detection of potential preserved biosignatures in sediments deposited during aqueous conditions on early Mars in environments containing some of the same minerals identified in CanMars samples. For example, carbonates are the most common host minerals for fossil biosignatures in the terrestrial rock record (Shkolyar and Farmer, 2018). Oxides, silicates, and carbonates can enhance the stability of certain amino acids, sugars, and other molecules concentrated on their surfaces (Röling et al., 2015; Shkolyar and Farmer, 2018).
Hanksville outcrop presents a wide temperature range, soil salinity, oxidized rocky soils, and aridity, representing an excellent analog to Mars (Fairén et al., 2010; Stoker et al., 2011; Caudill et al., 2019). Moreover, the Hanksville site hosts diverse microbial communities (Maggiori et al., 2020). Cumulatively, some of these characteristics may reflect the role of mineralogy (species, abundances, and compositions) as a key factor controlling the presence, distribution, and preservation of biosignatures (Röling et al., 2015). For example, certain metals, such as iron, are indispensable for microbial processes in sulfur-reducing or sulfur-oxidizing bacteria (Röling et al., 2015; Markovski et al., 2017).
Moreover, minerals detected in the CanMars samples, such as nitrates, oxides, carbonates, and sulfates, contain Ti, Ca, Mg, Mn, Na, and Zn. These elements are essential as micronutrients for various metabolic activities and redox processes (Brasier et al., 2011). For example, certain bacteria and microbes are capable of reducing Fe from sulfides (or other minerals, including Zn or Ti), thereby releasing sulfate anions that can form sulfate minerals, such as gypsum (Brasier et al., 2011). In addition, monatomic ions and transition metals help build the organometallic complexes required for enzymatic reactions in sulfates, carbonates, and nitrates.
6. Raman Spectroscopy for Mars and Planetary Exploration
We have detected and discussed the significance of several secondary minerals such as nitrates and sulfates in samples with the RLS Sim system present in natural samples from a Mars analog outcrop. Furthermore, we have demonstrated that Raman spectroscopy is capable of identifying relevant biogenic molecules such as carotenoids. Furthermore, certain fluorescence detection, such as the chlorophyll fluorescence, could be advantageous for detecting biosignature on Mars in Oxia Planum.
The features and capabilities discussed above make the RLS a key instrument for the upcoming ExoMars mission (Rull et al., 2017). Furthermore, Raman spectroscopy is used by not one, but two payload instruments, SHERLOC and SuperCam, onboard NASA's Perseverance rover (Beegle et al., 2015; Wiens et al., 2016). The results obtained here illustrate the potential for Raman spectroscopy as a favorable technique for conducting mineral and organic identifications on planetary surfaces and justify its choice for the first time as a payload instrument to fly to Mars onboard two different missions.
Apart from martian exploration, the potential of Raman spectroscopy has been extended to other planetary bodies, such as the Moon, martian moons, and asteroids. In addition, Raman spectroscopy has been proposed for detecting biosignatures on Europa (Hand et al., 2017; Sharma et al., 2020). Micro-Raman systems modeled on RLS and SHERLOC, as well as standoff Raman systems, have been recommended as part of baseline payloads for potential lander/rover missions to Europa (Beegle et al., 2015; Hand et al., 2017; Rull et al., 2017). For example, Sandford et al. (2020) developed a compact, portable, remote standoff Raman system capable of detecting water, water ice, hydrous minerals, organics, nitrates, and amino acids from a remote distance of 122 m in natural lighting conditions.
Furthermore, the Japan Aerospace Exploration Agency (JAXA) is preparing a mission to the martian moons (Martian Moons eXploration—MMX) for launch in 2024 (Hagelschuer et al., 2019). The “Raman for MMX” (RAX) instrument payload is planned to probe the surface mineralogy of Phobos. Some of the principal parts of the RAX system are based on the RLS system (Hagelschuer et al., 2019).
Finally, UV-Raman systems are being developed for in situ surface exploration of asteroids. One such instrument includes the LiRS, currently being developed for a putative flight-concept payload, combining LIBS, UV-Raman, TR-LIF, and reflectance spectroscopy (Cote et al., 2019; Konstantinidis et al., 2019a; Lalla et al., 2021a). Lymer et al. (2020a, 2020b) investigated UV-Raman and Time-Resolved LIF-like LiRS-like capabilities for the detection of organics in meteorites in support of future in situ and sample return missions to asteroids.
7. Conclusions
As missions to Mars continue to provide new insights and data, we continue to strive to maximize their science return. To succeed in the life detection endeavor, understanding contextual geochemistry is essential for proper interpretation of any signs of past or present life and any organic molecules that may be found.
In this work, we present the mineralogical and organic characterization results of the CanMars samples using the RLS Sim. The RLS Sim results enabled the detection of nitratite, sulfates such as goslarite, and feldspars. Other Na-sulfates were detected tentatively, such as bloedite or thenardite, with additional bands needed for confirmation. The organics detected correspond to carotenoid signatures from cyanobacteria, a microorganism, or algae. Furthermore, the carotenoid signatures from CanMars may be assigned to Ectothiorhodospira (spirilloxanthin)-like carotenoids based on previous studies and our corresponding Raman analysis.
Also, strong fluorescence was detected in some samples, stemming from chlorophyll, which masked C-H vibrational bands. Moreover, the complementarity between the present results and past studies provides us with insights into the synergies between data obtained from combined mission payload instruments, similar to those aboard the Perseverance and Rosalind Franklin rovers, as well as how different Raman systems perform on the same sample suite. Particularly, the high fidelity of the RLS Sim to the ExoMars SPDS and parallels between the CanMars mission to the Perseverance and Rosalind Franklin rovers allow us to provide a reasonable baseline for the capabilities of different spectroscopic techniques (LIBS, Raman, IR, and passive reflectance).
Focusing on the RLS Sim analysis of the CanMars samples, we found that it provides a higher degree of sensitivity for identifying oxides, nitrates, and feldspars than that obtained in previous work with other techniques. Moreover, the RLS Sim yielded similar or slightly reduced sensitivity relative to previous work with other techniques in the case of carbonates, sulfates, and organics.
The only mineral class in which the RLS provided unsuccessful detections, compared with past work, was in the clays. This was attributed to a combination of (1) low Raman backscattering efficiency, (2) low mineral abundance, (3) grain size, and (4) high fluorescence background. To maximize the scientific output of future Raman instruments onboard planetary missions, it is imperative that these four considerations be evaluated in their design and calibration.
In addition, the physical form of the sample (i.e., bulk sample, powdered sample, porosity, and sample compression) should be considered to optimize detectability, as was found to be the case in previous analyses of the CanMars samples (Stromberg et al., 2019). Still, the RLS Sim yielded similar, if not better, results in all of the other cases, thus illustrating its key role for the exploration of Mars and other planetary targets. RLS measurements were complementary to the other results obtained by XRD/XRF, UV-Vis-NIR reflectance spectroscopy, UV-Raman, and LIBS systems (portable and breadboard-based) presented in the works of Konstantinidis et al. (2019b) and Stromberg et al. (2019).
Footnotes
Acknowledgments
E.A.C. thanks the CSA, the Natural Sciences and Engineering Research Council of Canada (NSERC), the Canada Foundation for Innovation, the Manitoba Research Innovation Fund, and the University of Winnipeg for supporting this study. E.A.C. thanks Catherine Maggiori, Matthew Morison, Alexis Parkinson, Nora Casson, Daniel Applin, Arola Moreras Marti, Debarati Das, Richard Leveille, Kim Berlo, Lyle Whyte, and Shiv Sharma for their assistance in the CanMars field work and subsequent sample analysis.
Author Disclosure Statement
No competing financial interests exist.
Funding Information
M.G.D. at CRESS, York University, is especially thankful for the financial support provided by the NSERC, the Ontario Centre of Excellence (OCE), and the CSA. G.L.-R., M.V., F.R., and J.A.M. would like to acknowledge the financial support provided for this project by the European Research Council in the H2020- COMPET-2015 programme (grant 687302) and the Ministry of Economy and Competitiveness (MINECO, grant ESP2017-87690-C3-1-R).
Abbreviations Used
Associate Editor: Michael C. Storrie-Lombardi