
Abstract
With no direct extant-life detection instrumentation included in a space mission since the 1970s, the advancement of new technologies to be included in future space missions is imperative. We developed, optimized, and tested a semi-automated prototype, the microfluidics Microbial Activity MicroAssay (μMAMA). This system metabolically characterizes and detects extant microbial life by way of metabolism-indicator redox dyes. We first evaluated the robustness and sensitivity of six redox dye/buffer combinations, and we then tested their responses to metabolic activity in astrobiological analog high-Arctic samples. We determined that the Biolog Inoculating Fluid (IF)-C and AlamarBlue buffered in IF-0a (aB-IF0a) dye/buffer combinations were optimal, as they detected metabolic activity from the fewest microbial cells (102 cells/mL) while maintaining efficacy over a broad physiochemical range of pH (0–13), temperature (−10°C to 37°C), salinity and perchlorate (tested up to 30%), and in the presence of a Mars regolith simulant (MMS-2). The μMAMA, which incorporated these redox dyes, detected extant active cold-adapted microbial life from high Arctic analog sites, including samples amended with substrates targeting chemolithoautotrophic metabolisms. Given μMAMA's small size (we estimate a complete planetary instrument could occupy as little as 3 L) and potential for automation, it could easily be incorporated into almost any landed platform for life detection missions.
1. Introduction
The search for life on other Solar System bodies will be a major focus of astrobiology missions in the coming decades, with Mars, Enceladus, and Europa as the main targets (Hays, 2015). These targets are characterized by extremely low temperatures and environmental conditions that are harsher for life than those on Earth. Nonetheless, evidence of past and current habitats that could support extant microbial ecosystems on these bodies has been described, based significantly on our knowledge of the limits of microbial life in similar cryoenvironments on Earth (Arvidson et al., 2014; Grotzinger et al., 2014; Garcia-Lopez and Cid, 2017).
For instance, the considerably warmer and wetter martian environmental conditions in the past (Chevrier et al., 2007; Westall et al., 2013), together with recent evidence of brine water at recurring slope lineae (RSL) (Ojha et al., 2015) and of a polar saline subsurface lake (Orosei et al., 2018) on Mars, suggest the possibility not only of preserved biosignatures of past microbial life, but also extant microbial ecosystems.
The presence of microorganisms in terrestrial analog sites as RSL in Antarctica (Chan-Yam et al., 2019), in the brine of the ice-sealed lake Vida in Antarctica (Murray et al., 2012), in hypersaline subzero high Arctic springs in Canada (Niederberger et al., 2010; Lamarche-Gagnon et al., 2015), in lava tube ice caves (O'Connor et al., 2021), and in paleochannels (Maggiori et al., 2020) further support this possibility. In addition, the discovery of cold and salty oceans under the ice surface of Europa and Enceladus, and the presence of organics in Enceladus' water vapor plumes (Carr et al., 1998; Waite et al., 2006) also identify the icy moons as candidates for life detection mission such as the Europa Lander (Hand et al., 2017).
Despite the importance of life detection in current planetary missions to Mars, no direct extant life detection instrumentation has been included in a space mission since the 1970's Viking landers (Levin, 1997; Davila et al., 2010). Current instruments related to astrobiology-targeted space missions are focused on the detection of biosignatures from past life and the identification of new habitable environments (Parro et al., 2011).
Though not specifically designed for extant extraterrestrial life, recent advances have been made in life detection instrumentation of reduced size, mass, and energy requirements, with several including microfluidic systems. Examples of this are the microfluidic Sample Processor for Life on Icy Worlds (SPLIce) (Chinn et al., 2017; Chin et al., 2018; Radosevich et al., 2019), the low-Earth orbital PharmaSat, O/OREOS, and EcAMSat “cubesats,” and the deep-space BioSentinel payload, all of which detect(ed) onboard microbial metabolic activity by using redox indicator dyes (Nicholson and Ricco, 2020; Padgen et al., 2020b, 2021; Ricco et al., 2020; Santa Maria et al., 2020), and the MinION nanopore-based sequencing system, which was operated on the International Space Station (ISS) (Castro-Wallace et al., 2017).
Metabolism-indicator redox dyes, such as AlamarBlue (resazurin) (Rampersad, 2012) and Biolog dyes (tetrazolium) (Bochner et al., 2001; Bochner, 2008), report metabolic activity through their chemical reduction and concomitant color change due to the action of electron-transfer species associated with cellular respiration (Hamid et al., 2004). Since this approach is relatively simple, low-cost, and highly sensitive, it is among the best candidates for development of a microbial activity detection system. AlamarBlue has already been tested in a space exploration context, as part of one planned and three successful spaceflight missions (Nicholson and Ricco, 2020; Padgen et al., 2020b, 2021; Ricco et al., 2020; Santa Maria et al., 2020), whereas the Biolog system has been successfully tested in a high-Arctic analog environment (Goordial et al., 2017).
Here, we report the development and test of the microfluidics Microbial Activity MicroAssay (μMAMA), a life detection platform that metabolically detects extant microbial life and characterizes potential metabolic pathways by way of metabolism-indicator redox dyes.
Through a combination of laboratory and field work analyses, the robustness of six redox dye/buffer combinations was determined across a range of abiotic physiochemical parameters to assess conditions under which life can be detected without false positive results. In addition, we characterized the dyes' limits of detection (LODs) in terms of the initial number of cells (bacteria and yeast) required for an unambiguous response. The most sensitive and robust dye/buffer combinations were further tested with analog samples from the Canadian High Arctic. Finally, we incorporated these redox dye/buffer combinations into a unique machined and semi-automated μMAMA fluidic card and successfully detected microbial activity form these analog environments.
We complemented these tests by determining the microbial functional diversity of these environments with phenotypic microarray assays to compare with μMAMA platform results. This development of a small, simple, and portable system that is based on metabolism-indicator redox dyes and microfluidics could be readily incorporated into future rovers focused on life detection.
2. Materials and Methods
2.1. Study site and sampling
Our study sites were located near the Polar Continental Shelf Program facilities at Resolute Bay on Cornwallis Island, in the Canadian High Arctic (74°42′N, 94°49′W). Resolute Bay, located in an area considered a polar desert, has a mean annual temperature of −15.7°C, with a monthly average of −32.4°C in February and a monthly average of 4.5°C in July (Environment Canada, 2014), and ≤250 mm of annual precipitation (Douglas and Smol, 2000). Samples were collected in July 2018 (Fig. 1) and included permafrost active layer gravel soil (hereafter, GS), arctic lake sediment (LS), fresh stream water (STW), and brackish seawater (SW).

Canadian high-Arctic sampling sites. Permafrost active layer GS, Arctic LS, freshwater stream (STW), and SW samples were collected in 2018 on Cornwallis Island (74°42′N, 94°49′W). GHM and LHW were collected in 2019 on Axel Heiberg Island (79°26′N, 90°46′W). GHM, Gypsum Hill microbial mat; GS, gravel soil; LHW, Lost Hammer hypersaline water; LS, lake sediment; STW, stream water; SW, seawater. Color graphics available online.
The soil and sediment samples were collected with ethanol-sterilized metal sampling tools and placed into sterile Whirl-Pak bags. The liquid samples were collected with sterile plastic serological pipettes and placed into 1 L sterile Nalgene™ bottles. Samples were kept at 5°C while conducting Biolog EcoPlate analysis in the field (Section 2.4). The remaining samples were frozen at −20°C during transportation to the laboratory.
Additional samples were collected in July 2019 (Fig. 1) at the McGill Arctic Research Station on Axel Heiberg Island in the Canadian High Arctic (79°26′N, 90°46′W). These included samples of the Gypsum Hill perennial springs microbial mats (GHM) (Magnuson et al., 2020) and samples of Lost Hammer hypersaline spring water (LHW) (Lamarche-Gagnon et al., 2015), collected as described earlier. These samples were used to further test the μMAMA prototype.
2.2. Laboratory-based metabolic redox dye selection: tests for sensitivity and robustness
We selected six dye/buffer combinations for testing: AlamarBlue redox dye (Bio-Rad, Hercules, CA) at 10% of its stock concentration, diluted either in H2O (referred to as AlamarBlue buffered in H2O [aB-H2O] in this article), buffered in 0.1% Na4P2O7 (hereafter, AlamarBlue buffered in Na4P2O7 [aB-Na4P2O7]), or the Biolog IF-0a buffer (hereafter, AlamarBlue buffered in IF-0a [aB-IF0a]), and a set of commercially available redox-dye-and-buffer premixed Inoculating Fluids (hereafter, IF-A, IF-B, and IF-C); all these contain the Biolog IF-0a buffer with three different redox dyes (R#72401, 2402, 2403, 72268; Biolog, Hayward, CA).
To determine robustness of the signal, each dye/buffer combination was incubated in sterile conditions for 14 days in 96-well plates with a gradient of NaCl and NaClO4 (0%, 10%, 20%, 30% [w/v]), a gradient of pH (0–14), and with a sterilized solution of Mars analog soil simulant MMS-2 (5 g diluted in 15 mL of 0.1% Na4P2O7, vortexed for 2 min, and settled for 5 min; The Martian Garden, Austin, TX). Each of the conditions was tested in duplicate; the NaCl, NaClO4 gradients and the MMS-2 were tested at multiple temperatures (37°C, 23°C, 5°C, and −10°C) (Supplementary Fig. S1).
To determine their sensitivity and LODs, the six dye/buffer combinations were incubated at 23°C for 14 days in 96-well plates protected from light, sealed with a paraffin film, and placed in a Whirl-Pak bag containing a wet paper towel to avoid dryout of the wells. These incubations were carried out with increasing concentrations of cells from two model psychrophilic extremophile microorganisms, Planococcus halocryophilus (bacterium) (Mykytczuk et al., 2013), and Rhodotorula frigidialcoholis (Touchette et al., 2021). The inoculum ranged from 0 to 5.0 × 10⁷ cells/mL for P. halocryophilus and from 0 to 2.0 × 10⁷ cells/mL for R. frigidialcoholis (Supplementary Fig. S2).
Cell concentrations were determined by colony-forming units (CFUs) counts on tryptic soy broth (TSB; P. halocryophilus) and potato dextrose broth (PDB; R. frigidialcoholis) plates at 23°C (BD Biosciences, Franklin Lakes, NJ; HIMEDIA, Shenzhen, China). Original laboratory stock cultures were grown in TSB liquid media for P. halocryophilus and in PDB liquid media for R. frigidialcoholis liquid media at 23°C.
Optical densities (ODs) at 570 and 590 nm (OD570 and OD590, respectively) of the plates were measured to assess the redox dye reduction on a SpectraMax M2e microplate reader (Molecular Devices, San Jose, CA). The measurements were normalized by the subtraction of the negative control (no physiochemical modification, no microorganisms, or no environmental sample inoculation) and by the subtraction of the time = 0 values.
For the AlamarBlue redox dye, ΔOD570 was used to evaluate the disappearance of blue, and we assigned a ΔOD570 value cutoff ≥0.15 with a p-value <0.05 as a positive response. For the Biolog redox dye, ΔOD590 was used to evaluate the appearance of purple, and ΔOD590 values ≥0.20 with a p-value <0.05 were considered to be positive responses (Rico and Preston, 2008). We used these conversative absorbance threshold values to be rigorous and consistent with some previous literature reports.
However, lower threshold values could be used to detect smaller changes in dye reduction, and hence either smaller numbers of cells or shorter interaction times with the dyes; indeed, the EcAMSat and BioSentinel payloads demonstrated, in orbit, absorbance stabilities when using AlamarBlue nearly fivefold better (∼0.03 absorbance units) over durations of many hours (Padgen et al., 2020a, 2020b, 2021; Ricco et al., 2020). Further, in addition to the color-change response of AlamarBlue used by μMAMA, EcAMSat, and BioSentinel, the reduction product of AlamarBlue is brightly fluorescent; the manufacturer reports fluorescence to offer greater sensitivity (
One comparison of AlamarBlue fluorescence versus absorbance reported that the time needed to reach a reliable result was between 3 and 12 times shorter (i.e., more sensitive) when using fluorescence rather than absorbance (Räz et al., 1997). To attain lower LODs with μMAMA with smaller absorbance changes or using fluorescence will necessitate further testing and optimization in the former case, and the development of fluorescence measurement capability in the latter. Such fluorescence analysis is not provided by the Biolog dyes.
For IF-A sensitivity testing with Rhodotorula, metabolic activity was detected by visual inspection of the wells' color change only (appearance of purple), since growth of the pink yeast Rhodotorula was observed without detectable reduction of the metabolic dyes; this growth interfered with the OD590 measurement of the pink/purple color changes of the dye.
2.3. Testing aB-IF0a and IF-C metabolic redox dyes with environmental analog samples
Based on the results of sensitivity and robustness tests, we identified the two most robust and sensitive dye/buffer combinations, the aB-IF0a (AlamarBlue dye with IF0a buffer) and IF-C (Biolog Dye Mix G with IF0a buffer). These two dye/buffer combinations were then tested with LS, GS, SW, and STW samples to ensure they also detect activity with environmental samples. This was done by incubating the LS, GS, SW, and STW samples under a range of dilutions with each redox dye (aB-IF0a and IF-C) in 96-well plates containing dehydrated Reasoner's 2A (R2A; BD Biosciences) and IF-0a buffer.
For soil samples (LS, GS), 5 g of each sample was diluted with 15 mL of 0.1% Na4P2O7 (1:4 dilution) and vortexed for 2 min with 2.5 g of 3 mm glass beads. Diluted samples were allowed to settle for 5 min to avoid carryover of soil particles that could affect OD measurements. The supernatant of the settled soil samples was further diluted to obtain a range of working dilutions (from 4 × to 80,000 × ; with sterile 0.1% Na4P2O7). These working dilutions were then used to test the dyes.
For water samples (SW, STW), 5 mL of each sample was vortexed at maximum speed for 2 min with 2.5 g of 3 mm glass beads. The water samples were allowed to settle for 5 min. The supernatant of the settled water samples was further diluted to obtain a range of working dilutions (from 1 × to 1600 × ; with autoclaved sample water). These working dilutions were then used to test the dyes. One redox dye was added to each sample: 10% AlamarBlue to form the aB-IF0a combination or 1% Biolog Dye Mix G (R#74227; Biolog) to form the IF-C combination. Well color change was analyzed, as described in Section 2.2.
2.4. Characterization of microbial communities
Microbial functional and metabolic diversity of the Cornwallis Island samples (2018) was assessed by using EcoPlates (Biolog R#1506) that consisted of 31 different carbon substrates, which were analyzed in triplicate, and carbon-free controls. Samples were processed as indicated in the earlier section, and 100 μL of each processed sample was added to each well of the EcoPlates.
For each of the four samples, one EcoPlate was incubated at 15°C in our laboratory, whereas another EcoPlate was incubated at 23°C at the field facility. The color change for the 15°C plates was monitored by measuring OD590 on a SpectraMax M2e microplate reader (Molecular Devices). The measurements were normalized by the subtraction of both the time-zero and negative-control values. Absorbance values ≥0.2 were considered to be positive (Rico and Preston, 2008). Calculations of the average well-color development (AWCD), substrate richness (R), and Shannon-Weaver diversity index (H) based on substrate utilization were performed (Iţcuş et al., 2016; O'Connor et al., 2021). The R and H parameters were calculated once the AWCD reached a plateau phase (Pessi et al., 2012), after 22 days of incubation.
Color change for the 23°C plates was monitored after a 4-day incubation by taking serialized photographs of the plates with a Canon EOS 6D camera with the same settings and in identical lighting conditions, due to the lack of a field spectrophotometer. The plates images were analyzed with the ImageJ 1.52 program (Schneider et al., 2012), by which a numeric value of the color intensity (histogram) of each well was determined. We normalized the values by using 1/(mean value of the histogram) to measure the color development in the plates. In addition, R and H indexes were calculated as described earlier, with threshold values of ≥0.002 considered to be true positive activity.
To determine the relative numbers of microbial biomass in GS, LS, STW, and SW samples, viable microorganism counts were determined with an aerobic heterotrophic plate count method (Chan-Yam et al., 2019) on R2A agar. Soil samples (LS, GS) were processed as follows: 5 g of soil was diluted with 15 mL of 0.1% Na4P2O7 (1:4 dilution), vortexed for 2 min with 2.5 g of 3 mm glass beads, diluted 10-fold, and plated on R2A agar. Water (5 mL) samples (SW, STW) were vortexed for 2 min with 2.5 g of 3 mm glass beads and plated as the soil samples. For each sample, a set of triplicate plates was incubated at 23°C for 2 weeks, and another set was incubated at 4°C for 4 weeks, before counting CFUs.
2.5. Technical design of prototype μMAMA cards
The prototype μMAMA cards designed in our laboratory and presented here (Fig. 2 and Supplementary Video S1) aim at combining the ease of use, simple design, affordability, and sensitivity of Biolog plates, while incorporating this concept into a more robust and automated system that could have applications for robotic planetary exploration and biosignature detection. We designed the μMAMA cards to be compatible with the architecture of the flight-ready National Aeronautics and Space Administration (NASA) BioSentinel payload (Ricco et al., 2020; Santa Maria et al., 2020; Padgen et al., 2021). The μMAMA well plates and lids were created with low-resource overhead by using precision-milled polycarbonate (R#1749K529; McMaster-Carr, Elmhurst, IL). The technical details and dimensions of the μMAMA card are given in Fig. 2.
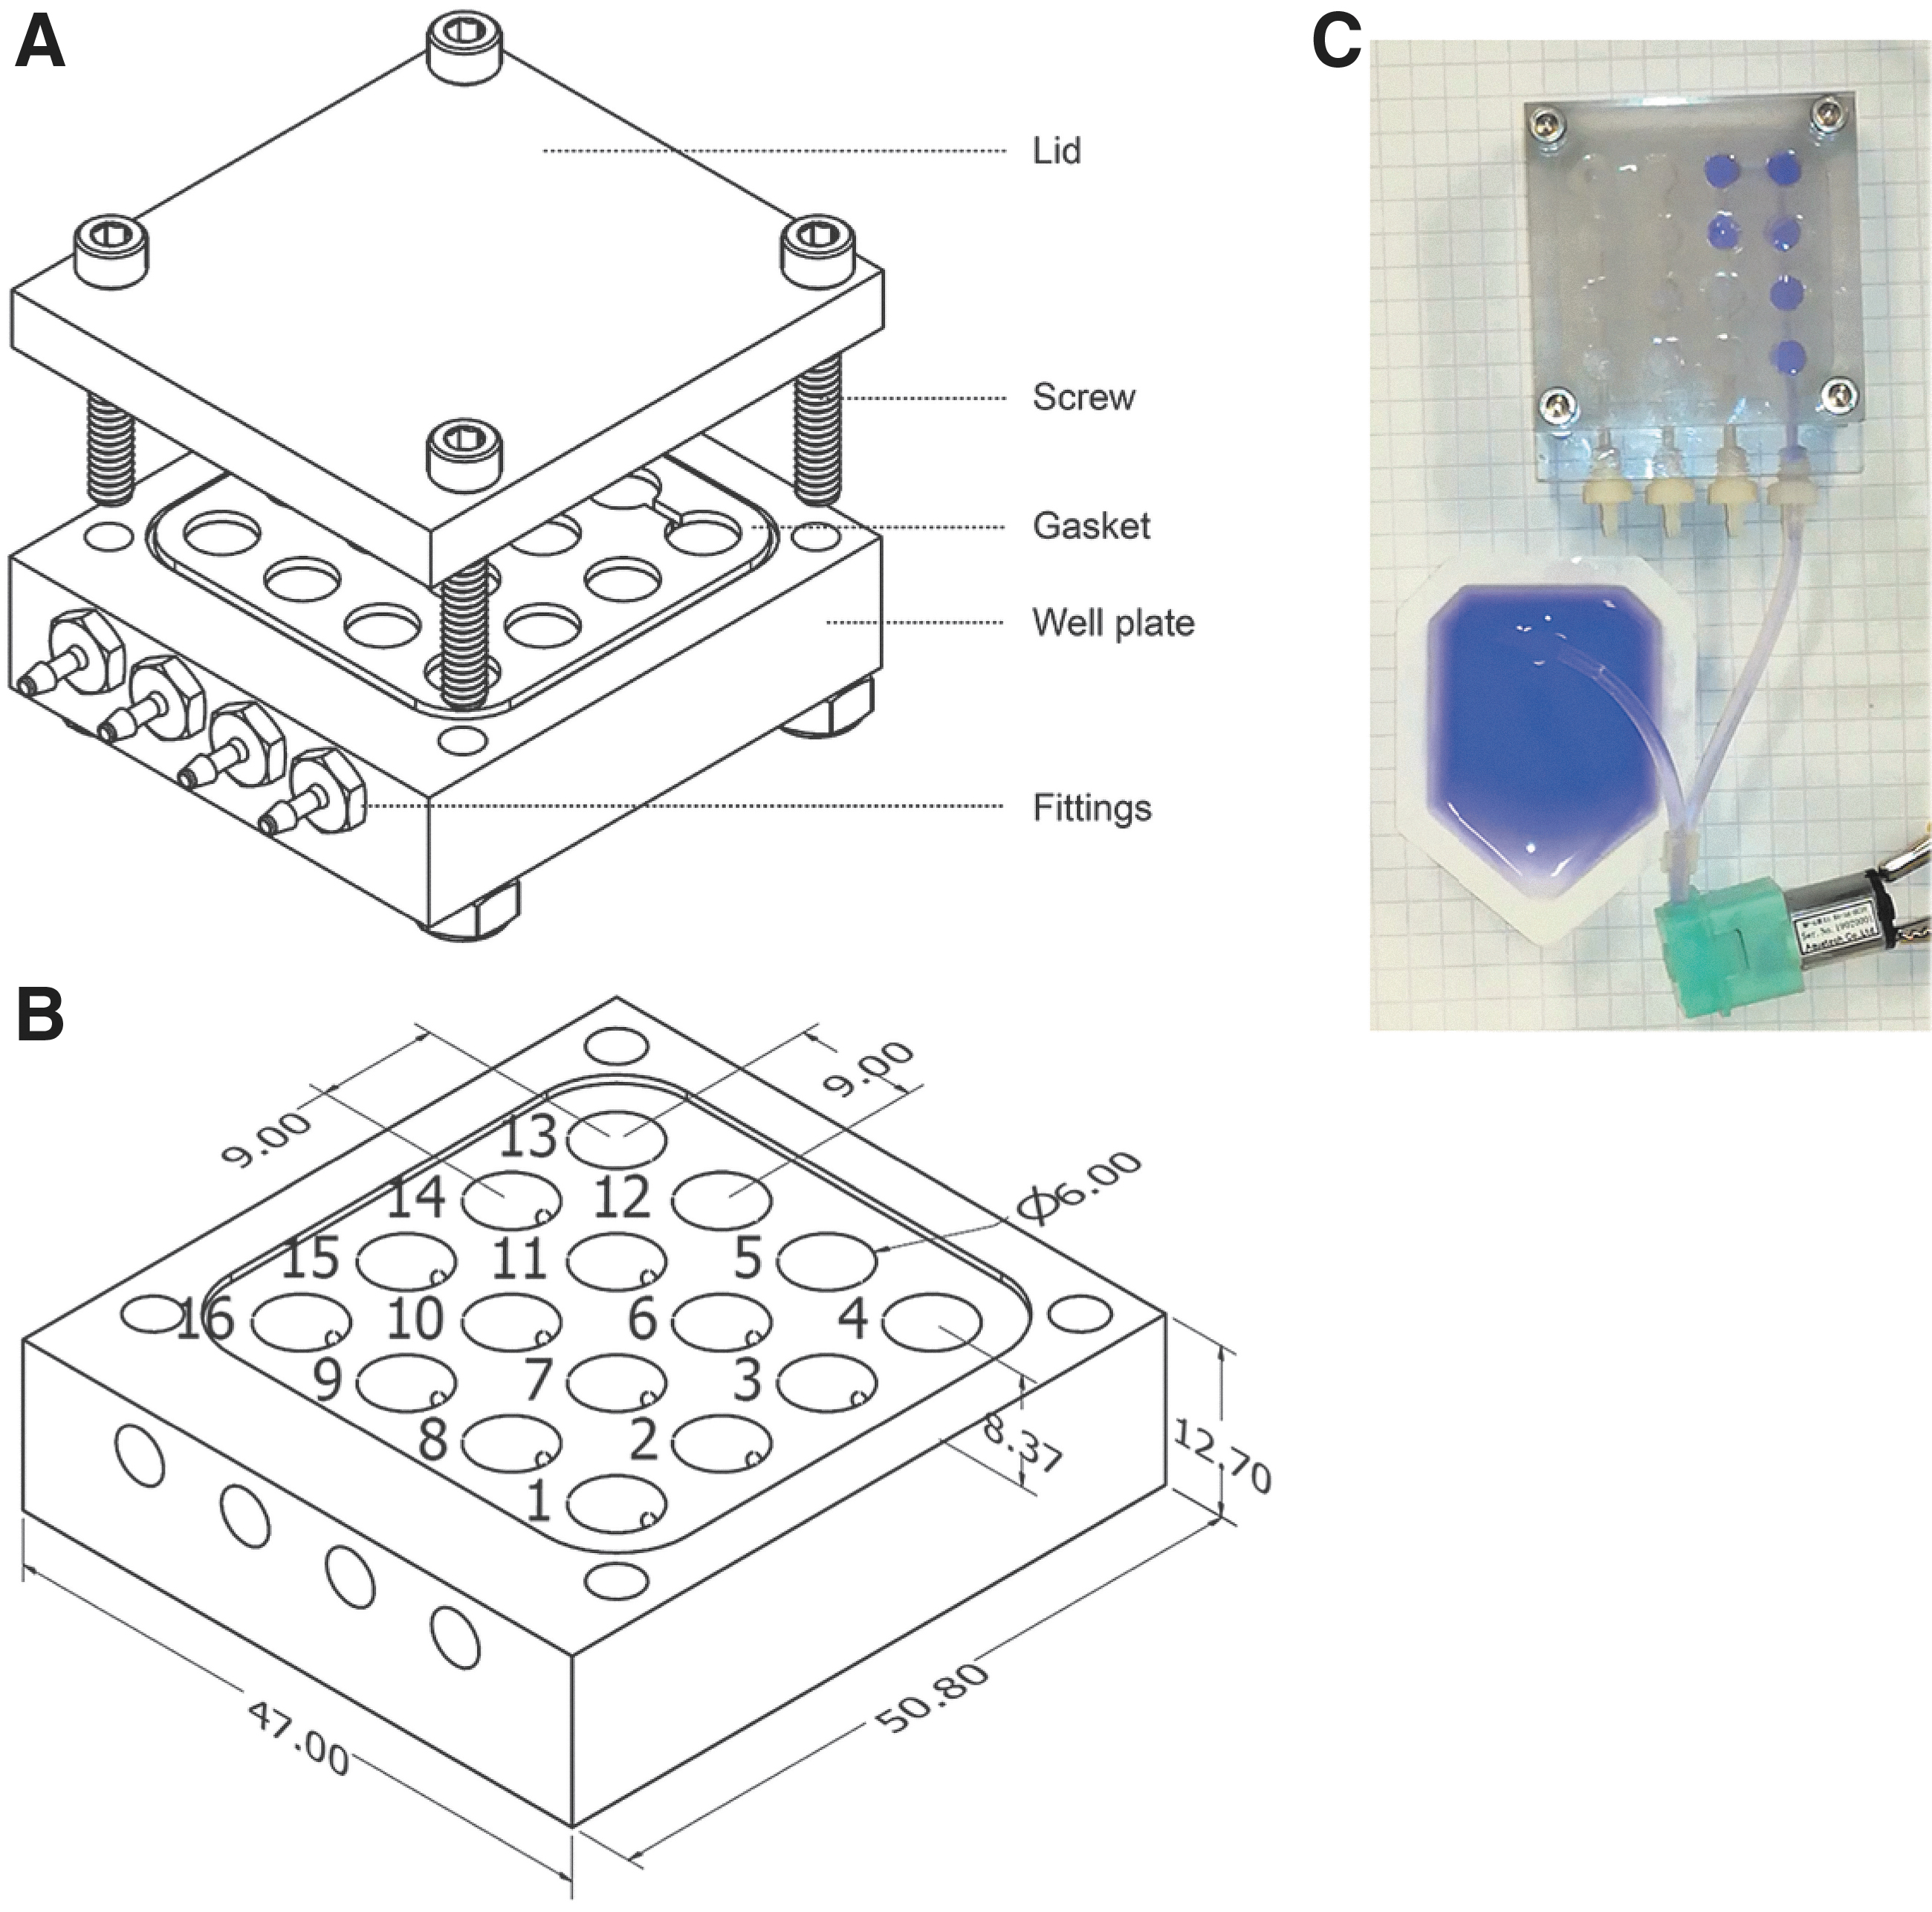
Technical design of the μMAMA cards.
Machining the shape of the card and its wells results in more accurate measurements for the wells and smoother surfaces to ensure that the final volume of the wells is precise. Polycarbonate is also resistant to shattering and warping damage, has low water permeability, and is autoclavable. The smooth finish allows sealing of the wells by a silicone gasket that is fabricated by molding a liquid silicone (Smooth-On Dragon Skin™ 30) compound into a shape adapted to the well plate. This gasket seals each individual well, stopping any exchange of fluid with the environment (Fig. 1). Each set of eight wells is connected internally to allow for automated filling of the wells. Finally, the μMAMA was designed with automation in mind, and it features threaded ports for easy interfacing with tubing.
Miniature barbed fittings (R#5463K2; McMaster-Carr) and 0.125″ OD transparent polyvinyl chloride plastic tubing (R#5155T12; McMaster-Carr) were used in this study and were connected to a miniature peristaltic pump (RP-QIIIX1.5S-2P2Z-DC3V; Takasago Electric, Nagoya, Japan). Peristaltic pumps can prevent backflow and distribute precise amounts of fluid, two characteristics that were required in this application. The peristaltic pump that distributes liquid into the wells is low in mass (13 g) and has low energy requirements (<0.36 W), and thus it can be powered by a small and common source such as standard AA or 9 volt batteries. Even with such low energy requirements, the 16 wells (∼200 μL) were filled in less than a minute (2.2 mL/min flowrate).
2.6. μMAMA testing with environmental samples
To assess the metabolic activity detection capabilities of the prototype μMAMA, we prepared the μMAMA cards and incubated them with the same environmental samples as described earlier. The μMAMA cards were sterilized by incubating 70% ethanol for 20 min, then autoclaving. Next, 200 μL of IF-0a was dehydrated in each well in a sterile environment. Since microorganisms that inhabit analog extreme environments are likely to be adapted to oligotrophic growth conditions (Vartoukian et al., 2010; Song et al., 2016), we included a range of substrate amendments targeting a variety of heterotrophic microorganisms, ranging from poor-in-nutrients (no amendment, M9 minimal media [ATCC Medium 2511], 1/10 R2A, 1/3 R2A) to rich-in-nutrients (PDB, TSB) conditions.
Since chemolithoautotrophic life may be the most likely candidate for microbial life-forms in Mars' subsurface environments (Michalski et al., 2018), we also included a thiosulfate-based medium targeting sulfur-oxidizing bacteria, described in Taylor and Hoare (1971), and an iron-based medium targeting Fe(II)-oxidizing bacteria, described in (Hohmann et al., 2009), as sulfur and iron-based metabolisms may be important for potential microbes inhabiting Mars' subsurface given the presence of sulfur and iron-rich basalt mineral (McCollom, 2006; McSween et al., 2009).
Considering the reduction potential of the dyes (tetrazolium salt = −110 mV; aB = +380 mV; Bio-Rad supplier info.) and substrates (thiosulfate = −390 mV; Fe2+ = −200 mV) at normal lab conditions (25°C, pH = 7.0, vs. Normal Hydrogen Electrode), both Fe(II) and sulfur-oxidizing bacteria would be able to reduce both the dyes. The 16 uMAMA wells were inoculated as follows: Well numbers 2 and 15 were inoculated with M9, wells 3 and 14 with 1/10 R2A, wells 4 and 13 with 1/3 R2A, wells 5 and 12 with PDB, wells 6 and 11 with TSB, wells 7 and 10 with thiosulfate-based medium, and wells 8 and 9 with iron-based medium. No substrate amendments were added to wells 1 and 16, which served as negative controls.
The Cornwallis Island LS, GS, SW, and STW samples, and a sterile 0.1% Na4P2O7 saline solution (negative control), were inoculated in the μMAMA cards with the Takasago RP-QIIIX1.5S-2P2Z-DC3V peristaltic pump, and in the control 96-well plates set up to check for any unexpected effects due to the fluidic card and system (none were found). After filling of the wells, the μMAMA miniature barbed fittings were sealed with tubing and incubated at 23°C for 14 days. For this, LS, GS, SW, and STW samples were processed as previously described (1:4 dilution for soil samples and undiluted water samples), with either 10% AlamarBlue or 1% Biolog Dye Mix G.
This incubation setup (all combinations of samples/dyes/buffers/amendments) was replicated in a standard 96-well plate as a control to validate the μMAMA results. The next year, the Axel Heiberg Island GHM and LHW samples were also inoculated into two μMAMA cards and incubated at 15°C for 7 days.
3. Results
3.1. Signal robustness and sensitivity of dye/buffer combinations
We tested a set of metabolic redox dyes and buffer combinations to determine their robustness and sensitivity in detecting microbial activity. Robustness is defined as the range of abiotic physiochemical parameters at which the dye could detect activity without yielding a false positive signal due to abiotic reactions between the dye and the environment. Sensitivity, or LOD, is defined as the lowest number of cells present for positive activity detection (i.e., false negative threshold). The robustness (i.e., absence of false positive reactions) of each dye/buffer combination to abiotic physiochemical parameters is summarized in Table 1.
Summary of the Physiochemical Conditions That Did Not Induce Abiotic Reduction (i.e., Dye Robustness) and Lowest Inoculation (Cells/mL) Required for Dye Reduction (i.e., Sensitivity) of Each Dye/Buffer Combination
Summary of the maximum environmental sample dilution that was still able to detect metabolic activity with the selected (AlamarBlue-IF0a; Biolog IF-C) dye/buffer combinations.
The IF-A dye reduction for each cell concentration of R. frigidialcoholis was based on visual verification only.
GS = gravel soil; IF = inoculating fluid; LS = lake sediment; STW = stream water; SW = seawater.
Overall, the different dye/buffer combinations varied in their robustness to different pH conditions (Table 1). The aB-H2O and aB-IF0a did not produce a false positive signal across a pH range of pH 4–13, whereas the aB-Na4P2O7 did not produce a false positive signal across a pH range of pH 3–13 (Supplementary Fig. S3). The Biolog IF-B and IF-C only produced false positive signals when incubated in pH 14 solution (Supplementary Fig. S4). The IF-A combination was very robust in terms of pH, as no false positive signals were detected across the pH range of 0–14 (Supplementary Fig. S4); however, the reduction value was close to the positive threshold at pH 13–14.
When incubated at different temperatures (−10°C, 5°C, 23°C, and 37°C), most dye/buffer combinations did not show false positive signals, with the exception of aB-H2O, which showed a significant false positive abiotic color change when incubated at 37°C (Table 1). At −10°C, ice formation was only observed in dye/buffer combinations without NaCl and NaClO4 amendment. All six dye/buffer combinations were robust and did not show a false positive signal after a 14-day incubation with the ranges of NaCl and NaClO4 - concentrations (0%, 10%, 20%, 30% [w/v]), and the Mars analog soil MMS-2 (Table 1).
The LOD (sensitivity) for the six redox dye/buffer combinations is summarized in Table 1. The aB-H2O dye/buffer combination detected as few as 100 cells/mL of R. frigidialcoholis but was not reduced by any concentration of P. halocryophilus tested, and thus it was the least sensitive to those bacteria. The AlamarBlue dye/buffer combinations detected as few as 100 (aB-IF0a dye) and 199 (aB-Na4P2O7) cells/mL of R. frigidialcoholis, and 252 (aB-IF0a) and 2.52 × 10⁷ (aB-Na4P2O7) cells/mL of P. halocryophilus, respectively. The Biolog redox dye/buffer combinations detected as few as 100 (IF-B dye), 199 (IF-C), and 9.95 × 10⁷ (IF-A) cells/mL of R. frigidialcoholis, and 252 (IF-A), 504 (IF-C), and 2.52 × 10³ (IF-B) cells/mL of P. halocryophilus.
3.2. Testing aB-IF0a and IF-C metabolic redox dyes with environmental analog samples
The aB-IF0a and IF-C dye/buffer combinations, determined to be the most robust and sensitive (Sections 3.1 and 4.1), were further tested for their ability to detect activity in low-biomass environmental samples. The aB-IF0a and IF-C dye/buffer combinations detected metabolic activity in all environmental samples with a range of dilutions (Table 1).
The aB-IF0a dye/buffer combination was reduced with the four environmental samples that were diluted up to 100 × (LS), 400 × (SW), 1000 × (GS), and 1600 × (STW) with either sterile Na4P2O7 for GS and LS soil samples or with the autoclaved water for STW and SW water samples (Table 1). The IF-C dye/buffer combination was reduced with environmental samples that were diluted up to 100 × (LS), 800 × (SW), 1000 × (GS), and 1600 × (STW) as described earlier (Table 1). The relative metabolic diversity of these environmental samples, assessed via Biolog EcoPlates, is summarized in Fig. 3.
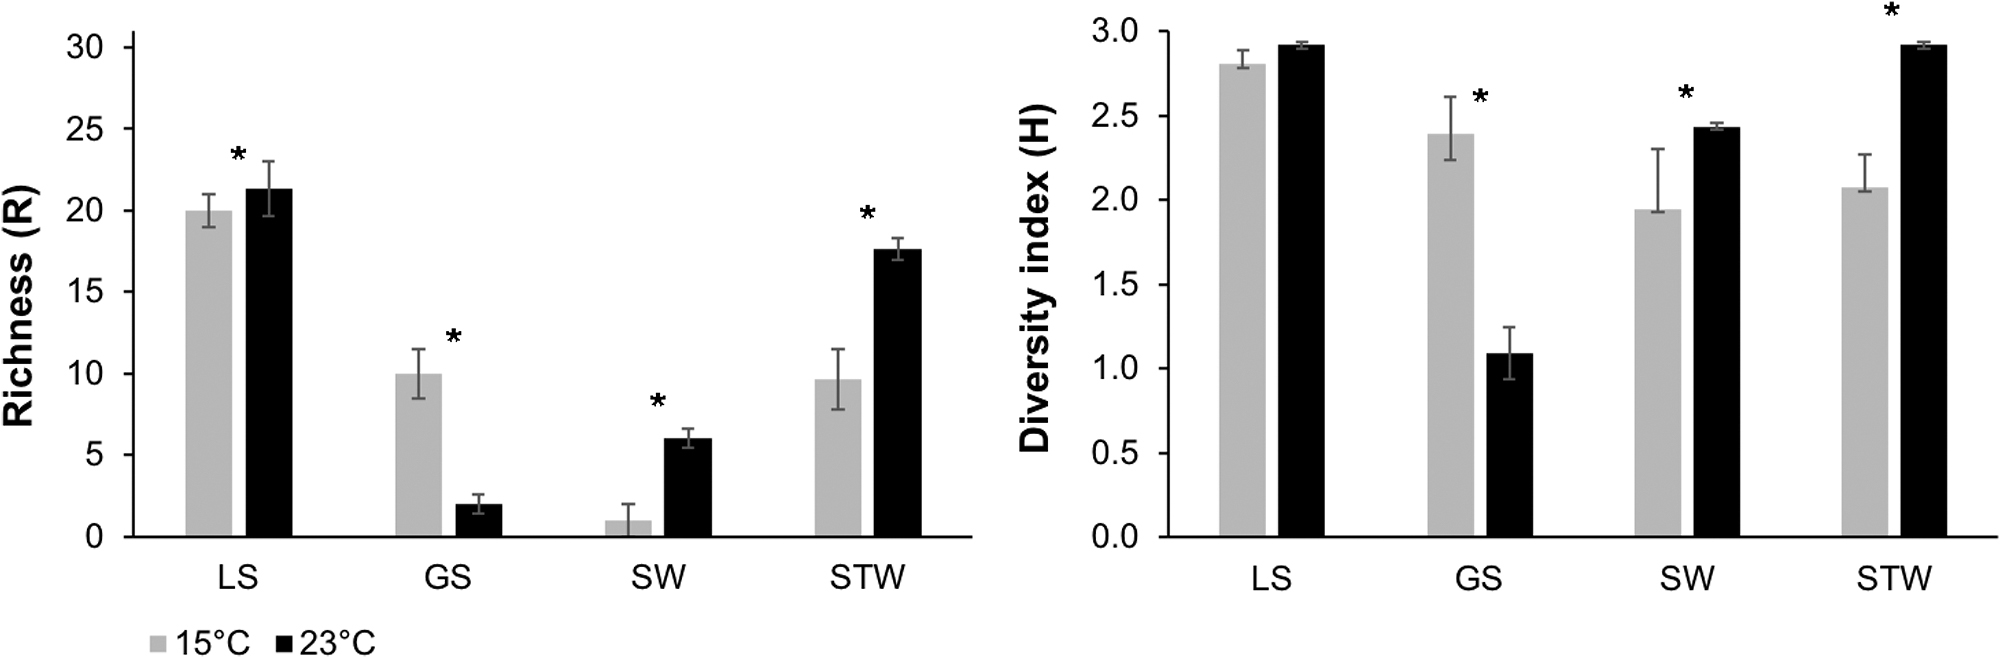
Microbial functional diversity of high-Arctic analog samples assessed with the Biolog EcoPlates. Biolog EcoPlates were incubated with LS, GS, Sea, and STW samples at 15°C (light gray) and 23°C (black). Substrate richness (R) and the Shannon-Weaver diversity index (H) were calculated as described in Section 2. Significant difference (p ≤ 0.05) between the temperatures of each sample is denoted with a star. Error bars are based on SEM. SEM, standard error of the mean.
An overall increase in microbial functional diversity (R and H indices) was noted for SW, LS, and STW as a result of increased temperature (23°C vs. 15°C) (Fig. 3). Contrarily, we observed a significant decrease in R and H indices with an increase in temperature in the GS sample (Fig. 3). Soil samples (LS, GS) had higher number CFU counts than the water samples (SW and STW) (Table 2). In addition, the GS samples had a higher CFU count at 5°C than 23°C. The opposite phenomenon was observed with all the other samples (LS, SW, STW), where the detected biomass was lower at 5°C compared with 23°C (Table 2).
Environmental Characteristics of Analog Environmental Samples
CFU = colony-forming unit.
3.3. Testing μMAMA cards with environmental samples
We analyzed the ability of the μMAMA to detect metabolic activity in environmental samples using the aB-IF0a and IF-C dye/buffer combinations. After a 14-day incubation at 23°C of the environmental samples in the prepared μMAMA cards, μMAMA's wells demonstrated positive signals of dye reduction with a variety of substrates, whereas the μMAMA negative control wells (inoculated with sterile 0.1% Na4P2O7) remained unreduced (Table 3).
Microfluidics Microbial Activity MicroAssay Cards Tested with Environmental Analog Samples and Different Substrates
Results are organised based on the substrate amendment of the μMAMA card. Positive signs (+) indicate a metabolic activity detection, blank spaces indicate that no activity was detected.
μMAMA = microfluidics Microbial Activity MicroAssay; GH = Gypsum Hill; Iron: iron based medium; LH = Lost Hammer; M9 = M9 minimal medium; No amend. = no substrate amended; 1/3 R2A = 33.3% strength of regular R2A medium; 1/10 R2A = 10% strength of regular R2A medium; Thio = thiosulfate based medium.
For the aB-IF0a dye/buffer combination, we detected significant reduction in all wells for the GS sample; for LS and STW, we detected reduction in all wells except the ones amended with thiosulfate and iron media. The SW only showed reduction in wells with 100% TSB and 100% PDB with the aB-IF0a dye/buffer combination. For the IF-C dye/buffer combination, we detected significant reduction of the dye in wells with 100% TSB, 100% PDB, 1/3 R2A, and M9 for the GS, LS, and SW samples; however, the STW sample showed dye reduction in all wells, except the ones amended with thiosulfate, iron substrates and unamended ones.
These results were corroborated with a control 96-well plate in a lab setting to obtain OD600 values and validate the μMAMA environmental sample results. The Gypsum Hill microbial mat sample showed reduction of the indicator dyes under all incubation conditions after only 48 h of incubation. However, no reduction occurred with any substrate conditions while using the Lost Hammer water samples.
4. Discussion
4.1. aB-IF0a and IF-C dye/buffer combinations are the best candidates for use with μMAMA and in analog sites
To select the best dye/buffer combinations for life detection in an astrobiological context, we evaluated six different combinations of redox dyes and buffers for their robustness and sensitivity/LOD. Robustness is the ability to detect activity over the greatest range of environmental physiochemical parameters without providing a false positive dye reduction. The LOD is the lowest number of initial cells required to cause a true positive signal of metabolic activity.
The aB-H2O was the only dye/buffer combination that produced an abiotic false positive dye reduction at 37°C. In addition, the aB-H2O combination required a high number of bacterial cells, whereas the IF-A required a high number of yeast cells to produce measurable signals (Table 1), thus disqualifying these three dye/buffer combinations for astrobiological applications and for further tests with the μMAMA. Though the more extreme pH values resulted in false positive AlamarBlue dye reduction, it could still be reliably used down to pH 3 with the Na4P2O7 buffer (Table 1 and Supplementary Fig. S3).
Contrastingly, the Biolog dyes (IF-ABC) worked across a much broader pH range, especially in acidic conditions below pH 3 (Table 1 and Supplementary Fig. S4). The ability to utilize redox dyes at low pH is relevant for metabolic activity detection on Mars due to the potential presence of sulfate- and iron-enriched acidic environments (Fairén et al., 2004), as well as analog sites on Earth, such as the Río Tinto River (pH 2.3) (Gómez et al., 2011; Sánchez-García et al., 2020). Thus, the Biolog dyes are the most versatile candidates for the detection of metabolic activity in acidic environments, as they could be used with low-pH samples, but at a cost of having a slightly decreased sensitivity compared with AlamarBlue (Table 1).
None of the NaCl or NaClO4 concentrations tested, nor the martian analog soil, gave a false positive chemical reduction of the six dye-buffer combinations. This is promising, as perchlorate (ClO4) is abundant in Mars surface regolith (Catling et al., 2010), and multiple astrobiologically relevant extraterrestrial sites are characterized by high salinity (Garcia-Lopez and Cid, 2017). The salinity in the environmental samples needs to also be considered when deciding the incubation temperature to avoid freezing, as our 0% NaCl and 0% NaClO4 wells did freeze at −10°C, though none of the other tested concentrations did. Based on our results, freezing of the dye does not induce abiotic reduction of the dye, though it could hinder microbial metabolism and therefore should be taken into consideration in future experiments.
The aB-IF0a and the IF-C dye/buffer were selected as the best candidates to be included in μMAMA tests of high-Arctic analog sites due to their optimal robustness and sensitivity, both with pure cultures and environmental samples. Overall, the aB-IF0a was slightly more sensitive than IF-C, but it had a narrower usable pH range, suggesting that the IF-C dye/buffer combination is more ideal for acidic analog environments; however, the aB-IF0a dye/buffer combination is more ideal for low biomass analog environments with less acidic conditions, such as Antarctic permafrost (Gilichinsky et al., 2007).
However, both combinations detected metabolic activity with fewer than 1000 cells/mL (Table 1), which is representative of the most extreme low-biomass analog sites, including Antarctic RSL-like water tracks and permafrost, and deep subsurface ground water (Hazen et al., 1991; Goordial et al., 2016; Chan-Yam et al., 2019). Therefore, IF-C and aB-IF0a metabolism-indicator redox dyes can be used for unambiguous microbial activity detection in low-biomass analog sites.
Our results demonstrate that redox dyes can be used in a wider range of physiochemical parameters than previously shown, and that they do detect metabolic activity in analog environmental samples even when highly diluted (Table 1). AlamarBlue is commonly used to assess cell viability, is able to accurately enumerate the cell concentration down to 102 cells/mL, and is more sensitive than tetrazolium dye (i.e., Biolog dyes) (Shiloh et al., 1997; Hamid et al., 2004; Rampersad, 2012). However, auto-reduction of AlamarBlue can occur when buffered with non-optimal solutions (Munshi et al., 2014), highlighting the importance of the controls for background measurements.
Previous studies determined a limited optimal range of 7.0–7.4 pH, at 37°C with a 4-h incubation for AlamarBlue (Rampersad, 2012); however, we have demonstrated its validity with a wider physiochemical range, including high NaCl and NaClO4 concentrations, low temperatures with longer incubation times, and 4.0–13.0 pH when buffered with IF-0a.
Although previous studies identified a minimum of 104 cells/mL to reduce Biolog dyes (Insam et al., 1996; Van Heerden et al., 2002), we have determined that as few as 100 cells/mL can measurably reduce the IF-C Biolog dye (Table 1). Though the Biolog dyes are designed for environmental samples, they are reported to potentiality be abiotically reduced by substrate amendments, whereas high pH/temperature may change the dye's stability (manufacturer). However, we have demonstrated that the IF-C combination of this dye is stable in pH up to 13 (Supplementary Fig. S4), in a temperature range of −10°C to 37°C, in the presence of MMS-2 simulant regolith, and in 30% of NaCl and NaClO4 (Table 1).
4.2. Application of aB-IF0a and IF-C metabolic redox dyes with environmental analog samples
Both aB-IF0a and IF-C dye/buffer combinations indicated metabolic activity in all tested samples across a high range of dilutions (Table 1), thus highlighting their suitability to be used in the μMAMA platform in low-biomass environments.
The samples tested with the aB-IF0a and IF-C have overall low functional diversity R values (21.33–1.00) and H values (2.92–1.08), similar to other cryoenvironments, such as ice caves (Iţcuş et al., 2016), glacier ice/cryoconites (Grzesiak et al., 2015a), Alaskan and high-Arctic permafrost soils (Ernakovich and Wallenstein, 2015; Goordial et al., 2017), cold freshwater lakes (Mackenzie et al., 2011), and the Antarctic glacier ablation zone (Grzesiak et al., 2015b). The CFU counts of the tested samples were similar to other permafrost-associated active layer samples (Zhang et al., 2013; Altshuler et al., 2017) and to Arctic SW samples (Junge et al., 2002; Gilichinsky et al., 2008). The decrease in viable counts in GS when incubated at 23°C indicates that cold-adapted psychrophilic microorganisms in this specific site may be sensitive to higher temperatures (Table 2), as the optimum temperature of psychrophile is usually below 20°C (Cavicchioli et al., 2002).
In contrast, we detected a slight increase in cultured microorganisms at 23°C for the other samples (LS, SW, STW) (Table 2), which suggests that these sites may harbor more psychrotolerant microorganisms with an optimum temperature above 15°C (Cavicchioli et al., 2002). Nonetheless, all samples (GS, LS, SW, STW) had higher functional diversity (R and H) at 23°C compared with 15°C (Fig. 3). Given that we observed a temperature-dependent difference in functional diversity and viability in our cryoenvironment samples, we believe that future incubations when using astrobiological target samples should include a range of temperatures to capture the greatest metabolic diversity of these potential habitats.
4.3. Metabolic detection using the μMAMA
The μMAMA platform detected metabolic activity from extant microbial life in all the analog environments tested when using the two most promising dye/buffer combinations (aB-IF0a and IF-C), except with Lost Hammer spring water (LHW). This is possibly due to the μMAMA cards being incubated in unfavorable aerobic conditions to microbial activity in this environment, since the Lost Hammer spring is more suitable for anaerobic metabolisms due to very low dissolved oxygen concentration in the LH water and sediment (Perreault et al., 2007; Niederberger et al., 2010; Lamarche-Gagnon et al., 2015). This is supported by Biolog dye reduction in an EcoPlate incubated with LHW in an anaerobic chamber, whereas such reduction did not occur in aerobic conditions (data not shown).
This observation demonstrates a future avenue of testing of the μMAMA platform in anaerobic conditions, as both tetrazolium (Bhupathiraju et al., 1999; Christian and Lind, 2006) and resazurin (Karakashev et al., 2003; Chen et al., 2015) dyes are compatible with anaerobic conditions. In the absence of deliberate addition of dissolved oxygen, anaerobic environmental conditions would be preserved in the BioSentinel fluidic card, which has very low gas and vapor permeability.
Overall, aB-IF0a dye/buffer combination detected metabolic activity across a more diverse range of conditions compared with the IF-C dye/buffer combination (Table 3); thus, it may be more suitable in more diverse environments. The detection of microbial activity in μMAMA wells containing thiosulfate media and the iron media (Table 3) suggests that chemolithoautotrophs, in particular sulfur-oxidizing bacteria and Fe(II)-oxidizing bacteria, were present in these analog environments. However, further molecular studies, including several suitable positive and negative controls, are needed to identify which sulfur and iron species' oxidations can be truly detected by these dyes, and which environmental microbial communities could carry them out. This is an important consideration for future astrobiology life detection missions, since chemolithoautotrophy is a likely candidate on Mars' subsurface environment (Michalski et al., 2018).
Compared with the Viking Labeled Release experiment, which was designed to detect heterotrophic metabolism via production of 14CO2 (Levin and Straat, 1976), metabolic redox dyes are not dependent on any specific type of metabolism, since they are reduced by components of the cellular electron-transport chain (Maldonado et al., 2012). This supports the utilization of metabolic redox dyes to detect activity from an array of metabolisms, especially the aB-IF0a, as it demonstrated a broader range of activity detection.
The Viking Labeled Release experiment was tested with a lower limit of 50 CFU/mL when using an Antarctic permafrost sample (Levin and Straat, 1976); however, our experimental design with highly diluted environmental samples (SW, 800 × ; Table 1) allowed the detection in concentrations that correspond to 3 CFU/mL. Further, AlamarBlue was used to assess the survival of microorganisms in the cubesat-format payload SESLO on the O/OREOS satellite (Nicholson et al., 2011; Nicholson and Ricco, 2020) and it will be employed in the BioSentinel payload (Ricco et al., 2020; Santa Maria et al., 2020), which is expected to launch in 2022.
These advances and the results of our study further support the use of metabolic redox dyes in a space-exploration context and the potential of the μMAMA platform as an unambiguous microbial activity detection system. In comparison to other platforms already in development that focus on biosignature detection, such as the SOLID instrument (Parro et al., 2011), the μMAMA approach may provide more reliable evidence of extant life on other planetary bodies. Once the stability of this system's chemistry is ensured for space travel and martian conditions, the use of dyes coupled to a straightforward, easy to use design results in a simple system that may easily be integrated in future space missions.
4.4. μMAMA caveats and future directions
The μMAMA metabolic activity detection platform has been used in this work to detect the reduction of redox dyes by metabolically active microorganisms. Nevertheless, the AlamarBlue dye has been shown, both in the laboratory and in outer space, to detect 24-h-nutrient-starved, stationary-phase Escherichia coli in microfluidic cards (Padgen et al., 2020a, 2020b). The detection of dormant microbes is feasible, because even dormant cells contain stores of electron-donating molecules that are accessible to the redox indicators. Unlike actively replicating cells, dormant cells may replenish such molecular stores at a limited rate, impacting the rate and/or extent of the color change, particularly for lower cell densities (Padgen et al., 2020a). This could have a potential adverse impact on LODs (Padgen et al., 2020a).
The viability of spores has been assessed by others who have used both tetrazolium (Welersbye-Witkowski and Straker, 1997; Gupta et al., 2013) and resazurin (Barua et al., 2017) dyes; consequently, the μMAMA should be able to detect activity from spores, potentially even before germination (depending on spore coat permeability to the dyes and the extent of internal stores of electron-donor molecules). The detection of (dormant) spores is an important area of future study with the μMAMA system, due to its potential relevance to the detection of dormant extraterrestrial microbial life.
The μMAMA platform can be further optimized in several ways. The μMAMA prototype presented here is a great tool to quickly identify microbial metabolic capabilities of analog environments and could easily be incorporated in the BioSentinel payload. However, it could be modified to provide more complete metabolic detection and characterization by increasing the number of wells to allow for a greater number of substrate amendments. To this effect, we acknowledge the need for further testing of the metabolism-indicator redox dyes' sensitivity and LODs with regard to chemolithoautotrophic and anaerobic microorganisms, to confirm the redox dyes' suitability for astrobiological applications (Westall et al., 2015; Michalski et al., 2018), while noting that the design and materials of construction of the fluidic card will support anaerobic experiments (i.e., gas exchange is very slow).
Metabolism-indicator redox dyes have previously been used to assess metabolic activity in anaerobic conditions, including tetrazolium salts (Biolog) (Bhupathiraju et al., 1999; Christian and Lind, 2006), and resazurin (AlamarBlue) (Karakashev et al., 2003; Chen et al., 2015). The colorless form of AlamarBlue (dihydroresorufin) is converted to a fluorescent pink resorufin in the presence of oxygen and is, therefore, often used as an indicator of oxygen contamination in anaerobic conditions (Braissant et al., 2020). However, the AlamarBlue assay can still be used if it is operated in the “disappearance-of-blue” absorbance-based mode (as opposed to appearance of pink in fluorescence-based mode) in anaerobic environments to detect microbial metabolism (Laverty et al., 2015), since resazurin would turn almost directly from blue to colorless if there is high metabolic activity but no oxygen present (with a little or transient fluorescent pink resorufin stage).
The tetrazolium salts have no such complication and can be assayed normally for the detection of anaerobic metabolic activity (Braissant et al., 2020). These considerations may be important on Mars due to its anoxic atmosphere.
Second, fully drying the redox dye in the wells should be tested, as it would considerably decrease the labor related to sample preparation and will improve the μMAMA platform by bringing it closer to full automation.
Finally, due to the inherent limitations of the μMAMA design, we observed minimal movement of fluid across some wells in the μMAMA cards. BioSentinel's fluidic cards address this issue to some extent using a filter membrane on the tops and bottoms of all wells, limiting though not eliminating liquid movement in the absence of deliberate pumping. Despite this potential well-to-well cross-contamination within the same μMAMA card, the observed positive reduction in the μMAMA cards was validated with the control 96-well plates with no fluid movement, making us confident about the observed results of the μMAMA. Nevertheless, this demonstrates an opportunity for further improvement in the next generation of the μMAMA design with independent well inoculation or with a decreased inoculation flow rate.
5. Conclusion
The semi-automated μMAMA platform detects the metabolic activity of as few as 100 cells/mL, and it metabolically characterizes diverse astrobiological analog sites. The metabolism-indicator redox dyes, aB-IF0a and the Biolog IF-C, were found to be the most sensitive and robust of the six tested combinations. Since the Biolog IF-C can be used in the broadest range of environmental conditions, we recommend usage of this metabolic dye, as well as incubation under a range of temperatures, to obtain a more accurate detection and characterization of the microbial life in analog samples, and to avoid false positives; aB-IF0a is more suitable for use in low-biomass environments, with less acidic conditions. Redox dye incorporation into the μMAMA platform resulted in a small, portable, and low-energy-demand system that is capable of rapid and unambiguous extant microbial life detection.
Given its small size, simple design, and low energy requirements, we believe that the μMAMA should be considered a strong candidate for further automation, optimization, and incorporation into larger platforms for life detection missions.
Footnotes
Acknowledgments
The authors thank Dr. Jacqueline Goordial for valuable input and critical feedback. They also thank Dr. Barry R. Bochner from Biolog, Inc., for advice with the Biolog Dye Mix selection. They are also grateful to Dr. Michael Padgen and the NASA Ames BioSentinel engineering team for their collaboration and help with design development.
Author Disclosure Statement
No competing financial interests exist.
Funding Information
This work was funded by the Canadian Space Agency Flights and Fieldwork for the Advancement of Science and Technology (FAST) and Mars Sample Return (MSR) grants, by the McGill Space Institute, NSERC and FRQNT graduate student scholarships, and by the McGill International Mobility Award.
Supplementary Material
Supplementary Figure S1
Supplementary Figure S2
Supplementary Figure S3
Supplementary Figure S4
Supplementary Video S1
Abbreviations Used
References
Supplementary Material
Please find the following supplemental material available below.
For Open Access articles published under a Creative Commons License, all supplemental material carries the same license as the article it is associated with.
For non-Open Access articles published, all supplemental material carries a non-exclusive license, and permission requests for re-use of supplemental material or any part of supplemental material shall be sent directly to the copyright owner as specified in the copyright notice associated with the article.