
Abstract
The reliable identification of biosignatures is key to the search for life elsewhere. On ocean worlds like Enceladus or Europa, this can be achieved by impact ionization mass spectrometers, such as the SUrface Dust Analyzer (SUDA) on board NASA's upcoming Europa Clipper mission. During spacecraft flybys, these instruments can sample ice grains formed from subsurface water and emitted by these moons. Previous laboratory analog experiments have demonstrated that SUDA-type instruments could identify amino acids, fatty acids, and peptides in ice grains and discriminate between their abiotic and biotic origins. Here, we report experiments simulating impact ionization mass spectra of ice grains containing DNA, lipids, and metabolic intermediates extracted from two bacterial cultures: Escherichia coli and Sphingopyxis alaskensis. Salty Enceladan or Europan ocean waters were simulated using matrices with different NaCl concentrations. Characteristic mass spectral signals, such as DNA nucleobases, are clearly identifiable at part-per-million-level concentrations. Mass spectra of all substances exhibit unambiguous biogenic patterns, which in some cases show significant differences between the two bacterial species. Sensitivity to the biosignatures decreases with increasing matrix salinity. The experimental parameters indicate that future impact ionization mass spectrometers will be most sensitive to the investigated biosignatures for ice grain encounter speeds of 4–6 km/s.
1. Introduction
Enceladus and Europa, icy moons of Saturn and Jupiter, respectively, host global, subsurface, liquid water oceans (Hoppa et al., 1999; Thomas et al., 2016). A plume has been detected on Enceladus (Hansen et al., 2006; Porco et al., 2006; Spencer et al., 2006), ejecting gas and water ice grains formed from the moon's subsurface ocean into space. Similar phenomena may occur on Europa (Roth et al., 2014; Sparks et al., 2016; Jia et al., 2018). The presence of water, combined with the availability of energy and chemical disequilibrium (Hand et al., 2007), makes these moons compelling places to search for life in the outer Solar System as these oceans provide potential habitable environments (Russell et al., 2014; Cockell et al., 2016). We define life here and throughout this paper as life as we know it to exist on Earth, based on organic chemistry and water.
Emitted ice grains can be sampled in situ during spacecraft flybys using impact ionization mass spectrometers, such as the Cosmic Dust Analyzer (CDA; Srama et al., 2004) on board the past Cassini mission; the SUrface Dust Analyzer (SUDA; Kempf et al., 2014), which is being built for NASA's upcoming Europa Clipper mission (Howell and Pappalardo, 2020); and the ENceladus Ice Analyzer (ENIA; Srama et al., 2015), which is proposed for future Enceladus missions (Reh et al., 2016; Mitri et al., 2018). Impact ionization mass spectrometers thereby provide a cost-effective means of assessing the physical and chemical properties and, thus, habitability of the moons' subsurface oceans. Hypervelocity (≥ 1 km/s) impacts of nanometer- to micrometer-sized ice grains onto the ionization mass spectrometer's metal target generate ions, which are then separated by an electric field, eventually producing time-of-flight (TOF) mass spectra (e.g., Srama et al., 2004). Due to the impact ionization process that creates almost exclusively singly charged ions, the spectral peak positions, that is, ion arrival times at the detector, therefore depend only on the ions' masses. While CDA was sensitive only to cations, SUDA and ENIA will be capable of producing both cation and anion mass spectra.
For a detailed spectral analysis, terrestrial calibration experiments are needed. Although the acceleration of siliceous and organic particles is feasible up to tens of kilometers per second (e.g., Bowden et al., 2009; Hillier et al., 2009, 2018; Srama et al., 2009; Burchell et al., 2014; New et al., 2020; Fisher et al., 2021; Kazemi et al., 2021), the controlled acceleration of micrometer-sized ice grains in a laboratory environment is extremely technically challenging (e.g., Belousov et al., 2021). However, a technique that employs Laser Induced Liquid Beam Ion Desorption (LILBID), which was introduced by Brutschy and coworkers (Kleinekofort et al., 1996a, 1996b) and applied to the analysis of large biomolecules by Abel and coworkers (Charvat and Abel, 2007), has been further developed to accurately reproduce mass spectra generated by impact ionization of ice grains impacting the detectors' metal targets at relevant speeds varying from 2 to >20 km/s (Klenner et al., 2019). In addition to speed-dependent, non-compositional differences, this technique has successfully been used to infer compositional differences of ice grains emitted by Enceladus from Cassini mission spectra obtained by CDA (e.g., Postberg et al., 2009, 2011, 2018a; Khawaja et al., 2019).
Comparing the analog laser desorption laboratory data with CDA mass spectra revealed that Enceladus' ocean is salty, with sodium salts being the most abundant nonwater compounds at a total concentration of 0.05–0.2 M (Postberg et al., 2009), and contains a variety of organic compounds (Postberg et al., 2008, 2018a; Khawaja et al., 2019). In fact, ∼25 % of Enceladan ice grains contain organic material at detectable concentrations (Postberg et al., 2008, 2018b). Volatile low-mass oxygen- and nitrogen-bearing compounds have been identified in the majority of these organic-enriched ice grains (Khawaja et al., 2019), while 5–10% of these grains (1.25–2.5% of the total ice grains emitted by Enceladus) contain even more complex, refractory macromolecules at concentrations ≥0.5% wt (Postberg et al., 2018a). The volatile organics are thought to have been previously dissolved in Enceladus' ocean, and subsequently, their high vapor pressures enable sufficient evaporation from the subsurface water. These initially gaseous organics undergo condensation and adsorption onto water ice nucleation cores during ascent in Enceladus' ice vents (Bouquet et al., 2019; Khawaja et al., 2019). In contrast, the refractory, probably hydrophobic, macromolecules are believed to originate from a thin organic layer floating on top of Enceladus' subsurface water table (Postberg et al., 2018a). However, despite the detection of even macromolecular organic compounds, it is still unclear whether Enceladan ice grains contain biosignatures or even remnants of microbial life-forms.
LILBID experiments have also been used to predict the mass spectral appearances and detection limits for ice grain detections of abiotic organics as well as those of potential biosignatures by a SUDA-type instrument (Klenner et al., 2020a, 2020b). Klenner et al. (2020a) conducted LILBID experiments with amino acids, fatty acids, and peptides and concluded that these biologically important molecules would be detectable down to the part-per-billion level using impact ionization mass spectrometry. Characteristic abiotic and biotic fingerprints of these molecules could be reliably discriminated from each other in mass spectra of salt-poor, as well as in those of salt-rich, ice grains (Klenner et al., 2020b). Impact ionization instruments on spacecrafts appear to be most sensitive to these delicate molecules enclosed in the ice grains and their characteristic mass spectral signals emerging from impacts of the particles on the detector at encounter velocities of 4–6 km/s (Klenner et al., 2020b). Theoretical simulations by Jaramillo-Botero et al. (2021) support this speed regime. According to these simulations, encounter velocities of 3–5 km/s are ideal for the detection of bare amino acids and fatty acids, while 4–6 km/s appears to be an optimal speed window for the identification of the same species when they are enclosed in ice grains (Jaramillo-Botero et al., 2021). Slightly higher speeds of 7–10 km/s would allow for the predominant formation of potentially characteristic fragment ions while the parent molecular signatures become less apparent. While informative, these experiments involved commercially available chemicals (either pure or in mixtures); the next step is to validate impact-induced ionization analyses with samples of true biotic origin.
Building on the preliminary findings, we investigated, with the same laboratory laser desorption setup, mass spectra of deoxyribonucleic acid (DNA), lipids, and hydrophilic cell compounds extracted from bacterial cells. We chose two different bacterial species for our investigations: Escherichia coli and Sphingopyxis alaskensis, formerly described as Sphingomonas alaskensis. The most widely studied, free-living organism on Earth, E. coli is a facultative anaerobic bacterium with an optimal reproduction temperature of 37°C and a rapid growth rate; thus it is able to adapt relatively quickly to moderate changes in environmental conditions (e.g., Taj et al., 2014). Sphingopyxis alaskensis is a psychrophilic organism that has been isolated from various marine environments (e.g., Schut et al., 1993, 1997; Eguchi et al., 1996). Some strains can grow at temperatures below 5°C (Eguchi et al., 2001). This ultramicrobacterium (volume of <0.1 μm3), which is small enough to be potentially enclosed within the micrometer-sized Enceladan ice grains, can utilize low concentrations of nutrients and, thus, grow in oligotrophic environments that provide only a very low nutrient flux (Poindexter, 1981; Cavicchioli et al., 2003). Additionally, S. alaskensis has recently been reported to grow mixotrophically by consuming H2, an energy source that is important in energy-limited environments (Lappan et al., 2022) and indeed available in Enceladus' ocean (Waite et al., 2017). This organism, therefore, may be more representative of putative life in Enceladus' ocean.
DNA is used by life-forms on Earth to store genetic information. In its most basic structure, DNA forms a double helix that contains four nucleobases (adenine, guanine, cytosine, thymine), stabilized by a phosphate-deoxyribose backbone. The nucleobases are classified into purines (adenine, guanine) and pyrimidines (cytosine, thymine), with adenine always binding to thymine and guanine always binding to cytosine (Franklin and Gosling, 1953; Watson and Crick, 1953; Wilkins et al., 1953). Thus, an equal ratio of adenine to thymine and guanine to cytosine, respectively, can be considered a characteristic trait of DNA deriving from terrestrial life. However, modified nucleobases can occasionally be found in DNA, such as the pyrimidine base uracil, which derives from deamination (removal of NH2) of cytosine and replaces thymine in the DNA structure (Krokan et al., 2002; Kumar et al., 2018). Although individual nucleobases can form abiotically, for example through dehydration and condensation of formamide (Hudson et al., 2012), DNA is known to form only through biological processes; therefore, detection of DNA in an extraterrestrial environment has the potential to provide unambiguous evidence for life beyond Earth. In fact, the complexity of such biopolymers, produced by living organisms, is one of the most direct signs of extant or extinct life (Summons et al., 2008; Davila and McKay, 2014).
Lipids are the main components of cell membranes in terrestrial life-forms (e.g., Singer and Nicolson, 1972), with glycerophospholipids being most abundant in bacterial membranes (e.g., López-Lara and Geiger, 2017). These glycerophospholipids consist of a phosphate ester that binds to the glycerol moiety, thereby forming a polar head group, with hydrophobic fatty acids of various length binding to the glycerol (e.g., Duncan et al., 1971). Fatty acids are biochemically produced by the addition of two carbon atoms at a time, which results in an excess of even-numbered carbon atom fatty acids when examining unbranched and saturated fatty acids, with hexadecanoic acid (C16) and octadecanoic acid (C18) dominating (Georgiou and Deamer, 2014). This excess of saturated even carbon number fatty acids can serve as a biosignature that results from the biological synthetic pathways and could, in fact, be discriminated from abiotically produced fatty acid abundance patterns using impact ionization mass spectrometry in space (Klenner et al., 2020b). These fatty acid abundance patterns may be less apparent in thermophilic and psychrophilic organisms (like S. alaskensis), as changing the ratio of saturated to unsaturated fatty acids is a common adaptive method to maintain membrane structure and flexibility at extreme temperatures (Langworthy, 1982; Wirsen et al., 1986).
Of particular relevance to impact ionization mass spectrometry are the effects of ocean constituents other than water on the spectral appearance and detection limits of biosignatures. A large fraction of Enceladan ice grains is frozen ocean spray, with sodium salts (chlorides and carbonates) representing the dominant nonwater constituents (∼1% by mass; Postberg et al., 2009). Endogenous sodium and magnesium salts are believed to exist on Europa's surface (Brown and Hand, 2013; Ligier et al., 2016; Trumbo et al., 2019). Upon impact ionization, large quantities of cations and anions are produced by these salts and may suppress the spectral signals of other compounds (e.g., Annesley, 2003; Piwowar et al., 2009). For example, Klenner et al. (2020b) observed that, in LILBID experiments, the sensitivity to amino acids dropped by a few orders of magnitude when they were measured in 1% NaCl solutions. Sodiated molecules represented the characteristic spectral amino acid signals, in contrast to protonated/deprotonated molecules that are observed in spectra of amino acids in salt-poor aqueous solutions.
On Earth, 70% of the planetary surface is covered by a biofilm, namely the surface microlayer on top of the ocean water (Flemming and Wuertz, 2019). It is an important link for exchange processes between hydrosphere and atmosphere and hosts a distinct microbial community, the “bacterioneuston,” at cell densities 3–5 orders of magnitude higher than in the bulk water phase (Bezdek and Carlucci 1972; Franklin et al., 2005). After death, oceanic bacterial cells decompose over time into smaller, hydrocarbon-based cell components. These decomposition products reside in the organic biofilm and, for example, serve as food for living organisms (Waksman and Carey, 1933) or dissolve in the bulk water phase. Analogous, bacterial decomposition products on Enceladus or Europa may be expected to stay in a separate organic layer/biofilm at the upper ice-water interface or be dissolved in the bulk water phase. Bacterial lipids and fatty acids are poorly water soluble, are not expected to be significantly dissolved in a cold (∼0°C) salty water ocean, and instead may stay in the separate organic layer/biofilm. After aerosolization at the base of an Enceladan conduit, these compounds can serve as nucleation cores for water vapor, thereby forming salt-poor ice grains in the plume (Postberg et al., 2018a). Hence, we measure extracted lipids in salt-poor background solutions. In contrast, hydrophilic compounds, such as DNA or amino acids (protein fragments or bacterial metabolites), are more water soluble and thus may not only be present in an organic biofilm but also can dissolve in the salty ocean water. We therefore investigate extracted DNA and the hydrophilic cell compounds in salt-poor matrices as well as matrices with increasingly high sodium salt concentrations.
2. Methods
Mass spectra were recorded using the LILBID technique. Here, the experimental setup as well as the preparation of the biosignature solutions are described.
2.1. Experimental
The experimental setup used for this work (Fig. 1) is described in detail by Klenner et al., (2019); as such, we only provide a brief overview here.
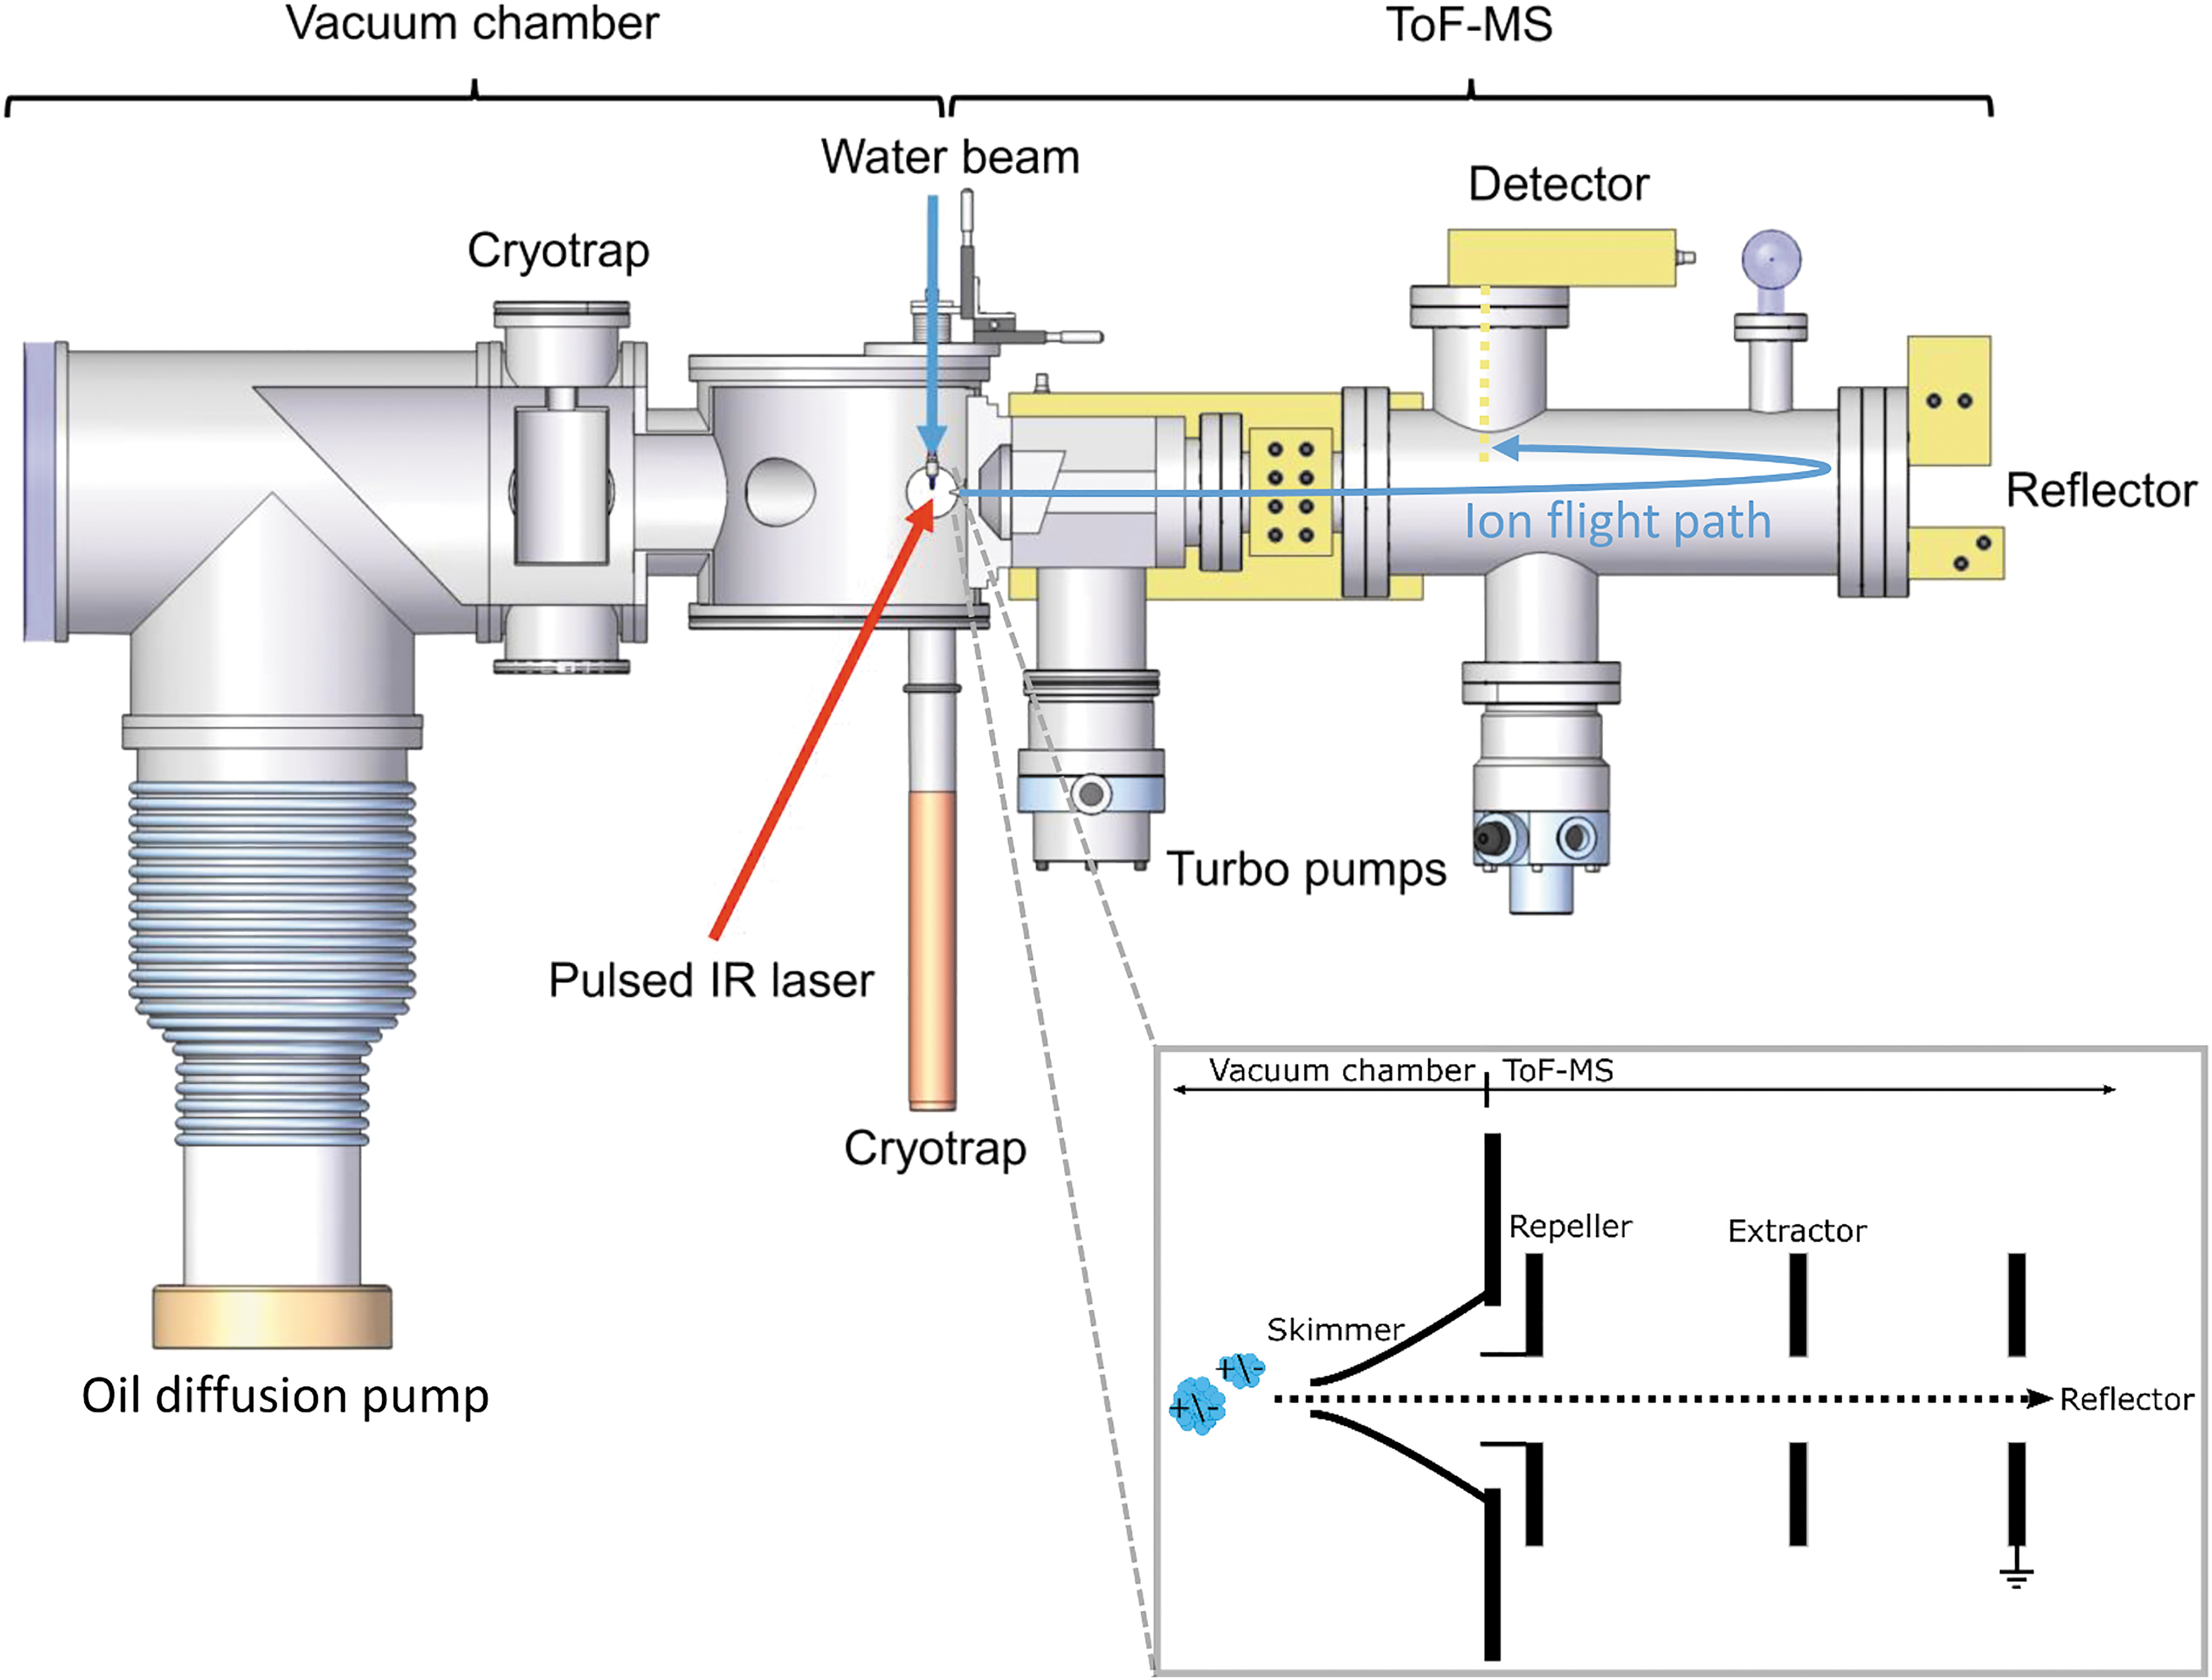
Laboratory setup for simulating mass spectra generated by ice grains impacting the metal target of an impact ionization mass spectrometer in space (taken from Klenner et al., 2019). The inset on the bottom right shows the principle of delayed extraction. The oil diffusion pump shown here has recently been replaced by a turbomolecular pump.
The impact ionization process was replicated by irradiating a micrometer-sized liquid water beam with a pulsed (20 Hz, 7 ns pulse length) infrared laser at variable laser energies. A flashlamp energy of 5.40 J and wavelength of 2840 nm were selected to excite the OH-stretch vibration of the water molecules. The water beam absorbs the laser energy and, on each pulse, thermally explodes into charged and uncharged atomic, molecular, and macroscopic fragments (Charvat and Abel, 2007; Wiederschein et al., 2015). The resulting charged cations or anions (dependent on the instrument's polarity) are accelerated through two electrodes (Fig. 1) and analyzed in a TOF mass spectrometer. The mass spectrometer uses the principle of delayed extraction (Klenner et al., 2019). Setting a predefined delay time between laser shot and switch on of the acceleration electrodes allows the extraction of the ions as a function of their initial velocities.
The detected signals are pre-amplified, digitized, and subsequently generate a TOF mass spectrum, recorded with a LabVIEW-controlled computer. The mass spectra presented here are typically an average of 300–500 individual spectra, co-added to improve the signal-to-noise ratio to a level that represents a spectrum of a single micrometer-sized ice grain recorded by a SUDA-type instrument. The recorded mass spectra (cations and anions) typically have a mass resolution of 600–800 m/Δm (full width at half maximum). At least 0.3 mL of sample volume is needed for one effective measurement. To ensure reproducibility, the experimental setup is calibrated at the beginning of each measurement day using a 10−6 M NaCl solution at three different delay time-laser intensity settings.
All spectra recorded with the LILBID setup were archived in a comprehensive spectral database and can be compared to past and future impact ionization data recorded in space (Klenner et al., 2022).
2.2. Preparation of biosignature solutions
Escherichia coli cells (strain W3110) were cultured at the Institute of Biology and the Institute of Experimental Physics, Freie Universität Berlin. The cultures were grown overnight in lysogeny broth (LB) medium (Bertani, 1951) at 37°C. Cells were harvested in 1 mL aliquots and washed twice with 0.9% NaCl by centrifugation at 16,000 × g for 1 min (Model Biofuge pico, Kendro Laboratory Products). The cell material was stored as pellets at -20°C until use. Sphingopyxis alaskensis (strain DSM 13593) was cultured at the Faculty of Science, Technology, Engineering & Mathematics, The Open University, UK. Cultures were grown overnight at 29°C in Tryptone Soya Broth (TSB) (MacFaddin, 1985) medium. Cells were harvested and washed three times with 0.9% NaCl by centrifugation (12,000 × g, for 10 min). The cell material was air-desiccated and stored at -20°C until use.
Using the E. coli and S. alaskensis cells, we investigated three main fractions (DNA, lipids, hydrophilic compounds) in five different types of salt-poor or salt-rich solutions: i, ii, iii, iv, v (Table 1, described below).
Biosignature Solutions
2.2.1. Bacterial DNA in salt-poor (solution type i) and salt-rich (solution type ii) solutions
DNA of E. coli was extracted using the Norgen Biotek Bacterial Genomic DNA Isolation Kit, as per manufacturer's instructions. The Elution buffer B provided in the kit for elution of the DNA after it is bound to the spin column contains tris-hydrochloride (Tris-HCl) and ethylenediaminetetraacetic acid (EDTA). Traces of both chemicals could remain in the DNA samples, potentially resulting in strong mass lines in the recorded mass spectra. To avoid these signals, which could interfere with characteristic DNA signals, elution buffer B was substituted with Milli-Q H2O to elute the DNA from the spin column. To optimize the DNA yield, the elution step was repeated. This increased DNA yield (200–250 ppmw as opposed to ∼50 ppmw).
The Norgen Biotek Bacterial Genomic DNA method did not yield sufficient DNA with S. alaskensis; hence, the Genomic DNA Purification Kit from ThermoFisher (K0512) was used, as per manufacturer's instructions. The kit is based on a selective detergent-mediated DNA precipitation method. Chloroform is added to the S. alaskensis cell lysate (10 mg dry weight) to produce a biphasic system. Following separation, the DNA is then precipitated from the aqueous phase and washed with cold ethanol before dissolution in deionized water, yielding DNA extracts of 3–4 ppmw.
DNA concentrations were measured with either a NanoDrop 2000c (ThermoFisher Scientific) photometer or a Quantus Fluorometer (Promega). The DNA samples were stored at -20°C until further use.
Following the above-described procedures, genomic DNA was obtained in a salt-poor matrix (solution type i). To account for the effects of a salty Enceladan or Europa ocean, the DNA was prepared in NaCl solutions over a range of concentrations (10−5, 10−4, 10−3, 10−2, and 10−1 M NaCl), representing solution type ii.
2.2.2. Bacterial lipids in salt-poor solutions (solution type iii)
Lipids were extracted using a chloroform-methanol-based isolation method initially developed by Bligh and Dyer (1959) and modified for bacterial samples (e.g., Ames, 1968). Lipids were extracted from frozen ∼109 cells using a solvent mixture of H2O, methanol, and chloroform (4:10:5). Samples were mixed by inversion and incubated for 10 min at 4°C, after which equal volumes (1 mL each) of chloroform and H2O were added. To complete separation of the lipids and the aqueous phase, the samples were centrifuged at 3000 × g for 15 min (Heraeus Megafuge 16, ThermoFisher Scientific), forming a biphasic system with an interphase. The chloroform-lipid phase (lowest layer) was obtained by pipetting. The volatile chloroform was evaporated with an air stream, and the lipids remained in the sample tube. Due to the lipids' poor solubility in water, pure H2O was found to be unfeasible for dissolving these organics; a mixture of 10 mL H2O and 20 mL isopropanol was used instead. The lipid samples (solution type iii) were either immediately used for LILBID analysis or stored in the refrigerator at 7°C until further use.
2.2.3. Hydrophilic cell compounds in salt-poor (solution type iv) and salt-rich (solution type v) solutions
Following addition of H2O and chloroform to the cells, the biphasic system derived from the Bligh and Dyer (1959) lipid extraction contained an upper aqueous phase, a lower chloroform-lipid phase, and a clearly visible interface between these two phases. The aqueous phase contained polar, hydrophilic molecules, such as amino acids, sugars, or DNA from ∼109 cells dissolved in a water-methanol matrix (see Section 2.2.2). These samples (solution type iv) were stored at 7°C until further use. To account for the effects of a salty extraterrestrial ocean, we added different concentrations of NaCl (10−4, 10−2, and 10−1 M) to the hydrophilic cell compounds (solution type v).
3. Results and Mass Spectral Analysis
3.1. DNA
In the mass spectra of DNA extracted from both bacterial species in pure water (solution i), identical spectral characteristics can be clearly identified, including nucleobases and fragments of the DNA's phosphate-deoxyribose backbone. In the cation mass spectrum of the DNA (Fig. 2), protonated cytosine (m/z 112), adenine (m/z 136), and guanine (m/z 152) are clearly identifiable. The fourth nucleobase thymine can be tentatively identified (m/z 127), but this peak interferes with a cluster peak from the water matrix (H2O)6H3O+. Several nucleobase fragments are detected, such as [cytosine-HNCO]+ (m/z 68), [adenine-2HCN]+ (m/z 81), [guanine-NHCN]+ (m/z 110), [thymine-CH3]+ (m/z 111), and [adenine-NH2]+ (m/z 119). Protonated fragments of the phosphate-deoxyribose backbone of the DNA can also be identified, such as [H4PO3]+ (m/z 83), [H4PO4]+ (m/z 99), and protonated deoxyribose (m/z 135). Unlabeled peaks in all spectra are yet to be identified.
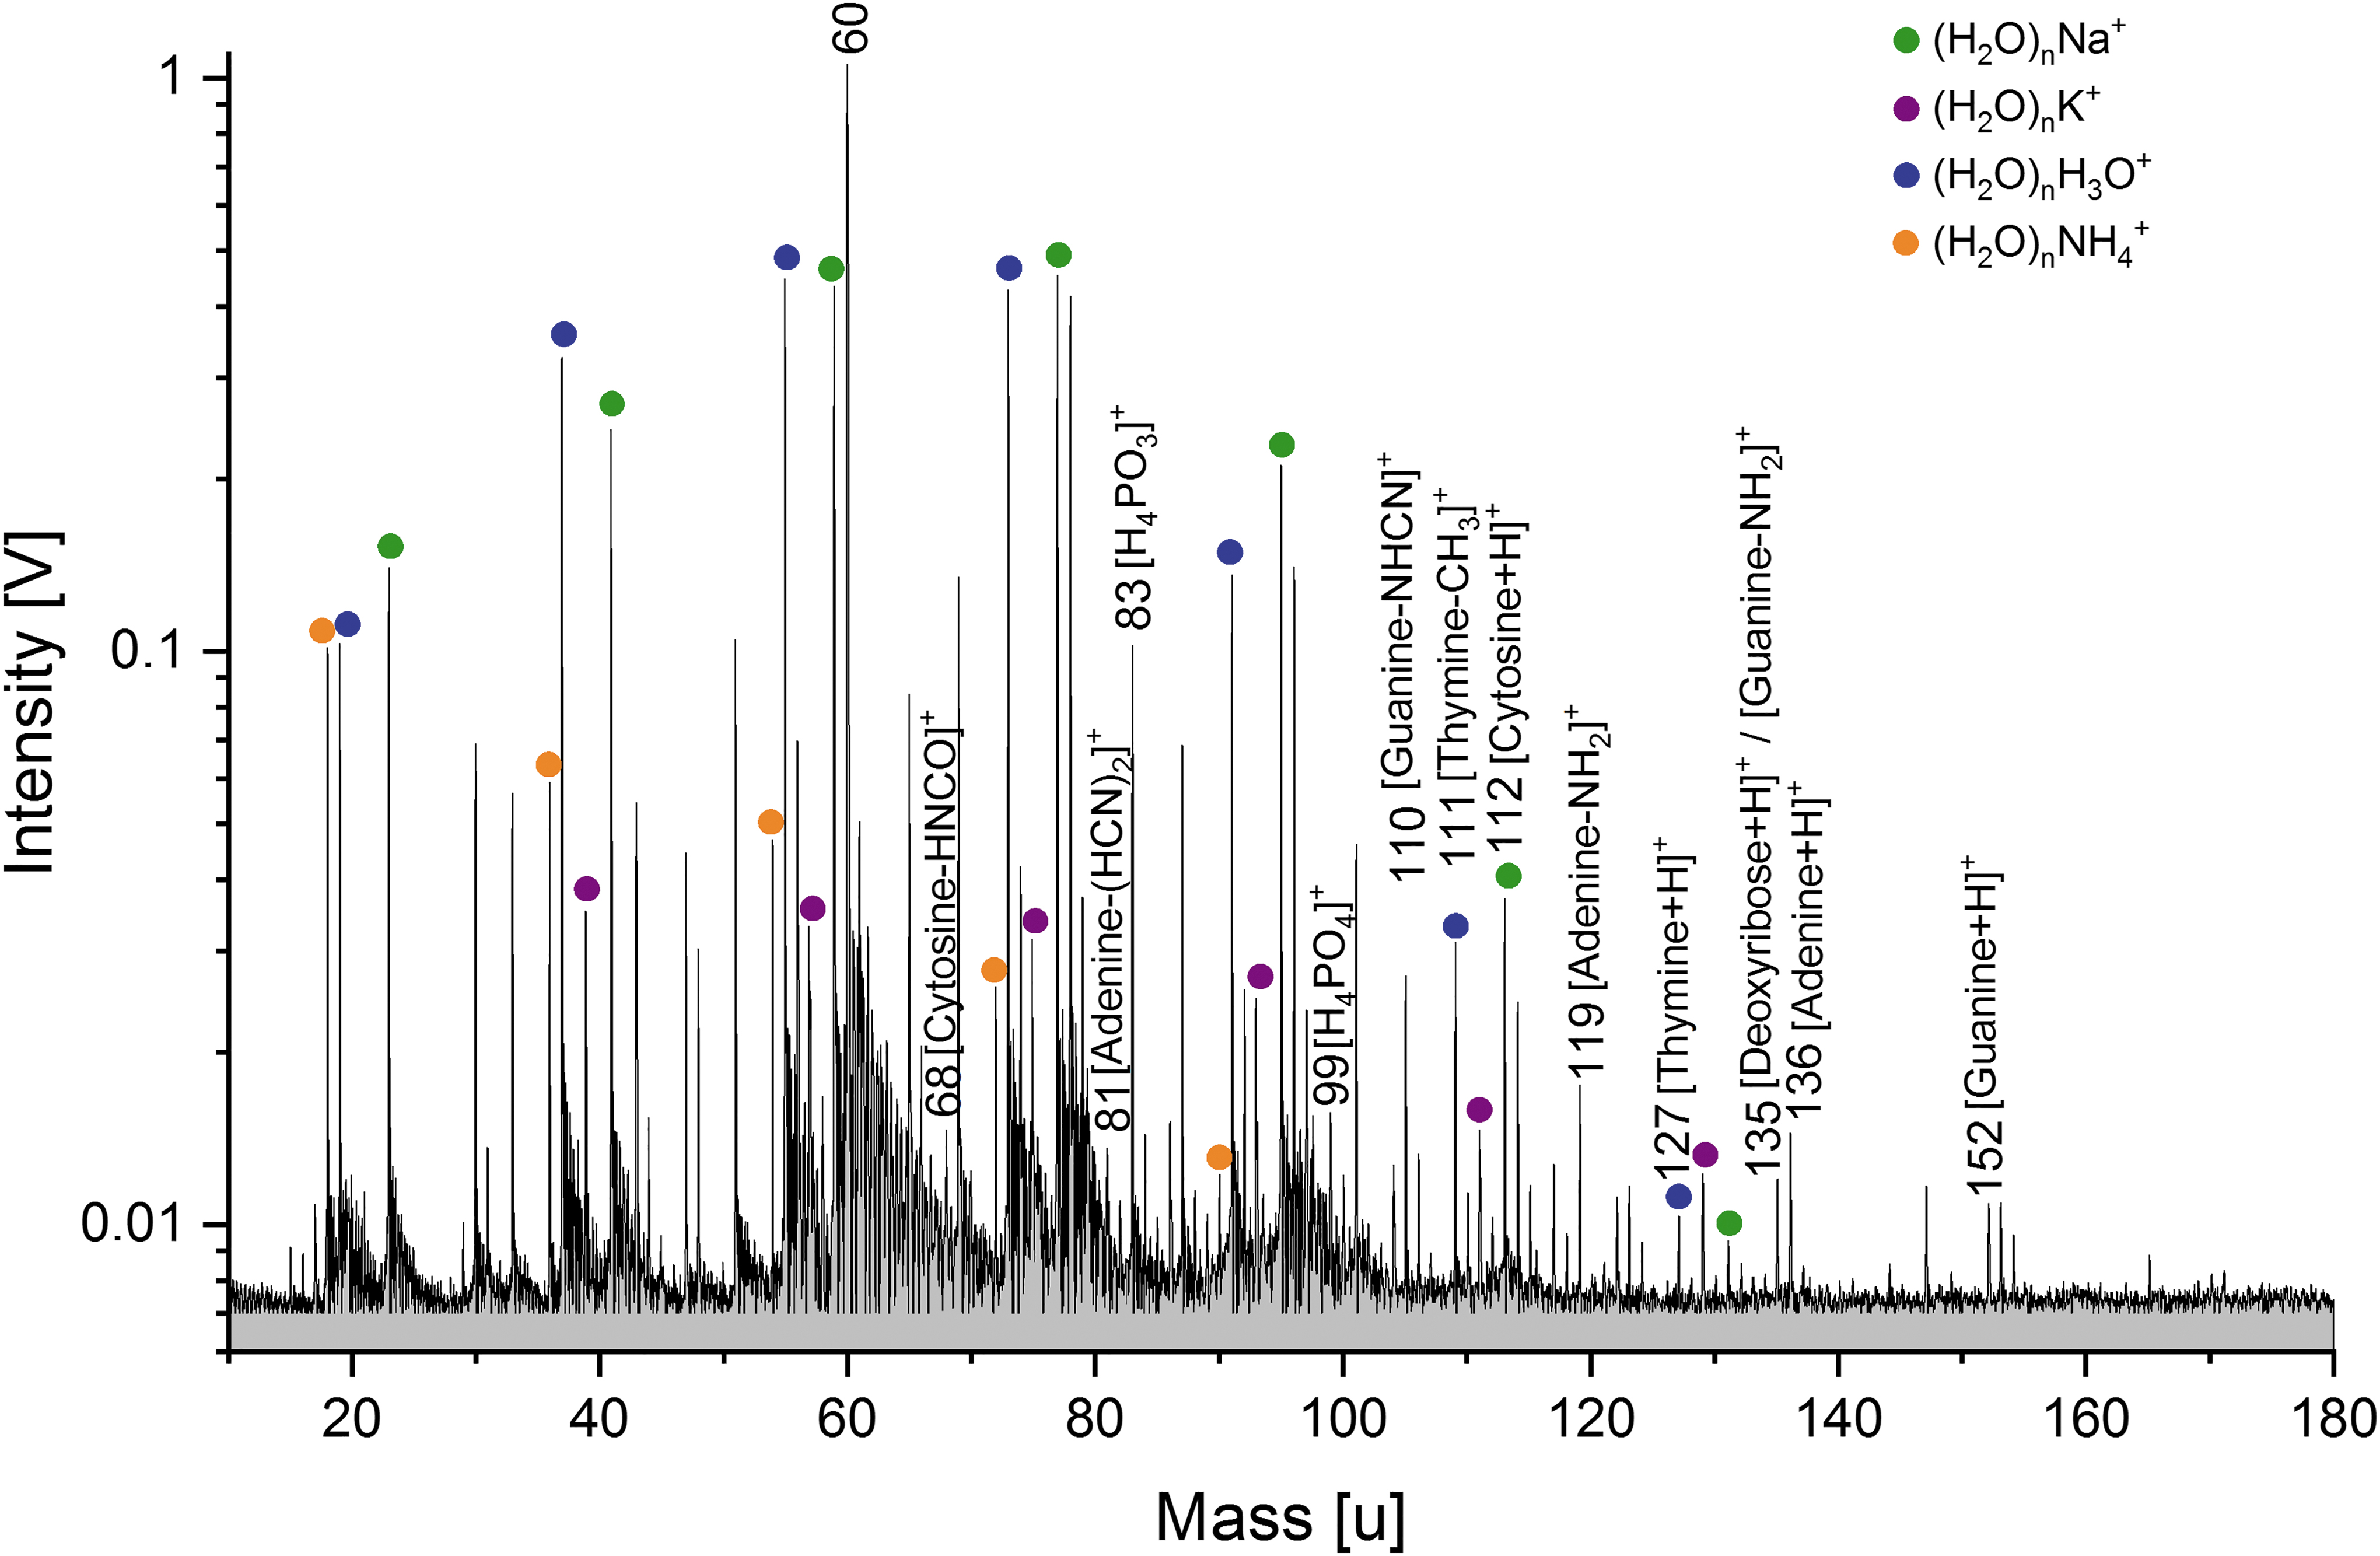
Baseline corrected cation mass spectrum (y-axis in logarithmic scale) of E. coli DNA (100–150 ppmw) in H2O. Characteristic DNA fragments, such as protonated nucleobases (cytosine, adenine, and guanine), are observable. The mass spectrum was recorded at a delay time of 5.9 μs and a laser intensity of 98.1%.
The base peak at m/z 60 might derive from the fragmentation of the amino acid serine ([Ser-COOH]+), or be attributed to protonated guanidine (i.e., the guanidinium cation [HNC(NH2)2 + H]+), which could potentially be produced by the fragmentation of either guanine or arginine (Reiss et al., 2017; Zhang et al., 2020), or originate from guanidine hydrochloride used during the DNA extraction. Consequently, an additional DNA extraction method without the use of guanidine hydrochloride (the ethanol precipitation method, Zeugin and Hartley, 1985, described in Supplementary Information S1) was performed to evaluate the relative contribution of nucleobase fragments to the peak at m/z 60. The resulting cation mass spectrum of E. coli DNA (Fig. S1, top panel) shows a high peak at m/z 60, demonstrating that DNA fragments significantly contribute to this peak.
In DNA anion spectra (Fig. 3), we were still able to clearly detect three nucleobases (deprotonated thymine, adenine, and guanine) at DNA concentrations of 3 ppmw (as opposed to ∼100 ppmw in cation spectra), as well as PO3 - (m/z 79), a characteristic fragment of the DNA's sugar backbone. The signal-to-noise ratio of PO3 - and adenine indicate a detection limit below 1 ppm. The anion mode appears to be more sensitive to mass spectral signals of DNA than the cation mode.
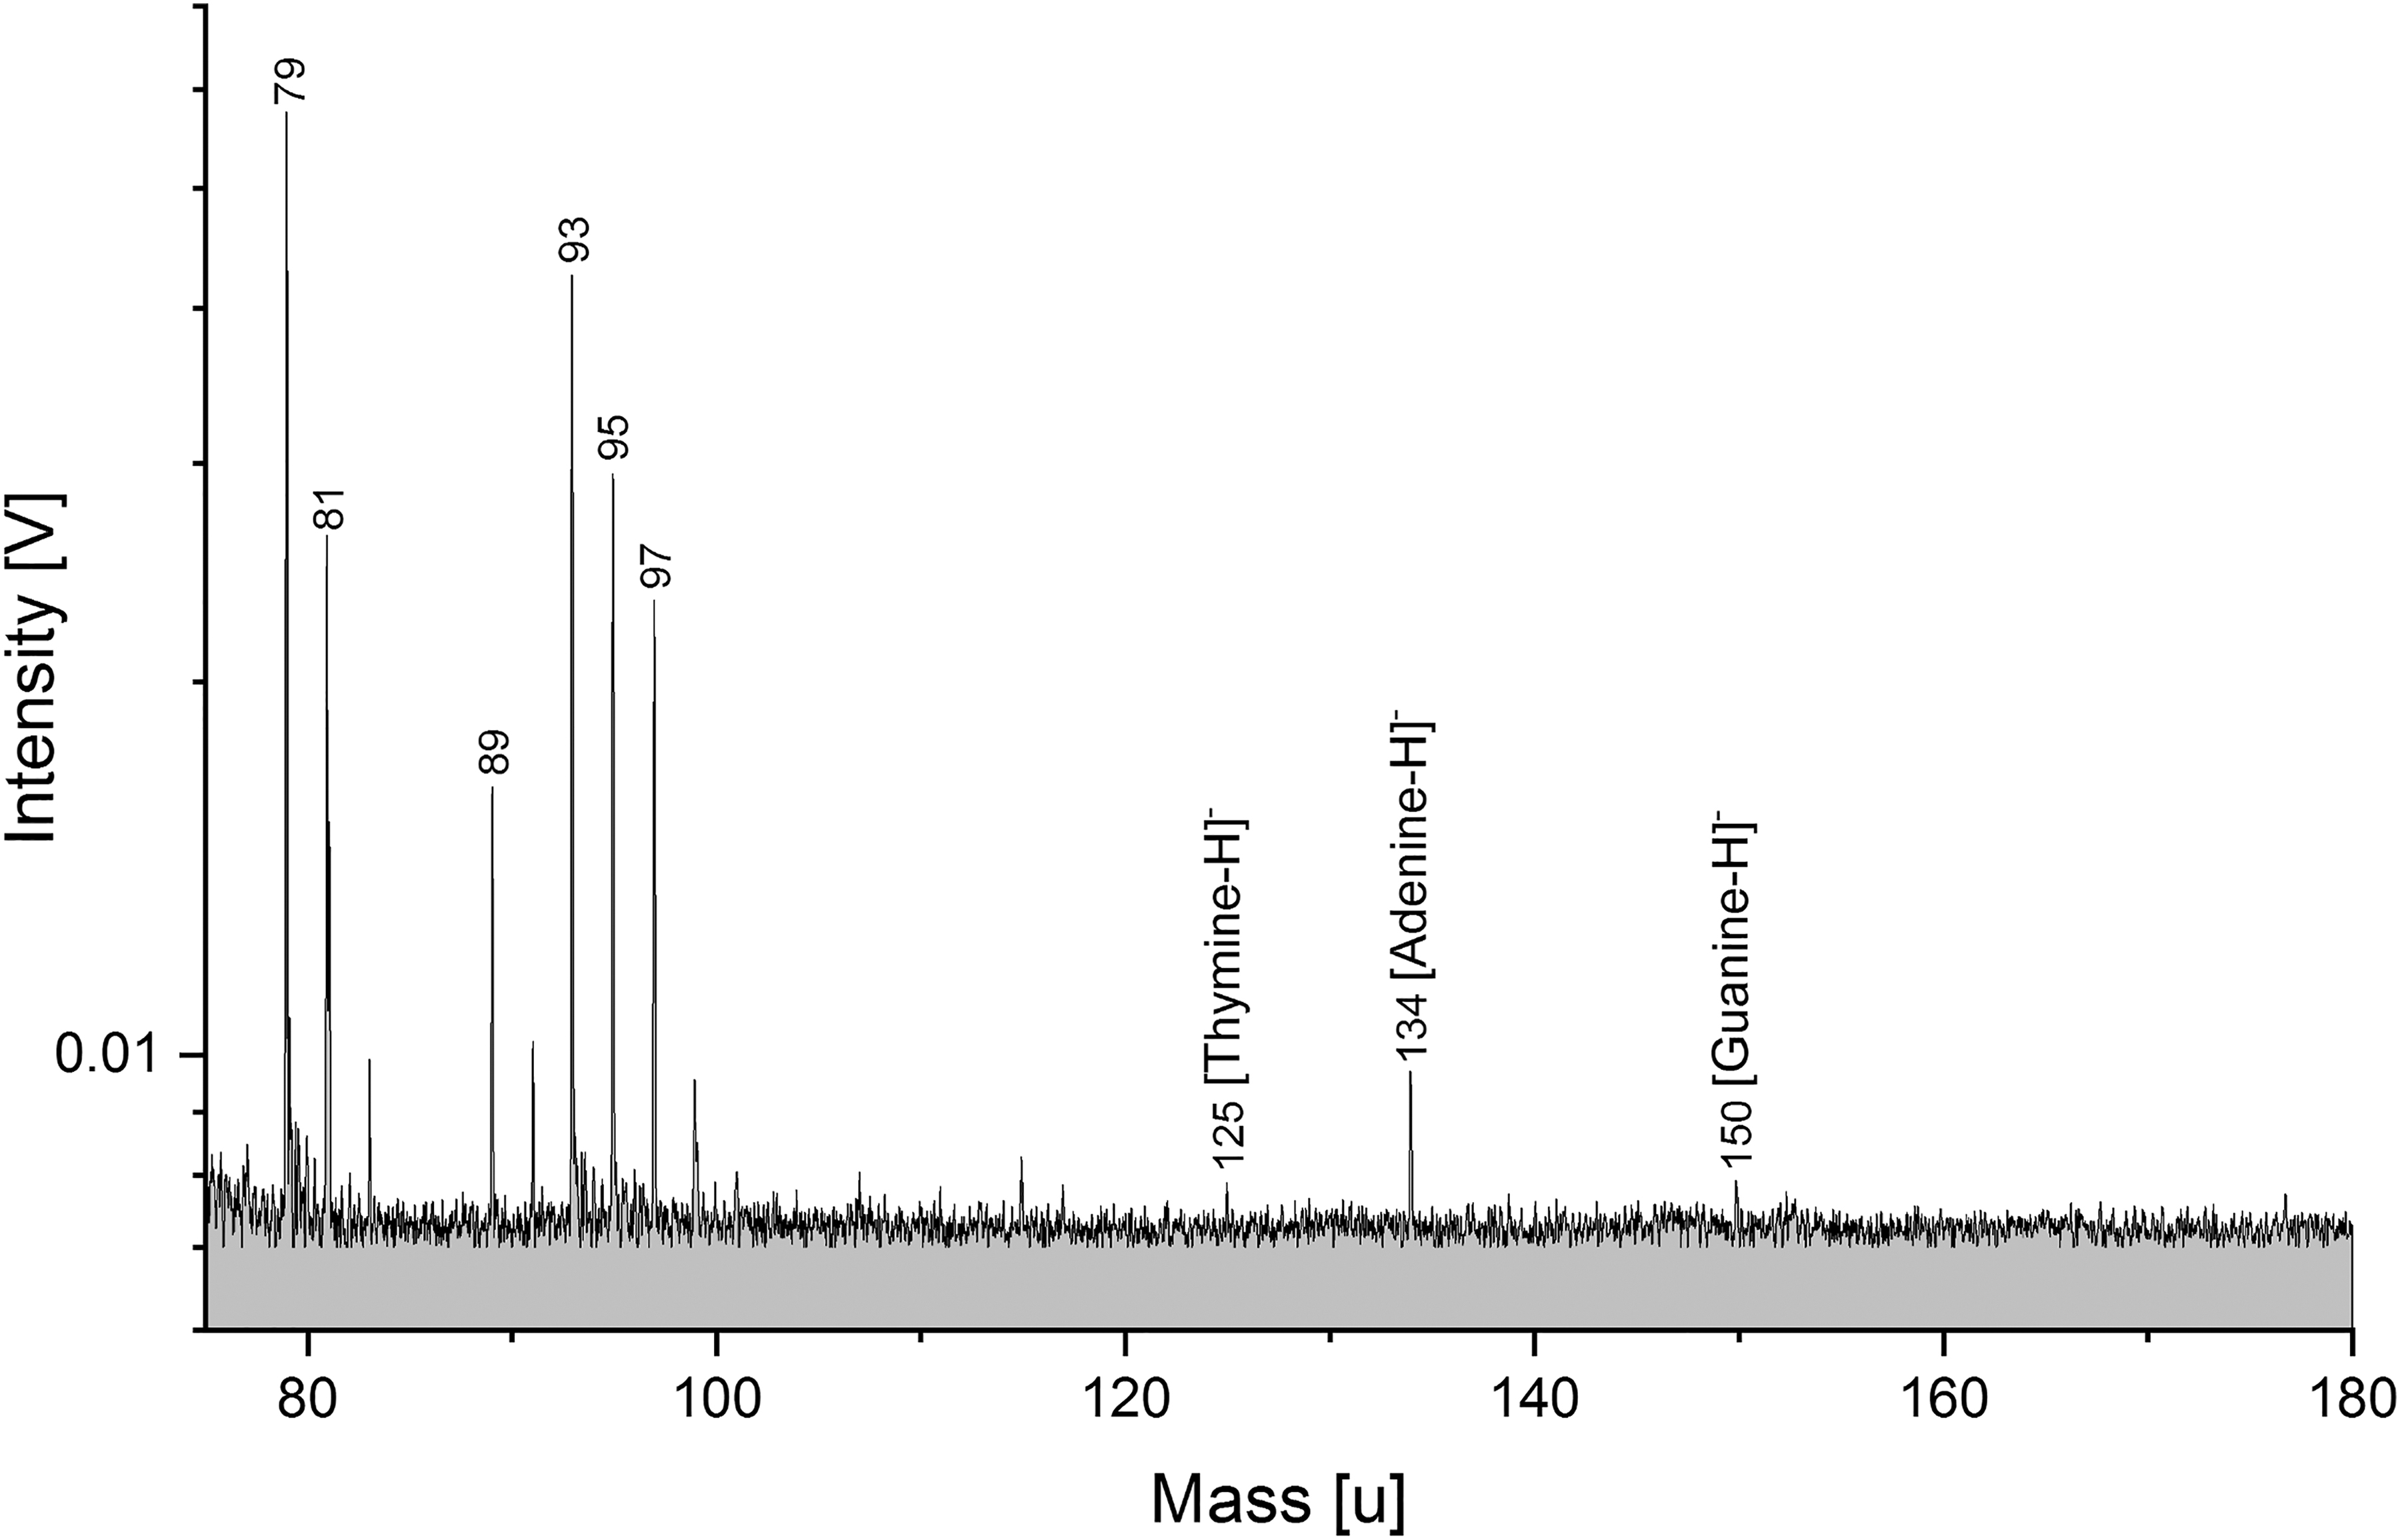
Section (m/z 75–180) of a baseline corrected anion spectrum (y-axis in logarithmic scale) of S. alaskensis DNA (3 ppmw) in H2O. Characteristic DNA fragments, such as deprotonated nucleobases (thymine, adenine, and guanine) as well as phosphate from the DNA backbone are clearly observable. The mass spectrum was recorded at a delay time of 5.4 μs and a laser intensity of 100%.
The spectra of genomic DNA in salt-rich matrices (solution ii) show that biosignatures from the DNA can be identified even at relatively high salt concentrations: nucleobases can be detected in their deprotonated form in salt-rich background solutions at NaCl concentrations up to 0.01 M (Fig. S2). The experimental setup appears to be more sensitive to the two purine nucleobases (adenine and guanine) than to the pyrimidine nucleobases (cytosine and thymine). The sensitivity to the biosignature decreases with increasing salinity of the matrix due to suppression effects of the salt species on the biomolecules (Annesley, 2003; Piwowar et al., 2009; Klenner et al., 2020b).
3.2. Lipids
Bacterial lipids were measured in a water-isopropanol (1:2 v:v) matrix because of their poor solubilities in water (solution type iii). Isopropanol produces only few low-amplitude peaks at masses above ∼120 u that can be well distinguished from the peaks derived from the analytes. Characteristic lipid fragments, that is, fatty acids (saturated as well as unsaturated) and phospholipid fragments (Fig. 4), strongly favor forming deprotonated molecular anions [M-H]- over protonated molecular cations [M+H]+. Lipid samples were, therefore, only investigated in anion mode.
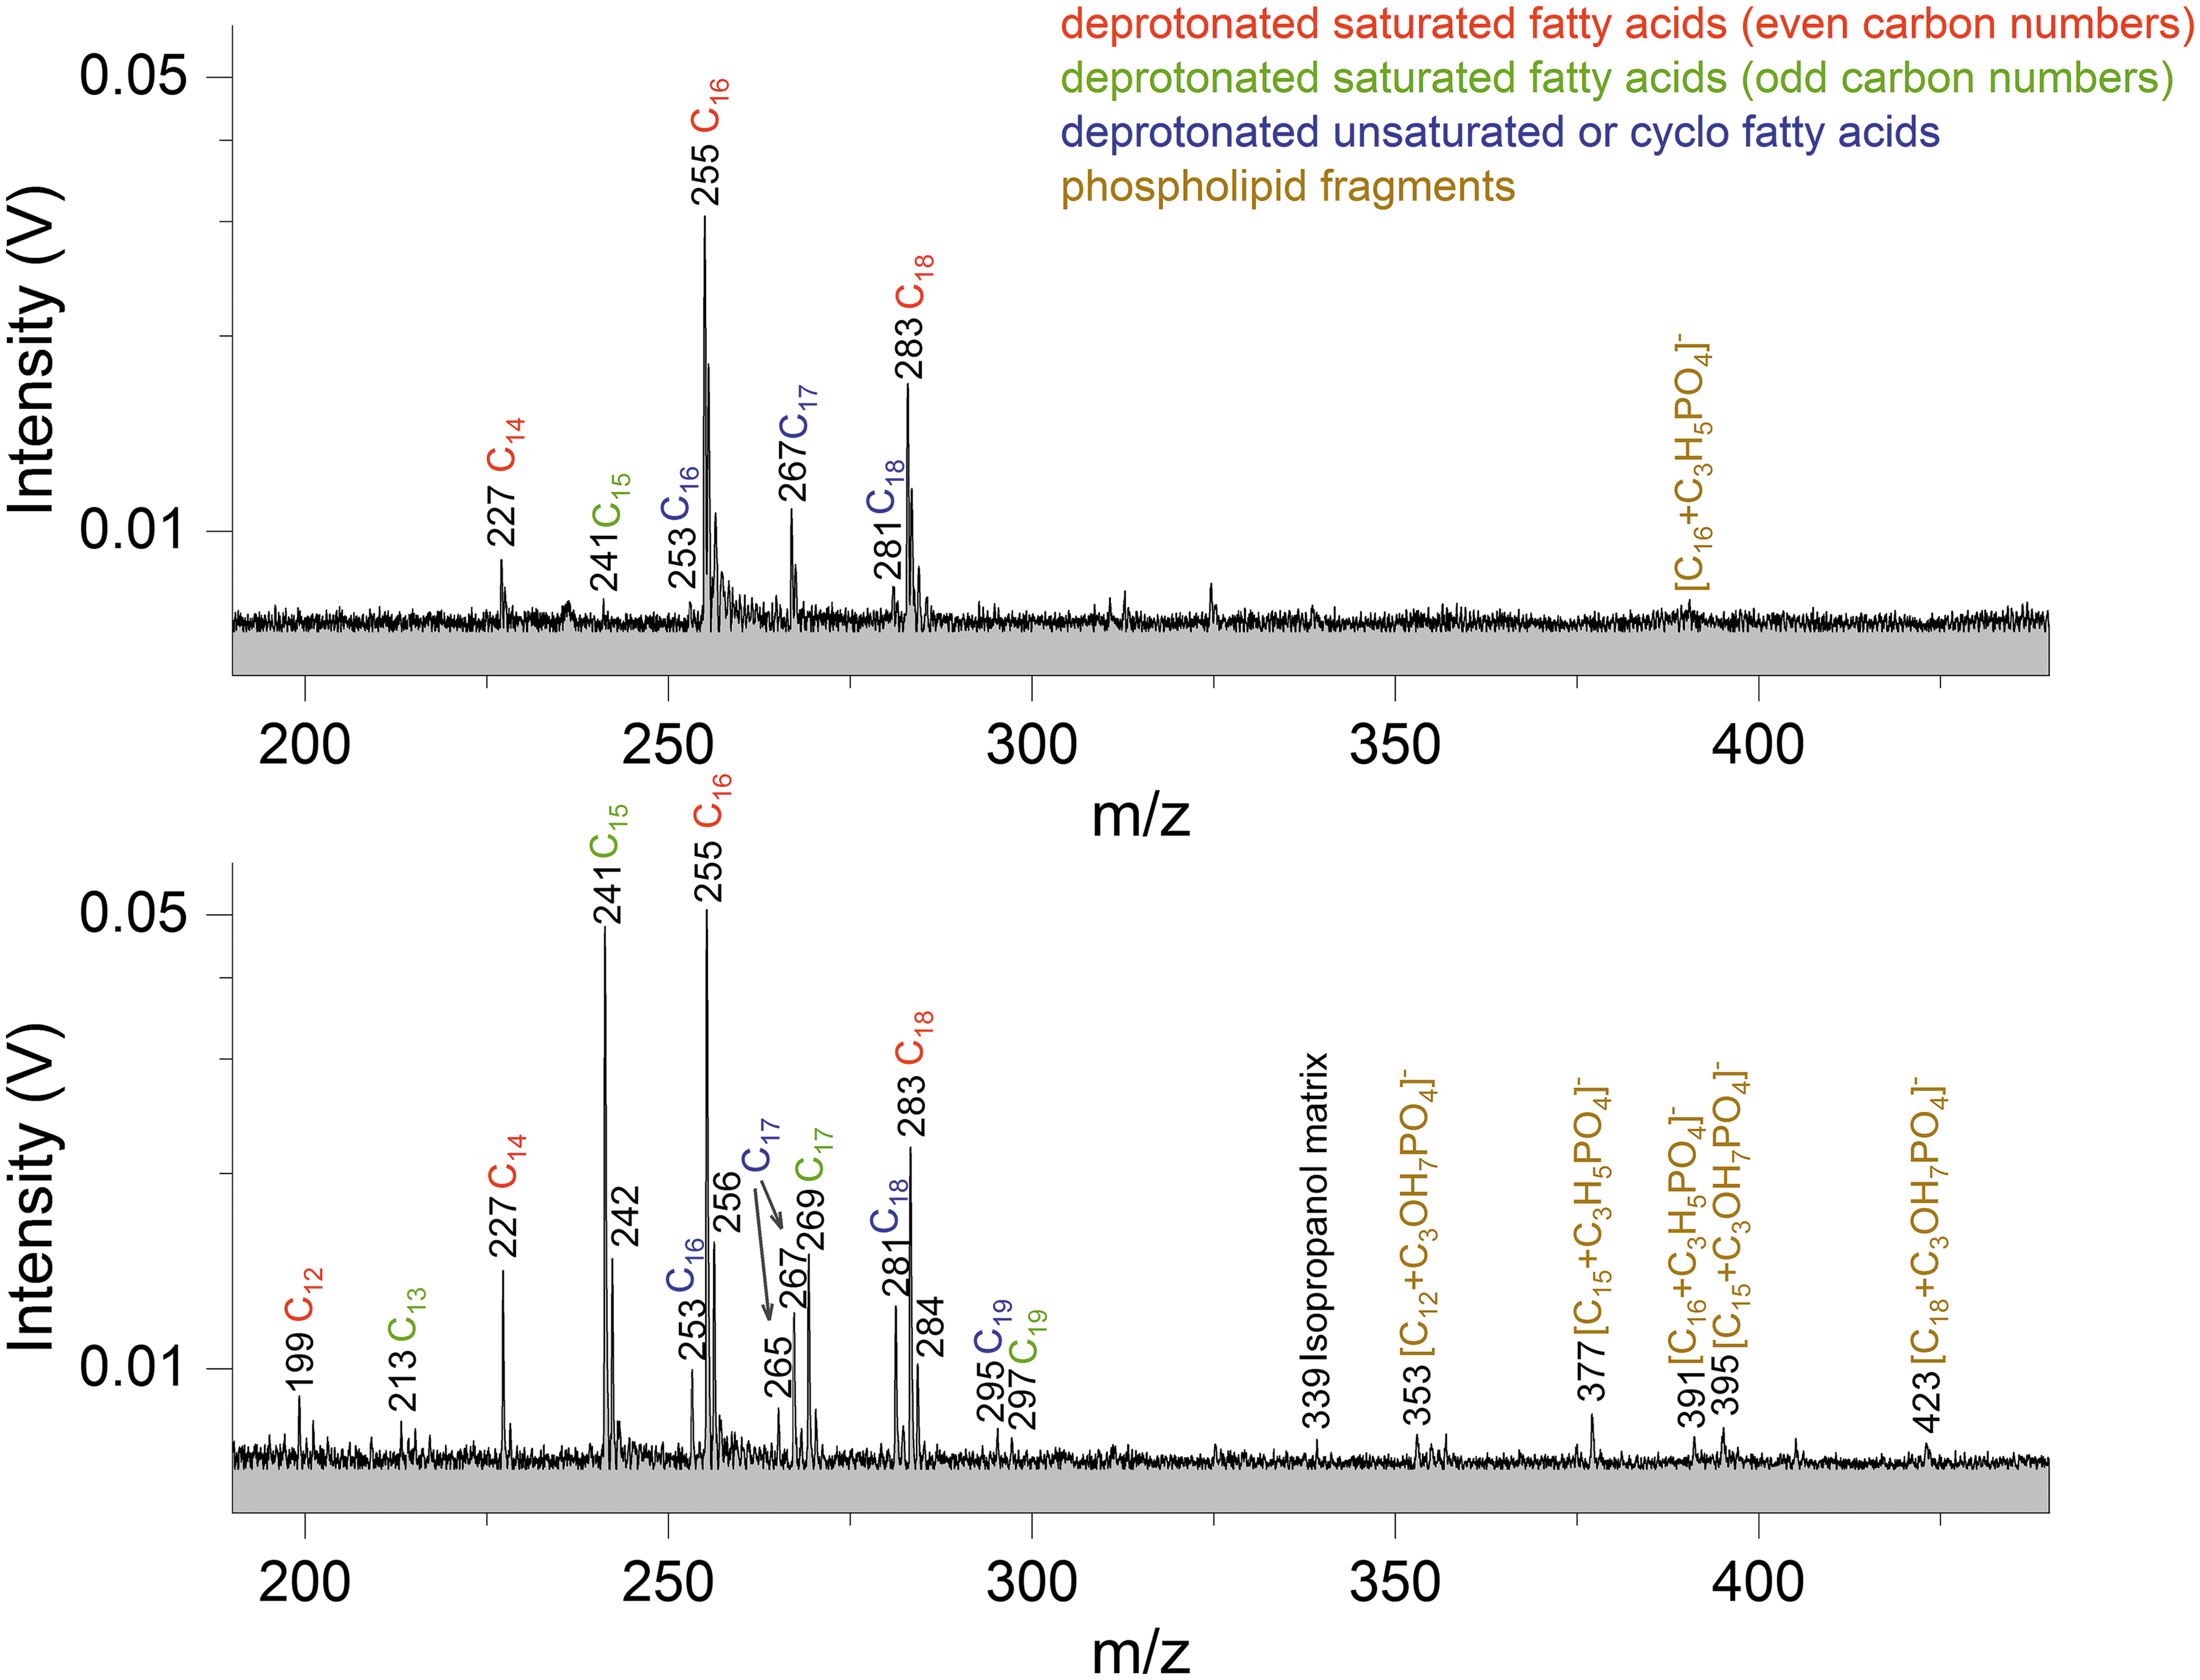
Sections (m/z 190–440) of two baseline corrected anion mass spectra (y-axis in logarithmic scale) of lipids extracted from ∼109 E. coli cells (top panel) and ∼109 S. alaskensis cells (bottom panel), respectively. Because of their poor water solubilities, the lipids were dissolved in 30 mL water:isopropanol (1:2 vol; solution type iii). Peaks of deprotonated fatty acids as well as phospholipid fragments are observable, with saturated C16 and C18 showing the most prominent peaks for E. coli and saturated C15, C16, and C18 being the most abundant species for S. alaskensis. Mass spectra of E. coli lipids and S. alaskensis lipids were recorded at delay times of 8.0 and 8.5 μs and laser intensities of 96.9% and 97.3%, respectively.
Deprotonated n-hexadecanoic acid (saturated C16 at m/z 255) and n-octadecanoic acid (saturated C18 at m/z 283) molecules produce the strongest signals from E. coli lipids, while deprotonated n-pentadecanoic acid (saturated C15 at m/z 241), n-hexadecanoic acid, and n-octadecanoic acid molecules form the strongest peaks from S. alaskensis lipids. With our setup, we cannot distinguish between the unbranched and mono-methyl-branched fatty acids, as they have the same molecular mass. Thus, the fatty acids might also be present in their iso- or anteiso-methyl-branched form. However, we note that unbranched fatty acids have been found to be more abundant in E. coli and S. alaskensis than branched fatty acids and are, thus, more likely to represent the peaks in the spectra (e.g., Mejía et al. 1999; Kim et al. 2005; Choi et al., 2010). More saturated than unsaturated fatty acids can be observed from lipids of both bacterial species. Unsaturated fatty acids appear always together with the respective saturated fatty acids of the same number of carbon atoms, except saturated cyclo C17 at m/z 267 from E. coli lipids (Fig. 4, top panel). This peak derives from 9,10-methylenehexadecanoic acid, which is particularly characteristic of E. coli membrane lipids (e.g., Oursel et al., 2007). Fatty acid dimers were not observed.
In the anion spectrum of S. alaskensis lipids, phosphatidylglycerol (PG) lipid fragments originating from the loss of one of its two fatty acids can be observed (Fig. 4, bottom panel). The fragments derive either from the loss of one fatty acid acyl chain as ketene (RCH = C = O) and glycerol—m/z 353, m/z 395, and m/z 423 with the fragmented head group binding saturated C12, C15, and C18, respectively—or neutral loss of one fatty acid acyl chain, its carboxyl group and glycerol from the lipid molecule resulting in peaks at m/z 377 and 391 from saturated C15 or C16, respectively, binding to the head group derived phosphate compound.
To account for a low-intermediate salt concentration as might be expected in the organic layer on top of Enceladus' ocean from physical disruption, for example, via bubbles bursting, we added increasing concentrations of NaCl to the lipid samples. While peak amplitudes from all deprotonated fatty acids and phospholipid fragments decrease with increasing salt concentration, those of the strongest signals (m/z 255 and 283 from E. coli lipids and m/z 241, 255, and 283 from S. alaskensis lipids) are still clearly detectable when a NaCl concentration of 10−3 M is present.
3.3. Hydrophilic cell compounds
The samples containing hydrophilic cell compounds were measured without further dilution (solution type iv). In the resulting mass spectra (Figs. 5 and 6), matrix peaks from water and methanol are observable. Cation and anion spectra of methanol:water (1:1 v:v) can be found in Fig. S3. Sodium and potassium cations as well as chlorine anions from the cell's cytosol form prominent peaks in the mass spectra. A variety of metabolic intermediates, in particular amino acids, can be identified in the cation mode. Nucleobases (DNA fragments) and metabolic intermediates prevail in the anion mode.
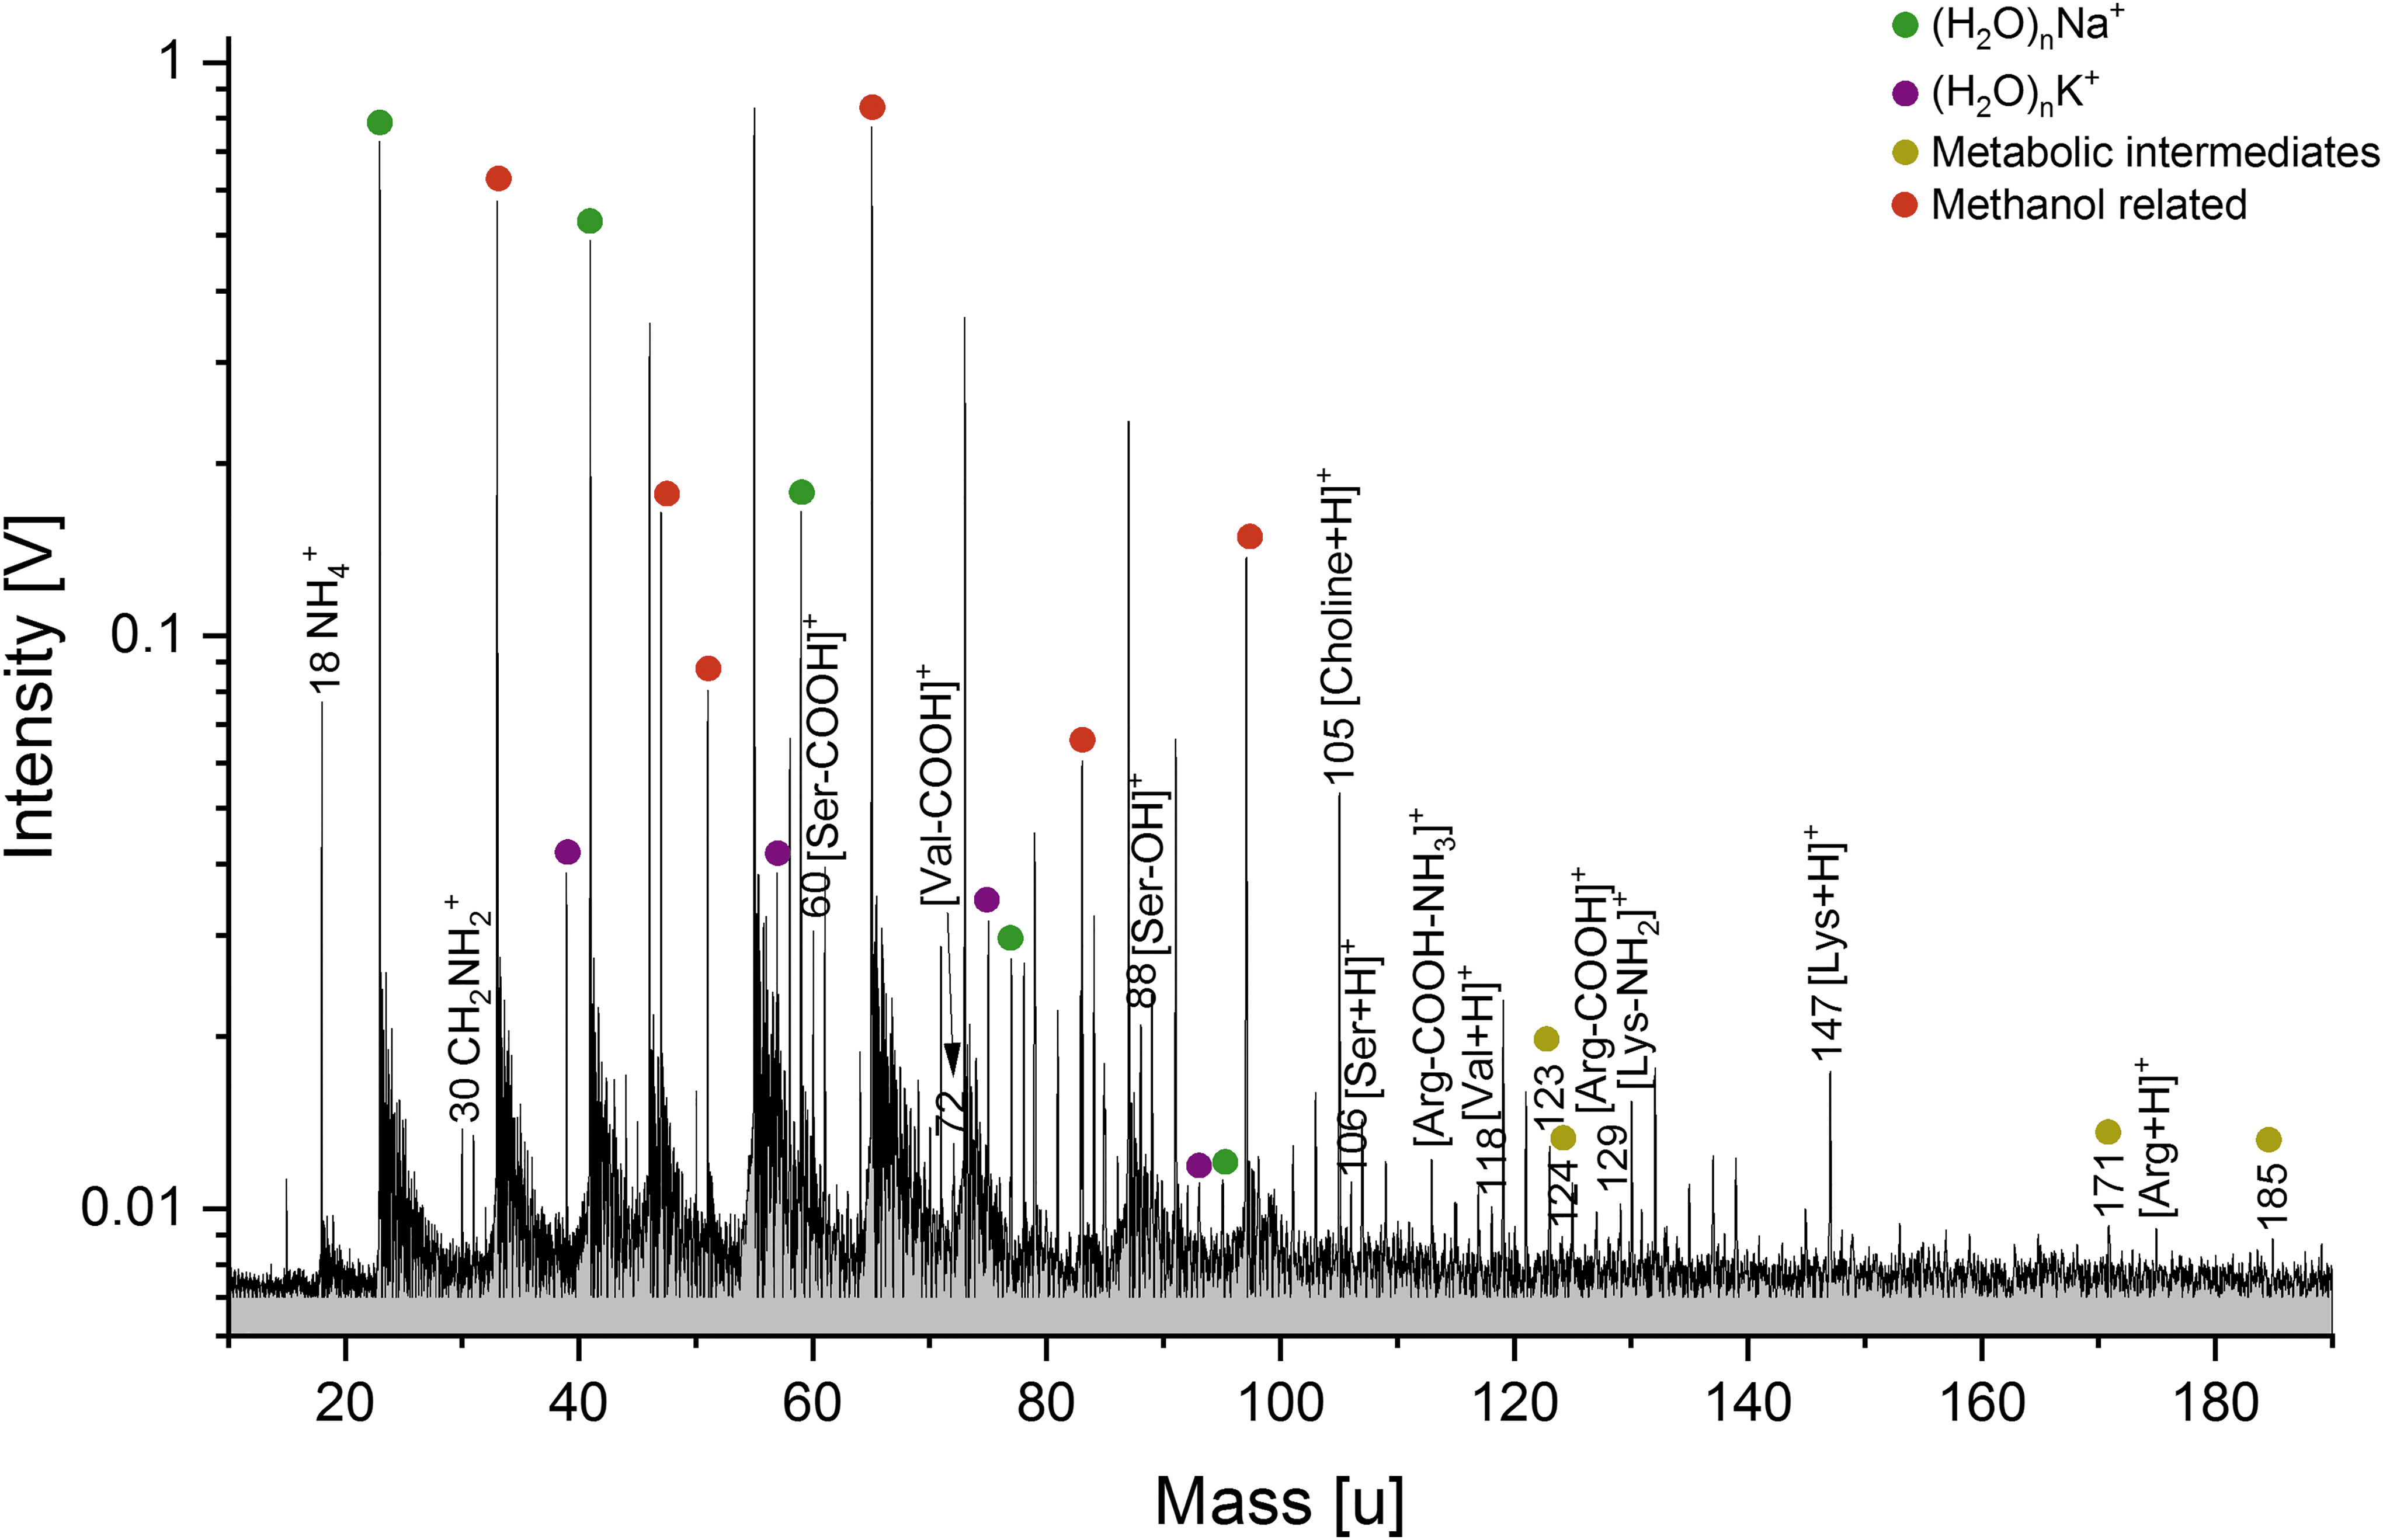
Baseline corrected cation mass spectrum (y-axis in logarithmic scale) of the hydrophilic cell compound from ∼109 S. alaskensis cells, derived from the lipid extraction procedure (solution type iv). Amino acids as well as metabolites from the S. alaskensis cells are clearly detectable. The mass spectrum was recorded at a delay time of 6.2 μs and a laser intensity of 96.9%.
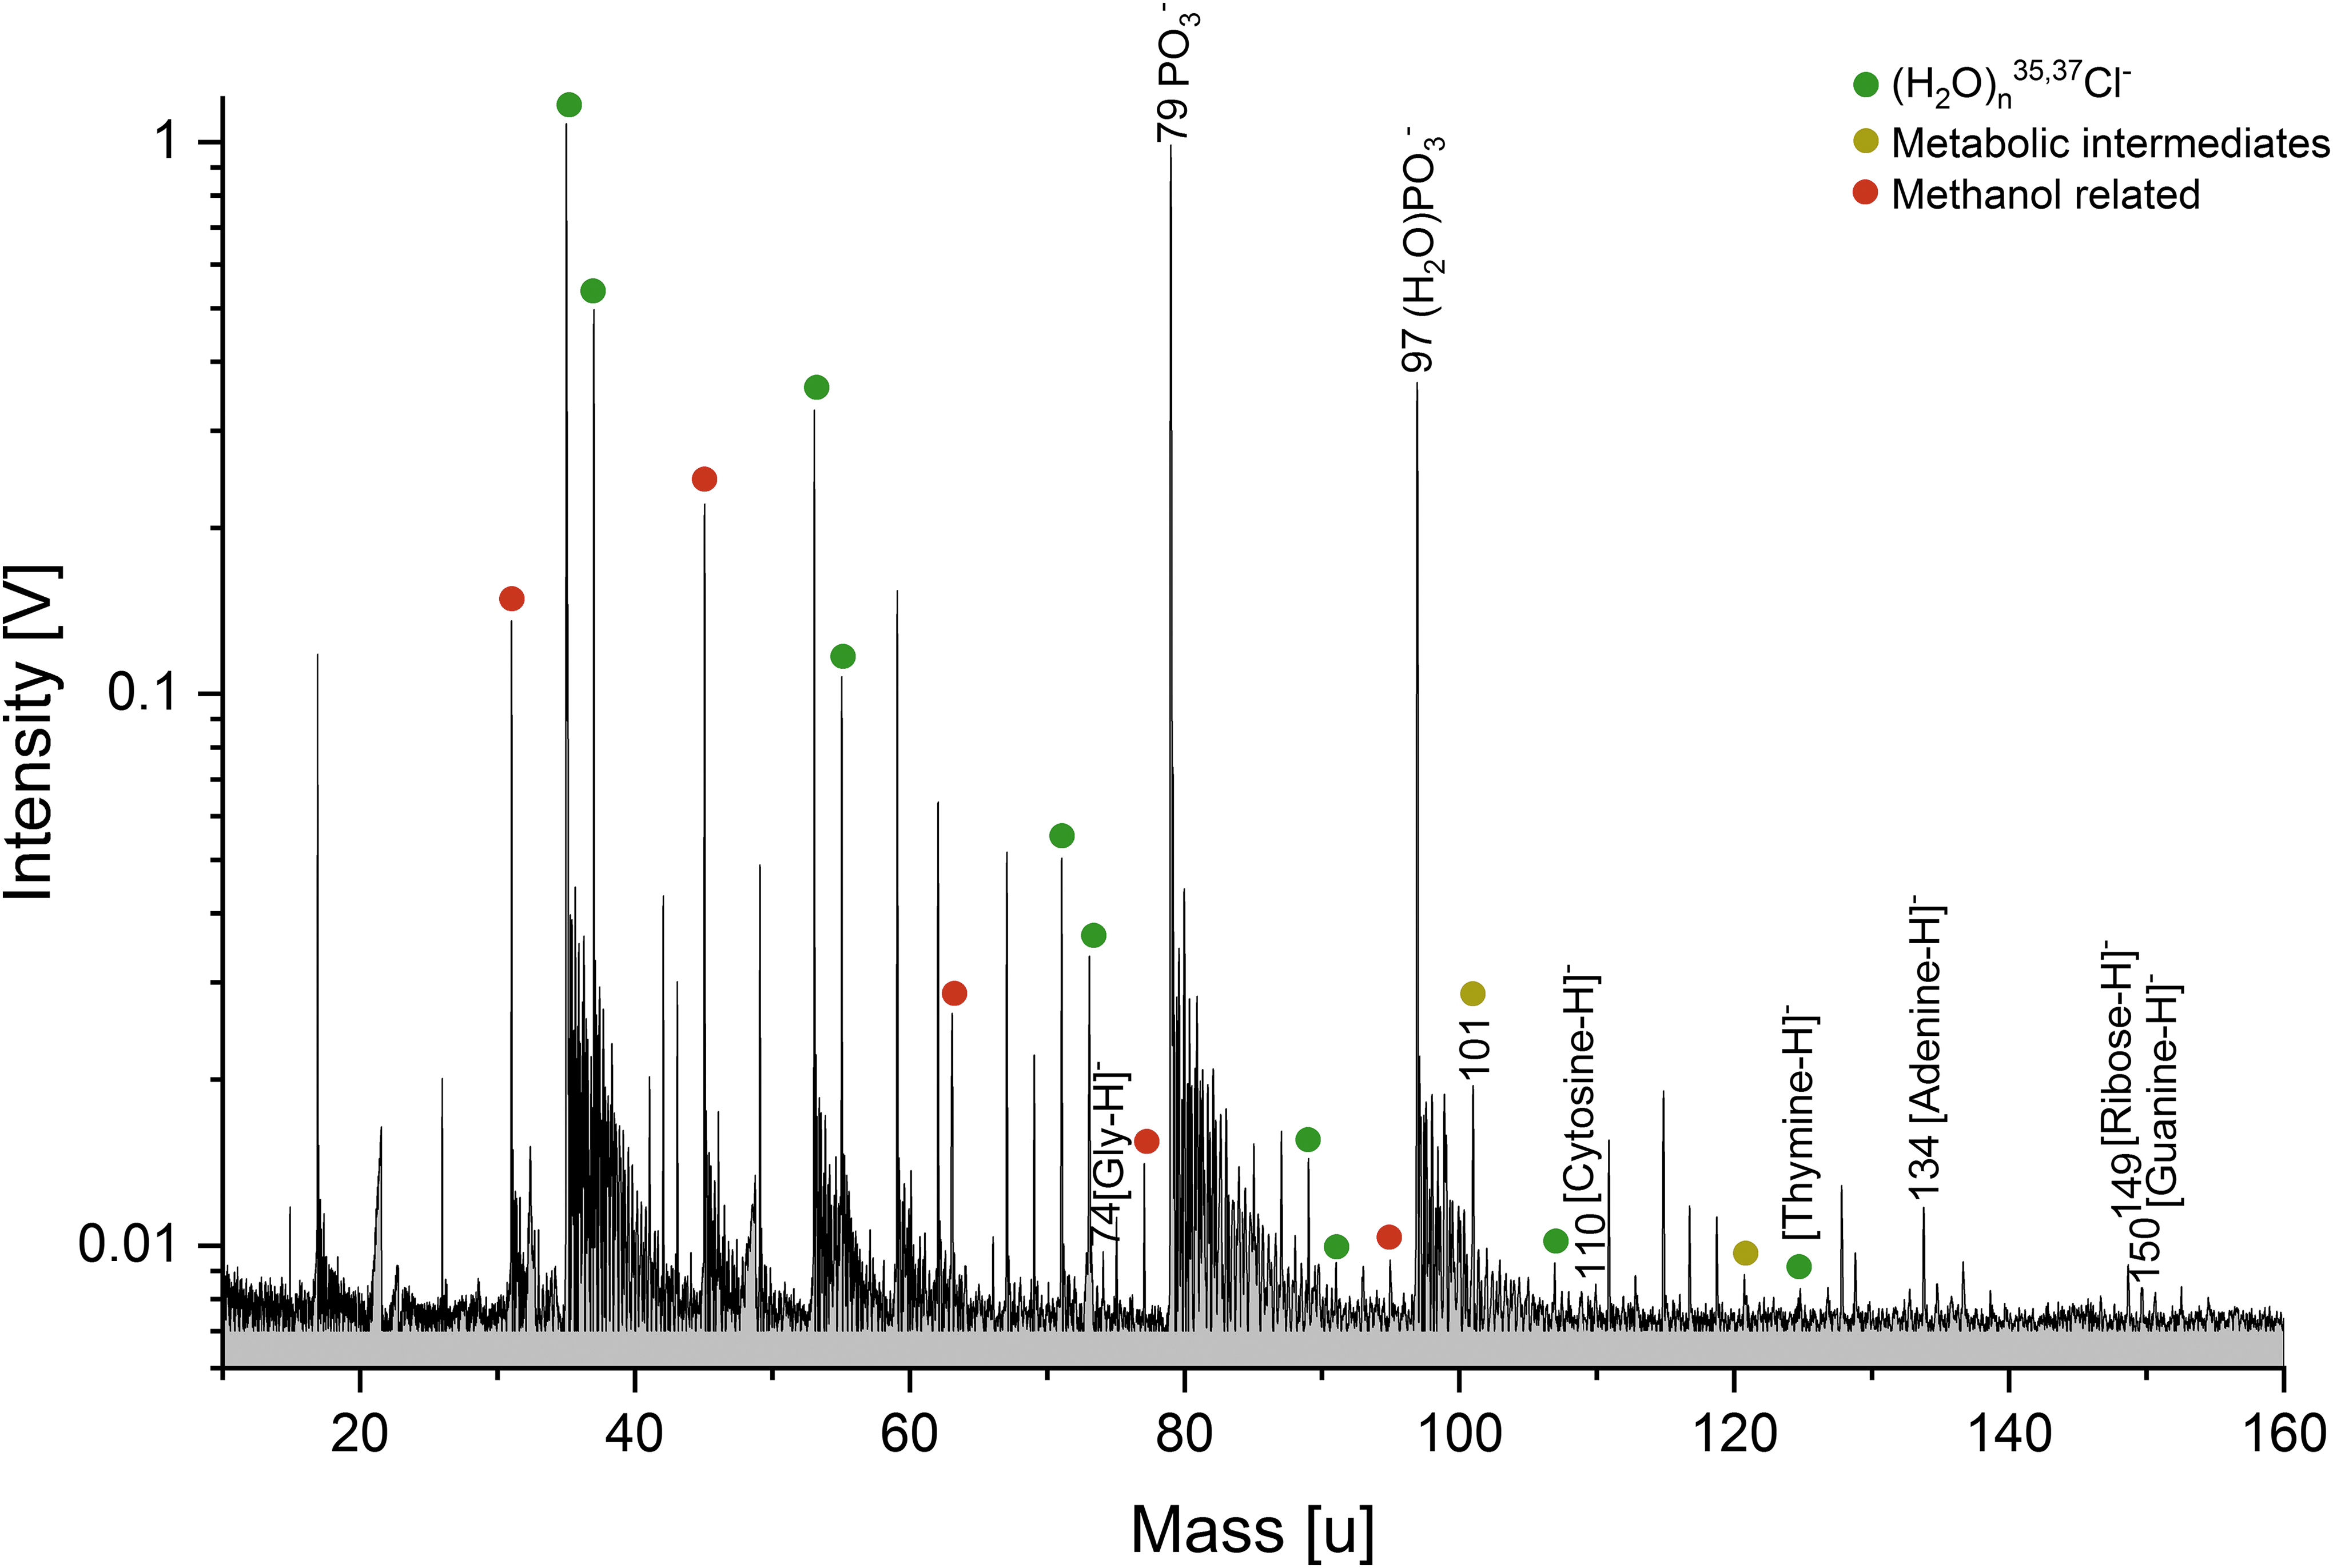
Section (m/z 10–160) of a baseline corrected anion mass spectrum (y-axis in logarithmic scale) of the hydrophilic cell compounds from ∼109 E. coli cells, derived from the lipid extraction procedure (solution type iv). Nucleobases (DNA fragments) as well as metabolites from the E. coli cells are clearly detectable. The mass spectrum was recorded at a delay time of 5.6 μs and a laser intensity of 96.2%.
The following amino acids can be assigned to their respective protonated peaks in the cation spectrum of the S. alaskensis hydrophilic compounds (Fig. 5): serine (m/z 106), valine (m/z 118), lysine (m/z 147), and arginine (m/z 175). Alanine (m/z 90), serine, valine, threonine (m/z 120), and asparagine (m/z 133) can be identified in the cation spectrum of the E. coli hydrophilic compounds (Fig. S4). Fragments of these amino acids resulting from the loss of their carboxyl group (-COOH), as well as their hydroxyl (-OH) or amine (-NH2) group, could be detected. The peaks at m/z 18 (NH4 +) and m/z 30 (CH2NH2 +) strongly indicate the presence of nitrogen-bearing compounds (e.g., Khawaja et al., 2019) and likely signify smaller amino acid fragments (Klenner et al., 2020a).
In cation mass spectra of the hydrophilic cell compounds of both bacteria (Figs. 5, S4, and S6), protonated metabolic intermediates of glycolysis and the synthesis of serine can be identified, namely, glyceraldehyde-3-phosphate (C3H7O6P+), phosphohydroxypyruvic acid (C3H6O7P+) at m/z 171, 185. Protonated 3-phosphoglycerate (C3H7O7P+) is detectable in the E. coli hydrophilic compounds at m/z 187. Protonated nicotinamide and nicotinic acid, two other metabolic intermediates known to be present within bacterial cells (Careri et al., 1996), can be identified at m/z 123 and 124, respectively, in hydrophilic compound spectra of both bacterial cultures. While these mass lines exhibit lower amplitudes than most of the amino acid derived species, a peak at m/z 105 is much stronger and can be assigned to the cell constituent choline (Figs. 5 and S4). The E. coli hydrophilic compound spectrum shows the metabolic intermediate L-cysteine sulfinic acid (Leinweber and Monty, 1962) at m/z 154.
In the anion mode (Figs. 6 and S5), the most prominent peak can be observed at m/z 79, assigned to [PO3]-. This anion, together with deprotonated ribose at m/z 149, could be remnants of the DNA's sugar-phosphate backbone. At lower amplitudes, deprotonated nucleobases, fragments of the DNA molecule, can be identified (Fig. 6): adenine (m/z 134), guanine (m/z 150), and cytosine (m/z 110). As in the mass spectra of DNA, the fourth deprotonated nucleobase thymine interferes with a chlorine-water cluster peak from the matrix (H2O)5Cl- and thus can only be tentatively assigned to m/z 125. Deprotonated glycine (m/z 74) as well as deprotonated nicotinamide (m/z 121) and deprotonated cadaverine (m/z 101), an intermediate of bacterial L-lysine catabolism (Ma et al., 2015), are also observable. Deprotonated glutamic acid (m/z 146) can be identified in the S. alaskensis hydrophilic compound spectrum (Fig. S5).
In cation and anion spectra of the hydrophilic cell compounds measured in matrices with increasing NaCl concentrations (solution type v), an increasing abundance of Na+ or Cl- related peaks, respectively, can be observed while peak amplitudes of protonated/deprotonated nucleobases, amino acids, or metabolic intermediates decrease (Fig. S6).
In high salinity (≥10−2 M NaCl) solutions, amino acids are expected to form sodiated molecules rather than protonated molecules (Klenner et al., 2020b). Indeed, in cation mass spectra of the E. coli hydrophilic compounds, sodiated serine and trisodiated asparagine can be assigned to m/z 128 and 199, respectively, as shown in Fig. S6. Deoxyribose can be identified as disodiated and trisodiated molecule at m/z 179 and 201, respectively. Sodiated nucleobases could not be identified. In anion mass spectra, [PO3]-, forming the most prominent peak in spectra of solution type iv, can still be identified, even if 10−1 M NaCl is added to the samples.
4. Discussion
In the present study, we investigated the mass spectral appearances of bioessential molecules, namely, DNA, lipids, and metabolic intermediates, extracted from two different bacteria, at impact speeds equivalent to those of ice grains ejected from an ocean-bearing icy moon and sampled in a spacecraft flyby. Characteristics of all investigated biosignatures are clearly detectable in the resulting mass spectra obtained from the analog experiments. Any detection of these biosignature spectral signals would be a strong indication for organisms similar to terrestrial life on an extraterrestrial world.
Numerical modeling of biogenic material and cells in the Enceladan vents, the moon's plume, and its water-ice interface estimate cell densities at different locations in the subsurface ocean. Estimates of the expected cell densities in the plume, vents, and bulk ocean water were summarized by Cable et al. (2021, Table 1). According to Steel et al. (2017), ∼109 cells cm−3 may accumulate in the vents and ∼108 cells cm−3 in the plume, whereas Porco et al. (2017) estimated up to 107 cells mL−1 in the plume. The cell density at the ice-ocean interface was estimated at 105 to 108 cells mL−1 by Russell et al. (2017). In the bulk ocean water, cells will be diluted; estimates range from 0.026–0.18 cells cm−3 (Ray et al., 2021) to 80–4250 cells cm−3 biomass potentially produced by methanogens (Steel et al., 2017). However, the estimated density values might increase by later enrichment as diluted water is transported to the surface in the case of an organic film on top of the oceanic water table (Postberg et al., 2018a), where cell components decompose over time. Bursting gas bubbles at the water table efficiently enrich concentrations of organics in ice grains. This phenomenon is well observed in Earth's oceans and increases organic concentrations by 2–3 orders of magnitude (Russell et al., 2010; Burrows et al., 2014). This work focuses on the characterization of biosignatures in mass spectra rather than the determination of their detection limits. However, the used cell densities in our experiments (∼109 cells mL−1), although at the upper end of the estimates, still represent a plausible scenario for the Enceladan vent environment.
4.1. Deoxyribonucleic acid (DNA)
In positive and negative ion mode mass spectra of E. coli and S. alaskensis DNA, mass peaks of fragments deriving from both the nucleobases and the phosphate-deoxyribose compounds could clearly be identified (Figs. 2 and 3).
Adenine, and guanine nucleobase molecules, as well as fragments resulting from the loss of ammonia, can be assigned to their respective mass peaks in both ion modes, whereas the molecular peak of cytosine can only be identified in the positive ion mode. The potential molecular peak of thymine overlaps (mass difference <0.007 u) with a water cluster peak at m/z 127 and m/z 125 in positive and negative ion mode, respectively, and cannot be resolved with the available mass resolution of the experimental setup (600–800 m/Δm). Its presence in the LILBID mass spectra, however, can be inferred indirectly, by the detection of its fragment [Thymine-CH3] at m/z 111. Due to the ambiguity of the thymine molecular peak and the sensitivity variations of our setup that result in nucleobase peaks with different intensities, the equal ratio of adenine to thymine and guanine to cytosine cannot be clearly identified as a potential biosignature in the mass spectra of the water ice grains. We instead find that our setup is particularly sensitive to purine bases (adenine and guanine) compared to pyrimidine bases. In the anion mode, we can easily detect the most characteristic DNA fragments (deprotonated nucleobases) at 1 ppmw (Fig. 3), and the detection limit probably lies below this concentration. In the cation mode, we infer that a concentration of ∼50 ppmw is sufficient to identify protonated nucleobases.
DNA is quite water soluble and thus might be expected not only in a salt-poor organic layer on top of an icy moon's ocean but also in the salt-rich bulk water phase. Although the salinity of Enceladus' subsurface ocean is expected to decrease the sensitivity of the impact ionization mass spectrometer to the mass spectral signals of DNA enclosed in salt-rich ice grains (Annesley, 2003; Piwowar et al., 2009; Klenner et al., 2020b), our experiments with DNA in salt-rich matrices (solution ii) show that deprotonated nucleobases, especially purines, can still be detected up to a NaCl concentration of 0.01 M (Fig. 2). While an alien biochemistry might utilize a different set of nucleobases, this work demonstrates the ability of impact-induced ionization mass spectrometry to detect this class of biosignature molecules in ocean world–relevant conditions.
4.2. Lipids
The surface microlayer at the water-atmosphere interface of terrestrial oceans contains microorganisms at high cell densities, as well as various hydrophobic compounds produced by the bacteria (Hardy, 1982; Franklin et al., 2005). In Enceladus' subsurface ocean, hydrophobic compounds could partition into a tiny low-salinity organic layer on top of the water body as hypothesized by Postberg et al. (2018b). Thus, such compounds would probably enter the jets incorporated in salt-poor ice grains.
Both E. coli and S. alaskensis lipids as well as lipid fragments, such as fatty acids, were found to be clearly identifiable in anion mass spectra (Fig. 4). In the E. coli lipid spectra, the ratio of odd to even carbon number fatty acids (C14–C20) matches the spectral appearance of biotically produced fatty acid abundances predicted by Klenner et al. (2020b). Even carbon number fatty acids produce higher peak amplitudes compared to odd carbon number fatty acids, with C16 and C18 being most abundant. In S. alaskensis lipid spectra, similar abundances can be observed, with C15 in addition to C16 and C18 being most abundant.
The observed lipid patterns in this work display differences to the fatty acids abundances expected from previously published literature. We observe a relatively high abundance of saturated fatty acids over the unsaturated fatty acid of the same carbon atom number (Fig. 4). While C16 and C18 are indeed expected to be major in E. coli strain W3110, Mejía et al. (1999) observed unsaturated C16 and C18 to be more abundant relative to saturated C16 and C18. Similarly for S. alaskensis, Kim et al. (2005) and Choi et al. (2010) reported a higher relative abundance of unsaturated C18 over saturated C18. Additionally, the peak deriving from unsaturated C17 is expected to be major in S. alaskensis, while saturated C15 and C16 are usually less pronounced. At this point, we are unable to pinpoint the origin of the mismatches of our data with previously published literature. However, measuring a mixture of saturated along with unsaturated fatty acids at equimolar concentrations shows that relative abundances of fatty acids, independent of the degree of saturation, are accurately reflected in the acids' deprotonated molecular peaks in LILBID spectra (Fig. S7).
In the subsurface ocean of Enceladus, lipids deriving from the decay of the potential microorganisms and other hydrophobic molecules could reside in the surface biofilm and could be detected in the ice grains upon entering the plume by SUDA- or ENIA-type instruments. In the biofilm, the lipids may be exposed to low or intermediate salt concentrations (Postberg et al., 2018a). Spectra recorded of lipids in 10−3 M sodium chloride solutions show that the strongest fatty acid peaks are still clearly detectable (data not shown). This is consistent with the results from Klenner et al. (2020b), who found fatty acids at intermediate salt concentrations to be detectable down to the part-per-million level. Fatty acids were also found by Klenner et al. (2020b) to form sodiated dimers in saltwater matrices, at intermediate salt concentrations. As with nucleobases, an alien biochemistry might utilize different lipid carbon chain lengths, but this work demonstrates that the most prevalent molecules of this biomolecular class could be identified with impact-induced ionization mass spectrometry.
4.3. Hydrophilic cell compounds
With the diversity of chemical compounds, the potential formation of charged molecules or fragments that might interfere with each other in the mass spectra increases. Thus, in addition to the characterization of the mass spectral signals of single biosignatures (DNA, lipids), their identification within more complex mixtures, such as the hydrophilic cell compounds (from ∼109 bacterial cells) analyzed in this work, is particularly relevant and represents a more realistic case for space missions to ocean moons.
In anion mass spectra of E. coli and S. alaskensis hydrophilic cell components, we clearly identify DNA-derived biosignatures, such as nucleobases, fragments thereof and phosphate moieties (Figs. 6 and S5). Distinct signals of amino acids can be identified in the cation mode spectra (Figs. 5, S4, and S6). Klenner et al. (2020a, 2020b) inferred amino acid detection limits in salt-poor and salt-rich solutions to be at the part-per-million or part-per-billion level. The identification of amino acids and their relative abundances are promising approaches in the detection of biosignatures in icy moon environments (Davila and McKay, 2014; Klenner et al., 2020b). Amino acids have been proposed to decompose in hydrothermally active oceans at relatively short geologic time scales (<1 Myr, Truong et al., 2019). Thus, a detection of free amino acids even at the part-per-billion level in Enceladus' subsurface ocean today would indicate them being recently produced and not relicts of primordial synthesis. Further, metabolic intermediates of glycolysis and other metabolic pathways could be assigned in both ion modes. Additionally, the intracellular sodium, potassium, and chloride ions (Schultz et al., 1961, 1962) produced characteristic peaks in the mass spectra, though these ions would be difficult to identify as cell-sourced in salt-rich ice grain mass spectra.
Positive ion mode spectra recorded with E. coli hydrophilic cell components in NaCl matrices with rising concentrations (solution v) show the formation of sodium-complexed adducts such as mono- and trisodiated amino acids, whereas chlorinated ions in the negative ion mode spectra are not observed. Thus, our results are in accordance with the findings of Klenner et al. (2020b), which is that amino acids are more easily detected in the cation mode and tend to form sodiated cations in NaCl solutions. The biosignatures are detectable in salt-rich background solutions up to 10−2 M NaCl, and [PO3]- can even be detected in anion mass spectra when 10−1 M NaCl is present. Here we show that characteristic biosignature molecules can still be identified in impact ionization mass spectra of ice grains that contain complex mixtures, including many hydrophilic cell compounds.
4.4. Comparison of biosignatures from E. coli and S. alaskensis
Both E. coli and S. alaskensis have their own respective importance to our experiments. While the potential presence of E. coli–like mesophilic bacteria in the Enceladan subsurface environment is questionable, as they are very rare in unpolluted marine environments on Earth and susceptible to temperature fluctuations (Bonde, 1967; van Elsas et al., 2011), experiments conducted with such a highly researched model organism form a promising basis for further experiments and substantiate data interpretation with a wide range of publications (Cronan, 2014; Blount, 2015). Escherichia coli bacteria have even recently been used in experiments that simulated the effect of ejection into space, as occurs from Enceladus' plume, as a reference for future research (Bywaters et al., 2020). Psychrophilic bacteria, such as S. alaskensis, are more likely to survive in the conditions of the icy moon environment due to their adaptation abilities to cold temperatures. As heterotrophs, both bacteria would require a structured ecosystem, including autotrophs capable of carbon fixation, to provide organic carbon.
The identification of characteristic differences in the mass spectral appearance of biosignatures from E. coli and S. alaskensis helps determine the sensitivity of the analog experiments to species-specific characteristics, potentially linked to adaptations to their mesophilic (E. coli) and psychrophilic (S. alaskensis) lifestyles. We were able to clearly identify such differences in the mass spectra resulting from E. coli and S. alaskensis lipids and hydrophilic cell compounds. The DNA mass spectra of both bacteria show the same characteristic biosignatures due to the fact that we mainly identify the common DNA building blocks that unite terrestrial life.
A prominent distinction in the lipid abundances of the two bacteria is the high amplitude of the C15 peak in S. alaskensis lipid spectra at m/z 141. We also observe a common adaptation of psychrophilic microorganisms to cold temperatures: an increase in the ratio of (poly)unsaturated to saturated fatty acids in the membrane lipids (van Dooremalen and Ellers, 2010), that is, a higher amount of unsaturated fatty acids within the bacterial lipids as a mechanisms to maintain membrane fluidity. We can clearly identify such a difference between mass spectra of S. alaskensis and E. coli lipids (Fig. 4). In the S. alaskensis lipid spectra, we identified not only a higher amount, but also more diverse, unsaturated fatty acids. Analogous to S. alaskensis, potential psychrophilic bacteria located in the upper layers of an Enceladan subsurface ocean might have membranes composed of similar fatty acid ratios which would reside in the surface biofilm from where they could enter the plume.
In mass spectra of the hydrophilic cell compounds, the amino acid abundances are especially of interest for the distinction of the two bacteria, as the substitution of certain amino acids in proteins presents another common adaptation of bacteria to changes in environmental conditions. Recent findings suggest that specific amino acids prevail in cell cultures of Colwellia psychrerythraea, a psychrophilic bacterium, depending on the growth temperature and medium salinity, tested as independent factors and in combination (Mudge et al., 2021). Cultures grown at lower, subzero temperatures showed a significant enrichment in glutamic acid and valine and a depletion of aspartic acid and threonine, whereas samples grown under salt-rich conditions were enriched in alanine and, again, reduced in aspartic acid. In accordance with the temperature gradient experiments, we do identify threonine only in mass spectra of the hydrophilic cell compounds of mesophilic E. coli cell cultures and not in the psychrophilic S. alaskensis (Figs. S4 and 5), while we identify glutamic acid from S. alaskensis cultures but not from E. coli cultures (Figs. 6 and S5). In our experiments, S. alaskensis was grown at 29°C; thus these features cannot be related to active cold adaptation but presumably integral characteristics of the psychrophilic bacterium. Such temperature- and salinity-dependent characteristics, for example, a depletion of aspartic acid with lower temperature and higher salinity, help in identifying what to expect from mass spectral signals of potential microorganisms grown under the conditions of Enceladus' and Europa's subsurface oceans. Thus, identifying the differences in characteristic mass spectral signals of the two bacteria is of great importance.
However, the similarities also bear valuable information as they pinpoint characteristics that are common in bacterial life. In DNA spectra of both bacteria, we identify the same universal building blocks, the nucleobases and fragments of the deoxyribose-phosphate moieties (Figs. 2 and 3). Additionally, we were able to detect characteristics of universal metabolic pathways, intermediates of glycolysis and serine synthesis, in cation spectra of the hydrophilic cell compounds of both bacteria. While an alien life form might utilize different biochemistry, the efficacy of impact ionization mass spectrometry in identifying these patterns illustrates the capability of this technique to test ocean world environments for biosignature molecules characteristic of terrestrial life.
5. Conclusions and Outlook
The ability of the LILBID technique to accurately simulate mass spectra of chemical compounds enclosed in water ice grains and detected by impact ionization mass spectrometers on board future space missions was applied to predict characteristic mass spectral signals of bacterial cell components, namely DNA, lipids, and metabolic intermediates. Mass spectral characteristics of these molecules could be clearly identified in flight mass spectra even if the biosignatures were encased in ice grains with significant amounts of salts. Two different bacterial species presented unique biosignature fingerprints, indicating that this technique might also distinguish between different types of microorganisms, although further work is needed. The impact ionization process in space, simulated in the LILBID setup, would create charged molecules or fragments from these biogenic substances that could be unambiguously detected by SUDA- or ENIA-type mass spectrometers on future space probes.
From our experimental results, we can infer recommendations for future space probes that will sample the ice grains ejected from icy moons, in terms of both sensitivity of the onboard mass spectrometer and the impact speed of the ice grains onto its metal target. The investigations in this work demonstrate, together with previous results (Klenner et al., 2020a, 2020b), that mass spectral analysis in both anion and cation mode is needed to detect the complete range of biosignatures investigated in our experiments; metabolic intermediates, while detectable in both ion modes, show a higher sensibility to cation mode detection, while DNA is preferentially, and lipids exclusively, detected in anion mode. In their respective optimal ion mode, all investigated biosignatures are detectable down to the part-per-million level, and some of them clearly below. Due to more efficient ion detectors, detection limits of space instruments are expected to be improved by one to two orders of magnitude compared to our laboratory setup.
Combinations of delay times and laser intensities can be correlated to different impact speeds of ice grains onto metal targets of SUDA-like detectors in space (Klenner et al., 2019). Thus, with the settings used in our analog experiments, we can recommend optimal encounter velocities that result in the most distinguished peaks of the investigated molecules in the mass spectra. LILBID experiments by Klenner et al. (2020a, 2020b), as well as computer simulations by Jaramillo-Botero et al. (2021), suggest optimal encounter velocity ranges of 4–6 km/s for amino acids and fatty acids. From our experiments, we infer optimal encounter velocities of 4–8 km/s for DNA, 3–6 km/s for lipids, and 4–7 km/s for metabolic intermediates, respectively. Thus, in accordance with Klenner et al. (2020a, 2020b) and Jaramillo-Botero et al. (2021), we derive at the same recommended velocity window of 4–6 km/s for the optimal detection of all investigated biosignatures, which is in the range of the expected flyby speeds of the Europa Clipper spacecraft (typically 4–5 km/s). However, it should be noted that slightly higher impact speeds—in the order of 7–10 km/s—might be useful to complement spectra recorded at lower speeds to provoke a more abundant creation of characteristic fragments, albeit on the cost of lower signals from parent molecules.
In the future, we will perform experiments to determine to what extent characteristic biosignatures of whole cells—without any preceding extraction method—can be identified in impact ionization mass spectra. Additionally, we plan to determine which mass spectral characteristics of other metabolisms or mechanisms that might enable survival under the conditions of the Enceladan or Europan subsurface ocean, for example, methanogenesis, chemoautotrophy, sulfate reduction, or a tolerance to radiation, can be detected in the analog experiments. In this context, we aim to investigate the effects of direct contact with oxidants and ionizing radiation on the preservation of different biosignatures. By extending the range of biosignatures from a number of different species exposed to different conditions, we aim to maximize the information that can be gained from future data recorded by SUDA-type mass spectrometers on space missions to ocean worlds.
Footnotes
Acknowledgments
Authors acknowledge the collaboration of the Planetary Sciences and Remote Sensing group at Freie Universität Berlin and the Leibniz Institute of Surface Engineering (IOM, Leipzig) in the framework of their joint Icy Micro Particles (IMP) laboratory. We thank Eberhard Klauck and Ben J. Lambeck (Freie Universität Berlin) for preparing some of the DNA samples, Andreas Elsäßer and David Burr (Freie Universität Berlin) for culturing E. coli cells as well as Alex Price (The Open University) for culturing S. alaskensis cells. We also thank Dr. Ales Charvat for help and assistance with the laser desorption MS setup. Intensive discussions on the lipid spectra with Geraint (Taff) Morgan (The Open University) are warmly acknowledged. Some of this work was conducted at the Jet Propulsion Laboratory, California Institute of Technology, under a contract with the National Aeronautics and Space Administration (80NM0018D0004). Reference herein to any specific commercial product, process, or service by trade name, trademark, manufacturer, or otherwise, does not constitute or imply its endorsement by the United States Government or the Jet Propulsion Laboratory, California Institute of Technology.
Author Disclosure Statement
No competing financial interests exist.
Funding Information
The research leading to these results received financial support from the European Research Council (ERC) under the European Union's Horizon 2020 research and innovation program (ERC Consolidator Grant 724908-Habitat OASIS).
Supplementary Material
Supplementary Information S1
Supplementary Figure S1
Supplementary Figure S2
Supplementary Figure S3
Supplementary Figure S4
Supplementary Figure S5
Supplementary Figure S6
Supplementary Figure S7
Abbreviations Used
Associate Editor: Don Cowan
References
Supplementary Material
Please find the following supplemental material available below.
For Open Access articles published under a Creative Commons License, all supplemental material carries the same license as the article it is associated with.
For non-Open Access articles published, all supplemental material carries a non-exclusive license, and permission requests for re-use of supplemental material or any part of supplemental material shall be sent directly to the copyright owner as specified in the copyright notice associated with the article.