
Abstract
The key building blocks for life on Mars could be preserved within potentially habitable paleo-depositional settings with their detection possible by utilizing mid-infrared spectroscopy; however, a definite identification and confirmation of organic or even biological origin will require the samples to be returned to Earth. In the present study, Fourier-transform infrared (FTIR) spectroscopic techniques were used to characterize both mineralogical and organic materials within Mars dust simulant JSC Mars-1 and ancient Antarctic cyanobacterial microbial mats from 1901 to 1904 Discovery Expedition. When FTIR spectroscopy is applied to cyanobacterial microbial mat communities, the resulting spectra will reflect the average biochemical composition of the mats rather than taxa-specific spectral patterns of the individual organisms and can thus be considered as a total chemical analysis of the mat colony. This study also highlights the potential difficulties in the detection of these communities on Mars and which spectral biosignatures will be most detectable within geological substrates. Through the creation and analysis of a suite of dried microbial mat material and Martian dust simulant mixtures, the spectral signatures and wavenumber positions of CHx aliphatic hydrocarbons and the C-O and O-H bands of polysaccharides remained detectable and may be detectable within sample mixtures obtained through Mars Sample Return activities.
Introduction
Some of the most important questions in astrobiology in understanding, in particular, whether Mars once had life depend on the accurate characterization of terrestrial and extraterrestrial mineralogical and biological samples. However, the reliability of any characterization and the deduction of environmental palaeo-reconstructions, be they Earth or Mars-based, is limited by the geological stability of any entombed organic molecules, the matrix in which they are hosted, the chemical and physical processes they are subjected to over geological time, and the analytical techniques available for their characterization. Therefore, to aid our interpretations of these complex remote and in situ planetary data sets, we have studied analogous terrestrial materials, both natural and experimental.
Organic molecules are found on Earth preserved within geological materials that formed as a consequence of abiotic and biotic processes, though distinguishing between the two isn’t always possible. These organic molecules may be found in, or be remnants of, living organisms, or they may simply be the chemical building blocks without which life is not possible. Either way, organic molecules can serve as a proxy for the identification of potentially habitable environments and act as a beacon for directing future astrobiological exploration and sample selection. However, the identification of these molecules is complicated by the geological materials they are associated with and the environmental conditions they are exposed to over time. The samples analyzed and collected are commonly a jumbled mixture of, for example, variably-sized grains of rocks and minerals, dust, and glass, which can mask the presence and transform the signatures of any organic species present, which are usually at only low levels. As such, vibrational spectroscopy techniques are used to enable extrapolation of multiple pieces of data from this range of geological materials, and a combination of visible and near-infrared spectroscopy (Vis–NIR) and mid-infrared (MIR) spectroscopic techniques is needed to allow for full characterization. Using the Vis–NIR region (commonly used in planetary missions, such as on NASA’s Curiosity and Perseverance rovers and the future Rosalind Franklin rover), we can discriminate, for example, different types of Fe and hydroxyl-bearing materials and have the potential to observe organic overtones and combination bands. Yet when combined with the MIR region, we can detect the fundamental vibrational modes of functional groups that include CO3 2-, SiO4, and SO4 2-, and a wide range of organic compounds and biomolecules (Naumann et al., 1991; Schmitt and Flemming, 1998; Igisu et al., 2009, Preston et al., 2014, 2015, 2019 and references therein). The in situ Vis–NIR instruments can select interesting targets for Mars Sample Return (MSR), and then Fourier-Transform Infrared (FTIR) spectroscopy can cover the MIR range and can be used for complete characterization on Earth, as it is a rapid, highly reproducible, and noninvasive method of identification.
Most of the history of life on Earth has been dominated by microorganisms, including those in microbial mat communities. Microbial mats are vertically stratified assemblages of microorganisms that are dominated by cyanobacteria but are also commonly home to sulfide-oxidizing bacteria, sulfate-reducing bacteria, and other microbes. Microbial mats also act as self-sustaining microecosystems (Almela et al., 2019) as a result of the microbial diversity and varied metabolisms that occur across the mat layers (Van Gemerden, 1993; De los Ríos et al., 2004; Prieto-Barajas et al., 2018; Dillon et al., 2020; Varin et al., 2010). However, when the host water body dries out (e.g., the lake, pond, or stream), the microbial mats that inhabit the system also dry out and, if conditions allow, may be preserved over geological time (Lezcano et al., 2022; Zaikova et al., 2019). As such, these ancient microbial mats are relict samples of past environments and represent ideal target samples for reconstructing past microbial habitats and environmental conditions. Assuming that potential past Martian microbial life may also have found stability in mat communities, the study of ancient terrestrial communities and the capacity of different organic molecules to be preserved will provide important insights into the search for habitable environments and perhaps even life on Mars.
Each bacterial species within these mats will have a complex cell wall composition associated with a unique FTIR spectrum. Microbial cells consist of complex organic macromolecules that are distributed in various cellular components: the cytoplasm (dominated by proteins and nucleic acids), the cytoplasmic cell membrane (composed predominantly of phospholipids), and the cell wall (composed predominantly of peptidoglycan). Differences in the structure and quantity of cell wall polysaccharides, lipids, and proteins can be reflected in FTIR spectra and provide characteristic fingerprint-like patterns typical for different microbial species. This technique is applicable to all microorganisms, including prokaryotes and eukaryotes. The FTIR spectrum of a microorganism is, however, complex owing to contributions from all of the biomolecules present in a cell, and so it can be divided into five subranges: the membrane amphiphile region (3000–2800 cm−1), the biological infrared-silent region (2800–1800 cm−1), the protein and peptide region (1500–800 cm−1), the protein and fatty acid region (1500–1200 cm−1), and the nucleic acid and polysaccharide region (1200–900 cm−1). Naumann (2006) used infrared (IR) spectra to relate specific band assignments in the classification of bacterial cell components, and Quintelas et al (2018) published a detailed overview of the use of IR spectroscopy for bacterial typing. We seek to build an understanding of what a typical microbial mat FTIR spectrum and its key biosignatures look like and identify with spectral methods how stable these signatures are over time through lab-based and environmental preservation strategies.
Ancient microbial mats for study can be found distributed at numerous localities across the Earth, yet those found in Antarctica (Fig. 1) offer an almost unique potential for preservation due to the combination of very low temperatures and rapid cell desiccation created by sublimation processes (Willerslev and Cooper, 2005). The McMurdo Ice Shelf (MIS) is renowned for its extensive developments of Cyanobacteria-dominated benthic microbial mats (Archer et al., 2015; Hawes et al., 2018; Jackson et al., 2021), which are located within one of the largest networks of seasonal meltwater ponds in Antarctica that range in both salinity and size (Vincent et al., 1993; De Mora et al., 1994; Wait et al., 2009; Archer et al., 2014) and experience partial or complete water loss for long periods of time (Jungblut and Neilan, 2010). These are created by the compression of the MIS against land, which causes deformation of the ice and a rolling surface relief. Once formed, some of these microbial mats may remain removed from the water level of the ponds for centuries, halting their metabolisms, and preserving a record of past environmental conditions.
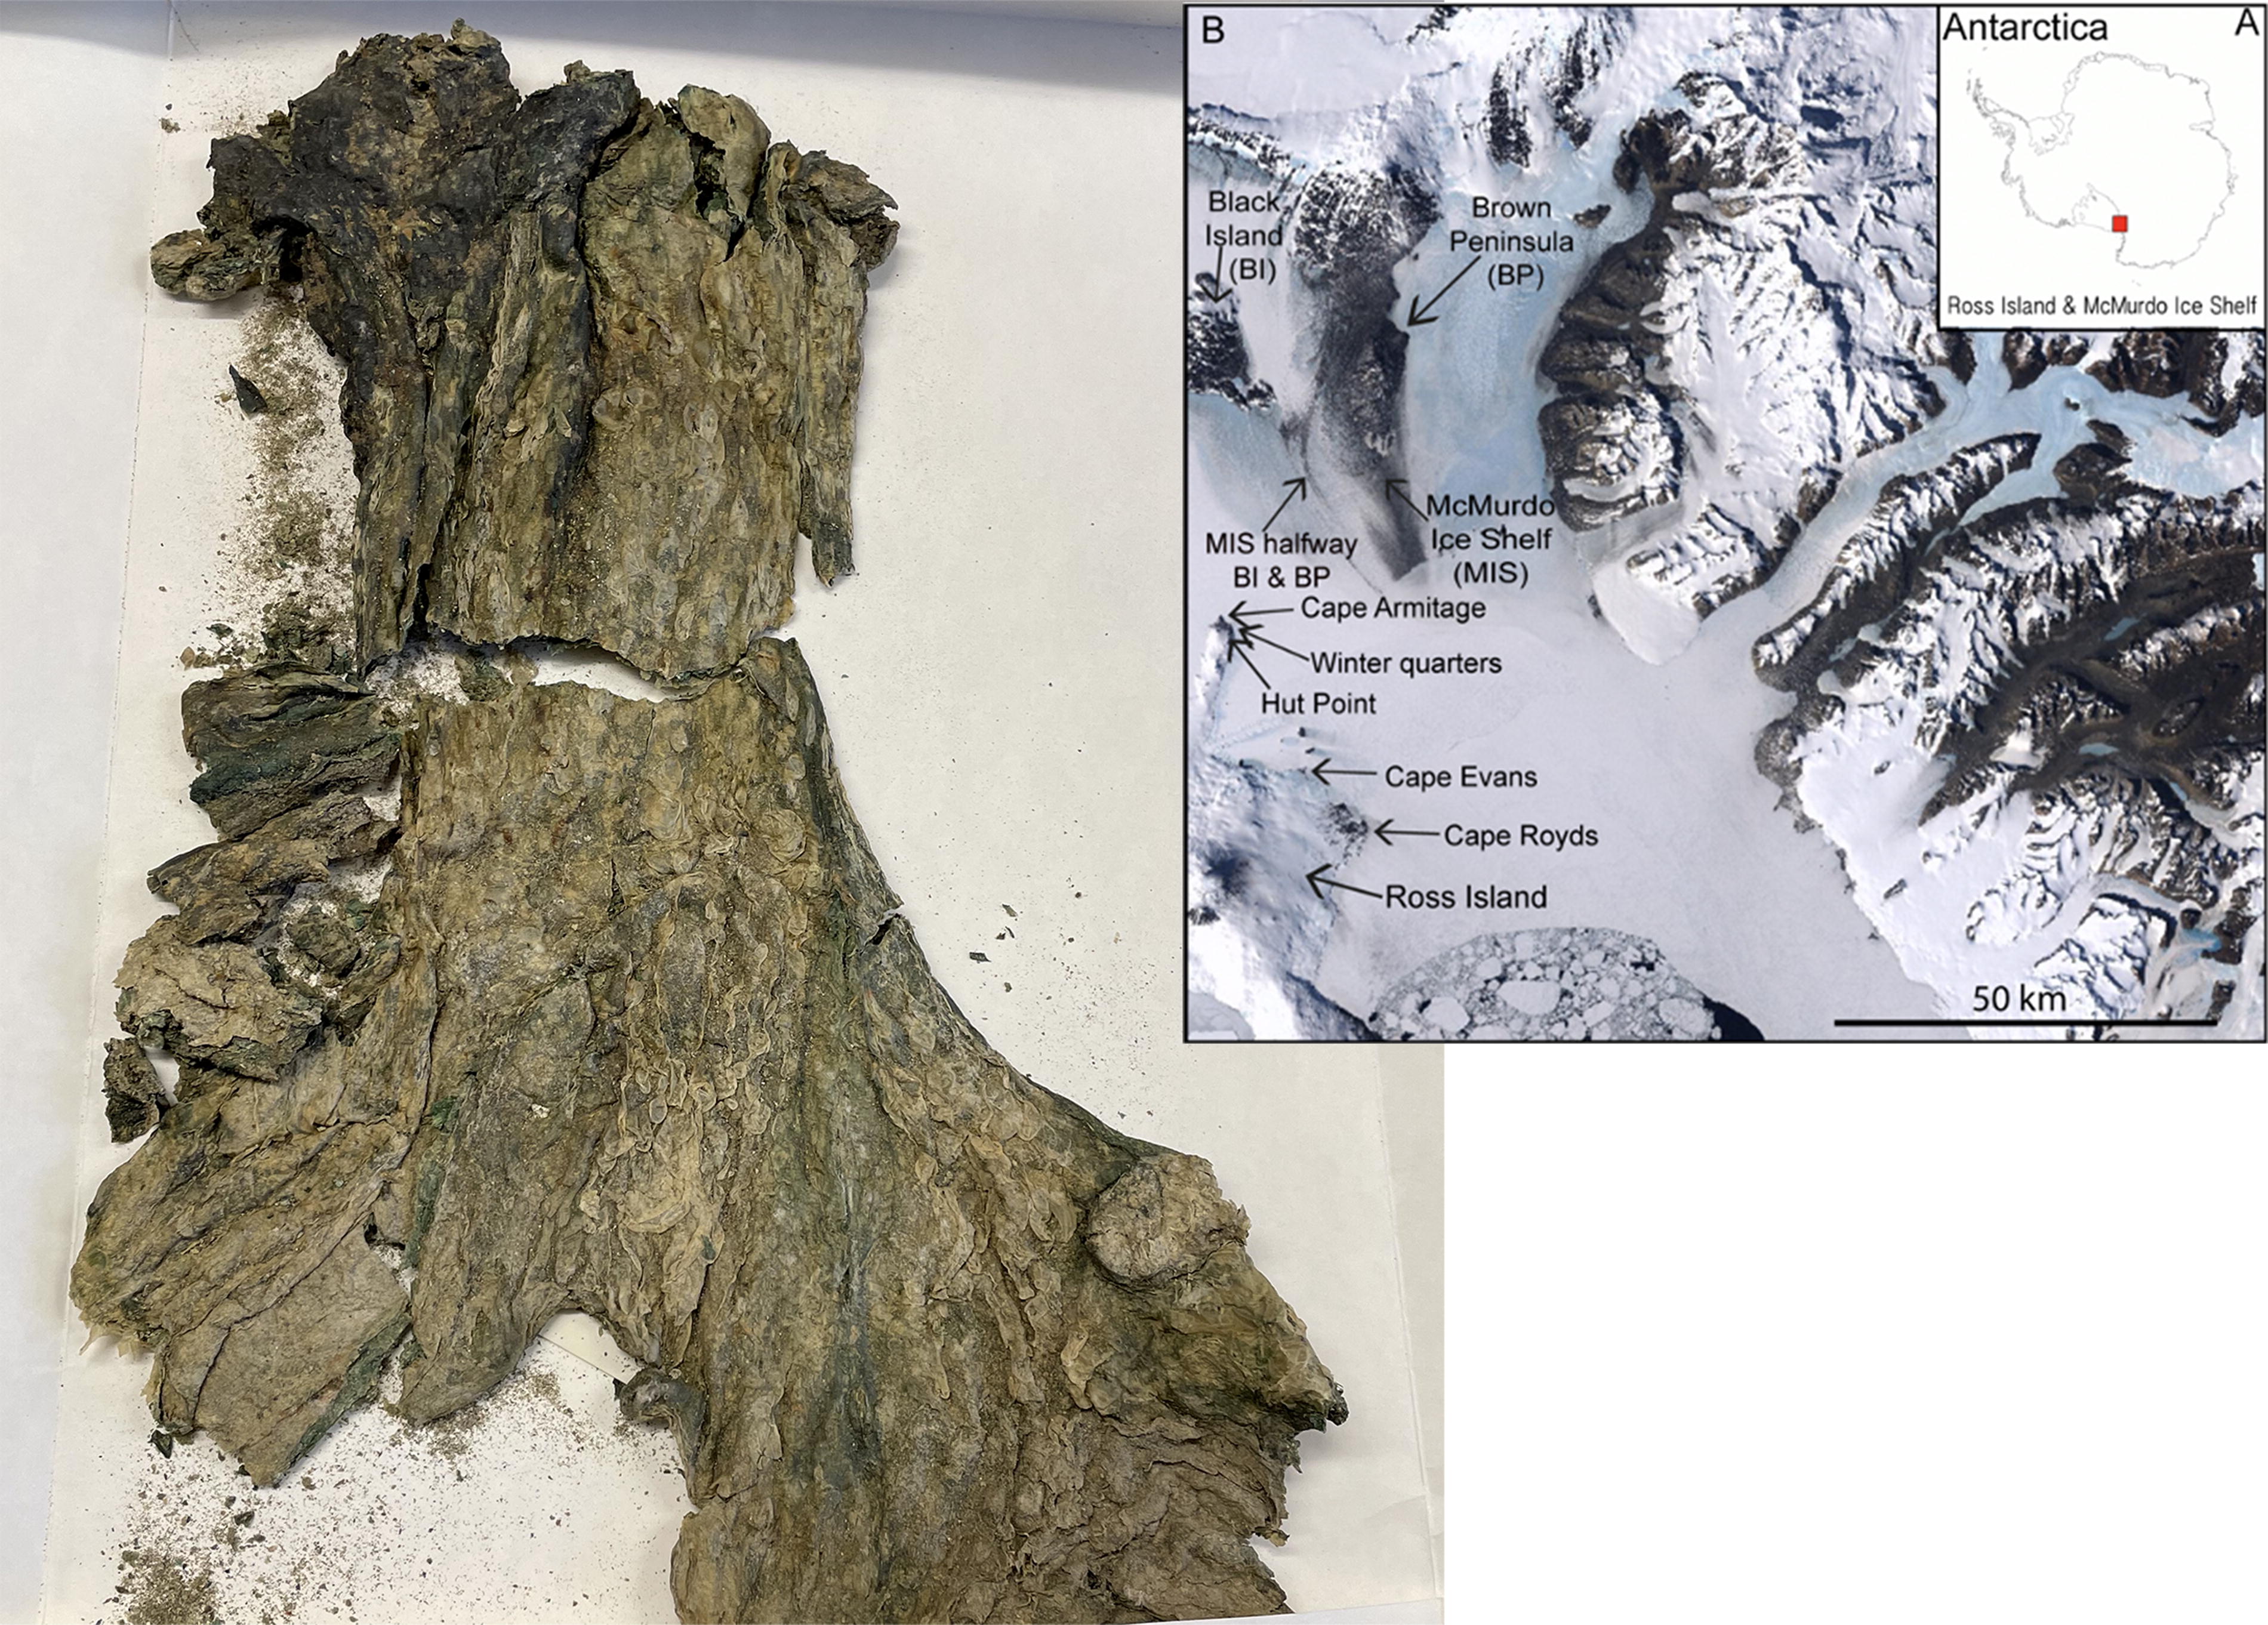
Portion of the freshwater algae collected in December 1902 during the Discovery Expedition, housed in the Herbarium at the Natural History Museum, London, and used in this study (image credit L.J.P.). Inset map showing sampling localities adapted from Jungblut AD, Hawes I. 2017.
Mars is a harsh environment for present-day life, not least because of its low surface temperatures (130–250 K) and lack of liquid water. The low gravity and lack of a global magnetic field has created a thin atmosphere and a surface damaged by radiation, yet experimental studies have found that terrestrial cells from Earth could survive the radiation environment of Mars if they were under a thin layer of dust (Dartnell et al., 2007). The dust on Mars has a homogenous uniform composition, similar to the soil and bulk basaltic Martian crust, with particles <40 µm and is found globally created by a planetary-wide dust cycle: coating rocks, soil, and spacecraft hardware surfaces, and as suspended particulates in the atmosphere. The impact of Martian dust is one of the main geological occurrences we must consider in all analyses conducted on Mars and on Martian samples. In particular, dust can affect the ability of analytical instruments to detect organic molecules. As such, we have to question to what extent the variable and widespread dust environment will help or hinder the preservation and detectability of habitable environments, organic molecules, or even past microbial communities should they be present.
As such, numerous studies have focused on the presence and survival of biomolecules in Martian geological environments, such as the degradation of organic molecules in the Martian regolith (e.g., Benner et al., 2000; Quinn et al., 2013; Broz, 2020; Criouet et al., 2023) and the influence of mineralogy on the preservation of organic compounds (e.g., Aubrey et al., 2006; Poch et al., 2014, 2015; dos Santos et al., 2016; Fornaro et al., 2018; Poggiali et al., 2020). This is because minerals and organic molecules have an intimate relationship: minerals provide surfaces that support, concentrate, and preserve organic molecules, and act as templates for prebiotic reactions. Yet when it comes to analysis of this organo-mineral relationship, there are challenges to overcome. First, there is a scarcity of reference spectral data for organic-mineral/dust mixtures, which hinders firm attribution of previously collected data, soon to be studied features from multiple planetary objects, and eventually MSR specimens. Second, mixed-media samples impact the position, shape, band depths, and intensity of IR spectral responses owing to the relative volumetric proportions of minerals and organics (with the former commonly greatly outnumbering the latter), variable grain sizes, and overlapping vibrational frequencies between many minerals and organic functional groups. This leads to spectral congestion with individual mineral and organic species difficult to extrapolate, and environmental and geological conditions difficult to interpret accurately. As such, experimental studies to recreate and ultimately predict the spectra created by mixed-media planetary targets are greatly needed. In this study, we use FTIR spectroscopy to characterize both mineralogical and organic materials within experimental mixed-media samples composed of Mars dust simulant JSC Mars-1 and an ancient cyanobacterial microbial mat community from Antarctica.
Antarctic microbial mats
The samples used in this study are dried herbarium specimens of cyanobacterial mats from meltwater ponds on Ross Island and the MIS collected over the past 130 years. In particular, we have focused on a portion of enormous freshwater algae mat found growing in, and through, ice in a meltwater pond on the MIS between the Brown and Black Peninsulas and collected on December 2, 1902 (Fritsch, 1912) during the 1902–1903 National Antarctic Expedition, also called the Discovery Expedition, led by Captain Robert Falcon Scott. Discovery sample BM001062584, which is referred to as D-1902 in the present study, is a dried cyanobacterial mat specimen stored in the herbarium at the Natural History Museum, London, UK (Fig. 1) in archive quality, acid-free paper folders in the dark and at room temperature. It is noted that for the first half-century after receipt, records detailing how the specimens were dried and stored have not been found. However, expedition records (Scott, 1907) imply that they were probably dried and pressed immediately after collection by Dr R. Koettlitz (Jungblut and Hawes, 2017; Jungblut et al., 2018). Despite this gap in provenance, the careful collection, preservation, and documentation of these samples since offers a unique possibility to study the spectroscopic biotic organic molecules detectable within century-old Mars-analogue microbial mat communities.
To provide context to and comparisons with other preserved microbial mats, samples have also been analyzed from a number of herbarium specimens that are part of the NHM Algae, Fungi, and Plant Collections. In particular for this work, we have focused on sample number BM000531214, referred to in this study as CR-1964, collected in 1964 from freshwater meltwater ponds on Cape Royds on Ross Island, and sample number BM001215422, in this study called KV-1894, collected in 1894 from a concrete pool at a hot spring in Karlovy Vary, in the Czech Republic. These samples were chosen to allow for the study of Antarctic microbial mats and cyanobacterial biofilm collected at different ages, and from different Mars analogue settings. In addition, these samples were chosen as they displayed no observable contamination from the archive paper, within which they had been stored. This was initially conducted visually; however, after FTIR attenuated total reflection (ATR) spectroscopic analysis of over 20 ancient herbarium microbial mat samples, we observed the spectral profile of paper (identified through instrument spectral libraries), which influenced several analyses. As such, we used samples for this study without any visual or spectral evidence for storage contamination.
Mars simulants
Initial experiments within this study used the Martian regolith simulant JSC Mars-1, developed by Allen et al (1998). This simulant is weathered volcanic ash from Pu’u Nene, a cinder cone on the Island of Hawaii, and is a mixture of pure and altered ash particles. It is composed of finely crystalline and glassy particles of Hawaiite—the <1 mm fraction (75 wt% larger than 149 µm, <1 wt% smaller than 5 µm)—with additional minerals such as plagioclase, feldspar, and Ti-magnetite, along with minor olivine, pyroxene, and glass. The simulant is a good, though not perfect, spectral analogue for the bright regions on Mars as seen in the visible and near-infrared (Allen et al., 1998). It is very difficult to choose a “general” analogue material since soils from various areas on Mars demonstrate spectral, mineralogical, and chemical variations. However, the simulant closely matches typical Martian soils for SiO2, Fe2O3 (except for Fe-rich dark hematite-rich soils from Meridiani Planum), and CaO, but is different for other oxides, notably Al2O3, TiO2, and MgO (Moroz et al., 2009), and contains considerable water in contrast to actual Martian regolith, which is extremely dry. As such, it is a good well-characterized baseline simulant to use for our initial experimental development, with future experiments planned to use more specialized simulants designed to mimic individual sites on Mars.
Mid-IR spectroscopy
FTIR spectroscopy was used throughout this study to analyze both the microbial mats and the experimental Mars simulants. Spectra were obtained in the mid-IR region by using a Thermo Nicolet iS50 bench FTIR spectrometer equipped with a diamond ATR crystal, housed in Science Innovation Platforms at the Natural History Museum, London. Reflectance measurements, published as absorbance units, were obtained at room temperature and ambient pressure, over a spectral range of 500–4000 cm−1 (20–2.5 µm) at a resolution of 4 cm−1. A diamond calibration standard was used, and automated atmospheric water (H2O) and carbon dioxide (CO2) subtractions (i.e., atmospheric corrections) were made by the OMNIC software. In ATR mode, the sample is placed on an optically dense crystal (diamond) of higher relative refractive index for analysis. This sampling technique is widely used in the context of bacterial typing due to the associated versatility and lack of sample preparation requirements. No further processing of data (e.g., smoothing or Fourier self-deconvolution) was used to avoid the introduction of artifacts. Band positions are reported simply as the observed maxima owing to the high signal-to-noise ratio of the spectra rather than maxima obtained from second derivations or from curve fits.
Experimental protocol
Centimeter-sized pieces were cut from the main herbarium specimens with a sterilized knife and then placed, stored, and sealed within sterile Falcon tubes until analysis. Nitrile gloves and face masks were employed to avoid human contamination. For analysis, the samples were individually powdered by using a sterilized agate pestle and mortar, and they were weighed, subsampled, and mixed with JSC Mars-1 to create homogenized mixtures for immediate FTIR analysis. For this preliminary experiment, JSC Mars-1 and Antarctic microbial mat samples were portioned into mixtures at ratios of 0:100%, 25:75%, 50:50%, 75:25%, and 100:0% (details in Table 1) to enable observation of the changing FITR absorption patterns as the mineralogical/mat proportions varied. Analyses were conducted five times with each sample mixture and remixed between analyses. The average spectra are presented in Figures 5 and 6. Because of the unique, irreplaceable, and historical value of the microbial mat samples and given the destructive nature of powdering and preparing the mixtures, the experiment was conducted using only the D-1902 and CR-1964 specimens (both from meltwater ponds in Antarctica) as there would not be enough of KV-1894 remaining after the experiment for future sample availability. In addition, to enable preservation of as much sample for future scientific study as possible, we limited the number of mixtures created during this preliminary study and used small sample volumes. A benefit of the FTIR ATR technique is that <5 mg of sample is needed for analysis, and therefore the small sample sizes of this study were more than enough to obtain meaningful results while not unnecessarily wasting precious specimens.
Sample Mixtures and Their Relative Percentages Created for This Study
Sample Mixtures and Their Relative Percentages Created for This Study
FTIR spectra of microbial mats
Table 2 and Figure 2 present the absorption bands identified within the microbial mat sample from the Discovery Expedition (D-1902) taken from an average of five analyses. Because of the known biological provenance of this sample, the organic absorption bands most likely have a biotic origin, which has been proposed below. An absorption band, belonging to the v1 symmetric stretching vibrational mode of H2O, is found located around 3400 cm−1 as a slight shoulder on a strong absorbance peak at 3292 cm−1 assigned to the N-H stretching vibrational mode of amines-nitrogen-containing organic compounds. The absorption bands of aliphatic C-Hx moieties are observed at 2960, 2931, 2865, and 2856 cm−1. The shoulder band absorption at 2952 cm−1 and the absorption band at 2921 cm−1 are derived from the asymmetrical stretching vibrational modes of CH3 (methyl) and CH2 (methylene), respectively. An absorption band at 2865 cm−1 relates to the symmetric stretching vibrational mode of CH3, whereas the symmetric CH2 stretching vibrational mode is observed at 2848 cm−1. These are assigned to aliphatic hydrocarbons, perhaps found in phospholipids. A strong absorption band is identified at 1640 cm−1, which could be assigned to the Amide-1 band, in particular a β-pleated protein sheet structure, and is mainly associated with the C=O stretching vibrational mode. However, the positioning of this band sits within the region of the O-H stretching absorption of water and so may be created by water within the microbial mat as already evidenced by the H2O stretching vibrational mode identified at 3400 cm−1. An absorption band at 1530 cm−1 is assigned to the Amide II vibrational mode of proteins, a shoulder at 1442 cm−1 due to the CH2 bending of methylene, and another strong absorbance at 1402 cm−1 to the O-H bending vibrational mode within polysaccharides. There is a shallow peak at 1232 cm−1 that could be caused by the P = O stretching (asymmetrical) of PO2 - phosphodiesters within nucleic acids. The most intense absorbance is located at 1009 cm−1 and is assigned to the C-O or C-O-C stretching vibrational modes of carbohydrates within polysaccharides. The final few notable absorbance peaks are observed at 870 and 710 cm−1 and are assigned to the C-O stretching vibration and the CH2 rocking vibrational mode of methylene within phospholipids, respectively.
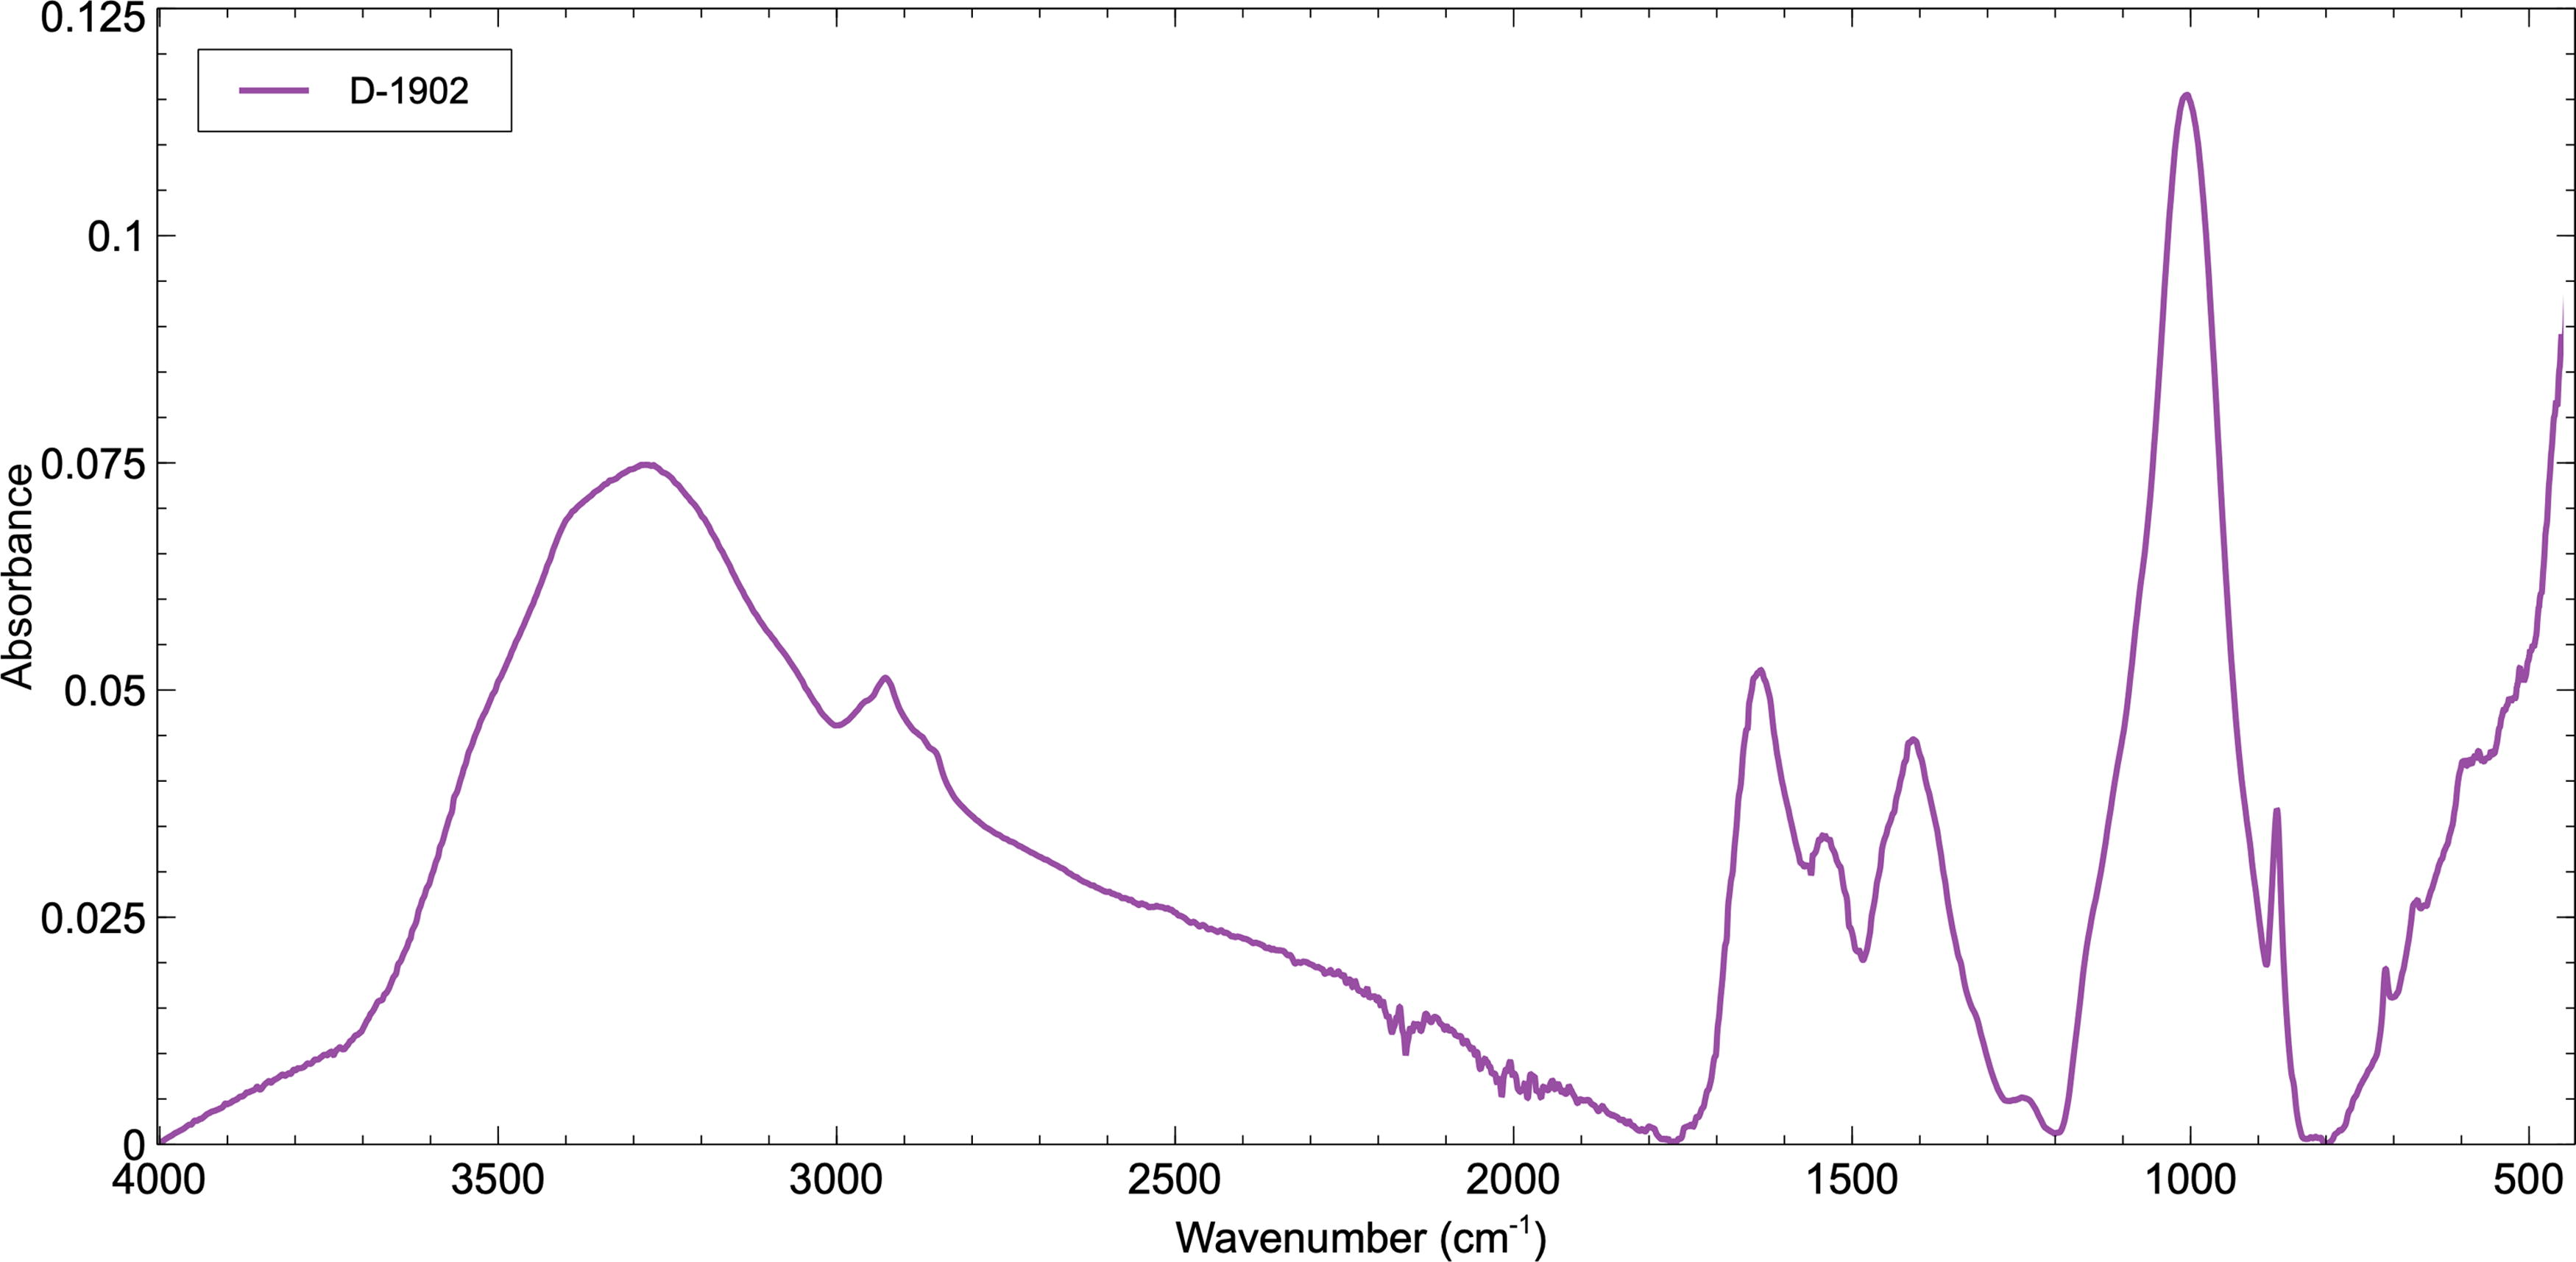
FTIR spectrum of sample D-1902 from the Discovery Expedition between 4000 and 500 cm-1 (2.5–20 µm). Key absorption bands can be identified created by the vibrational modes of H2O, OH, and organic molecules. FTIR, Fourier-transform infrared.
Fourier-Transform Infrared Absorption Bands Identified for Three Microbial Mat Samples, D-1902, CR-1964, and KV-1894. The Band Positions, Assignments, and Proposed Cell Components for Each Are Listed
As shown in Table 2 and Figure 3, there are several similar organic absorption bands proposed to belong to cellular macromolecules within all three microbial mats—D-1902, CR-1964, and KV-1894. CR-1964, a microbial mat collected from Antarctica in 1964, has two additional bands located at 1313 and 1149 cm−1 tentatively assigned to the Amide III bands of proteins and C-O stretching in cellulose, respectively. The CR-1964 sample lacks the CH2 rocking vibration of phospholipids at ∼710 cm−1 and the C-O stretch at 870 cm−1 found within the older Discovery samples. Relatively, the most intense and defined absorption bands were identified within the KV-1894 sample, which was collected from a hot spring pool in 1894; it is the oldest sample in this study and comes from a different environmental setting. In addition to absorptions identified within the Antarctic mat samples, KV-1894 also has absorption bands at 1780, 1149, and 1080 cm−1, which are assigned as the C = O stretching of esters in either carboxylic acids or phospholipids, the C-O stretching vibration in cellulose, and the P = O symmetric stretching vibration of PO2 − within nucleic acids, respectively.
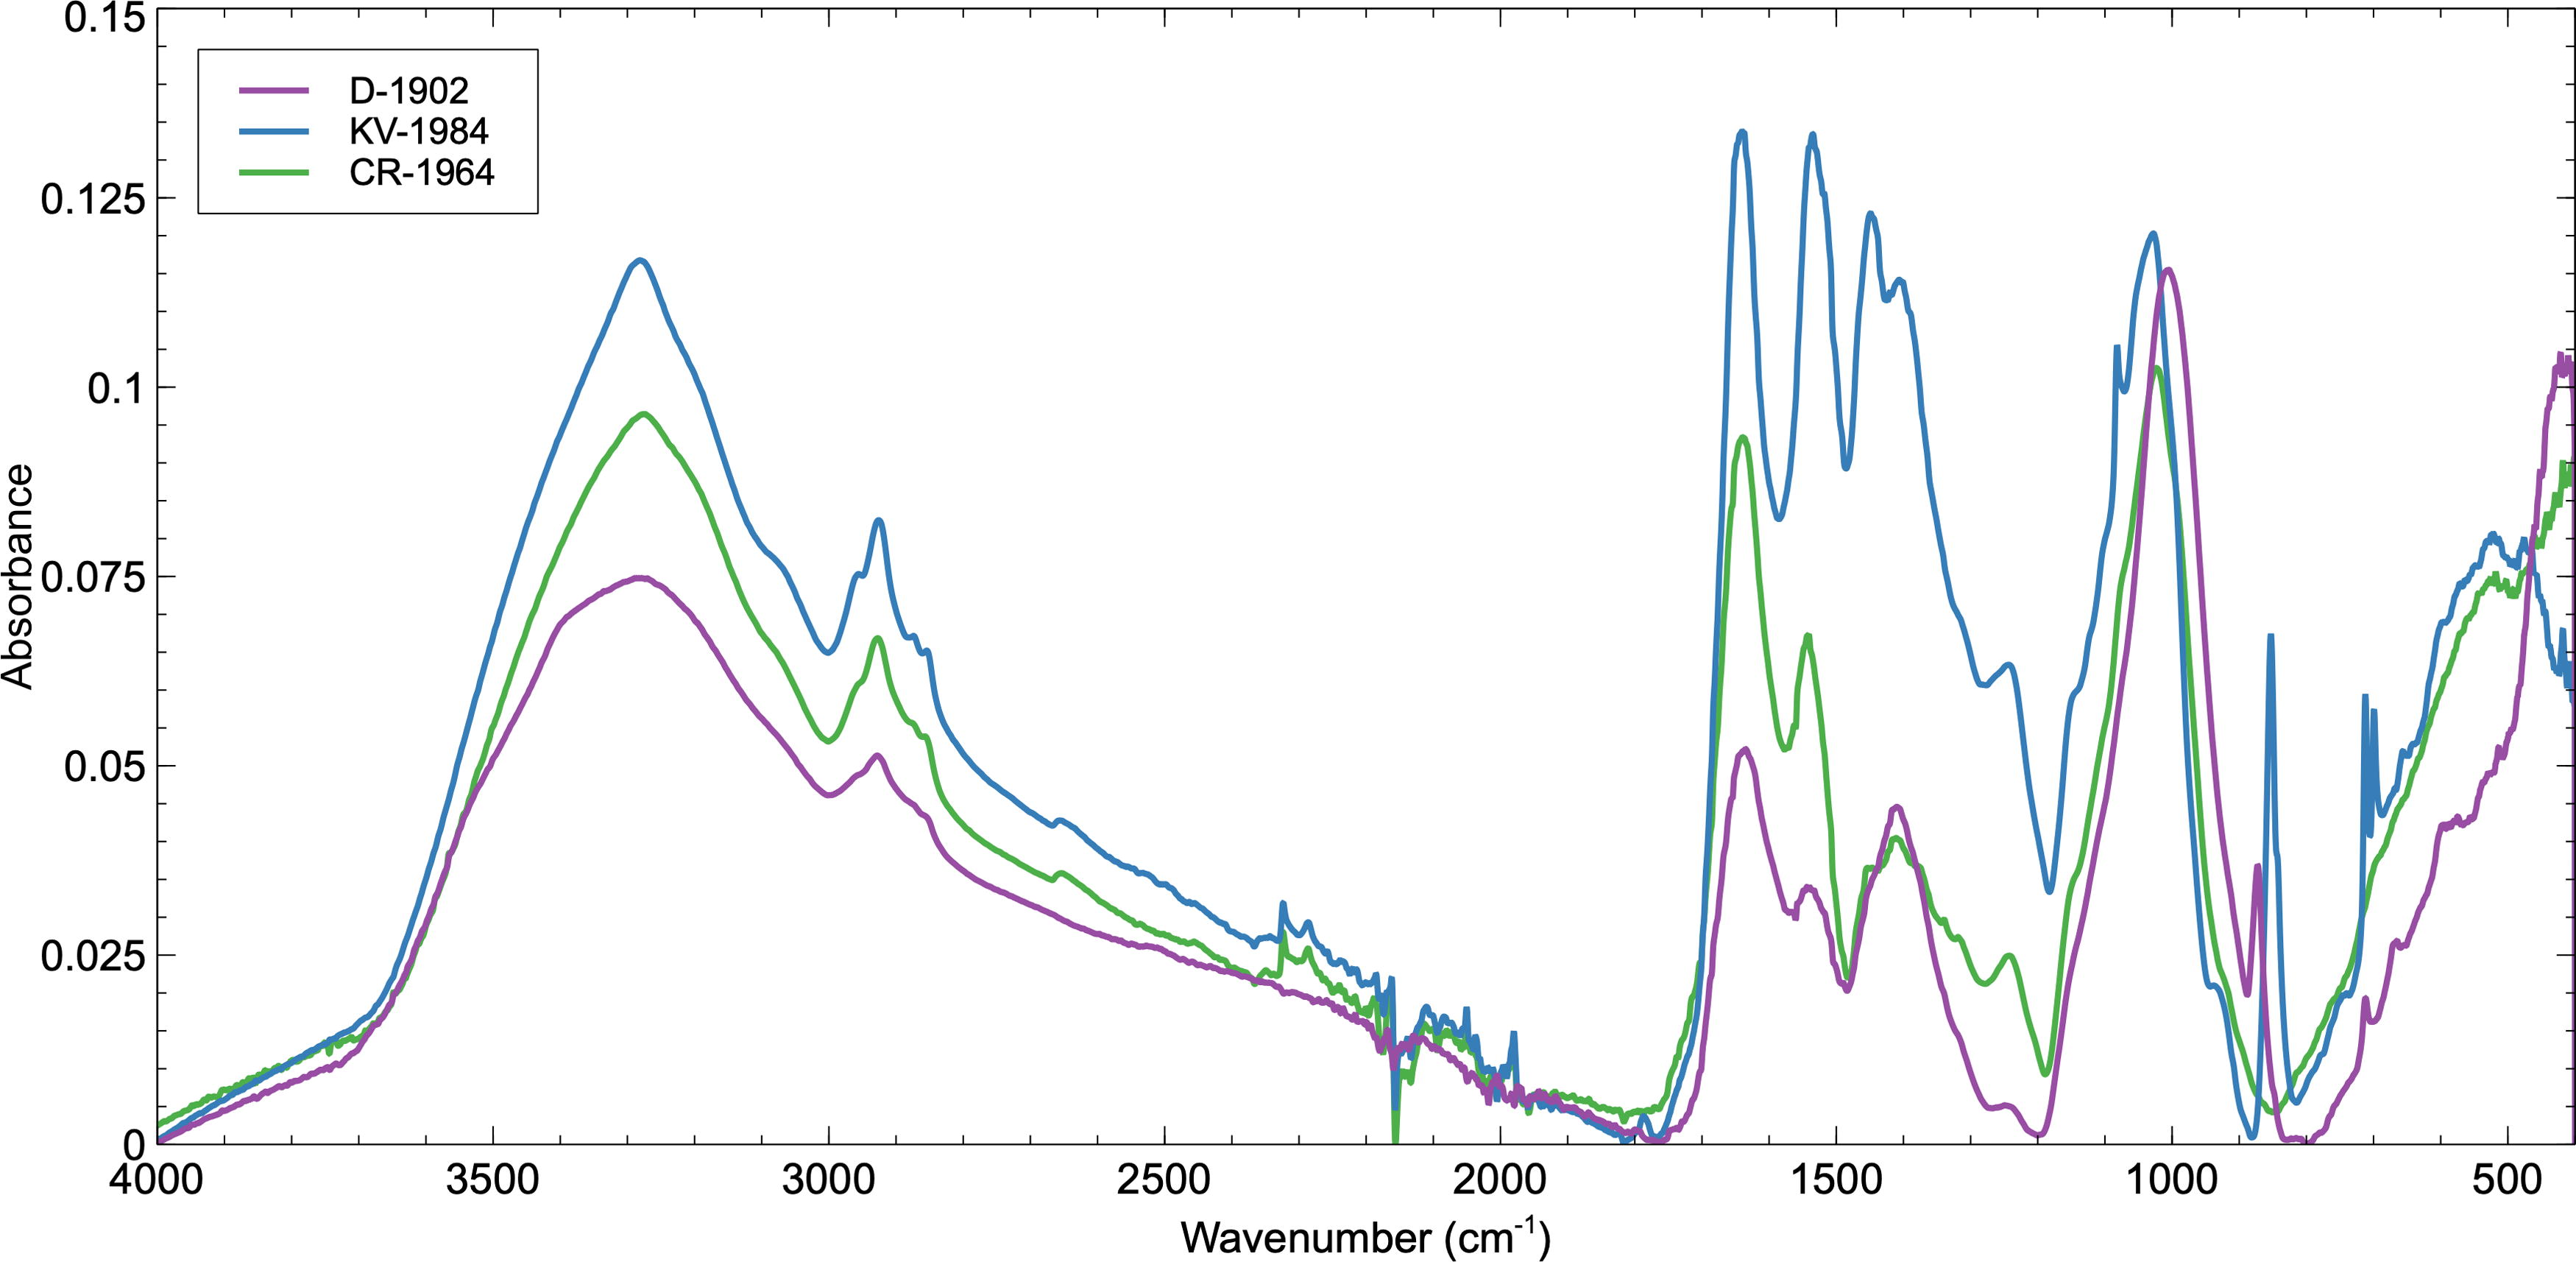
Comparison of FTIR spectra of samples D-1902, CR-1964, and KV-1894. Several common organic absorption bands belonging to cellular macromolecules are found within all three microbial mats, with the most intense and defined absorption bands identified within the oldest sample KV-1894. FTIR, Fourier-transform infrared.
The FTIR spectrum of Mars simulant material JSC Mars-1 is shown in Figure 4. There is a broad hydration feature centered around 3300 cm−1 attributable to Si-OH and at around 1620 cm−1 attributed to OH. At 1384 cm−1, there is an Al-OH absorption, and a strong Al-OH absorption at 924 cm−1 with a shoulder at 989 cm−1 of Al-O/Si-O/Si-OH. The chemical composition of JSC Mars-1 (Allen et al., 1998) is dominated by SiO2, Al2O3, Fe2O3, TiO2, and CaO, which is reflected in the absorption peaks identified in the FTIR spectrum of the sample. The main feldspar minerals, identified through X-ray diffraction and electron microprobe analyses, are anorthite (CaAl2Si2O8) and Ti-magnetite (Allen et al., 1998), and the sample is enriched in volatiles, mainly water, via minerals containing either structural OH and/or bound H2O. No absorption bands relating to organic macromolecules were observed.
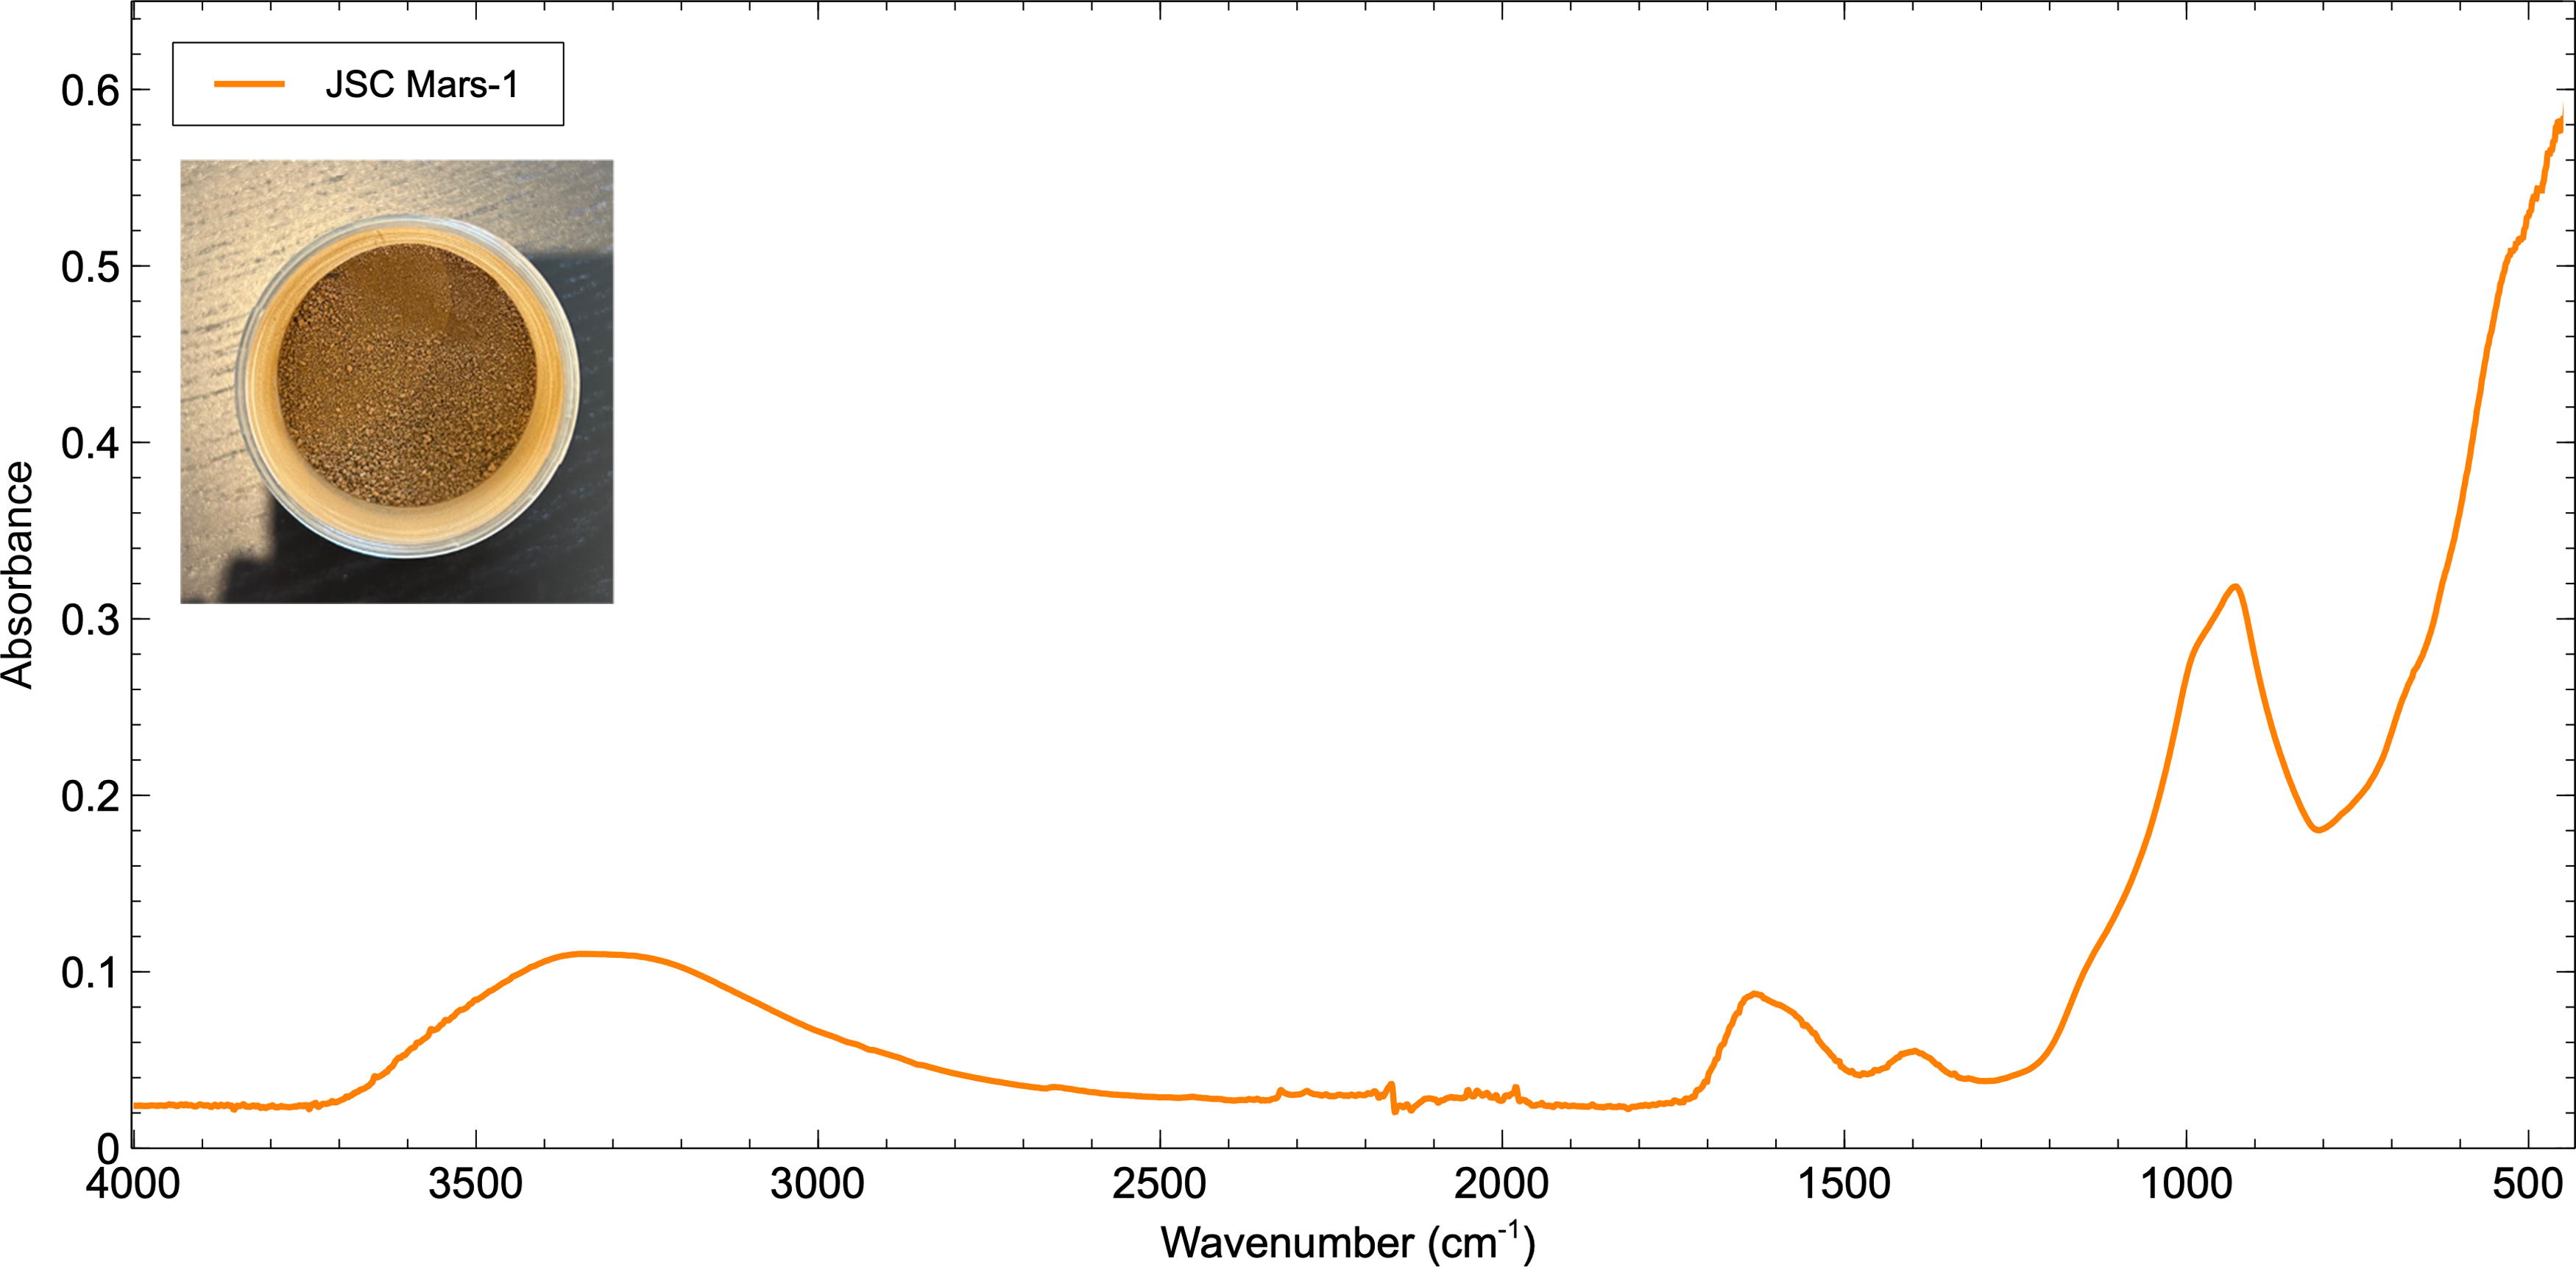
The FTIR spectrum for JSC Mars-1. The absorption peaks identified reflect the chemical composition of the simulant-dominated by SiO2, Al2O3, Fe2O3, TiO2, and CaO (Allen et al., 1998). The inset image is of the Mars simulant sample used in this study. FTIR.
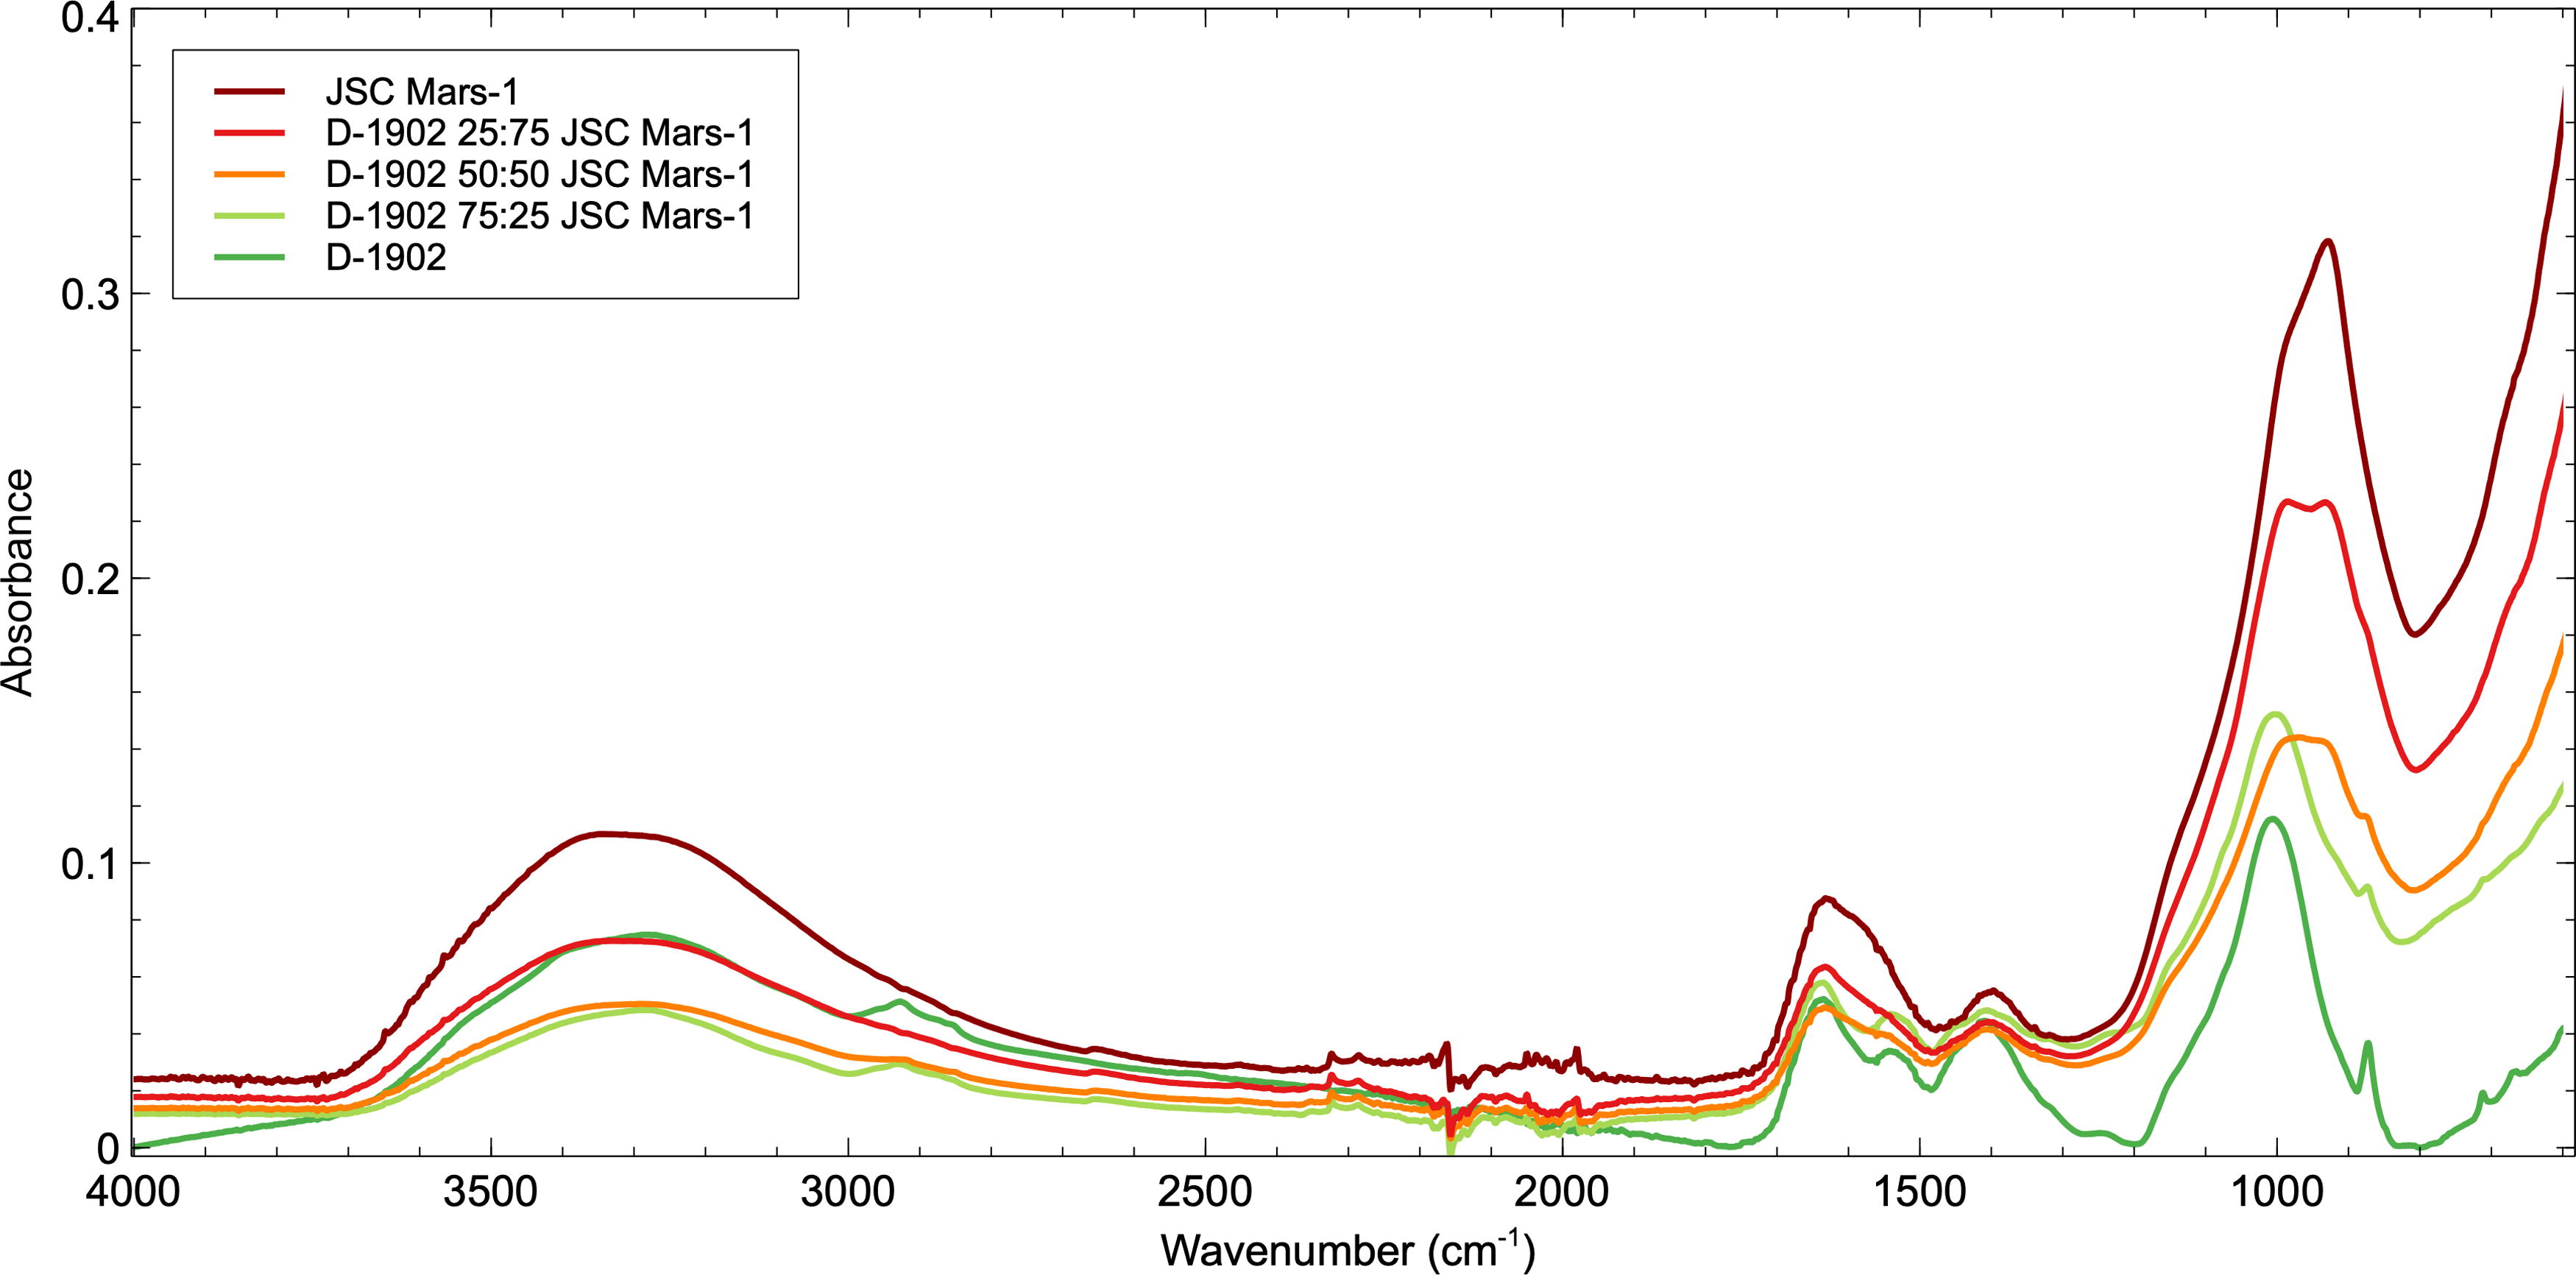
FTIR spectrum from the D-1902 Mars simulant experiment. Due to its purely mineralogical content, the JSC Mars-1 sample exhibits the greatest relative intensity FTIR absorptions, with spectral intensity decreasing as D-1902 microbial mat volume is increased in the samples. In the D-1902 50:50 JSC Mars-1 mixture, the organic absorption bands start to become masked by the mineralogy and by D-1902 25:75 JSC Mars-1 ratios, all organic absorptions are indistinguishable from the surrounding mineralogy. FTIR, Fourier-transform infrared.
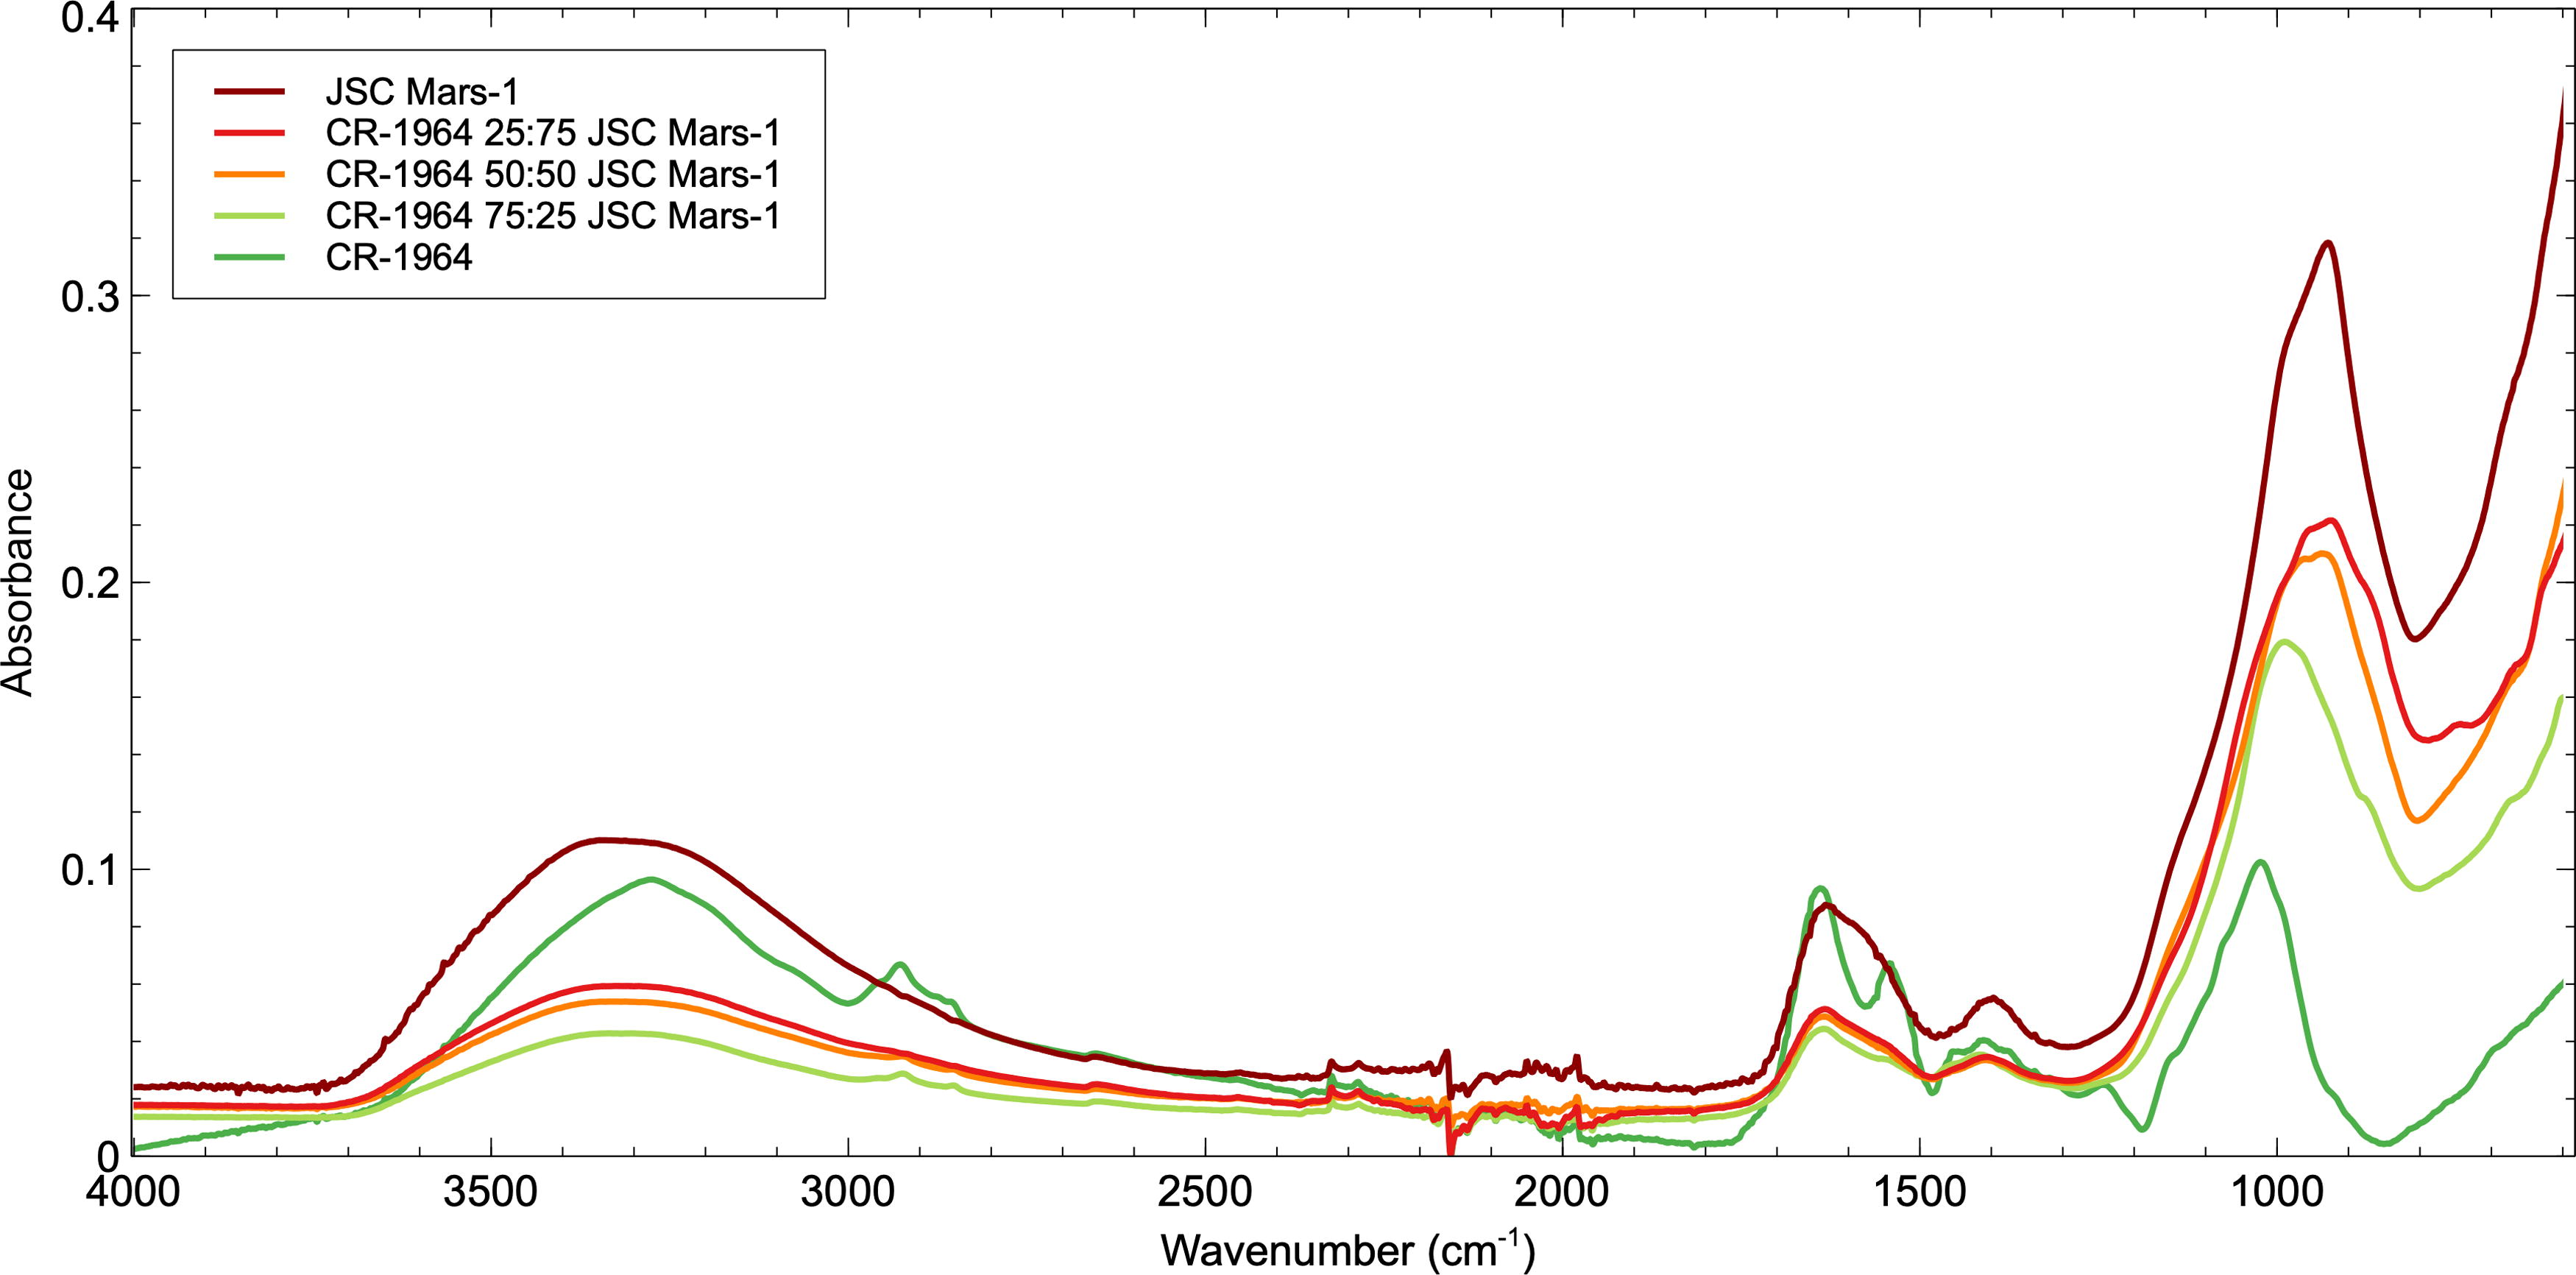
FTIR spectrum from the CR-1964 Mars simulant experiment. The JSC Mars-1 sample exhibits the greatest relative intensity FTIR absorptions, with spectral intensity decreasing as CR-1964 microbial mat volume is increased in the samples. In the CR-1964 50:50 JSC Mars-1 mixture, only one key absorption band remains; those found in the CH2/CH3 aliphatic region between 3000 and 2850 cm-1. FTIR, Fourier-transform infrared.
Through the results of the FTIR analysis, documented in Section 3.1, several key organic absorption bands within the samples have been identified and will be tracked throughout the experiments: The N-H band of proteins at ∼3292 cm−1, The CH2/CH3 aliphatic hydrocarbon bands between 2960 and 2850 cm−1, The H2O/Amide I band of proteins at ∼1630 cm−1
The Amide II band of proteins at ∼1530 cm−1
The O-H band of polysaccharides at ∼1400 cm−1
The P = O band of DNA at ∼1230 cm−1
The C-O band of cellulose at ∼1150 cm−1
The C-O band of polysaccharides at ∼1020 cm−1
The C-O band at ∼850-870 cm−1.
D-1902: Mars mixture
As shown in Figure 5, the JSC Mars-1 sample exhibits the greatest relative intensity FTIR absorptions owing to its purely mineralogical content, but as the volume of D-1902 microbial mat increases in the samples, the overall spectral intensity decreases. Conversely, as the volume of JSC Mars-1 increases and that of the microbial mat decreases within samples, the intensity of the organic absorption bands within the microbial mat decreases and ultimately disappears.
The addition of even 25% JSC Mars-1 simulant begins to mask the intensity of the absorption features in the Discovery microbial mat spectrum. In the D-1902 75:25% JSC Mars-1 mixture, all the key absorptions listed above and in Table 3 are still visible; however, the relative band intensity of the CH2/CH3 aliphatic hydrocarbon absorptions between 2960 and 2850 cm−1 and the C-O band around 870 cm−1 are reduced (Fig. 5). Within the D-1902 50:50% JSC Mars-1 mixture, the organic absorption bands start to become masked by the mineralogy. The N-H absorption at 3292 cm−1 has disappeared and the Amide II band at ∼1530 cm−1 and the P=O band at ∼1230 cm−1 are no longer measurable. Finally, the C-O band at around 870 cm−1 is visible but extremely weak. At D-1902 25:75% JSC Mars-1 ratios, only one of the key absorptions is still observable; the H2O/Amide I band ∼1630 cm−1. The H2O/Amide I band is present in both mineralogical and biological samples pre- and postmixing, which supports the assignment of the band to H2O vibrational modes rather than Amide I, and is therefore expected to be present throughout the experiment. The C-O band at ∼1020 cm−1 is the most intense absorption band in the microbial mat spectra. However, within the D-1902 50:50% JSC Mars-1 and the D-1902 25:75% JSC Mars-1 mixtures, this band has widened and displays a twin peak owing to inputs from both the organic C-O absorption band of the microbial mat and the Al-OH absorption from JSC Mars-1. The O-H band of polysaccharides at 1402 cm−1 within the D-1902 sample sits very closely to the Al-OH absorption band at 1384 cm−1 within JSC Mars-1, making their unique identification challenging in the spectra.
Key Biosignature Absorption Bands Tracked Within the D-1902 and CR-1964 Mars Simulant Experiments, “x” Marks the Presence of an Absorption Feature
Key Biosignature Absorption Bands Tracked Within the D-1902 and CR-1964 Mars Simulant Experiments, “x” Marks the Presence of an Absorption Feature
As observed within the D-1902 mixture, the JSC Mars-1 sample exhibits the greatest relative intensity FTIR absorptions owing to its mineralogical composition and the CR-1964 microbial mat the lowest intensity absorptions. As the volume of CR-1964 microbial mat increases in the samples, the overall spectral intensity decreases; however, as the volume of JSC Mars-1 increases, the intensity of the microbial mat organic absorption bands decreases. In fact, the intensity and sharpness of the CR-1964 absorption bands greatly decreased as soon as the sample was mixed with the JSC Mars-1 simulant material (Fig. 6). After mixing 75% of the CR-1964 material with only 25% of the JSC Mars-1 simulant, the N-H absorption band at 3292 cm−1, the P=O absorption band at 1235 cm−1, and the C-O absorption band of cellulose at 1149 cm−1 are no longer detectable. Also, the Amide II absorption at 1539 cm−1 is extremely weak. The C-O absorption band at 1017 cm−1 shifts to 999 cm−1, which is close to the Al-OH band in JSC Mars-1 and may indeed now reflect the mineral input to the mixture not the microbial mat. In the CR-1964 50:50% JSC Mars-1 mixture, only two key absorption bands remain; those found in the CH2/CH3 aliphatic region between 3000 and 2850 cm−1 and the H2O/Amide I band at 1634 cm−1 which, as noted in 3.3.1, owing to its co-location with the OH band in JSC Mars-1 likely indicates a nonorganic assignment and is expected to remain throughout the experiment. As observed in the D-1902 mixture, the O-H band of polysaccharides at 1402 cm−1 sits very closely to the Al-OH absorption band within JSC Mars-1 and cannot, therefore, be uniquely identified. However, it appears that the organic O-H band remains detectable in the 75% CR-1964 sample mixture, but only the Al-OH band is detectable in the 50% CR-1964 sample mixture and beyond.
Discussion and Interpretation
A common assumption and expectation is that, if life ever existed on Mars, it must have been microbial, with a number of terrestrial studies having been conducted on the study and identification of fossils of microbial cells and filaments, stromatolites, and chemical signals and biomarker molecules to aid in its future detection (e.g., reviews by Hickman-Lewis et al., 2018; Lepot, 2020). Yet how we identify this life, how it is preserved over time, and how we can discriminate between biotic and abiotic signatures still requires exploring.
The identification and preservation of organic molecules within microbial mats
Within the microbial mats of this study, we observed organic FTIR absorption bands that can be attributed to the components of the bacterial cells, in particular proteins, lipids, and carbohydrates. On average, bacterial cellular composition is fairly homogeneous: 40% to 60% proteins, 15% to 20% nucleic acids, 10% to 15% polysaccharides, 10% to 15% lipids, and up to 3% other organic and inorganic components, yet the proportions of these macromolecular pools can vary substantially among species. However, according to the relative intensity of the absorption bands, our microbial mats spectrally display a higher input from polysaccharides, followed by lipids, proteins, and minor nucleic acids. This may be due to a number of reasons. First, the cyanobacteria of this study were not analyzed as single cells but as part of a structured multicellular bacterial community built and maintained by an extracellular matrix. This matrix is dominated by polysaccharides, along with proteins and extracellular DNA (Limoli et al., 2015), and therefore the FTIR spectra are displaying the polysaccharide-rich organic molecules within this extracellular matrix as well as the bacterial cells themselves. Second, the overall preservation potential of biomolecules can be listed in order: macromolecules > lipids > carbohydrates > proteins > nucleic acids (Tegelaar et al. 1989), which is reflected in the carbohydrate and lipid-dominated spectral analyses of the microbial mats. Ancient microbial mats, therefore, provide an increased ability to detect organic molecules owing to the volume of cells that make the structures and the additional signatures created by the extracellular matrix holding them together.
FTIR spectroscopy has been extensively applied to the identification and characterization of bacteria (e.g., Naumann, Helm, & Labischinski, 1991; Naumann, 2006) and can provide excellent discrimination between different bacterial taxa down to the strain level. In particular, FTIR spectroscopy can differentiate between cyanobacterial species through variations in a number of spectral regions created by the chemical differences between taxa. Kansiz et al (1999) used FTIR spectroscopy to discriminate between cyanobacterial strains. They averaged between 108 and 162 spectra from six taxa, including Synechococcus sp., Microcystis aeruginosa LB-A1, Chlorella emersonii, Anabaena variabilis Mon, Microcystis aeruginosa DTW, and Oscillatoria sp. noting differences in the C-O-C stretching vibrations of polysaccharides in the range 1200–950 cm−1, the symmetric and asymmetrical stretching vibrations of PO2 - functional groups at ∼1080 and ∼1242 cm−1, and the intensity of the C-Hx absorption bands. However, this level of spectral differentiation is difficult in this study as multiple species are mixed together in a single analysis. Through cyanobacteria-specific 16S rRNA gene assessments carried out by Jungblut and Hawes (2017) on several cyanobacterial mat specimens from Scott’s Discovery Expedition, including the D-1902 sample of this study, they identified the presence of a number of filamentous cyanobacterial genera, dominated by many 16S rRNA genotypes belonging to Leptolyngbya, Pseudanabaena, and Phormidium. In addition, the Antarctic CR-1964 sample (Jungblut unpublished data) was found to be primarily composed of the cyanobacteria Schizothrix calcicola with a mixture of four filamentous species, such as LPP (Lyngbya, Phormidium, Plectonema) and Microcoleus. The KV-1894 sample, however, is primarily dominated by one morphotype belonging to Leptolyngbya tenuis, but the presence of very low numbers of other unidentified cyanobacteria morphotypes was confirmed through microscopy analysis. Our results confirm that when FTIR spectroscopy is applied to a large collection and variation of intact microbial cells within a microbial mat, the resulting spectra reflect the average biochemical composition of the cells (Naumann et al., 1991) and can thus be considered as a total and simultaneous chemical analysis. The recorded absorption bands are a reflection of the whole community response, displaying a “typical” cyanobacterial spectral profile with species-specific features masked. Interestingly, the single cyanobacteria morphotype spectrum of KV-1894 is reminiscent of taxa-specific Leptolyngbya EPS spectra, with the individual features easier to discern (Gongi et al., 2022).
The spectra presented in Figure 3 show that, relatively, KV-1894 has the most defined spectrum, and as Table 2 highlights, it contains the most detectable absorption bands. CR-1964 compared with KV-1894 has a relatively less intense spectrum and has the fewest identifiable absorption bands, whereas the Discovery D-1902 sample displays the relatively least intense spectrum. This relative intensity and ability to discern macromolecular components of the microbial mats does not seem to be positively correlated to age of the sample since collection, for example, it could be expected that owing to degradation the older the sample the fewer the spectral biosignatures, as KV-1894 is the oldest sample and CR-1964 the youngest. Whereas the youngest sample has in fact the fewest observable spectral absorption bands and the oldest sample the most. There are a number of other factors to take into account when comparing samples, such as the differing environments (meltwater ponds vs hot springs), external environmental conditions such as duration of exposure to UV radiation, temperature and hydration, time from formation to collection, and the procedures involved during collection and storage.
In a study by Blanco et al. (2017), diffuse infrared spectroscopy (DRIFTS) was used to study a 1000-year-old Antarctic relict cyanobacterial mat. They identified most of the bands identified within this study including three of the four C-Hx aliphatic hydrocarbons, and some protein and polysaccharide vibrational modes. However, the current study identified additional polysaccharide absorptions as well as those within nucleic acids. This may be due to the difference in IR technique used, DRIFTS vs. FTIR ATR; the infrared beam doesn’t just analyze the surface but penetrates up to 3 µm into the sample increasing the amount of information obtainable. It is also hardly surprising that a greater number of biomolecules is present within the samples of the present study, which are 900 years younger; and that evidence of nucleic acids, the least preservable of the biomolecules, has been lost in the older samples. However, in general, it is exciting to see that the same biomolecules are identifiable in similar samples spanning 1000 years of extreme Mars-like environmental exposure.
The identification and preservation of organic molecules within geological materials
Although the 100+-year-old Antarctic microbial mats of this study are not temporally analogous to Martian geological timescales, their high degree of organic preservation initially occurred under Mars-like environmental conditions of sub-zero temperatures, extremely low humidity, and high UV radiation, and so this represents a reasonable comparison to hypothetical Martian biofilms. However, it is clear from this study that the addition of Mars simulant soil greatly affects the ability to detect these microbial mats and their organic spectral fingerprints. The first absorption bands that become undetectable in both experiments are the P = O band of nucleic acids, and the Amide II and N-H absorption bands of proteins. By the time only 25% of the sample mixture was microbial mat, no organic absorption bands were detectable. The CH2/CH3 aliphatic hydrocarbon bands remained identifiable longest in both experiments despite not having the most relatively intense original absorptions likely due to no mineralogical absorptions from the JSC Mars-1 material occurring in this region to mask or suppress their signatures. We lost the ability to detect the lowest intensity organic absorption bands first and those bands whose absorption positions are overlapped by the mineralogical components of the Mars simulant. When looking for spectral signatures of organic molecules within Martian dust and minerals, the CHx stretching vibrations between 2800 and 3000 cm−1 should be used and, when combined with the C-O and O-H absorption bands, could be used as a proxy for past or present habitable conditions and potential biological materials present.
Today, dust is ubiquitous on Mars, in the air and on the ground, with most rocks weathered and covered in it. As such, we have to question to what extent the variable and widespread dust environment will determine the survival of any potential microbial communities and the identification of their organic signatures within the Martian geological record, and ultimately the habitability of Mars. This preliminary study has assessed the ability for FTIR spectroscopy to identify organic molecules within ancient preserved microbial communities and those mixed in Mars simulant dust. Previous studies have focused on the preservation potential of biotic molecules on a range of Mars analogue minerals and under different Martian conditions. For example, Liu et al (2023) studied specific organic molecules, including cellulose, chitin, chitosan, and amino acids, and used DRIFTS to characterize them within Martian simulant mixtures of MGS-1 soil simulant, montmorillonite, calcium sulfate dihydrate, and calcium carbonate exposed to electrostatic discharge ESD. They focused on the C-H stretching vibrations between 2800 and 2900 cm−1 and the amino acid vibrations at 3100–3200 cm−1. They observed the level of detection within infrared spectra of natural organic molecules in the MGS-1 mixture was 0.5 − 2.0 wt %, much lower than that need for the amino acids (10.5 − 11.0 wt %). After 1, 3, and 5 h of ESD plasma reactions under simulated Mars conditions, the intensity of the DRIFTS spectra of pure organic compounds decreased but were still visible, including the CHx region. The amino acids were hard to detect in the calcium sulfate dihydrate mixture, but easier in the calcium carbonate mixture. The amino acid glycine was difficult to detect in all four mineral matrices, and in general the natural organic molecules such as cellulose, chitin, and chitosan were easier to detect than amino acids. The results from the current study add a new dimension to this line of research as the number of organic molecules possible for detection within a microbial mat outnumbers the single molecular signatures in other studies. As such, the detection of biotic organic molecules within geological materials from Mars will be much more likely if sourced from within a microbial community rather than from single remnant organic molecules, owing to the variety of spectral signatures possible and the spatial concentration of these molecules.
Biotic or abiotic?
Organic carbon compounds are essential building blocks of terrestrial life, so the occurrence and origin (biotic or abiotic) of organic compounds on Mars is of great significance to the potential of life on the planet. In Martian samples, therefore, how can we tell the difference between a biotic or abiotic organic absorption band in near-IR or FTIR spectra? In brief, we cannot. The CH2/CH3 aliphatic hydrocarbon region between 2800 and 3000 cm−1 is a useful area of the IR spectrum to observe as it is free of mineralogical absorptions and the molecules themselves are more resistant to degradation. In this study, we can confidently assign this region as biological in origin due its presence within the bacteria of the known microbial mat being analyzed. Yet, in a sample from another planetary body without a known biological provenance, this C-Hx region may be a red herring. Aliphatic hydrocarbons, producing a unique Near-IR reflectance band at ∼3.4 μm (2941 cm−1), have been detected on a range of astronomical bodies, including Ganymede (Tosi et al., 2023), Ceres (De Sanctis et al., 2017; Raponi et al., 2020), comet 67P (Capaccioni et al., 2015), and asteroid Ryugu (Kebukawa et al., 2023). However, these identifications are believed to be abiotic, created through endogenic processes.
To date, the source of reduced organic carbon on Mars is proposed to be through a combination of abiotic organic synthesis and from extraterrestrial carbonaceous material (Steele et al., 2016). The presence of several types of organic carbon compounds has been detected in near-surface materials at Gale Crater (e.g., Freissinet et al., 2015; Eigenbrode et al., 2018; Franz et al., 2020) and, most recently, at Jezero Crater (Sharma et al., 2023), all with a proposed abiotic formation. At Jezero crater, samples analyzed by both fluorescence and Raman spectroscopy from two formations identified organic material spatially associated with specific mineral assemblages. Sharma et al. (2023) proposed that the organic molecules may have been abiotically aqueously deposited or synthesized within altered volcanic materials. The Martian meteorite Allan Hills 84001 (ALH 84001) also contains complex refractory abiotic organic material associated with mineral assemblages that is formed by mineral carbonation and serpentinization reactions. Steele et al. (2022) proposed that they formed in situ during water–rock interactions on Mars.
Ultimately, identifying organic spectral fingerprints within a planetary sample should be viewed as a marker of a potentially habitable environment and from a site that is host to prebiotic chemistry, as abiotic organic molecules can be used in reactions to produce biologically important molecules and are used in biology itself. But only when found in connection with multiple other spectral signatures, in a conducive physical, chemical, and mineralogical environment for life, and when all other abiotic origins are ruled out, should a biological origin be considered.
Mars sample return
MSR is an exciting and ground-breaking next step in our understanding of the geological and potentially biological history of Mars, as analyzing samples in terrestrial laboratories will allow much more detailed and thorough studies than those possible in situ or from orbit on Mars. The scientific objectives of MSR as defined by Beaty et al (2019) include “Objective 2 (Life): Assess and interpret the potential biological history of Mars, including assaying returned samples for the evidence of life.” The subobjectives include the assessment and characterization of possible organic and prebiotic chemistry and the detection of biosignatures of both ancient and modern life. The final phase of the MSR concept involves receiving the samples on Earth, initial scientific exploration, and then further analysis by the international scientific community. This study has shown the benefits of using FTIR spectroscopy to analyze these returned samples as it can identify both mineralogical and organic signatures of mixed media samples within a single analysis using a small sample volume, and is a tried and tested technique for both terrestrial and extraterrestrial materials. As an added benefit, it’s a nondestructive, quick, and efficient technique that requires minimal to no sample preparation, which is ideal for initial sample characterizations and later science investigations.
The perseverance rover, designed for in situ science with the ability to collect a suite of samples for eventual return to Earth, has successfully dropped 10 sample tubes full of Martian geology at the “Three Forks” sample depot at Jezero Crater, with more drops planned. The types of samples within these tubes will be varied but are likely to include a mixture of geological substrates such as rock, regolith, and dust, as well as Martian gases. Martian organics are, in general, likely to be in very low concentration; Freissinet et al. (2015) reported up to 300 ppb of chlorobenzene at Gale crater. This study has emphasized the difficulty in finding and extracting spectral biological information from terrestrial geological samples, in sample volumes greater than that expected for Mars. As such, an increased understanding of the impacts of spectral congestion of mixed-media samples is needed to aid in finding the organic molecules hidden within mineralogical samples.
In many cases, the samples to be returned from Mars will be those that will be studied with no time limitation (see Tosca et al., 2022) with a goal to preserve as much as possible for future generations of researchers and technologies held in curation facilities for posterity (see Tait et al., 2022). This study has shown that, after removal from the natural environment, any biological material or organic molecules within the geological samples chosen for long-term storage should be preserved and remain detectable, at least through the use of mid-IR spectroscopy, for hundreds, perhaps thousands of years. Given that the curation protocols for extraterrestrial samples will likely be more stringent than those historically used for the herbarium samples of this study, it is hoped that there will be minimal organic material loss and maximum science return.
Conclusions
The detection and characterization of habitable environments, and even life itself, within ancient materials in planetary exploration requires the ability to identify biotic and abiotic organic molecules within geological materials. The key building blocks for life may have been present over an extended period of time on Mars, along with other as yet undetected chemical species, that could be preserved within potentially habitable paleo-depositional settings. The detection of these organic molecules within Martian samples is possible by utilizing FTIR and other vibrational spectroscopic techniques; however, definitive identification and confirmation of a biological or nonbiological origin will require the samples to be returned to Earth. This study has shown that: Ancient microbial mat samples can retain a range of organic molecules; identifiable through FTIR spectroscopy as absorption bands attributed to carbohydrates, lipids, proteins, and DNA/RNA. The C-Hx organic FTIR absorption bands are the same as those observed in abiotic samples. A biological origin in this study was assigned through known provenance of the samples, which is not so easily done for Mars. Organic absorption bands from Antarctic microbial mats can be observed in samples up to 1000 years old; however, their preservation isn’t related specifically to the age of the samples but also the environmental conditions they have been exposed to over time. A single cyanobacterial taxa microbial mat will produce a clearer, more detailed FTIR spectrum and may even enable taxa-specific identifications. Microbial mats commonly contain more than one taxon within the community creating a “typical” or “generic” bacterial IR spectrum representative of the entire mat colony rather than its individual inhabitants. A high concentration of organic matter, such as that found in microbial mat communities, is ideal for high sensitivity spectral detections; however, the amount of this material relative to the surrounding geological substrate will determine its detectability. The addition of 25% by volume Martian dust simulant enables continued detection of a range of cyanobacterial mat spectral biosignatures. In mixtures of 50% microbial mats, 50% Martian dust, almost all spectral organic biosignatures are masked by the minerals present. The organic signatures of aliphatic hydrocarbons ∼2800–3000 cm−1 (3.4 µm) in particular are a useful marker as no mineralogical or water absorptions are commonly found in this region, and they are some of the most resistant organic molecules over geological time.
Our experiments have allowed us to conclude that, should ancient microbial communities have existed on Mars, not only will their preserved remnants be likely buried within and have their organic signatures complicated by their geological surroundings but once identified will display a generic bacterial assignment. FTIR and other vibrational techniques during MSR activities will be excellent tools to identify nondestructively intriguing samples such as this for more detailed chemical and biological investigations, such as the extraction of preserved DNA. There is an inherent difficulty in spectrally finding and deciphering biological information from terrestrial geological samples as absorptions due to organics, which are usually present at only low levels and mixed in with mineralogical and/or hydrological absorptions, are expected to be very weak in both ATR and diffuse reflectance spectra and require high signal-to-noise measurements for their detection.
The Antarctic cyanobacterial mats of this study have been preserved in conditions (both natural and curatorial) that appear to have supported prolonged biomolecule stability and as such offer hope for astrobiological investigations and the long-term detectability of organic molecules. Through the vibrational techniques in this study and further work utilizing different analogous substrates and conditions of preservation, we hope to further understand and constrain both the mineralogical and organic features hidden within a range of spectrally congested geological mixtures in anticipation for MSR activities.
Footnotes
Acknowledgments
The authors would like to thank Lenka Rabova for help with the microscopy work of the herbarium specimens which was funded by a SYNTHESYS access grant. The authors are also thankful for the support of STFC for Connor Ballard.
Authors’ Contributions
L.J.P.: Conceptualization (lead); investigation (equal); writing—original draft (lead); formal analysis (lead); writing—review and editing (equal). A.D.J.: Resources—(equal); writing—review and editing (equal). W.M.: Formal analysis—(supporting); investigation (equal); writing—review and editing (equal). C.J.B.: Investigation (equal); writing—review and editing (equal). J.W.: Resources—(equal); writing—review and editing (equal).
Author Disclosure Statement
There are no conflicts of interest.
Funding Information
The authors would like to thank Lenka Rabova for help with the microscopy work of the herbarium specimens which was funded by a SYNTHESYS access grant. C.J.B. acknowledges the support of UK
Abbreviations Used
Associate Editor: Kathleen A. Campbell
Associate Editor: Kathleen A. Campbell