
Abstract
Derived from the notion of algorithmic bias, it is possible that creating user segments such as personas from data results in over- or under-representing certain segments (FAIRNESS), does not properly represent the diversity of the user populations (DIVERSITY), or produces inconsistent results when hyperparameters are changed (CONSISTENCY). Collecting user data on 363M video views from a global news and media organization, we compare personas created from this data using different algorithms. Results indicate that the algorithms fall into two groups: those that generate personas with low diversity–high fairness and those that generate personas with high diversity–low fairness. The algorithms that rank high on diversity tend to rank low on fairness (Spearman's correlation: −0.83). The algorithm that best balances diversity, fairness, and consistency is Spectral Embedding. The results imply that the choice of algorithm is a crucial step in data-driven user segmentation, because the algorithm fundamentally impacts the demographic attributes of the generated personas and thus influences how decision makers view the user population. The results have implications for algorithmic bias in user segmentation and creating user segments that not only consider commercial segmentation criteria but also consider criteria derived from ethical discussions in the computing community.
Introduction
Conceptual underpinnings
Personas, introduced to computer science and human–computer interaction (HCI) by Cooper, 1 are defined as fictitious people who represent real user and customer types. Researchers believe that personas evoke a sense of empathy2,3 that directs product and user experience designers, software developers, marketers, and other stakeholders to make more user-centric decisions regarding products, services, and other outputs offered to end-users and customers. Personas are, therefore, a personified form of user segmentation, that is, dividing the overall user or customer population into demographically or behaviorally defined segments. 4
Algorithmic personas (APs) are developed from quantitative data to represent demographic and behavioral characteristics of the user base. 5 Consequently, AP generation is the employment of algorithms and big data to create personas. 6 The promise of algorithms for persona generation was observed first by Aoyama in two articles from 20057 and 2007. 8 McGinn and Kotamraju applied an algorithmic approach for personas in their seminal article in 2008. 6 Since then, AP generation has become increasingly common in HCI, marketing, 9 health informatics,10,11 cybersecurity, 12 video game studies,13,14 and many other domains that use personified user segmentation for understanding users or customers.
The shift from manually created personas to APs has been characterized as transformative, 15 as AP generation can address the challenge of analyzing large collections of personified big data 16 from social media and online analytics platforms, making sense of this big user data. Manual methods are ill-equipped to analyze such amounts of user data for user segmentation and persona generation. Rapid changes in online user behavior exacerbate the challenge, as these changes require APs to be constantly updated to keep up with the user behaviors and characteristics. 17 Thus, scalable and efficient user segmentation algorithms are beneficial for transforming this data into persona profiles (Fig. 1) or other forms of user segments that describe the user populations' key behaviors and demographics.
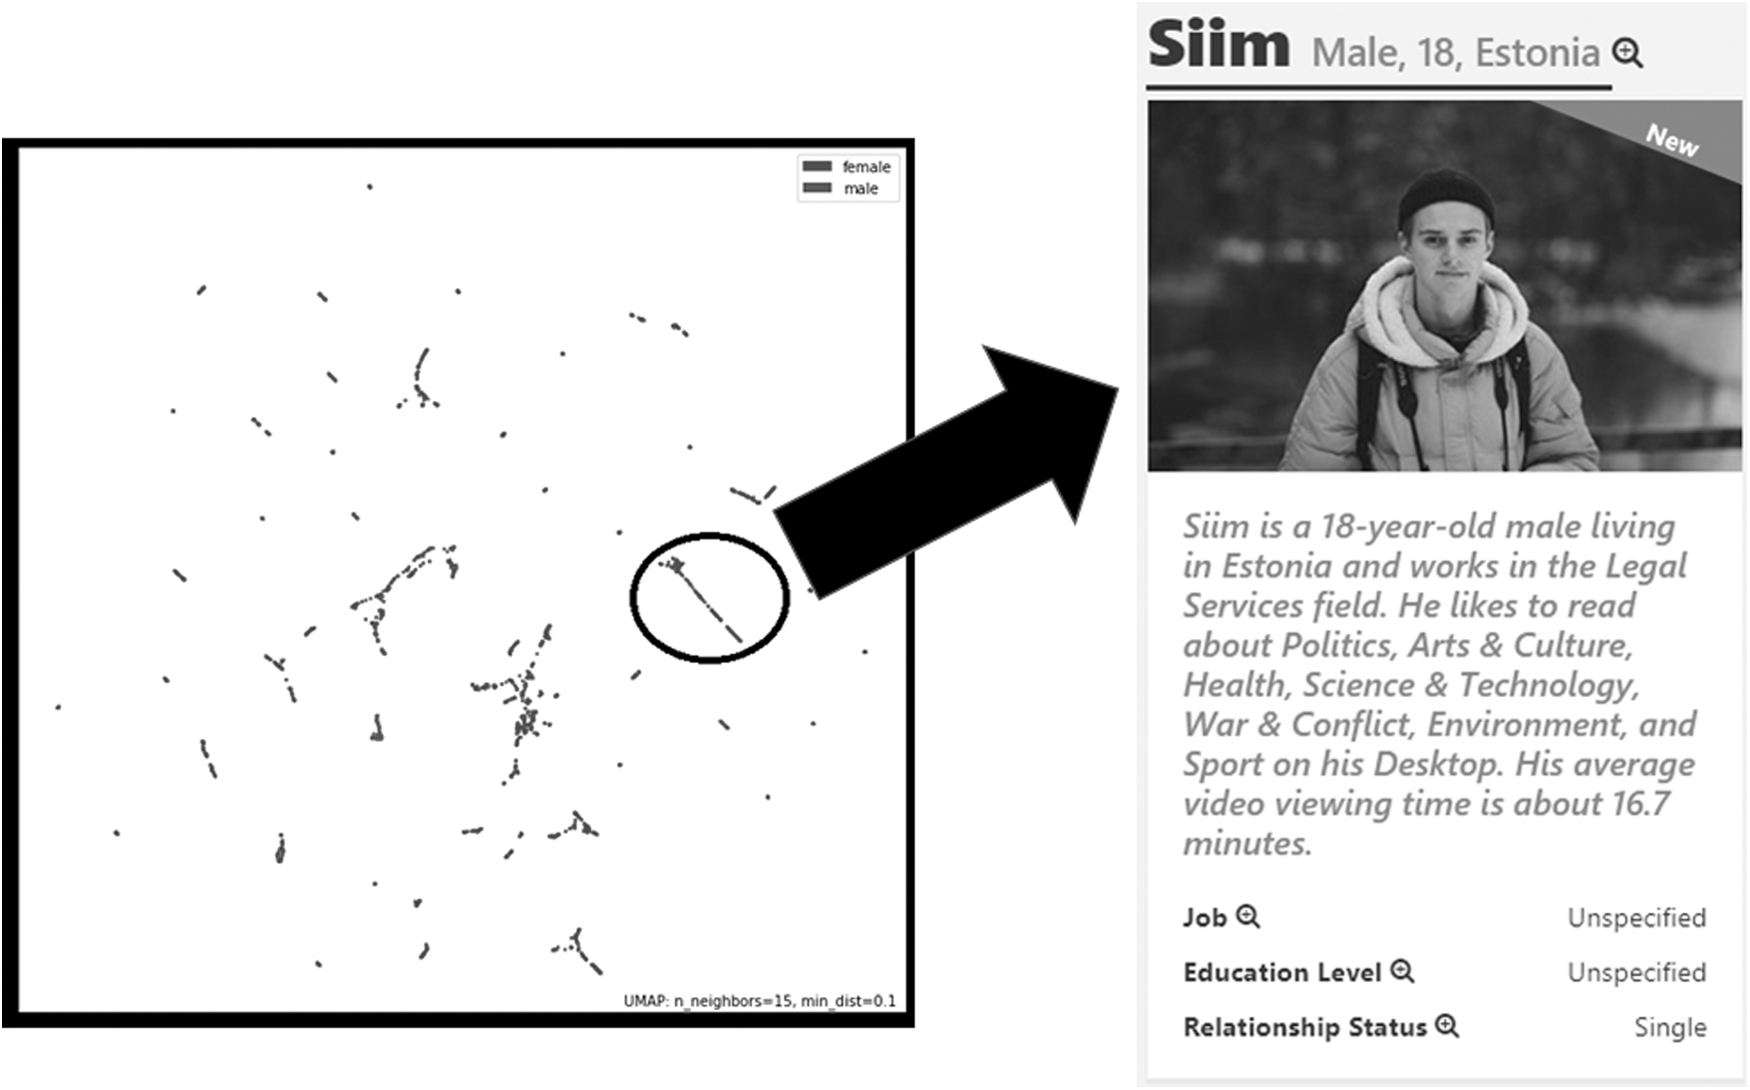
Creating a persona from data using DR. The left-side figure shows DR using the UMAP algorithm on the dataset collected for this study. The right-side figure shows Siim, an algorithmic persona that corresponds to the pattern circled in the left-side figure. Different algorithms may identify different patterns in the data, but previous research has not examined how this affects the composition of the generated personas. DR, dimensionality reduction; UMAP, Uniform Manifold Approximation and Projection.
Since the introduction of data-driven personas, 6 researchers have applied a wide range of algorithms for persona generation,13,18–23 the most common being clustering (grouping users in a way that users in the same group are more similar to each other than to users in other groups), principal component analysis (PCA) (summarizing the user information into smaller summary indices that aim at capturing most user information in a computationally efficient format), non-negative matrix factorization (NMF) (similar to PCA, NMF reduces user data from a higher dimensionality to a lower dimensionality that captures essential behavioral and/or demographic information), and latent semantic analysis (LSA) (identifying associations between a set of users and the content they are interested in by producing a set of latent concepts related to the users and content). 24
In their review of literature, Zhu et al 23 report the use of decision trees, exploratory factor analysis, hierarchical clustering, k-means clustering, LSA, multidimensional scaling analysis, and weighted graphs for persona development. Minichiello et al 21 provide a similar list of methods: cluster analysis (CA), factor analysis, PCA, and LSA. A shared trait of these methods is the attempt to simplify the user population into segments that are then transformed (“enriched”), one way or another, into finalized persona profiles for end-users (see Figs. 1 and 2).
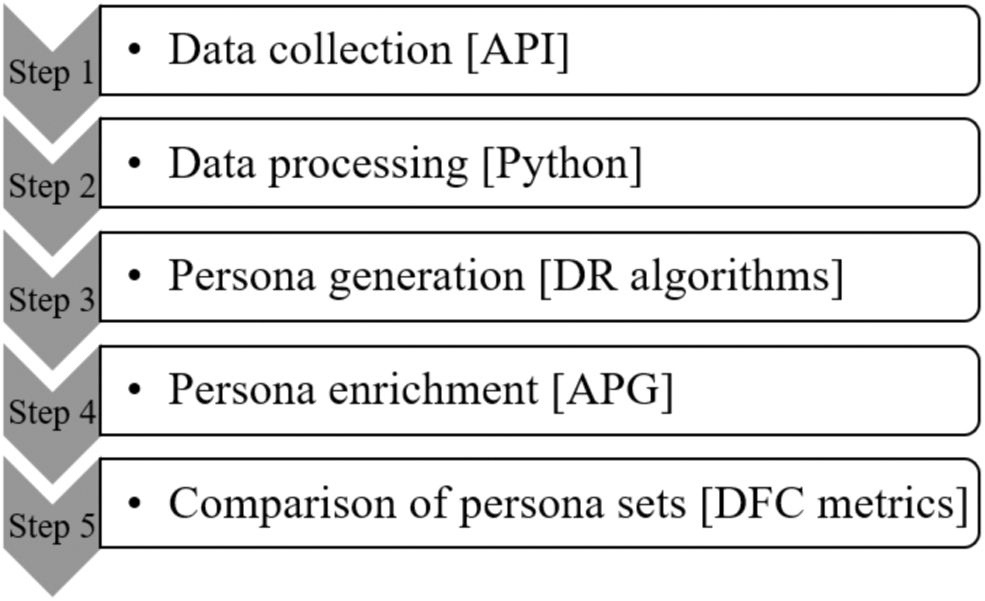
The algorithmic persona generation process. APG, automatic persona generation; API, application programming interface; DFC, diversity, fairness, consistency.
Research problem
This collaborative process of persona generation between humans and algorithms involves multiple challenges. Although the algorithmic process is opaque to humans, they need to trust that the algorithm performs in a desirable way—that is, not exacerbating demographic biases in the data or favor one group over another when selecting traits for the personas or segments. In the following, we detail three important research problems (RPs) and our approaches to address these problems in the current study.
First, there is a lack of studies comparing algorithms for persona generation (RP1). Apart from a brief comparison by Brickey et al, 18 none of the studies address what kind of personas different algorithms produce. The lack of studies poses a major hindrance for understanding how the choice of algorithm affects persona generation and whether there is a risk for algorithmic bias in persona generation (and user segmentation in general).
Second, there is a lack of using non-accuracy metrics for persona evaluation (RP2). What we mean by this is that apart from 25 that evaluated inclusivity, quantitative persona studies tend to focus on evaluating personas' technical accuracy26,27 as opposed to what kind of personas are generated. However, the characteristics of the generated personas matter because persona traits (e.g., age, gender, ethnicity) risk aggravating stereotypical thinking about user populations.28,29
Third, there is a general lack of sharing resources for persona generation (RP3). The lack of publicly available resources—code, data, algorithms, computational notebooks—poses a major hindrance to research on data-driven personas 24 and the broader field of user segmentation. Even though making results are resources available for others is a basic principle for scientific progress, 30 a few data-driven persona studies have made their resources available for others, thus limiting their contribution to the field.
To address RP1, we conduct an experimental study where we fix the (a) dataset, (b) the number of personas generated, and (c) the method of enriching the personas, only varying the algorithm that processes the baseline user data. Although several effects of algorithms on persona generation (and more broadly on customer segmentation) could be examined, including, for example, accuracy, computational efficiency, or run-time, we focus on studying the effect of algorithm on model outputs, that is, the generated personas. We specifically address the effect of algorithm on the demographics of the persona set—we choose demographics as the unit of analysis because of their widespread use in both persona generation and customer segmentation overall.
To address RP2, we examine three aspects vital to decision makers interested in personas for representing their user, audience, or customer base. These aspects are diversity (i.e., the personas cover many unique characteristics found the user base), fairness (i.e., the personas truthfully reflect the underlying data on the users), and consistency (i.e., the algorithm retains central persona traits when changing the hyperparameters). We refer to these design goals for data-driven personas and customer segments as the diversity, fairness, consistency (DFC) criteria.
To address RP3, we make the resources (code, data, algorithms) available in an online repository † to further advance empirical persona generation and customer segmentation experiments. To protect business sensitive information, the data are made available in a scrambled format.
Building on the earlier reasonings, our research question is: How do diversity, fairness, and consistency of the generated personas' demographic attributes vary by algorithm? The results have implications for creating more diverse, fair, and consistent personas (and other forms of user segments) from digital user data. Our results inform persona developers (and marketers) of the strengths and weaknesses of different algorithms when applied to persona generation (or customer segmentation).
They also provide wider implications for the potential of algorithmic bias when using algorithms for user or customer segmentation and draw attention to the use of non-commercial segmentation criteria influenced by the fairness/bias discussion going on in the computer science and HCI communities, 31 which has not thus far been addressed in the persona generation and customer segmentation domains. The main contributions include the following: (a) Providing the most extensive comparative study to date, comparing six different algorithms for persona generation; (b) introducing and applying novel evaluation metrics in the persona generation context, while also providing suggestions for applying different algorithms for different objectives; and (c) sharing computational resources to further persona generation research and development.
Literature Review
Table 1 shows a list of commonly applied persona generation algorithms based on a sample of 63 research papers. The sample of articles was obtained as follows. First, we searched two major academic services: Google Scholar and ACM Digital Library. We used search phrases relating to persona generation (“algorithmic personas,” “data-driven personas,” “quantitative personas,” “procedural personas”). The found articles were manually screened by reading the abstracts. We excluded articles if they were not (a) full research articles written in English, (b) published in a peer-reviewed journal or conference, and (c) developed personas using data-driven approaches. We also carried out snowball sampling to fully account for relevant literature. 32
Top 5 methods for algorithmic persona generation from literature review
Percentages are of total reviewed articles. The rest (N = 21, 33.3%) are classified as “Other.”
CA, cluster analysis; LDA, Latent Dirichlet allocation; LSA, latent semantic analysis; NMF, non-negative matrix factorization; PCA, principal component analysis.
In total, the database searches and snowballing yielded 163 articles for full-text screening. For the screening, we applied the same criteria (a–c). After the full-text review, a set of 63 final articles remained. We then reviewed these articles to identify the algorithm(s) applied.
From the reviewed articles, we identified five commonly used algorithms for persona generation: (1) CA, (2) PCA, (3) LSA, (4) NMF, and (5) Latent Dirichlet allocation (LDA). Table 1 provides an overview of these algorithms and the studies adopting them. The use of the five algorithms for persona generation is discussed in the following subsections. A technical description of each algorithm and their implementation for this study is given in Appendix A1. The focus of this study is not on the technical traits of these algorithms but on their implications for APs and user segmentation in general.
Clustering
Tanenbaum et al 33 utilized CA (k-means) to develop personas of diabetes patients and gauge patients' readiness for adopting different medical interventions. Validation was done by calculating the Euclidean distance between the different variables and conducting Chi-squared tests. Wang et al 34 also calculated Euclidean distances of different medical and demographic variables for their analysis of regional health data. A few articles qualitatively validated clusters by engaging subject experts as well as users themselves in reviewing the cluster results.23,35,36
These individuals were tasked with assessing how representative the generated clusters were of real-life scenarios. An et al37,38 applied CA (k-means) for persona generation, and they observed that using individual-level data is expensive to collect and has concerns regarding privacy. However, the researchers did not address what kind of personas different algorithms would produce.
Kwak et al, 39 using CA (k-means), found the limitation that a single demographic group must fall into one persona. In contrast, various personas can be found from one demographic group, as people in the same demographic group often behave differently. A potential issue of CA is the “need for specialists to use expert judgment during clustering [to define hyperparameters].”21(p.19) However, this issue concerns other algorithms, too, as persona developers typically need to set the number of personas as part of the process.
Miaskiewicz et al 40 and Mesgari et al 41 applied hierarchical CA to develop clusters (and ultimately personas) of university members' experiences with learning management and institutional knowledge systems. Both studies validated their results by looking at the relations between variables within clusters. The former calculated cosine similarity (of the angles between pairs of non-zero vectors), whereas the latter calculated Pearson correlation (the extent of a linear relationship between two variables).
Holden et al 42 used hierarchical CA to analyze the medical and psycho-social variables of older adults with heart failure. Results were validated using the Kruskal–Wallis test and Welch's analysis of variance (ANOVA) to determine statistical significance between the variables as well as testing for variance, respectively. However, the researchers did not address what kind of personas different algorithms would produce.
Principal component analysis
The PCA was used for persona generation by Sinha, 43 who created personas based on users' characteristics. Wang et al 34 used PCA in combination with CA to develop health personas of regional groups. Similarly, Brickey et al 18 used PCA in combination with LSA and CA to develop personas for users of an army knowledge management system. As such, the combination of this method with others is prevalent. In fact, all of the found studies that applied PCA complemented it with at least one other quantitative method.
As a result, validation metrics also varied and included Cohen's kappa (a statistical measure of interrater agreement of generated vs. expert clusters),
18
Euclidean distances of different variables,
34
Spearman's
Latent semantic analysis
Apart from the aforementioned studies,18,40,46 Dupree et al 47 used LSA to investigate attitudes toward digital privacy and cybersecurity among university students, and they recruited a separate population (different from initial survey participants) to review the developed personas. 47 The evaluation focused on tasking individuals with self-identifying with one of the five personas and providing feedback on how realistic they were. However, the researchers did not address what kind of personas different algorithms would produce.
Non-negative matrix factorization
An et al48,49 used NMF to decompose an interaction matrix constructed from the view counts of an organization's social media content. They obtained latent content consumption patterns, associating each distinctive behavior pattern with demographics of users (i.e., age, gender, country) by a weight assessment that encodes the strength of the relationship between the demographic groups and the underlying pattern. The demographic group with the highest NMF weight was chosen as the representative persona demographics for its corresponding behavioral video-viewing pattern.
The demographic group was then augmented with a name, occupation, photo, and other characteristics, yielding complete persona profiles. Similar approach was applied in other studies from the same research team,17,50–54 with the general goal of developing personas from social media user statistics. However, the researchers did not address what kind of personas different algorithms would produce. For evaluation, rankings of the generated demographics groups in these studies were compared with true rankings based on real content engagements using Kendall rank correlation coefficient. 49
Researchers identified discriminative content for personas (i.e., content that a persona has a higher chance of engaging with compared to other personas) using a Chi-square test. 38 Also, cosine similarity has been applied to calculate among pairs of personas until the closest pairs are determined. 48 Further, Salminen et al 54 used qualitative data of social media users in a geographical region in the forms of Instagram profiles and semi-structured interviews to create what they term as “hybrid personas” (the core algorithm being NMF).
Qualitative research was used to enrich further and improve their hybrid personas. However, the researchers did not address what kind of personas different algorithms would produce.
Latent Dirichlet allocation
The LDA was utilized in two studies49,50 to understand the viewing behavior of different demographic groups and develop user personas for a YouTube channel. In the two studies, the authors built LDA topic models to construct matrices (in combination with NMF). Dhakad et al 55 developed buyer personas from click logs on an e-commerce portal. They employed LDA to model persona preferences for different occasions by sampling fashion styles and relevant fashion items across online shoppers' activity. Further, Smith and Nayar 56 used LDA to develop gaming personas based on controller input data from video game analytics systems. However, the researchers did not address what kind of personas different algorithms would produce.
Methodology
Research design
Conceptually, our research methodology uses different algorithms on the same dataset to produce sets of 5, 10, and 15 segments that are the bases for the personas (common numbers used in persona research48,49). We complete the persona generation using a standardized approach to fully generate persona profiles with a name, picture, age, gender, country, interests, and other information. We then compare these sets of personas using three quantitative metrics (see the Evaluation Metrics section) to examine how the generated personas differ by algorithm. The process is as follows, with a technical approach mentioned in parentheses:
The experiment set-up is as follows: each algorithm processes the same data using the same number of segments (N = {5, 10, 15}), and we then enrich these segments using the same algorithmic process of assigning demographics and other information. In total, there are
Note that the same enrichment process is employed, producing 5, 10, and 15 personas for each algorithm. Fifteen personas is more than the conventional number of “less than 10 personas” widely cited in the HCI literature.1,3,57,58 In this study, we consider the higher number of personas sensible, as many organizations deal with large and diverse online audiences that cannot be captured in a handful of personas. The outcome of the data collection and application of the algorithms is a collection of datasets representing the main segments or dimensions in the data.
Data collection and pre-processing
We partner with an international news and media organization with 5.08 M subscribers at the time of writing (April 2020) to collect a dataset that contains both behavioral (i.e., what videos were viewed and how many times) and demographic statistics about users. We collect the data from the organization's YouTube Channel by leveraging the YouTube Analytics Application Programming Interface. ‡ The dataset contains 363M views for 12.3K videos published between March 2007 and December 2019.
The justification for the dataset in terms of helping us achieve our research goals relies on the following rationale: (a) the dataset is large (typical for online user data), (b) its structure is typical for Web analytics platforms (e.g., Google Analytics and Facebook Insights provide the same output), and (c) its analysis extends beyond what can be done manually, requiring algorithmic processing to build robust personas. Also, (d) this dataset is typical for many large online businesses that generate much content or have many products/pages to offer.
The distributions of view counts by gender and age are shown in Figure 3. Geographic distribution is shown in Figure 3c.
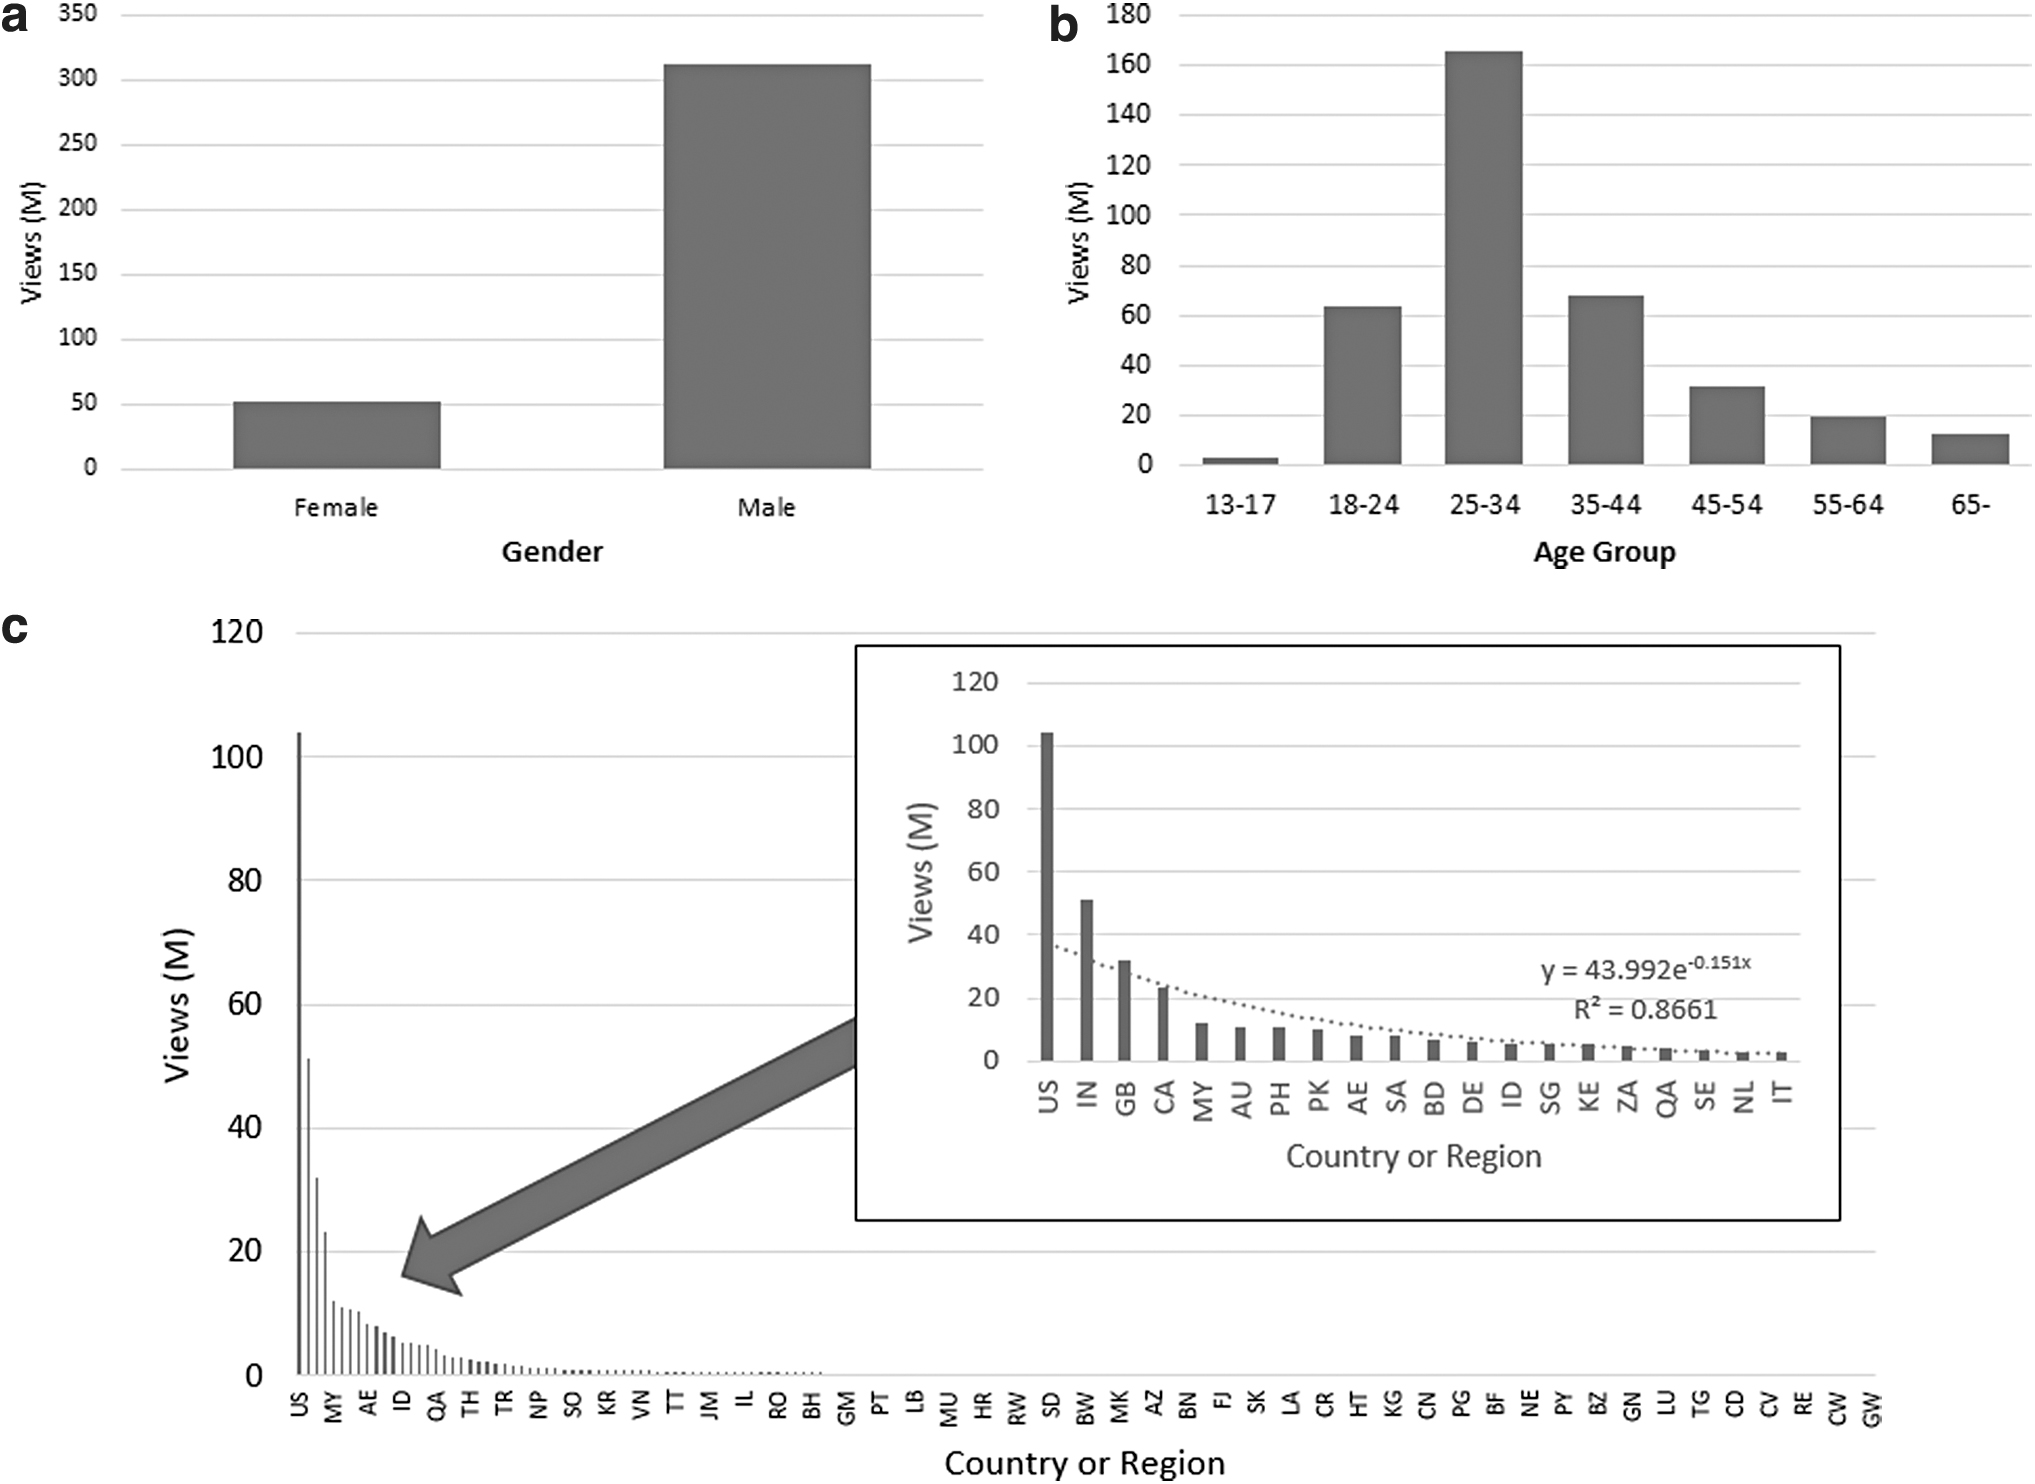
Distribution of video view counts by
After collecting the user data from an online analytics platform, the data are transformed into an interaction matrix that captures the engagement between user groups (rows) and the content items (columns). In this dataset, the content indicates online videos, but depending on the dataset, the content can be webpages, e-commerce products, flight destinations, or other entities of interest.
The cell values in the interaction matrix indicate the number of interactions that a given demographic group (row) has for a given content (column). The demographic groups come from the online analytics and social media analytics platforms that use this grouping to aggregate user data and to protect the privacy of individual users. The age buckets used by these platforms—for example, YouTube Analytics, Google Analytics, and Facebook Insights—include 13–17, 18–24, 25–34, 35–44, 45–54, 55–64, and 65+. These groups are used to set up the interaction matrix.
For example, the demographic group “Finnish, 35–44, Male” can have 1200 views for “Video ABC.” Thus, the values of the matrix are counts (15, 4000, 55,867, …), always either positive or zero. Many demographic groups typically have zero values for a given content, but this sparsity depends on the dataset. In our data matrix, 98.764% of the values are zeros, indicating high sparsity (the more content and demographic groups there are, the higher the sparsity tends to be because not all groups would be interested in all content).
Figure 4 provides a more formal explanation using the example of the NMF algorithm. In Figure 4,
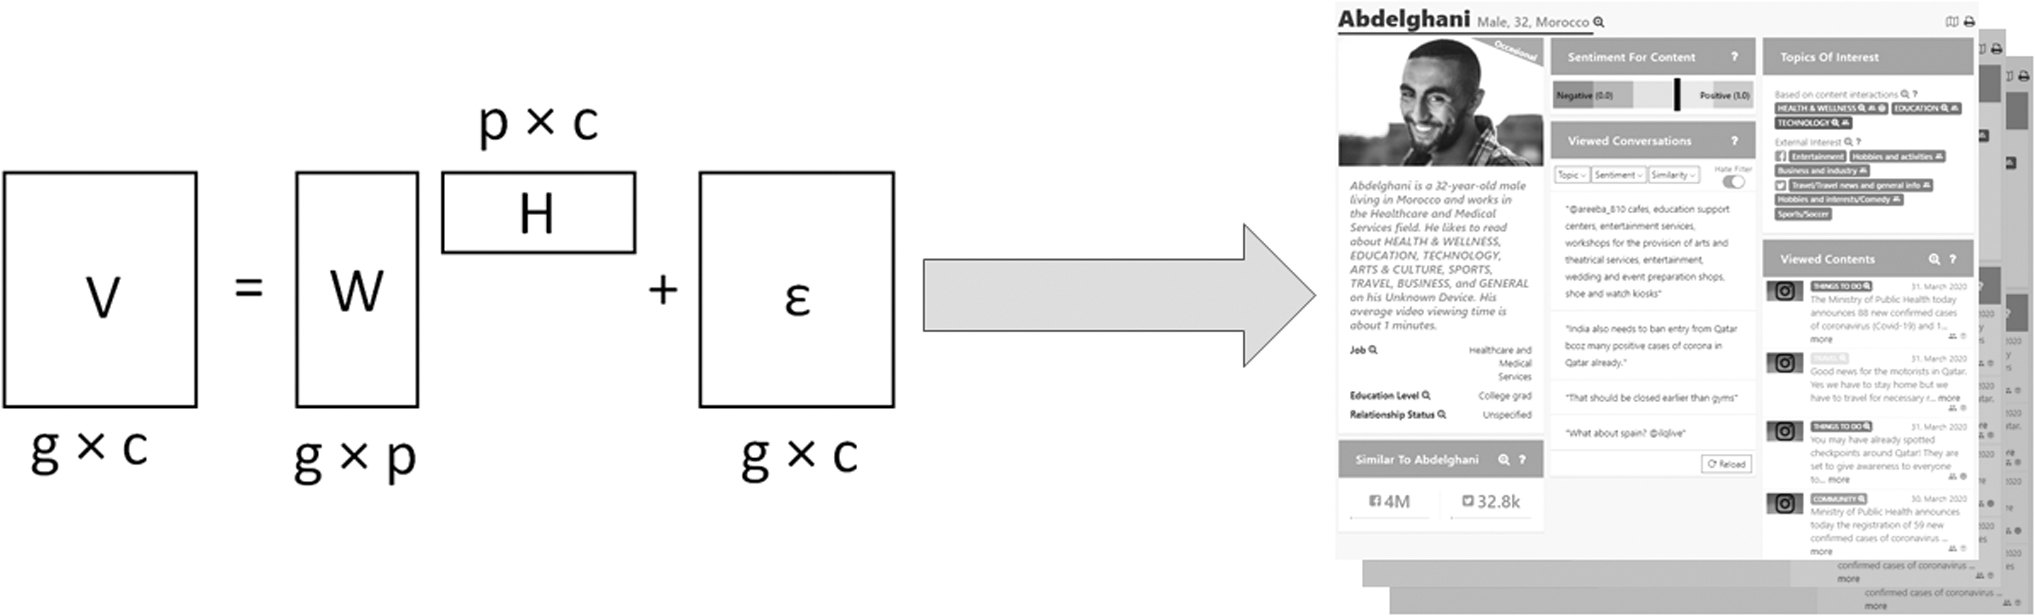
Automatic persona generation. A user segmentation algorithm derives latent patterns from user data (left-hand side of the illustration). The APG then enriches these latent patterns with personified information such as name, picture, demographics, and so on (right-hand side of the illustration).
Each algorithm independently processes this interaction matrix, finding p patterns (clusters, segments, components), where p = {5, 10, 15}. In this case, because the content is online videos, the segmentation aims at preserving information on the video viewing behaviors of different demographic groups. These p segments become p personas when they are enriched by personified information (e.g., name, picture, topics of interest) to create the final personas.
Personification and enrichment are standard procedures for persona generation6,21,60; without it, the segments would remain as nameless and faceless user representations—the general benefit of personification is that human attributes increase stakeholders' empathy toward the segment that the persona represents, 61 whereas enrichment provides a more rounded, detailed information about the persona. 2
Persona generation
For the enrichment, we use automatic persona generation § (APG), a system for APG. This system has numerous advantages, including standardization. What this means in our experiments is that all outputs by the algorithms undergo the same enrichment process that involves no manual intervention. For example, each piece of content is topically classified (explained in An et al 49 ), providing topics of interest for each persona.
Based on the outputs, APG chooses a representative demographic group for each latent pattern and enriches this demographic group with personified and other information (picture, name, topics of interest, quotes, etc.) to create a complete persona profile (Fig. 4). The result is a distinct set of personas based on behavioral and demographic attributes of the user population. Note that APG's procedure for assigning the demographic group is identical and deterministic—with the given data and algorithm, a set of p personas will always have the same age, gender, and country when using APG for persona generation. As the only variable that changes in the process of our experiment is the algorithm, the differences in the generated personas stem from the algorithms. For a more detailed explanation and validation of APG, see An et al.48,49
Choice and implementation of algorithms
The algorithms identified for persona generation in this study are described in Table 2. Out of the chosen algorithms, CA, PCA, NMF, and LDA have previously been applied for persona generation. The LSA was not selected because it is a type of matrix factorization algorithm (using singular value decomposition), and we already selected NMF for testing. Because we also wanted to test new methods for persona generation, we selected two novel (as in previously not applied for APs) algorithms: Uniform Manifold Approximation and Projection (UMAP) and Spectral Embedding (SE).
Properties of the chosen algorithms
Topology Preservation means whether the algorithm preserves the structure of the data: if two items are neighbors in the high dimension, will they also be neighbors in the low dimension. Global/Local: whether the algorithm tries to preserve global structure or local interactions. Usually, linear algorithms focus on global and non-linear ones on local. Impact of dimensionality: what the impact of the original dimension size is. For example, PCA and NMF work well for millions of dimensions, whereas CA quickly becomes inoperable.
L, linear; N, non-linear; SE, Spectral Embedding; UMAP, Uniform Manifold Approximation and Projection.
Given our analysis of existing algorithms, these two seem like next logical algorithms for persona generation to take on. Thus, we ended up with six algorithms to test. The chosen algorithms support the goals of this study for multiple reasons: they (a) represent the most often used algorithms in persona research, so comparing them is relevant; (b) are standard approaches in computer science, which affords implementation and replicability in future studies; (c) involve variability (Table 2), which means that the comparison is likely to result in meaningful differences (e.g., in terms of linear and non-linear algorithms); and (d) are readily available in software packages and data science libraries, which facilitates their deployment in persona generation projects in practice. The specific implementation we use for each algorithm is explained in Appendix A1.
Evaluation metrics
Reasoning
The generated persona sets are compared by three metrics, explained in the following subsections. The metrics that we propose for this problem are vital for data-driven personas and customer segmentation in general, because they address non-commercial and ethical aspects of segmentation efforts, areas that are lacking attention in these problem domains but that are broadly acknowledged as important within the computer science community.62,63,64
Diversity matters as a user segmentation goal, because the segments should represent demographically diverse groups of people. If they do not, decision makers may end up receiving information about only select groups and thus ignore the needs and wants of other groups, posing disadvantage to those groups. As put by Drosou et al,31(p.73) “diversity [is] an important component of a data-responsible society.”
Fairness is understood in terms of equity (“equity is defined as the quality of being fair and impartial**”) so that the demographic segment's probability of being included in a finite number of segments shown to decision makers should reflect the segment's share of voice (i.e., representativeness, size, importance) in the baseline dataset, meaning the dataset that the user segments are created from. If a segment is highly prevalent in the baseline data but hardly visible among the segments, that would not be a fair (or equitable) representation of the data.
Consistency matters because one would expect that if making changes to the algorithm's parameters, such as the number of segments created, on different runs of the algorithm the same or similar segments should be identified by the algorithm. If the algorithm instead identifies very different segments at each run, it is behaving in an unstable or random way and its outputs should be less trusted than those of a more consistent algorithm.
Regarding the interpretation of the obtained scores, high diversity indicates that a lot of different demographic groups are represented in the generated personas (segments). High fairness indicates that the generated personas (segments) correspond well with the most engaged users in the source data. High consistency indicates that the personas (segments) generated using a smaller number of personas (segments) appear also when changing the hyperparameter to higher number of personas (segments), thereby indicating higher reliability that these particular segments are important—or otherwise put, that the algorithm is not randomly selecting the segments.
Diversity
We use the count of unique attributes for comparing diversity. The count of unique attributes (D) is the number of persona attribute values (age groups, genders, countries) present in each persona set. For 15 personas, a value such as
For example,
Fairness
We use statistical parity (SP) for measuring fairness. Fairness assessments in machine learning tend to focus on prediction or classification.62,65 However, persona generation is not a classification task, but an unsupervised learning task. However, we can apply the existing principles from computing studies developing tools for fairness assessment. For example, Dwork et al 62 propose that individual fairness is defined such that similar individuals are treated similarly. In its more elementary interpretation, this implies that a member i in Group A that has the same characteristics (e.g., race, gender) as a member j in Group B will have an equal probability of succeeding (e.g., being chosen for a job).
A classic example of analyzing fairness is using personal attributes such as gender or race to predict whether a person is rich or not (e.g., 50k+ annual salary or not). In the case of personas or customer segmentation in general, the analogy of demographic groups being significant is the question, “what is the probability of this demographic class being selected by the algorithm among the generated personas?.”
There are (at least) two ways to approach this issue 64 : equality and equity. Equality would translate to any demographic group having the same expected probability of being included in the generated persona set. An equity-based approach would translate to some groups having a higher expected probability of being included in the personas, because of their special needs or other factors. In our setting, we apply the equity-based approach, and the “other factor” is the demographic group's share of the engagements in the baseline data.
This means that demographic segments with more views are expected to have a higher chance of appearing in the persona set—this is fair because it corresponds to a truthful representation of the user population. Although fairness criteria are always subject to some degree of relativism, for the objective of finding the bias of algorithms, an essential question is “If 30% of the total views come from the US, then is it fair to say that 30% of the personas in the persona set should be from the US?.” If this statement is fair, then SP is an appropriate fairness indicator. 62
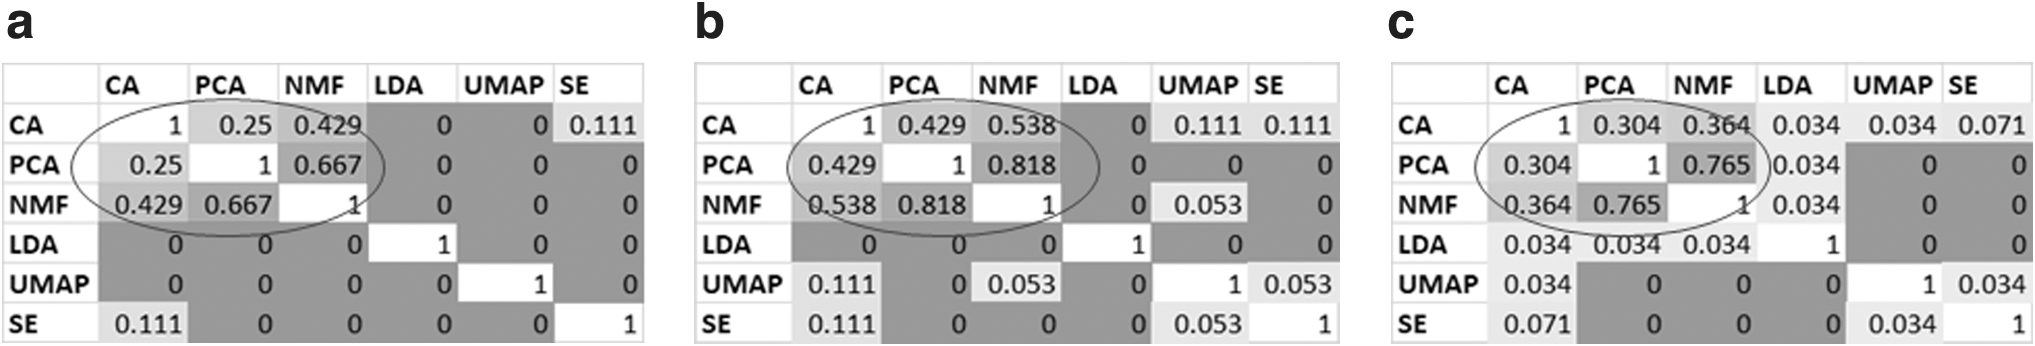
Therefore, we calculate SP as the difference between two values:
where SP for a given demographic attribute i (e.g., p = “Male”) is its fraction in the persona set P divided by the corresponding fraction of that demographic group's engagement counts (n) from the total N engagements. For example, if five personas are from the United States in a persona set of 10, then 50% of the personas are from the United States. Given that 30% of the views in the original data are from the United States, the value will be SP = 0.5 – 0.3 = 0.2. The total SP is calculated by taking an average across all demographic attribute values.
Consistency
The notion of consistency matters, because some researchers have found personas to be abstract and inconsistent. 66 For example, if the personas included in a 5-persona set would be very different from the 10-persona set, this would call into question the validity of the method. To evaluate how consistent the generated personas are, we computed a Consistency Score (CS) for each algorithm. For this, we take the demographic groups an algorithm generates in the 5 persona set, and we compare how many are the same as in the 10 persona set; then, comparing the 10-persona set with 15 personas.
For example, if all five demographic groups are in the 10 persona set, the score is 1.00. We carry out this calculation three times: comparing 5 personas with 10 personas, 10 personas with 15 personas, and 5 personas with 15 personas. In other words, we also calculate how many demographic groups from the 10 persona set are in the 15 persona set, and how many from the 5 persona set are in the 15 persona set. Thus, we end up with three fractions (e.g., 1.00, 0.80, 0.20)—their average is the final CS.
Using the number of personas is appropriate here since the number of segments is the major hyperparameter shared by all the unsupervised algorithms tested here (hyperparameter refers to an external value of a given parameter that is set by the research as opposed to being internally optimized by the algorithm itself).
Formally, the CS used in our study can be expressed as follows. Let us have three persona sets, denoted Set A, Set B, and Set C. The number of personas in Set A is nA. The number of personas in Set B is nB. The number of personas in Set C is nC. Without loss of generality, we set
Then, the CS for each algorithm is calculated as follows:
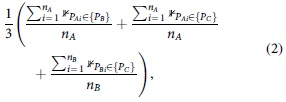
where
Note that, to obtain each fraction, we divide by the lower persona set. For example, when comparing the 5 persona set and the 10 persona set, if there are five matches (which is the maximum possible), we divide by 5 (not 10). The maximum of CS is, therefore, 5/5 + 5/5 + 10/10 = 3, and 3/3 = 1. Also, note that we consider a demographic group match only once. For example, if “Male, 65+, USA” appears once in 5 persona set and it appears three times in the 15 persona set, we count one match, as we consider that group represented at least once.
The above formula shows the special case of the CS metric for our study; the general case of the CS is provided in Appendix A2.
Results
Diversity
The diversity results are shown in Table 3. Results from a two-factor repeated-measures ANOVA show that the algorithms significantly differ by their D values, F(5, 10) = 12.49, p < 0.001. The algorithms with the highest D values tend to be LDA, UMAP, and SE. A post hoc analysis (Welch's t-test) indicates that algorithms in Group 1: LDA, UMAP, and SE generate significantly more unique persona attributes (M = 16) than algorithms in Group 2: CA, PCA, NMF (M = 11), t(13.79) = −2.45, p = 0.028. The observed effect size (d = 1.16) indicates that the magnitude of the difference between the groups is large.
Diversity results
Higher is better. For example, the value of 2 for CA, 15 personas (first column, third row from the bottom) indicates that among the 15 personas, CA generated personas from two different age groups. “Total” indicates the sum of unique age groups, genders, and countries. Highest total values of diversity bolded.
For the five personas set, LDA produces personas with 57.1% more unique demographic attributes than CA, PCA, and NMF. For the 10 personas set, LDA and UMAP produce personas with 70.0% more unique demographic attributes than CA and 54.5% more than PCA and NMF. For the 15 personas set, LDA and UMAP produce personas with 83.3% more unique demographic attributes than CA, 46.7% more than PCA, and 37.5% more than NMF.
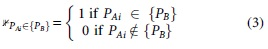
In terms of age, two rare age groups are the youngest (13–17) and the oldest (65+) age group. The age group 13–17 appears in five persona sets (LDA5, LDA10, UMAP5, UMAP10, and UMAP15), whereas the age group 65+ only appears in three persona sets (UMAP10, UMAP15, and SE15). An example of a persona from this age group is shown in Figure 5c. Although the age groups of these personas are less common, the countries of the generated personas tend to belong to the Top-10 countries in the baseline data, with the curious exception of Antigua and Barbuda. Interestingly, none of the persona sets contain personas from all age groups, implying that more personas beyond the number of 15 are needed to cover all age groups in the data.
“Three personas you would otherwise not see.” Among the examples of personas with unique demographics, there is only one persona from Ireland
All the algorithms generate personas from both genders, apart from two cases, in which none of the personas generated by the algorithm were female: CA5, and LDA15 (Table 3).
The countries of the personas show an interesting finding in that some of the algorithms generate personas that also represent fringe geographics, that is, countries that have a very low proportion of views in the baseline data. LDA, UMAP, and SE account for most of the marginalized personas, examples shown in Figure 5. For example, view counts from users from Finland are only 0.145% of the total view counts; however, UMAP15 generates as Finnish persona (Fig. 5b).
Fairness
Fairness results are shown in Table 4. A two-factor repeated-measures ANOVA shows that the algorithms significantly differ by their SP scores, F(5, 10) = 8.21, p = 0.003. The lowest SP scores (reversely, the highest fairness) tend to be among CA, PCA, and NMF. Similarly, the persona sets significantly differ by their SP scores, F(2, 10) = 19.28, p < 0.001. This indicates that the number of personas affects the diversity scores. However, unlike in the case of diversity, the best fairness values are obtained with 10 personas. As with D, the post hoc analysis indicates two distinct groups emerging from the fairness results.
Statistical parity scores
Lower is better (closer to the baseline data). The lowest numbers bolded. The values were obtained as follows: (a) First, we converted all the negative SP values to their absolute values. Then, (b) we calculated the mean of SP for each algorithm's each persona set. This was repeated (c) for all the attribute values in a demographic category. For example, age values in the table are averages of all seven age groups, indicating how well the given algorithm represents the age group distribution in the baseline data.
SP, statistical parity.
Group 1: CA, PCA, and NMF has significantly smaller SP scores (M = 0.070) than Group 2: LDA, UMAP, and SE (M = 0.118), t(11.84) = −3.475, p < 0.005. The observed standardized effect size is large (d = 1.64). Note that smaller SP score indicates higher fairness (the lower the value, the closer the persona attributes are to the baseline data).
Consistency
The results of CS indicate that most of the tested algorithms produce consistent personas according to our definition of the persona demographic groups not changing when changing the number of personas generated. Four algorithms achieve the perfect score of CS = 1.0: CA, PCA, NMF, and SE. The two remaining ones behave more inconsistently, with UMAP (CS = 0.40) scoring higher than LDA (CS = 0.10). A perfect consistency implies that the same personas that were part of the smaller number of personas are part of the larger number of personas as well.
The fact that all the algorithms, except LDA and UMAP, rank perfectly on CS implies that the algorithms behave consistently but differently—that is, an algorithm generates the same personas in 10 and 15 persona sets than in the 5 persona set, but the personas differ by the algorithm. Each of the algorithms tries to identify key patterns but have different definitions of importance. Thus, the generated personas tend to be different (Table 5).
The sets of five personas exemplifies how the personas are different, even when generating a small number
Personas appearing at least two times are bolded.
F, female; M, male.
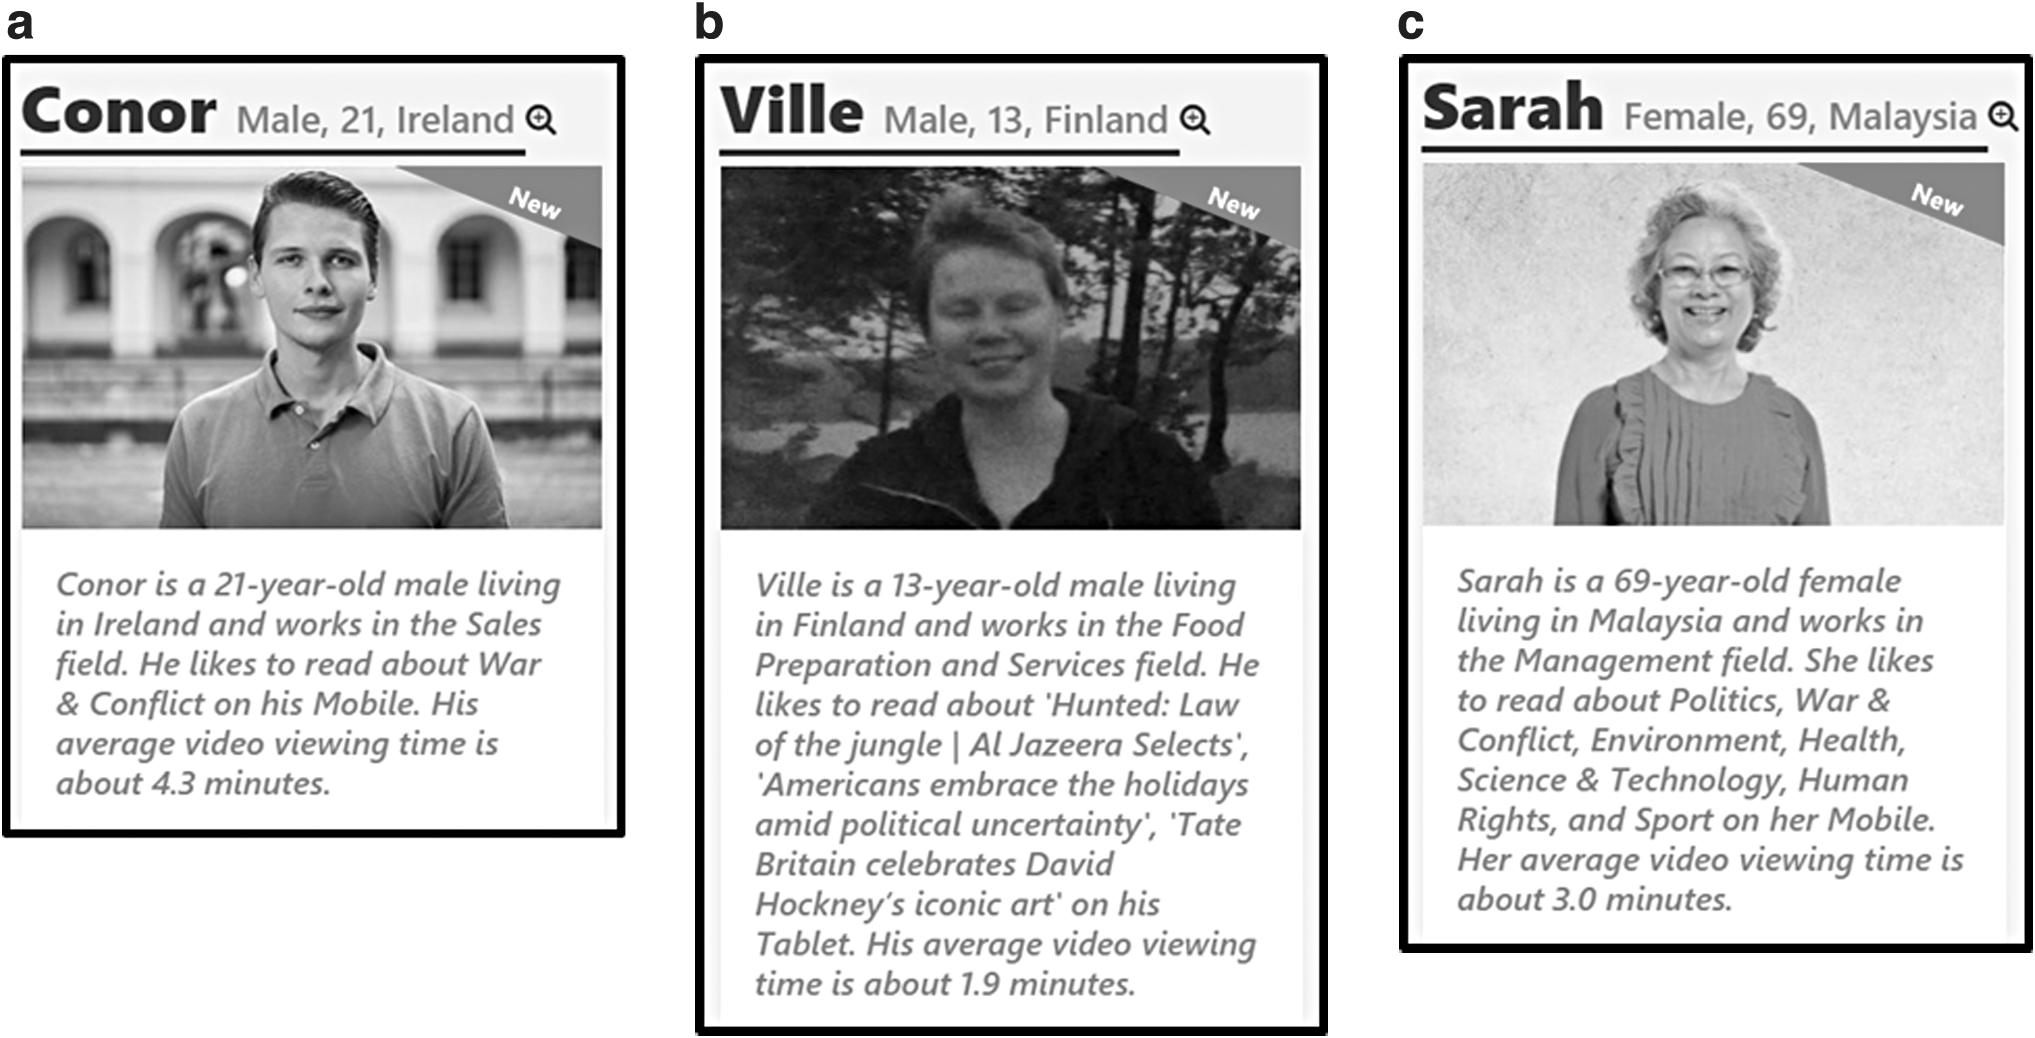
We can further quantify how different the personas are by computing the Jaccard coefficient (J) for each pair of algorithms. J indicates the intersection over the union of two persona sets A and B designed by two different algorithms, which can be interpreted as a similarity of persona attributes. Here, J compares the similarity of sets of personas that are defined by age-gender-country, and it indicates the intersection over the union of two persona sets A and B generated by two different algorithms. J is equal to 1 if the sets are the same and 0 if they are completely different. The results in Figure 6 show that the personas outputted by different algorithms differ substantially, showing a clear clustering among CA, PCA, and NMF.
Pairwise Jaccard coefficient values for personas generated from the data. The values indicate the overlap of the personas in terms of age, gender, and country. The circles illustrate the tendency of CA, PCA, and NMF to generate similar personas across the different generations. In contrast, the behavior of LDA, UMAP, and SE is more sporadic.
The inconsistency of the UMAP and LDA can partially explain the high D scores of these algorithms. In other words, the inconsistency of LDA and UMAP is because they choose novel demographic groups when generating the persona segments. This proposition is supported by the observed strong negative relationship between CS and D (
This trade-off is defined as follows: If optimizing for DFC decrease. Conversely, if optimizing for fairness or consistency, there will be less diversity in the personas. This trade-off implies that DFC are conflicting design goals for AP generation, at least when increasing the number of personas. We can tackle this trade-off by taking the average rank of the algorithms and the DFC metrics to assign a composite rank score for each algorithm. When doing so, SE appears as the most “balanced” algorithm (Table 6), followed by NMF. CA, while being the most commonly used algorithm in AP research, ranks the lowest on this composite comparison.
Unweighted (left-hand side) and weighted (right-hand side) rankings of the algorithms based on average rank by Diversity, Fairness, Consistency criteria
Bold indicate changing of the “best” algorithm when applying weights. Weights provide a simple technique for persona creators to adjust the diversity, fairness, consistency criteria according to their design goals.
Depending on the use case, persona developers may want to prioritize certain design goals, such as diversity over fairness (or vice versa). For this, the computations can be further developed by introducing three parameters: Diversity Penalty (
where the Mean Rank Score MRS of algorithm i is calculated as a weighted sum of Rank R of i for each metric.
Using these penalty parameters to compute the MRS, the ranking of the algorithms is now in favor of NMF, with SE falling a shared second position with PCA (Table 6). Note that these parameters are presented as examples only; future work should conduct a proper sensitivity analysis. Nonetheless, considering the DFC design goals as “weights” for the algorithms is intuitive.
Discussion
Research contribution
As far as we know, this is the most extensive study to experiment with different algorithms for persona generation to date. Overall, our results suggest that the tested algorithms can be categorized into two groups: (a) those with low diversity and high fairness (CA, PCA, NMF), and (b) those with high diversity and low fairness (LDA, UMAP, and SE). This relationship is supported by the strong negative correlation (Spearman's
The same cannot be said for fairness; even though the number of personas has a statistically significant effect on SP, the best average performance is obtained with 10 personas. These findings have several implications. First, concerning AP generation, our findings expand the AP work by Chapman et al 26 and Chapman and Milham 27 and Brickey et al.18,46 In regards to the former, we provide quantitative metrics for persona evaluation 27 and evaluate demographic variables rather than coverage or prevalence. 26 Our study addresses the lack of standardized metrics for persona evaluation 24 by using three relevant metrics to assess persona generation outcomes.
We also confirm the findings that different algorithms tend to “disagree”
18
—that is, design different personas from the same baseline data. Although Brickey et al
18
tested two algorithms (CA, PCA), our study considers these two and four additional algorithms. Also, Brickey et al
18
used inter-rater agreement (Cohen's
In terms of findings, it is interesting that the three methods that maximize diversity—LDA, UMAP, and SE—are also the three methods most rarely applied in the persona literature (Table 1). No previous study uses SE and UMAP to generate APs. The LDA has been previously used,48,49 but CA, PCA, and NMF are dominant methods in persona generation. Our findings imply that the research and practice of persona generation (and user segmentation) benefits from experimentation with novel algorithms, as these novel approaches can result in fairer or more diverse persona sets.
Technically oriented researchers often see the proclaimed objectivity of algorithms as an advantage relative to manual persona generation and user segmentation.5,6,15,36 However, our findings suggest that it is possible that algorithmically created segments might not be any more diverse, fair, or consistent than those created completely by humans using manual means. Instead, APs can also be subject to demographic biases that may originate from multiple sources, such as data distributions, the way algorithms process the data (in the mathematical sense), or from the assigned hyperparameters. 63
To this end, the use of the DFC metrics shifts persona evaluation away from the traditional technical metrics (e.g., perplexity, accuracy, loss, error, etc.) toward evaluating the outputs of persona generation in terms of the kind of personas related to the algorithm design. The metrics we use support the design goals of diverse, fair, and consistent personas, taking a step toward ethically robust APs and user segments that portray the diversity of the user base in an accurate manner. 28 The connection of persona generation and user segmentation to algorithmic fairness is an important contribution that should be further expanded upon in computational studies dealing with customer segmentation using big data.
Hence, the results suggest there is a need for discussion around algorithmic bias in customer segmentation literature. As we suggest, these concerns can be addressed and awareness to them created by leveraging new metrics inspired by the ongoing fairness/bias discussion in the computing community.
Concerning the real-world impact of our findings, there are crucial observations to be made about the large impact that the choice of one algorithm over another has on the composition of the generated personas or user segments. Given that customer segmentation permeates almost every organization on the planet, there is a crucial need for awareness on how a simple change of algorithm can drastically alter the outcomes obtained from the same customer data. Because firms and decision makers are not looking to offer “everything for everyone” but instead tailor their offerings based on segments, whether using personified segments (i.e., personas) or some other types of segments, the impact of the chosen algorithm seems to be not trivial but drastic.
This observation puts pressure on organizations from two sides: first, (a) which persona generation or customer segmentation algorithm should they choose for a given situation? Second, (b) given the obscure behavior of algorithms for persona generation and customer segmentation, is their use dangerous and potentially misleading? Should new segmentation techniques be developed from scratch? Because of these fundamental questions, we expect this study not to be an isolated incidence, but part of a larger research agenda on improving AP generation and customer segmentation. Although fairness frameworks and acronyms such as Fairness, Accountability, and Transparency, Findable, Accessible, Interoperable, and Reusable, 67 Fairness, Accountability, Transparency, Ethics, Safety and Security, 68 and Equity, Accountability, Trust, and Explainability 69 have been developed by the research community and industry actors to scrutinize the use of algorithmic decision making in many fields, the application of these frameworks or concepts in the domain of APs (or user segmentation in general) is lacking.
Hence, our study makes an important contribution to investigating fairness in the context of algorithmic user segmentation. Focusing on what type of personas are created is essential, because AP studies often assume that the use of algorithms and quantitative data prevents persona developers from injecting their biased interpretations into the created personas. 15 However, if the use of algorithms would involve aspects of unfair, inaccurate, or inconsistent personas, this would present a major issue for the ethics of persona generation or other type of algorithmic user segmentation.
Algorithms as conveyors of partial truths about the user base
Our results imply that the choice of an algorithm has a fundamental impact on the personas generated. This is an important discovery since APs tend to have an air of objectivity, credibility, and truthfulness in the eyes of stakeholders. 70 Our findings imply that attributing these properties to data-driven user segmentation might not be justified at all times. More precisely, it seems impossible to argue that any of the applied algorithms captures the “truth” about the users. Instead, each algorithm focuses on certain facets of the user population.
Moreover, the complexity of the algorithms (from a mathematical point of view) typically makes it intractable to understand why a specific trait was chosen over another. This intractability concerns personas and all user segmentation efforts carried out using algorithms. The use of algorithms is always “biased” in the sense that different algorithms produce different outputs. Nevertheless, the use of algorithms is always “objective” because, given the same data and the same parameters, an algorithm always produces the same set of personas. Therefore, it is crucial to disentangle the concepts of truth and objectivity—they refer not to the same thing.
Despite this, researchers can define design goals and desiderata for APs. Perhaps even more so because there is no one perfect method for persona generation. In the absence of this perfect method, the focus should be on what kind of personas are being designed by different algorithms: are they diverse, are they fair, are they consistent?
The outcome of using the same data, but getting different results is a conundrum for the application of data science methods for persona generation and user segmentation in general. It not only stresses the “design power” that the algorithms have but also involves a more fundamental, perhaps unanswerable question of which algorithm correctly portrays the users. This question, associated with epistemological standpoints such as truthfulness and objectivity of algorithms when creating data-driven user segments, can be traced back to the discussion on the (im)possibility of scientific verifiability and falsifiability of personas and data-driven user segments. 27
Within the scope of this study, we are unable to provide definite answers in this regard. However, we express the concern that a precarious use of quantitative methods, coupled with stakeholders' overconfidence in algorithmic superiority due to the mystique involved with quantitative data and mathematical formulas, 70 can result in a disservice. In turn, broader awareness of there not necessarily being “one truth” about the user segments is likely to increase confusion among end-users of personas who the “real” personas are. Perhaps what is needed is to switch the argument for AP generation from one single objectivity to relative subjectivity: here is what an algorithm has to say about your users—but it is not the whole truth.
Practical implications
If all algorithms generate different personas, which one should a decision maker choose? An answer arises, on one hand, from preference and context for which the personas are developed (i.e., the purpose) and, on the other hand, from the intimate understanding of the nature of different algorithms when exposed to specific data (i.e., the know-how). Persona developers may choose to maximize DFC to generate persona sets that are the most applicable for their use case. Our results show that using different target metrics yields mixed results. The choice of the algorithm depends on the goal of persona generation. In particular,
To optimize for diversity, use LDA, UMAP, or SE.
To optimize for fairness, use CA or NMF.
To optimize for consistency, use CA, PCA, NMF, or SE.
When accounting for all the three criteria, use SE or NMF.
Our results show that different algorithms design different personas from the same user data. Thus, the practitioner's choice of algorithm ultimately results in different personas. This implies that the choice of the algorithm should not be taken lightly. More precisely, the practitioner faces two important choices: (a) the choice of the algorithm for persona generation, and (b) the choice of the hyperparameters for the selected algorithm. The ethical implication is that rather than hiding these choices under the parlance of “statistical,” “objective,” and “data,” transparency and discussion of the pros and cons of these choices should be undertaken by the wielders of the algorithms.
If one cannot explain it, one probably should not be using it. Moreover, an important guideline is to consider the goal of the customer segmentation or persona generation exercise in the first place—for example, if one seeks to get as varied understanding of the user population as possible, then using an algorithm that maximizes diversity would be beneficial. If, instead, one seeks to get a tight understanding of the most engaged segments, a fairness-based algorithm would be applicable. The paradigm of “here is our data—algorithm, please show our segments” needs to be revised to “here is our data AND our goal—algorithm, please show our segments.”
Implications for segmentation researchers
Concerning replicability and applicability, the fact that the dominant online platforms tend to output a data structure that is compatible with persona generation means that, by using this data and publicly available data science algorithms, anyone with access to data and necessary programming skills can generate personas. Thus, the practical implications of this study range across many industries and contexts, like the method of personas itself. For example, from YouTube Analytics, one can collect videos and their view counts; from Google Analytics, pages and their session counts; from Facebook Ads, the ads and their interaction metrics (views, clicks, purchases).
To advance the use of data-driven personas, we share our source code and data (with content IDs masked and view counts randomized for protecting business-sensitive information). Researchers and practitioners can obtain these resources via the code repository. †† Sharing data, algorithms, and code is crucial for achieving progress within the user segmentation research and practice 24 and we hope that research contributes to setting an example of making computational materials and resources for persona generation and customer segmentation available to both research and practitioner communities.
Limitations and future research directions
There are several directions to pursue from our findings.
First, the properties of the algorithms most likely explain some of the results. For example, some algorithms may be more sensitive to imbalanced data. Although Table 2 provides descriptive information of the tested algorithms, we did not test how these properties of the algorithms affect the results. This is primarily because of the parsimonious experimental setting that focused on observing the effects of using different algorithms on the demographic composition of the generated personas. More work is required to establish explanations as to why the algorithms behave differently, but providing such explanations is beyond the scope of this work and thus left for future research.
Second, future research should also be directed toward a systematic understanding of how the dataset properties affect the results. These properties may include (a) prevalence of different user demographics (i.e., the number of rows), (b) distributions of engagement across those user attributes, (c) size of content (e.g., small organizations vs. big content producers), and (d) sparsity of the interaction matrix. The more datasets one would analyze, given they contain variation along with these properties, the better one would understand the relationship of data properties and the personas generated by the algorithms.
Third, another interesting question is whether personas generated by different algorithms could be more/less similar under a different parametrization. In this study, we kept the hyperparameters (mainly the number of personas generated) fixed to control the effect of number on the results, but future work could investigate how the manipulation of the algorithms' hyperparameters affects persona generation. We limited the persona sets to three since the main focus of the study was on the algorithms and not the number of personas.
We chose the numbers of personas for the sets (5, 10, 15) based on the fact that previous research tends to favor a relatively low number of personas in a set. Nevertheless, both of these parameters could be altered by (a) comparing more sets, and (b) increasing the number of personas beyond 15. Such extended analyses would help better understand the effect of the number hyperparameter on the APs.
Fourth, there is a grave need for explainability and interpretation of unsupervised algorithms such as the ones we deployed in our study—generally, this a challenge for the whole machine learning domain (see, e.g., Hasani et al 71 ). As our findings show, due to the unpredictable nature of most algorithms, explaining their “thought process” of choosing the specific set of demographic segments should be scrutinized in dedicated studies.
Related to explainability and to the “disagreement” among the algorithms about what segments to highlight, there is a lingering question about the design of entirely new data-driven persona and customer segmentation algorithms. Here, using interactive and intelligent system functionalities alongside with computational techniques such as top-N picking and outlier detection can, we believe, yield results that are simpler and provide more meaningful and interpretable results for stakeholders than the currently used black-box algorithms.
Fifth, other algorithms beyond the ones we tested could be experimented with. We chose the specific algorithms based on their commonness in persona generation and customer segmentation, but more advanced or differently designed algorithms in the current body of computer science could deliver complementing results. The chosen algorithms also include derivative version such as constrained NMF 72 that could be explored in future studies.
Finally, the evaluation of personas and customer segments is generally considered an ongoing research area with room for contribution.27,73 Although we propose metrics to quantify “good personas” according to certain design goals, more quantitative metrics for persona evaluation could be devised, which remains an important goal for future research. User segmentation research could also investigate ways to incorporate the metrics directly into the algorithm's objective functions, rather than focusing on a post hoc analysis of the personas. New algorithms could make it possible for creators to specify their DFC targets before persona or segment generation.
Conclusion
Persona generation via algorithms is widely considered as objective in contrast to manual persona generation, but it is largely overlooked that different algorithms actually generate very different personas. Our results indicate two groups of algorithms that produce very different outcomes for persona generation: algorithms that generate personas with low diversity/high fairness and those that generate personas with high diversity/low fairness. Most algorithms produce consistent results independent of the number of personas.
Persona developers should take care when selecting an algorithm for persona generation (or user segmentation in general), as the algorithm's choice impacts the DFC of the personas. The fact that the algorithms create different personas from the same user data implies that algorithms have more influence in the user segmentation process than commonly understood.
Footnotes
Author Disclosure Statement
No competing financial interests exist.
Funding Information
No funding was received for this article.