
Abstract
We investigated the relationships between gray matter graph properties and cognitive impairment in a sample of 215 patients with Alzheimer's disease (AD) and also whether age of disease onset modifies such relationships. We expected that more severe cognitive impairment in AD would be related to more random graph topologies. Single-subject gray matter graphs were constructed from T1-weighted magnetic resonance imaging scans. The following global and local graph properties were calculated: betweenness centrality, normalized clustering coefficient γ, and normalized path length λ. Local clustering, path length, and betweenness centrality measures were determined for 90 anatomically defined areas. Regression models with as interaction term age of onset (i.e., early onset when patients were ≤65 years old and late onset when they were >65 years old at the time of diagnosis)×graph property were used to assess the relationships between cognitive functioning in five domains (memory, language, visuospatial, attention, and executive). Worse cognitive impairment was associated with more random graphs, as indicated by low γ, λ, and betweenness centrality values. Three interaction effects for age of onset×global graph property were found: Low γ and λ values more strongly related to memory impairment in early-onset patients; low beta values were significantly related to impaired visuospatial functioning in late-onset patients. For the local graph properties, language impairment showed the strongest relationship with decreased clustering coefficient in the left superior temporal gyrus across the entire sample. Our study shows that single-subject gray matter graph properties are associated with individual differences in cognitive impairment.
Introduction
Gray matter graphs describe coordinated patterns of gray matter morphology as measured with structural magnetic resonance imaging (MRI). The nodes of gray matter graphs represent cortical areas that are connected to each other when they covary in thickness, volume, or surface descriptors across subjects (Bassett et al., 2008; He et al., 2007; Mechelli et al., 2005; Sanabria-Diaz et al., 2010) or when they show structural similarity within a single subject [Tijms et al. (2012); for reviews, see Alexander-Bloch et al. (2013a); Evans (2013)]. The precise biological mechanisms underlying coordinated patterns of gray matter morphology are still unclear, but evidence has been reported that these patterns may be related to anatomical connectivity (Gong et al., 2012; van Essen, 1997), experience-dependent plasticity (Alexander-Bloch et al., 2013a; Andrews et al., 1997), and/or genetic factors (Pezawas et al., 2004; Schmitt et al., 2008). Graph theory provides tools to precisely quantify brain networks, and so far, studies have demonstrated that brain graphs show dense interconnectivity within anatomical areas (i.e., clustering) which are connected together with relatively few long-range axonal fiber bundles [i.e., path length; for recent reviews, see e.g., Bullmore and Sporns (2012); Collin and van den Heuvel (2013); Sporns (2013); Stam (2010); Tijms et al. (2013b)]. It has been suggested that such a “small world” topology would enable a balance of specialized information processing and information integration (Humphries and Gurney, 2008; Watts and Strogatz, 1998). Another hallmark characteristic of brain graphs is the existence of highly interconnected (i.e., central) brain areas that reduce a graph's average characteristic path length and render them more resilient toward random deletion of nodes and/or edges (Barabasi and Albert, 1999). While the earlier interpretations of graph properties are straightforward for anatomically connected graphs (based on axonal fiber measurements such as diffusion tensor imaging, i.e., DTI), these interpretations are less straightforward for graphs that are based on correlation measurements such as is the case for functional and gray matter graphs (Alexander-Bloch et al., 2013a; Biswal et al., 2010; Rubinov and Sporns, 2010).
So far, studies have demonstrated that gray matter graphs are disrupted in Alzheimer's disease (AD) (He et al., 2008; Tijms et al., 2013a; Yao et al., 2010; Zhou et al., 2013), supporting the view that AD can be regarded as a disconnectivity syndrome (Blennow et al., 1996; Buckner et al., 2009; Delbeuck et al., 2003). However, it is still unclear whether gray matter graph disturbances are related to inter-individual variability of cognitive impairment in specific domains. The cognitive relevance of the brain graph topologies has recently been studied in anatomical and functional graphs (Li et al., 2009; van den Heuvel et al., 2009; Wen et al., 2011), but not in gray matter graphs because previous methodologies allowed only group-level descriptions. Recently, we have proposed a new method to construct gray matter graphs in single subjects (Tijms et al., 2012). Using this methodology, we have reported that gray matter graph properties indicative of a more random topology were associated with worse disease severity in a sample of AD patients (Tijms et al., 2013a), suggesting that gray matter graphs contain cognitively relevant information. However, diverging results have been reported across graph theoretical studies that have investigated AD (Tijms et al., 2013b). Age of disease onset might partially explain these diverging results, because evidence exists that early-onset AD patients (i.e., people who are younger than 65 years old when diagnosed) present with clinical phenotypes other than memory deficits and other brain imaging abnormalities than late-onset patients (de Waal et al., 2011; Frisoni et al., 2007; Gour et al., 2013; Kemp et al., 2003; Lehmann et al., 2012; Möller et al., 2013; Ossenkoppele et al., 2012; Rabinovici et al., 2010; Smits et al., 2012; van der Flier et al., 2011). Therefore, it is conceivable that if gray matter graph properties are related to cognitive impairment, this relationship might be modified by the age of onset of the disease.
Here, we investigated whether inter-individual variability in gray matter graph properties was related to cognitive impairment across a wide range of cognitive domains in a large sample of 215 AD patients (a part of this sample has been previously described in Möller et al., 2013). We hypothesized that more severe impairment in any of the five cognitive domains (memory, language, visuospatial, attention, and executive) would be associated with a loss of node importance and more random clustering and path length values of patients' gray matter graphs. We examined whether these associations were driven by changes in specific anatomical areas. Finally, we investigated whether such relationships were modified by the age of disease onset.
Materials and Methods
Alzheimer patients
We studied 215 patients with probable AD with available 1T structural MRI scans from the memory clinic-based Amsterdam Dementia Cohort of the Alzheimer Center of the VU University Medical Center [sample overlaps with the one previously described in Möller et al. (2013)]. All patients received standard dementia screening that included a medical history, physical and neurological examination, cognitive examination, extensive neuropsychological evaluation, screening laboratory tests, an electroencephalogram, and an MRI scan. Apoliprotein (APOE) genotype was determined from DNA that was isolated from 10-mL blood samples in ethyl-enediaminetetraacetic acid with the use of the LightCycler APOE mutation detection method (Roche Diagnostics GmbH, Mannheim, Germany). Patients were diagnosed during a multidisciplinary consensus meeting with probable AD when they fulfilled the criteria proposed by the National Institute on Aging and the Alzheimer's Association (NIA-AA) workgroup (McKhann et al., 2011). We considered patients aged 65 years or younger at the time of diagnosis to have early-onset AD (N=95), and patients older than 65 years to have late-onset AD (N=120). The Ethical Review Board of the VU University Medical Center Amsterdam approved the study. All participants provided written informed consent to use their clinical data for research purposes.
Neuropsychological assessment
Global cognitive functioning was assessed using the mini-mental state examination (MMSE) (Folstein et al., 1975), which was a part of the standard dementia screening. Cognitive functioning in five domains was assessed with the use of a standardized neuropsychological test battery, which included for the memory domain the visual association test (Lindeboom et al., 2002) and total immediate recall of the Dutch version of the Rey auditory verbal learning task (RAVLT) (Rey, 1964; Saan and Deelman, 1986); for the language domain, the Category Fluency (animals) and the Dutch version of controlled oral word association test (COWAT) (letter fluency) (Luteijn and van der Ploeg, 1982; Schmand et al., 2008); for the visuospatial domain, three subtests of the visual object and space perception battery (VOSP): (i) incomplete letters, (ii) dot counting, and (iii) number location (Warrington and James, 1991); for the attention domain, the trail making test (TMT) A (Lindeboom and Matto, 1994) and the forward condition of Digit Span (extended version) (Reitan, 1958); and for the executive domain, the TMT B (Lindeboom and Matto, 1994) and the backward condition of Digit Span (extended version) (Reitan, 1958). Level of education was classified according to the Dutch system of Verhage (1964) ranging from 1 (low, elementary school not completed) to 7 (high, university).
On average, every neuropsychological test was completed by 162 patients, with the TMT B test completed by the least number of patients (N=104) and the Digit Span Forward completed by the most patients (N=203). Tests were not finished either due to the severity of cognitive impairment and/or due to lack of time. In order to avoid selection bias and to increase statistical power, we estimated missing values with the use of the multivariate imputation by chained equations (van Buuren, 2011) as implemented in the statistical software R (version 3.0.0). This method constructs multivariate imputation models with a set of conditional densities for each variable so that missing values can be accurately estimated using the information available in the data from the inter-relationships between variables. Age, gender, MMSE, and graph properties were included as additional predictor variables in order to reduce estimation bias. Missing values were replaced by the corresponding estimates averaged across 50 imputed data sets to achieve stable results. After imputation, we created five cognitive domains. First, the inverse TMT A and B scores were computed by multiplying the scores with −1 so that lower scores can be interpreted as worse performance. Next, all neuropsychological test scores were Z-transformed to make them independent of their measurement scale so that we could compute their average Z-score for the cognitive domain.
Image acquisition and preprocessing
Neuroimaging of the subjects was carried out on a 3.0 Tesla scanner (SignaHDxt; GE Healthcare, Milwaukee, WI) using a standard circularly polarized head coil with foam padding that restricts head motion. The scan protocol for acquisition of structural T1-weighted images included a whole-brain three-dimensional (3D) fast-spoiled gradient-echo sequence with a repetition time of 708 msec, an echo time of 7 msec, a flip angle of 12°, 180 sagittal slices, a field of view of 250 mm, a slice thickness of 1 mm, and a voxel size of 0.98×0.98×1 mm3. All scans were reviewed for brain pathology other than atrophy by an experienced radiologist. The origin of the scans was automatically set to the anterior commissure using the linear transformation matrix to MNI space that was calculated in FSL-FLIRT (Jenkinson and Smith, 2001) and subsequently segmented into cerebrospinal fluid, gray and white matter using Statistical Parametric Mapping software (SPM8; Functional Imaging Laboratory, University College London, London, United Kingdom) run in MATLAB 7.12 (MathWorks, Natick, MA). C.M. checked the quality of all segmentations. The gray matter segmentations were resliced to 2 mm3 isotropic voxels. Ninety anatomical areas were identified in the native space gray matter segmentations with the use of the automated anatomical labeling atlas (AAL) (Tzourio-Mazoyer et al., 2002) and the individual brain atlases statistical parametric mapping (IBASPM) (Alemán-Gómez et al., 2006) toolbox in SPM8. This toolbox was also used to obtain measurements of total intracranial volume (i.e., the sum of gray matter, white matter, and cerebrospinal fluid volumes), total gray matter volume, and local volumes of the AAL regions in native space.
Single-subject gray matter graphs
Figure 1 illustrates the pipeline of the method that was used to construct single-subject gray matter graphs [for more details, see Tijms et al. (2012)]. Briefly, the method starts with defining the graph's nodes as small regions of interest that consist of 3×3×3 voxel cubes in the native space gray matter density maps. These cubes keep the 3D structure of the cortex intact and so, geometrical information is used in addition to the gray matter density values in the voxels. Structural similarity between all the nodes in the graph was determined with a fast implementation of the correlation coefficient (Lewis, 1995). The cortex is a curved object and so two similar cubes could be located at an angle of each other, which might decrease their similarity value. For this reason, we rotated each seed cube by an angle θ with multiples of 45° and reflection over all axes to find the maximum similarity value with the target cube (Tijms et al., 2012). Regions with zero variance in gray matter values were excluded (average across all subjects <0.01%), because for these cases the correlation coefficient is undefined.
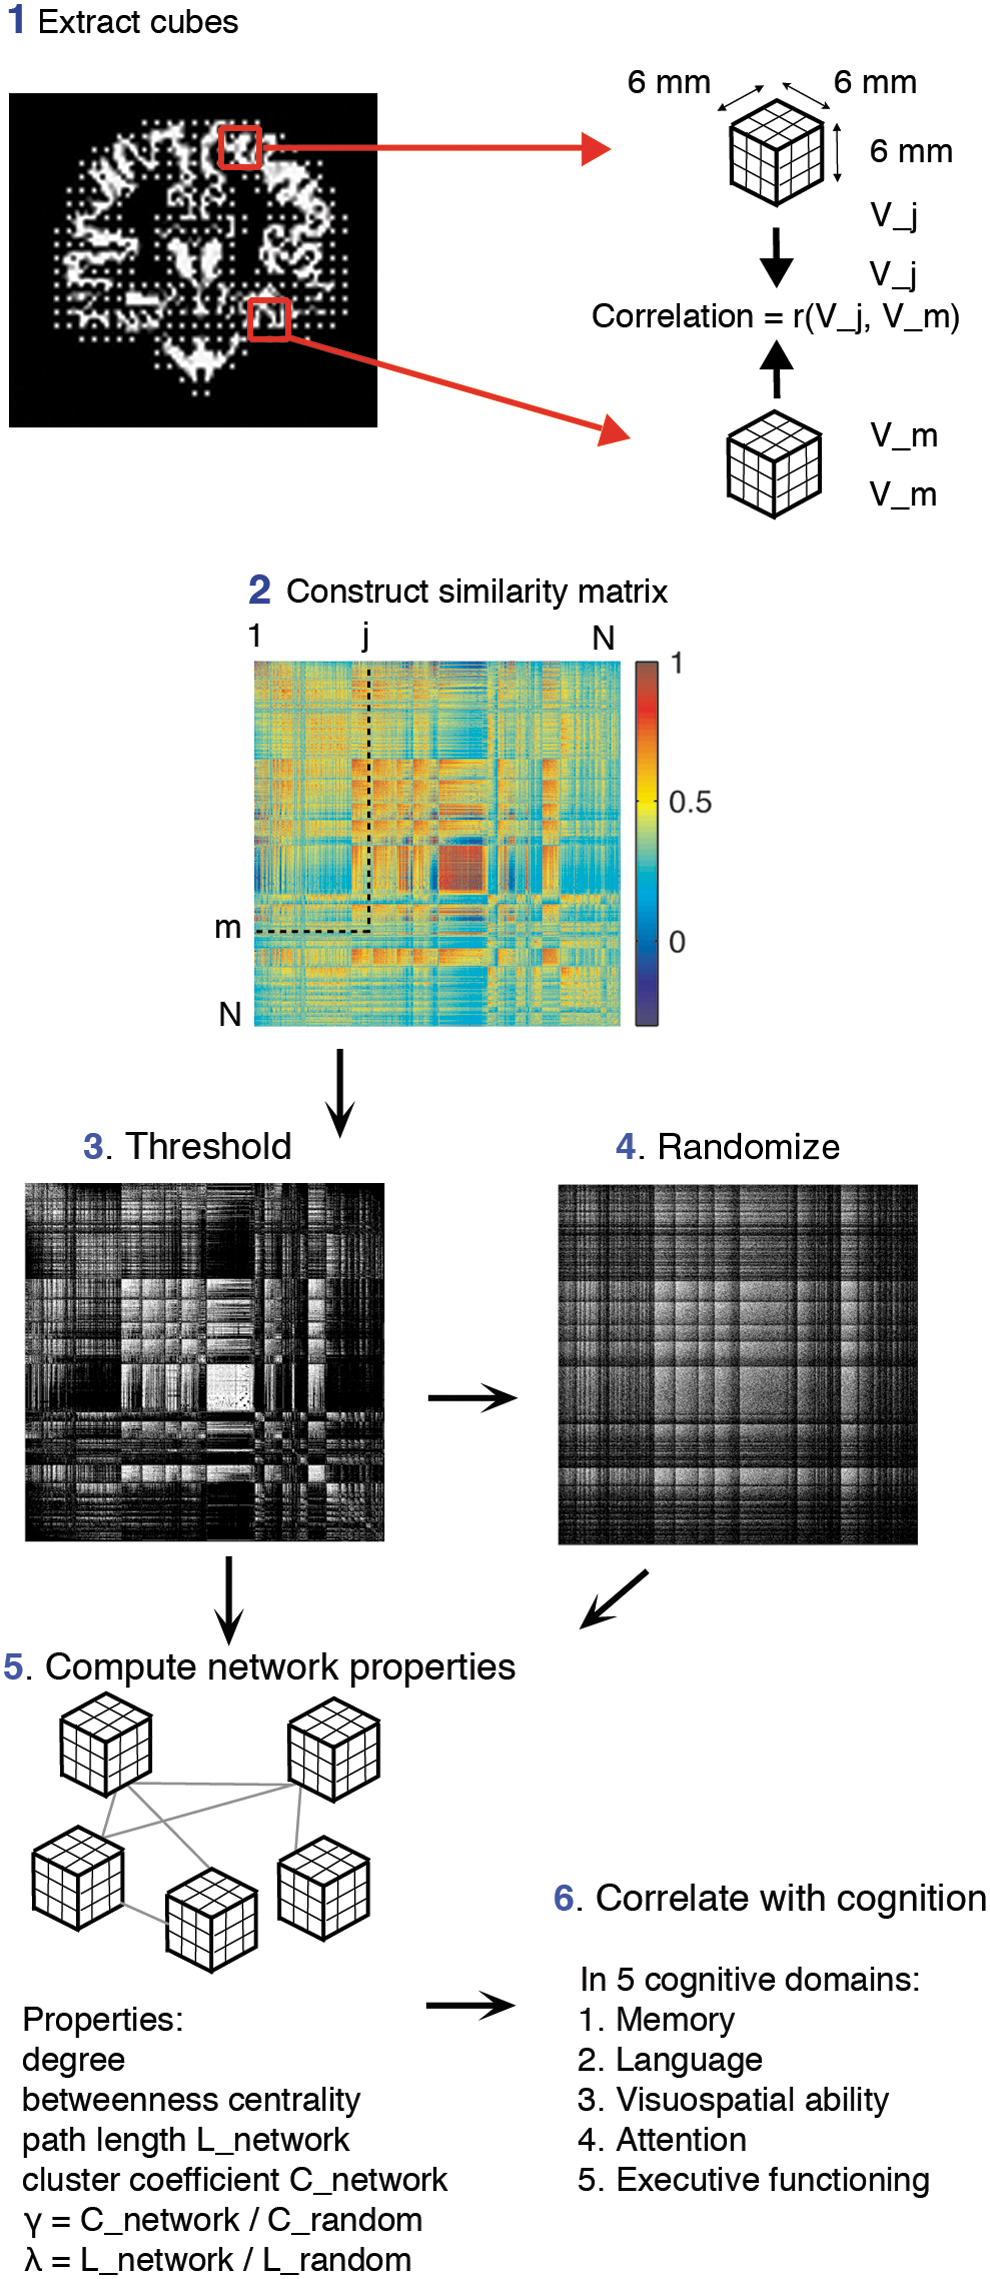
Schematic overview of the pipeline to extract single-subject gray matter graphs. After preprocessing, the resulting gray matter segmentation is divided into 3×3×3 voxel cubes
In order to construct unweighted and undirected graphs, the similarity matrices were binarized by determining a threshold with a random permutation method to ensure a similar chance of including 5% (SD=0.002) spurious correlations for all individuals (Noble, 2009). It should be noted that in the present study, the term “connectivity” is used to indicate when two nodes show high statistical similarity, which may exist in the absence of axonal connectivity.
Graph properties
This study investigated whether individual differences in cognitive impairment were related to a more randomly organized graph as measured by normalized path length (i.e., λ), normalized clustering coefficient (i.e., γ), and betweenness centrality. To this end, for each node in the graphs, we calculated the characteristic path length L (i.e., the minimum number of edges between any pair of nodes) and the clustering coefficient C (i.e., the level of interconnectedness between neighboring nodes). In order to estimate λ and γ, we averaged the characteristic path length L and clustering coefficient C across the nodes for each graph and then divided these properties by those averaged from 20 randomized reference graphs with an identical size and degree distribution (Maslov and Sneppen, 2002). A graph has the small-world property when γ/λ>1, meaning that its topology shows more clustering and similar characteristic path length as a random graph (Humphries and Gurney, 2008; Watts and Strogatz, 1998). We used betweenness centrality (i.e., the proportion of characteristic paths that run through a node) to assess the centrality of nodes. These graph properties are interrelated: Nodes with a high betweenness centrality value showed low values for path length (average correlation across subjects r=−0.44), and nodes with low path length values showed high clustering values (average correlation across subjects r=−0.55).
In order to reduce dimensionality and to aid comparability between single-subject graphs, we labeled the nodes according to the most frequently occurring AAL label of a node's voxels and then averaged the local graph property values across the nodes within an AAL area. In addition, we computed the graph-defining properties size (i.e., the number of nodes), average degree (i.e., the number of edges), and connectivity density (i.e., the number of existing edges to the number of all possible edges), as other types of graph properties are dependent on these (van Wijk et al., 2010; Please also see Supplementary Materials; Supplementary Data are available online at
Statistical analyses
Nominal data was compared between early- and late-onset AD patients with chi-square tests, and continuous demographic data were compared with two-sample t-tests. We used two linear regression models to compute the relationship between cognitive functioning (dependent variable) and graph properties (independent variable). Model 1 is formally represented by Equation 1:
Model 1 included the cognitive domain Y as a dependent variable, the main effects of graph property of interest A and the age of onset B (dichotomized into ≤65 and >65 years old at time of diagnosis) and also their interaction AB. We corrected for the influences of gender C1 , total intracranial volume C2 (to account for possible effects of head size), and the graph-defining properties average degree C3 and graph size C4 , because these factors has been shown to influence graph property values (please also see Supplementary Materials and Supplementary Table S1) as well as for the influence of level of education C5 on cognitive test performance. We did not include gray matter volume as an additional covariate in the main analyses because of its strong correlation with gray graph size (on average r=0.78).
When the interaction term with age of onset was significant (p<0.05), we stratified that analysis for age of onset. When the interaction term with age of onset was not significant (p>0.05), we ran Model 2 without the interaction term AB (Equation 2):
For analyses at the local level of the 90 AAL regions, we used the models as described by Equations 1 and 2 to compute the relationship between cognitive functioning (dependent variable Y) and local graph properties (independent variable A). The local models included local gray matter volume as an additional covariate to control for the influence of differential atrophy patterns in addition to gender. All models were checked for outliers. All variables were scaled to zero mean and a standard deviation of 1 in order to obtain standardized β values. Analyses were Bonferroni corrected for multiple hypothesis testing: pBonferroni was calculated by multiplying the uncorrected p-value×6 cognitive domains at the global graph level and 90×6 at the local level of 90 AAL areas. We considered a result with pBonferroni <0.05 to be significant and if pBonferroni >1, it was set to 1. These statistical analyses were performed in R version 3.3.0 (03-04-2013).
Results
Sample characteristics
Table 1 summarizes the subjects' main demographic, clinical, and graph information. Out of the entire sample, 44% of patients had early-onset AD (average age=59.65±3.90 years) and 55% had late-onset AD (average age=72.22±4.84 years). The groups showed similar distributions of gender, MMSE scores, educational level, global atrophy, and APOE genotype. Table 2 summarizes the subjects' neuropsychological information and shows that early-onset AD patients performed worse than late-onset AD patients in tests of visuospatial and executive functioning (also see Supplementary Fig. S1 for group differences in the cognitive domains). All graphs were small world as indicated by a λ≈1 and γ>1. Late-onset patients showed a reduction of all graph property values in comparison to early-onset patients.
Demographic and Clinical Characteristics of Early- and Late-Onset Alzheimer's Disease Patients
n.a. is not applicable, SD is standard deviation, NGMV is gray matter volume divided by total intracranial volume (measurement of atrophy), γ is normalized clustering, coefficient, λ is normalized path length, and BC is betweenness centrality. Statistical differences between early- and late-onset AD patients are indicated with * for p<0.05, ** for p<0.01, and *** for p<0.001 tested with χ2 for dichotomous data and with two-sample t-tests for continuous data.
Data available for N=213.
AD, Alzheimer's disease; APOE, apoliprotein; MMSE, mini-mental state examination.
Pooled Neuropsychological Test Performance of Early- and Late-Onset Alzheimer's Disease Patients Categorized in Five Cognitive Domains (Memory, Language, Visuospatial, Attention, and Executive)
Statistical differences between early- and late-onset AD patients are indicated with ** for p<0.01 and *** for p<0.001 tested with two-sample t-tests. Missing neuropsychological test scores were replaced by the corresponding estimates from multiple imputation (averaged across 50 imputed datasets). Please note that higher scores for trail making tests A and B indicate worse performance. See Supplementary Figure S1 for group differences in the composite scores of each cognitive domain.
Global graph properties and cognitive impairment
Table 3 summarizes the relationships between λ, γ, and the average betweenness centrality with cognitive functioning. First, we ran Model 1, which included an interaction term between age of onset and the graph property of interest in the relationship with cognitive functioning. This interaction term was significant for the relationships between betweenness centrality and language, betweenness centrality and visuospatial functioning, λ and memory and the relationship between γ and memory, and so, we further investigated these relationships stratified for age of onset. Early-onset patients showed the strongest relationship between worse language impairment and low betweenness centrality values. These patients also showed the strongest association between worse memory impairment and low λ and γ values. Late-onset patients showed a significant association between worse visuospatial functioning and low betweenness centrality values.
Standardized β's (Standard Error) Values of Regression Analysis to Assess Relationships Between Global Betweenness Centrality, Gamma, and Lambda with Global Cognitive Functioning as Measured with the Mini-Mental State Examination and with Functioning Five Cognitive Domains (Memory, Language, Visuospatial, Attention, and Executive)
All analyses were adjusted for education, sex, total intracranial volume, graph size, and average degree. Regressions were first tested with Model 1 that included an interaction term with age of onset and when this interaction was significant, the regression was stratified for age of onset. When this interaction was not significant, results from Model 2 (without this interaction term) are reported for the total sample (All).
— is not tested, ia is significant interaction effect from Model 1, and subsequent analyses are stratified based on age of onset. Significant interaction effects are indicated with * for p<0.05. Significant standardized β's are indicated with † for pBonferroni <0.05, †† for pBonferroni <0.01, and ††† for pBonferroni <0.001.
Model 1 for MMSE, attention, and executive functioning did not show interaction effects and so, we further investigated associations between graph property values in these domains and Model 2 (i.e., without interaction term). Table 3 shows that worse MMSE scores, impaired attention, and impaired executive functioning were related to low λ, γ, and betweenness centrality values. Low λ, γ, and betweenness centrality values suggest a more random graph topology. Finally, worse language and visuospatial impairment were related to low λ, γ values.
Local graph properties and cognitive impairment
Next, we investigated whether the associations between more severe cognitive impairment and a more random graph topology were specific for particular cortical areas. To this end, we first determined with Model 1 whether age of onset showed an interaction effect with graph property values with regard to cognitive impairment in any of the 90 anatomical areas. Several anatomical areas showed interaction effects (p<0.05); however, none of the subsequently age-stratified analyses survived correction for multiple hypotheses (summarized in Supplementary Table S2).
For the remaining areas, we analyzed the relationship between local graph property values and cognitive impairment with Model 2 (i.e., without the interaction term) across the entire patient sample. Several anatomical areas showed associations between low path length and impairment in the language, visuospatial, and executive domains. Other nonoverlapping anatomical areas showed associations between low clustering coefficient values and more severe cognitive impairment in the language, visuospatial, and executive domains (Fig. 2). The left superior temporal gyrus showed the strongest relationship between low clustering coefficient values and language impairment (β=0.59, pBonferroni =0.03), and the right precuneus showed the strongest relationship between low path length values and visuospatial impairment (β=0.50, pBonferroni =0.007). Language impairment was associated with low path length values in the left inferior frontal operculum and left inferior parietal lobule. Worse visuospatial impairment was associated with low path length and clustering coefficient values in mostly right posterior areas that are known to be involved in visuospatial processing. Low path length and clustering values in frontoparietal areas were associated with impaired executive functioning. No associations were found between local path length or clustering coefficient with MMSE scores, memory, and attentional impairment (all pBonferroni >0.05). Local degree and betweenness centrality did not show associations with cognitive functioning (all pBonferroni >0.05).
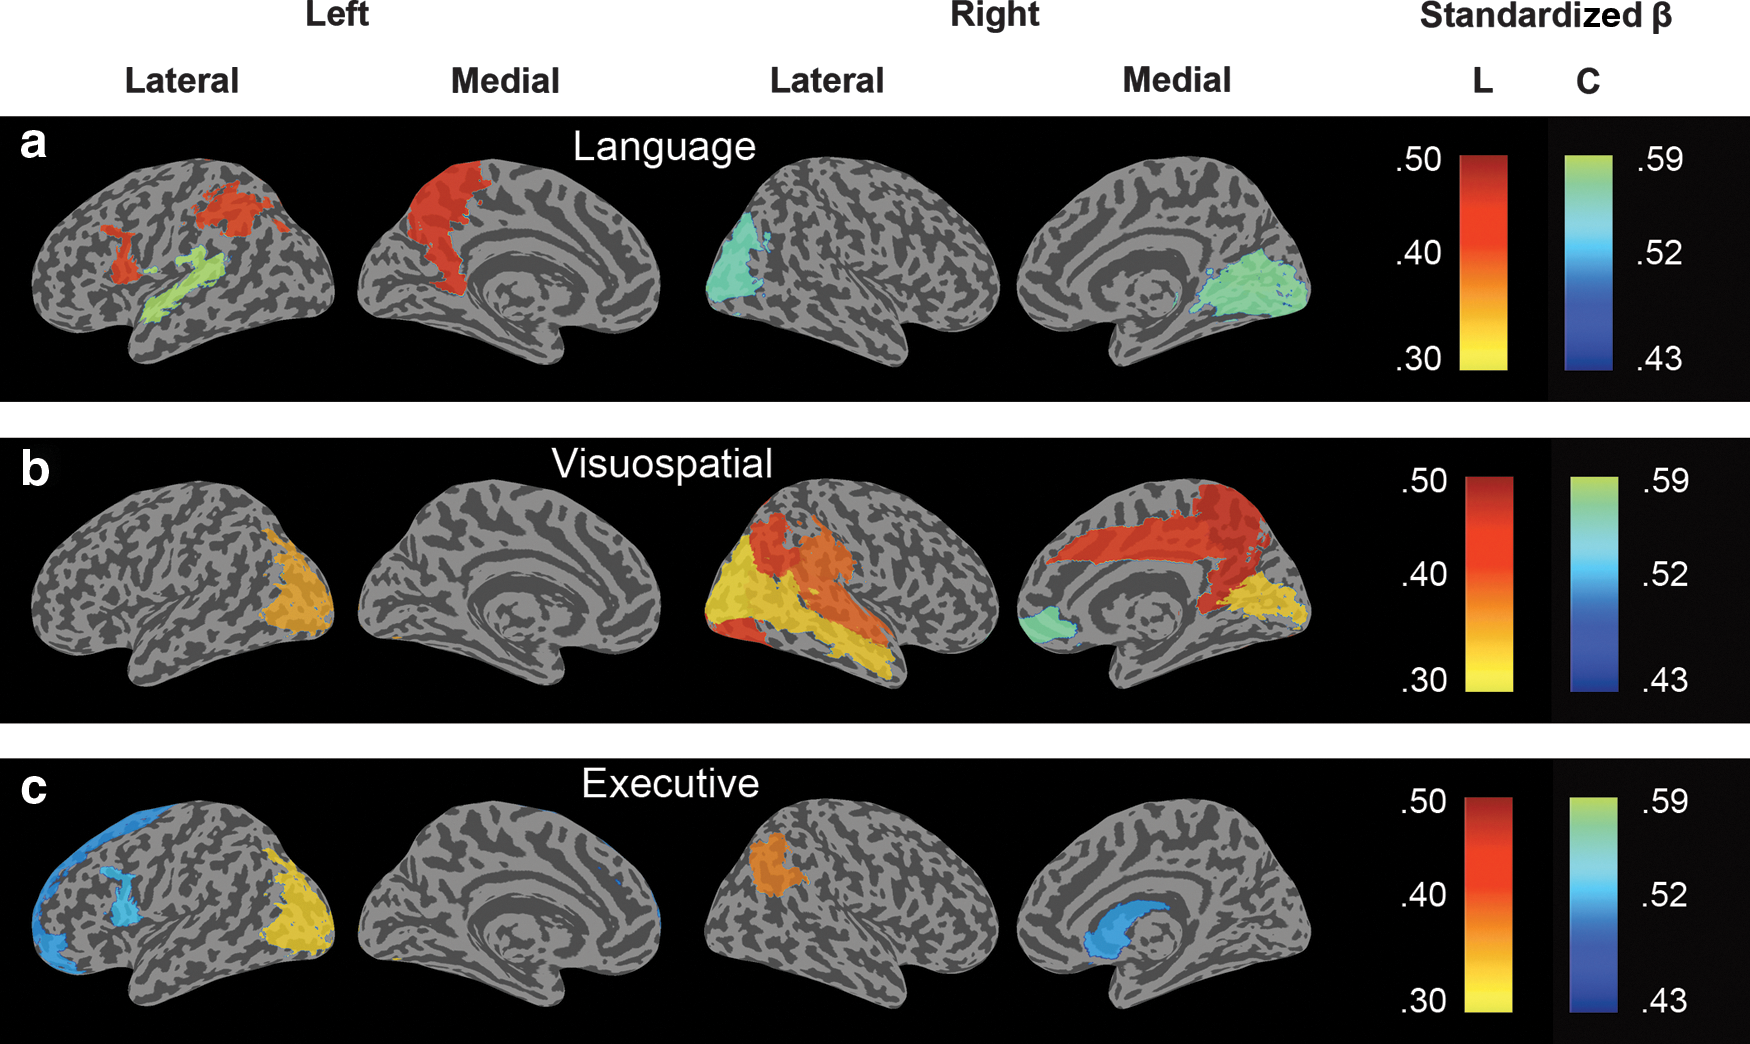
Surface plots of the standardized β values that survived Bonferroni correction for multiple hypotheses testing [p<0.05/(6×90)] from a regression analysis which measured the association between decreased local path length L (yellow to red color scale) or clustering coefficient C (blue to green color scale) and cognitive impairment in the language, visuospatial, and executive domains.
Low values of average path length and clustering were associated with low small world values (respectively: r=0.56, p=0.02×10⁻¹⁴; r=0.51, p=0.01×10⁻¹³), and so, these results suggest that worse cognitive functioning is associated with a more random gray matter graph topology.
Discussion
The main finding of our gray matter connectivity study is that patients with more severe cognitive impairment showed a more random gray matter graph topology as indicated by low betweenness centrality, γ and λ values. Some of these associations were modified by the age of disease onset: Early-onset patients showed a stronger relationship between worse memory impairment and low λ and γ values, and they also showed a stronger relationship between worse language impairment and decreased betweenness centrality than late-onset AD patients. Late-onset AD patients showed a significant relationship between worse visuospatial impairment and decreased betweenness centrality, and this relationship did not reach significance in the early-onset patients.
The present results are in line with our previous study where we found that a more randomly organized gray matter graph was associated with worse disease severity as measured with the MMSE in late-onset AD (Tijms et al., 2013a), as well as with our resting-state magnetoencephalography study where we reported that a more random topology was strongly correlated with worse memory, executive and language functioning (de Haan et al., 2012a, 2012b). However, the present results seemingly contradict an anatomical (DTI) graph study, where negative associations were found between λ and γ values and verbal memory impairment in AD (Lo et al., 2010). In young, healthy controls, shorter paths in functional and anatomical graphs have been associated with more efficient functioning (Li et al., 2009; van den Heuvel et al., 2009; Wen et al., 2011). In our study, we found that shorter path lengths were associated with more random graph topologies and worse cognitive impairment. An explanation for this discrepancy might be the fact that the path length of functional and gray matter graphs seems to follow an inverted U-shaped curve, increasing in early adulthood and decreasing at more elderly ages, suggesting that from a certain age longer path lengths are actually better (Smit et al., 2012; Wu et al., 2013). Our finding that cognitive impairment was related to alterations of graph property values in specific anatomical areas supports this explanation. For example, language impairment was strongly associated with decreased path length in left frontal and parietal areas, which are a part of the well-established language network, including Broca's and Wernicke's areas, as well as the superior temporal gyrus (Parker et al., 2005). Right anatomical areas are less well known to be involved in language functioning; however, lesions between left language areas and right visual areas have been associated with the inability to name visually presented objects [i.e., visual anomia; Beauvois (1982)]. We further found that visuospatial impairment was associated with decreased path length in mainly posterior occipital, parietal, and temporal areas as well as the cingulate areas, which are areas that are known to be strongly interconnected and involved in visuospatial processing (Kravitz et al., 2011). Decreased clustering in the superior frontal cortex and decreased path length in the precuneus have previously been reported to be involved in executive processing (Seeley et al., 2007).
At this point, it remains an open question as to how gray matter connectivity is related to anatomical and functional connectivity. Our results show correspondence with observations that have been reported by resting-state functional connectivity studies, suggesting that intracortical similarity might be (partially) driven by long-term functional coactivation. Recent studies have reported moderately strong convergence of cortical thickness covariation between cortical areas across subjects and the existence of axonal fiber bundels between these areas (Gong et al., 2012), and also between maturational process of cortical thickness and functional coactivation (Alexander-Bloch et al., 2013b), explaining at least a part of the variance in gray matter covariation.
Previous graph theoretical studies in AD have reported diverging findings of AD-related alterations in comparisons to control subjects (Tijms et al., 2013b). The present results support the explanation that heterogeneous patients samples may have contributed to such diverging results, because the relationship between graph property values and the severity of cognitive impairment can depend on the age of onset. Future research will aim at further investigating the longitudinal change of graph theoretical properties in early- and late-onset AD.
Only early-onset patients showed a relationship between worse memory impairment and low λ and γ values. Possibly, this relationship reflects the fact that early-onset patients at early disease stages show relatively intact memory scores and at later disease stages, they show similar memory impairment as late-onset patients (Smits et al., 2012). Such a difference in memory impairment across disease stages is less prominent in late-onset patients. In addition, early-onset patients have been reported to have more impaired visuospatial functioning than late-onset patients. Although early-onset patients showed higher β values in this domain with betweenness centrality than late-onset patients (Table 3), these relationships did not reach significance because the early-onset patients showed more variability in the data. Exploratory analyses (data not shown) suggested that β values of the relationship between visuospatial functioning and λ and γ tended to be higher in early-onset patients, but these differences were not significant and this is possibly due to insufficient power. Our results support the fact that age of onset can explain a part of disease heterogeneity in AD, but that other factors such as differences in disease progression are likely to be involved. Future research aims at further investigating these issues.
A limitation of the present study's approach is that graphs can differ in their size and/or connectivity density. How to compare such graphs remains an important unresolved methodological issue (Fornito et al., 2010; Li et al., 2011; van Wijk et al., 2010). Graph normalization methods that enforce identical size and connectivity density onto graphs can still suffer from other limitations, particularly in patient populations (Tijms et al., 2013a). We have analyzed gray matter graphs in native space segmentations in order to preserve inter-individual variability [but also see Batalle et al. (2013)]. Previous studies have suggested that such inter-individual differences in cortical shape have functional relevance (Mechelli et al., 2004; Schwarzkopf and Song, 2010). For example, people with a smaller V1 have a stronger experience of visual illusions (Schwarzkopf and Song, 2010). Another potential limitation of the present study is that atrophy effects are likely to have influenced patterns of intracortical similarities in our AD sample, even though we have corrected for atrophy effects in our regression models and we did not find any relationships between gray matter volumetric measures and cognitive functioning (see Supplementary Materials). We aim at further investigating this relationship in future research. In addition, the number of missing values for some variables might have influenced the results. We have estimated these missing values with multiple imputation in order to avoid selection bias that would otherwise be introduced by analyzing only the complete cases.
A strength of the present approach is that gray matter graphs were quantified in single subjects and so, we were able to show for the first time that gray matter graph properties are related to inter-individual differences in cognitive impairment in AD patients, suggesting that they contain neuropathologically as well as cognitively relevant information.
Footnotes
Acknowledgments
This study was conducted at the VUmc Alzheimer center that is a part of the neurodegeneration research program of the Neuroscience Campus Amsterdam. The VUmc Alzheimer center is supported by Alzheimer Nederland and Stichting VUmc fonds. The authors thank Annelies van der Vlies and the anonymous reviewers for their valuable input.
Author Disclosure Statement
No competing financial interests exist.
References
Supplementary Material
Please find the following supplemental material available below.
For Open Access articles published under a Creative Commons License, all supplemental material carries the same license as the article it is associated with.
For non-Open Access articles published, all supplemental material carries a non-exclusive license, and permission requests for re-use of supplemental material or any part of supplemental material shall be sent directly to the copyright owner as specified in the copyright notice associated with the article.