
Abstract
Resting-state functional magnetic resonance imaging (RS-fMRI) is based on the assumption that the vascular response and the blood oxygenation level-dependent response are homogenous across the entire brain. However, this a priori hypothesis is not consistent with the well-known variability of cerebral vascular territories. To explore whether the RS networks are influenced by varied vascular speed in different vascular territories, we assessed the time-shift maps that give an estimate of the local timing of the vascular response and checked whether local differences in this timing have an impact on the estimates of RS networks. Two hundred seventeen elderly (≥60 years), healthy participants (73.74 ± 4.41 years, 143 females, 203 right handed) underwent one MRI examination, including an RS-fMRI session. After preprocessing, statistical analyses included time-shift analyses and RS-fMRI analyses using as regressor the delay maps obtained from the time-shift analyses. The functional connectivity map of default mode network (DMN) of each participant was then calculated by using the seed-to-voxel analysis in the REST toolbox. Faster cerebrovascular responses were notably present in the primary motor and somatosensory and peri-insular cortex, while slower responses were present in various regions, including notably the posterior cingulate cortex (PCC). Moreover, significant changes notably in the DMN, including medial prefrontal cortex (t = 11.95), PCC (t = 11.52), right middle temporal lobe (t = 10.72), and right angular gyrus (t = 10.88), were observed also taking into account the cerebrovascular delayed maps. As the most prominent example of the RS networks, DMN activation patterns change as a function of the cerebrovascular delay. These data suggest that a group correction for vascular maps in RS-fMRI measurements is essential to correctly depict functional differences and exclude potential confounding effects, notably in the elderly with increasing prevalence of vascular comorbidity.
Introduction
R
RS-fMRI assumes that the vascular response and the BOLD response are homogenous across the entire brain (Katanoda et al., 2002; Yuan et al., 2013). However, several arterial spin labeling (ASL) studies demonstrated that the patterns of vascular response vary substantially in neocortical areas (Emmert et al., 2016; Hartkamp et al., 2013; Wang et al., 2014) as ASL MRI provides concomitant information on cerebral perfusion and brain anatomy allows for differentiating vascular territories in the brain (Damasio, 1983; Floyd et al., 2003; Tatu et al., 1998, 2012). Although some previous studies suggested that the “background noise” from white matter, gray matter, and CSF should be regressed out during the postprocessing pipeline of RS-fMRI data (Murphy et al., 2009; Schölvinck et al., 2010; Shmueli et al., 2007), the effects of vascular territories have not been fully considered. It is thus possible that the functional connectivity of RS networks (and in particular the DMN) may change according to the differences in vascular speed.
In the present study, we assess the time-shift maps (TSMs) that give an estimate of the local timing of the vascular response using an innovative approach and examine whether local differences in the speed of the vascular response influence the functional connectivity of the DMN.
Materials and Methods
Participants
Two hundred seventeen elderly (≥60 years), community-dwelling healthy participants (mean age: 73.74 ± 4.41 years, 143 females, 203 right handed) were enrolled in this study (Geneva and Lausanne). These community-based cases were recruited via advertisements in local newspapers and media. All participants had normal or corrected-to-normal visual acuity. Past hearing problems were identified as a part of the medical interview (including both subjects and their proxies). All cases with such problems were a priori excluded. All individuals were evaluated with an extensive neuropsychological battery, including the Mini-Mental State Examination, the Hospital Anxiety and Depression Scale, and the Lawton Instrumental Activities of Daily Living (Haller et al., 2017).
All individuals were also evaluated with the Clinical Dementia Rating (CDR) scale. Only cases with intact cognitive abilities and CDR score of 0 were included in our sample. The education level was defined according to the Swiss scholar system, where level 1 = less than 9 years (primary school), level 2 = between 9 and 12 years (high school), and level 3 = more than 12 years (university).
This study was approved by the Commission cantonale d'éthique de la recherche Genève (Cantonal Ethics Committee Geneva) and has been performed in accordance with the ethical standards prescribed in the 1964 Declaration of Helsinki and its later amendments. Written consent was obtained from all participants in accordance with the local guidelines.
MRI data acquisition
MRI examination included routine protocols for screening obvious lesions and a RS-fMRI session. The RS-fMRI data acquisition used an echo-planar imaging (EPI) sequence with the parameters as follows: repetition time (TR) = 2000 msec, echo time (TE) = 30 msec, flip angle = 90°, 33 slices, slice thickness = 3.5 mm, distance factor = 20%, field of view (FOV) = 210 × 210 mm2, matrix = 64 × 64, measurements = 200. A high-resolution T1-weighted magnetization prepared rapid gradient echo data set (TR = 2300 msec, TE = 2.27 msec, 176 slices, 1 mm isotropic, FOV = 256 × 256 mm2, matrix = 256 × 256) was acquired as anatomical reference. All data were collected on a MAGNETOM Trio Tim 3T MR scanner (Siemens Healthcare, Erlangen, Germany) using a 32-channel head coil.
Preprocessing of fMRI data
The fMRI data were first preprocessed with a standard pipeline for resting-state data analysis by using GRETNA toolbox (
Time-shift analysis
After preprocessing, the TSM of each participant was calculated using an iterative algorithm with the following steps. (1) Averaging the time series of the whole brain to create the first time series template (time points from 6TR to 194TR). (2) For each voxel, the time course was shifted from −6TR to +6TR and correlated with the time series template at each TR. Each voxel was then labeled as the number of TR that had the maximum correlation coefficient value, and this value (ranged from −6 to +6) was defined as time-shift value of the voxel. (3) Shifting the time series of all voxels based on their relative time-shift value determined by step 2. For example, if the −2TR has the largest correlation coefficient with the template, then the time point at −2TR was set to time point 0, the rest of the time series were shifted with the same number of TRs in the timeline. (4) Averaging the realigned time series of the whole brain to create a new global time series template. (5) Repeating steps 2, 3, and 4 until the number of voxels, which had changed their time-shift value between two iterations, is less than 100. (6) Smoothing the final time-shift value of all voxels using Gaussian kernel (FWHM = 6 mm). (7) Subtracting the time-shift value of each voxel by the mean value of all voxels. The result of this step was defined as TSM.
The TSMs of all participants were then averaged to create a TSM of the elder group. The distributions of time-shift values in different vascular territories were analyzed according to a custom-made atlas based on previous knowledge of vascular territories and watershed areas (WSA), WSA as depicted in
The TSM of each participant was then converted to z-score for group analysis. Voxel-based analysis of the normalized TSM in group level was performed by using two-sample t-test in the Resting-State fMRI Data Analysis Toolkit (REST), version 1.8 (Song et al., 2011) to test the age effect to TSM. The differences between the younger group (<70 years, 70−) and elder group (>80 years, 80+) were investigated with gender and education as covariates. The clusters in the t-maps of group analysis were selected under a combined threshold of p < 0.001 and a cluster size of 351 mm3. This yielded a corrected threshold of p < 0.05, determined by Monte Carlo simulation using the AlphaSim program with parameters: FWHM = 6 mm, within the brain mask
Functional connectivity analysis
After the preprocessing steps of fMRI data, the residual signal in the frequency band of 0.1–0.01 Hz was further processed by regressing out the background noise with two different methods. The first method used the regressor created by averaging the time series of all voxels directly. The second method applied the global time series template obtained in the TSM analysis as regressor and shifted the regressor according to the time-shift value for each voxel using an in-house developed MATLAB code. The functional connectivity map of the DMN of each participant was then calculated by using the seed-to-voxel analysis in REST toolbox. The seed was located in the posterior cingulate cortex (PCC, MNI coordinate: X = 1 Y = −61 Z = 38) with 6 mm radius, and the voxels with a correlation coefficient value smaller than 0.2 were masked as 0. Fisher's Z-transform and paired t-test were used to compute the differences in functional connectivity between the data sets processed by two different noise regress strategies.
Results
The averaged TSM of the RS-fMRI data over 217 normal participants is shown in Figure 1. The blue-purple represents negative time shift, meaning that blood flow arrives in this area earlier than the averaged time-shift value among all voxels of the brain, while yellow-red represents positive time-shift value and late arrival time. The motor, somatosensory, and peri-insular cortex have the shortest, while the frontal, parietal, and temporal lobes, including regions of the DMN notably the PCC and lateral ventricle, show the longest time-shift values.

Averaged TSMs obtained from resting-state-functional magnetic resonance imaging data of 217 healthy participants. The blue-purple represents the blood flow that arrives in this area earlier than average, while yellow-red represents a late arrival. TSM, time-shift map. Color images available online at
A vascular territory mask was applied to assess the distribution of the time-shift value in different vascular territories. The box plot in Figure 2 illustrates that the middle cerebral artery (MCA) territory has the earliest blood arrival time (median value = 140 msec, 25th percentiles = 67 msec, and 75th percentiles = 211 msec) followed by the anterior cerebral artery (ACA) (median value = 56 msec, 25th percentiles = −35 msec, and 75th percentiles = 152 msec) and finally PCA territories (median value = 8 msec, 25th percentiles = −108 msec, and 75th percentiles = 99 msec).
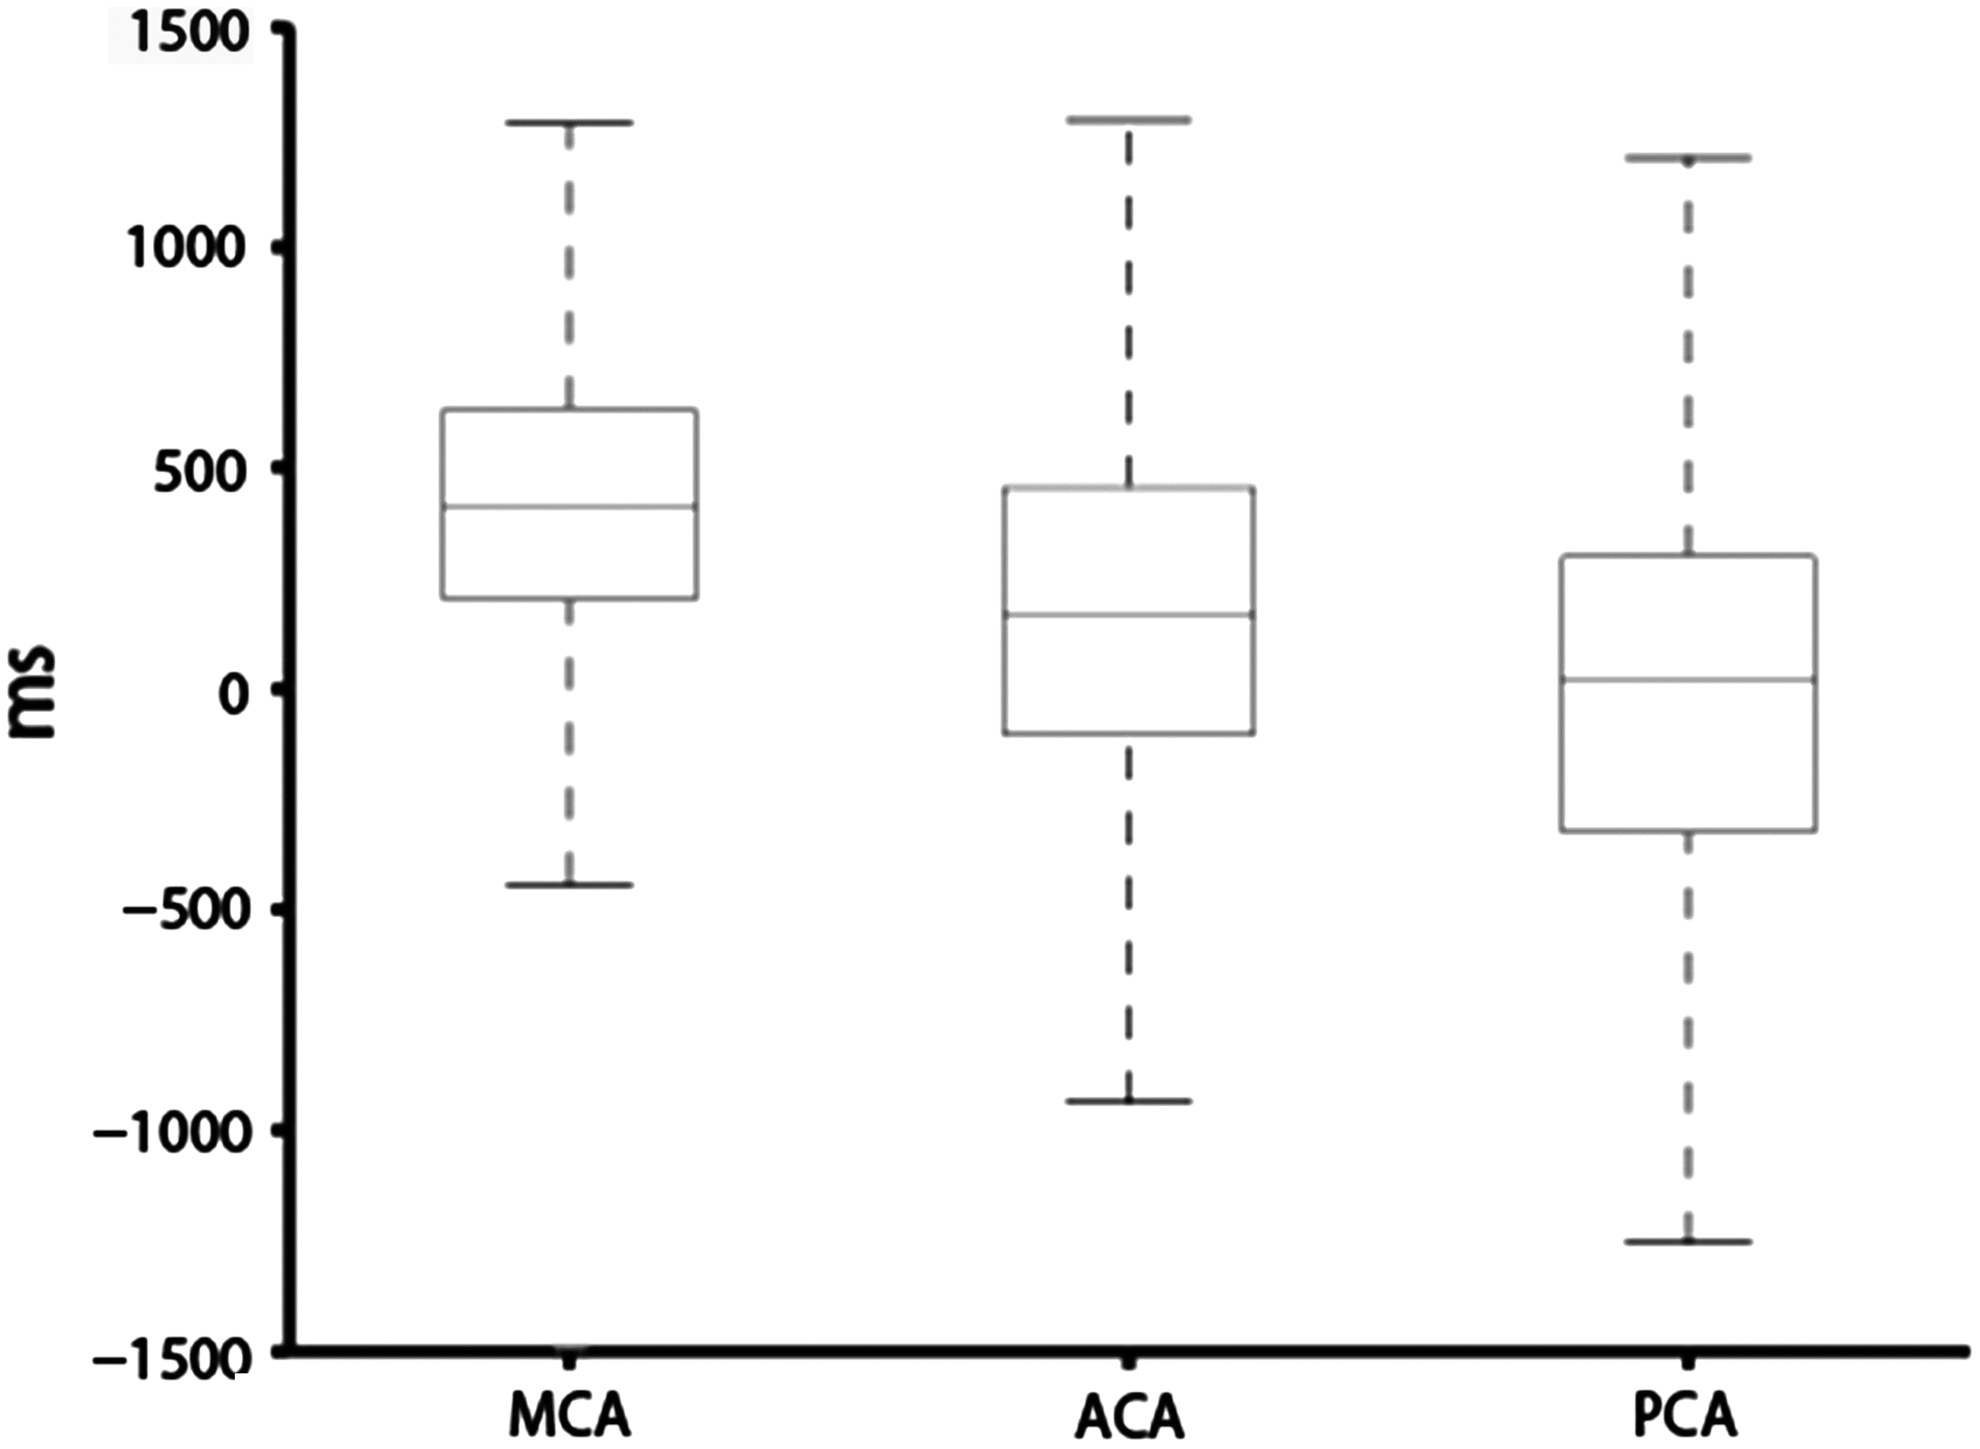
The statistic results of the time-shift value of voxels in different vascular territories. MCA, middle cerebral artery; ACA, anterior cerebral artery; PCA, posterior cerebral artery.
Figure 3 and Table 1 show the group differences between 70− and 80+. Compared with the 70− group, the 80+ group has longer time shift in the frontal horn of the lateral ventricle and the body of the lateral ventricle, with shorter time-shift values in the left parahippocampal gyrus.
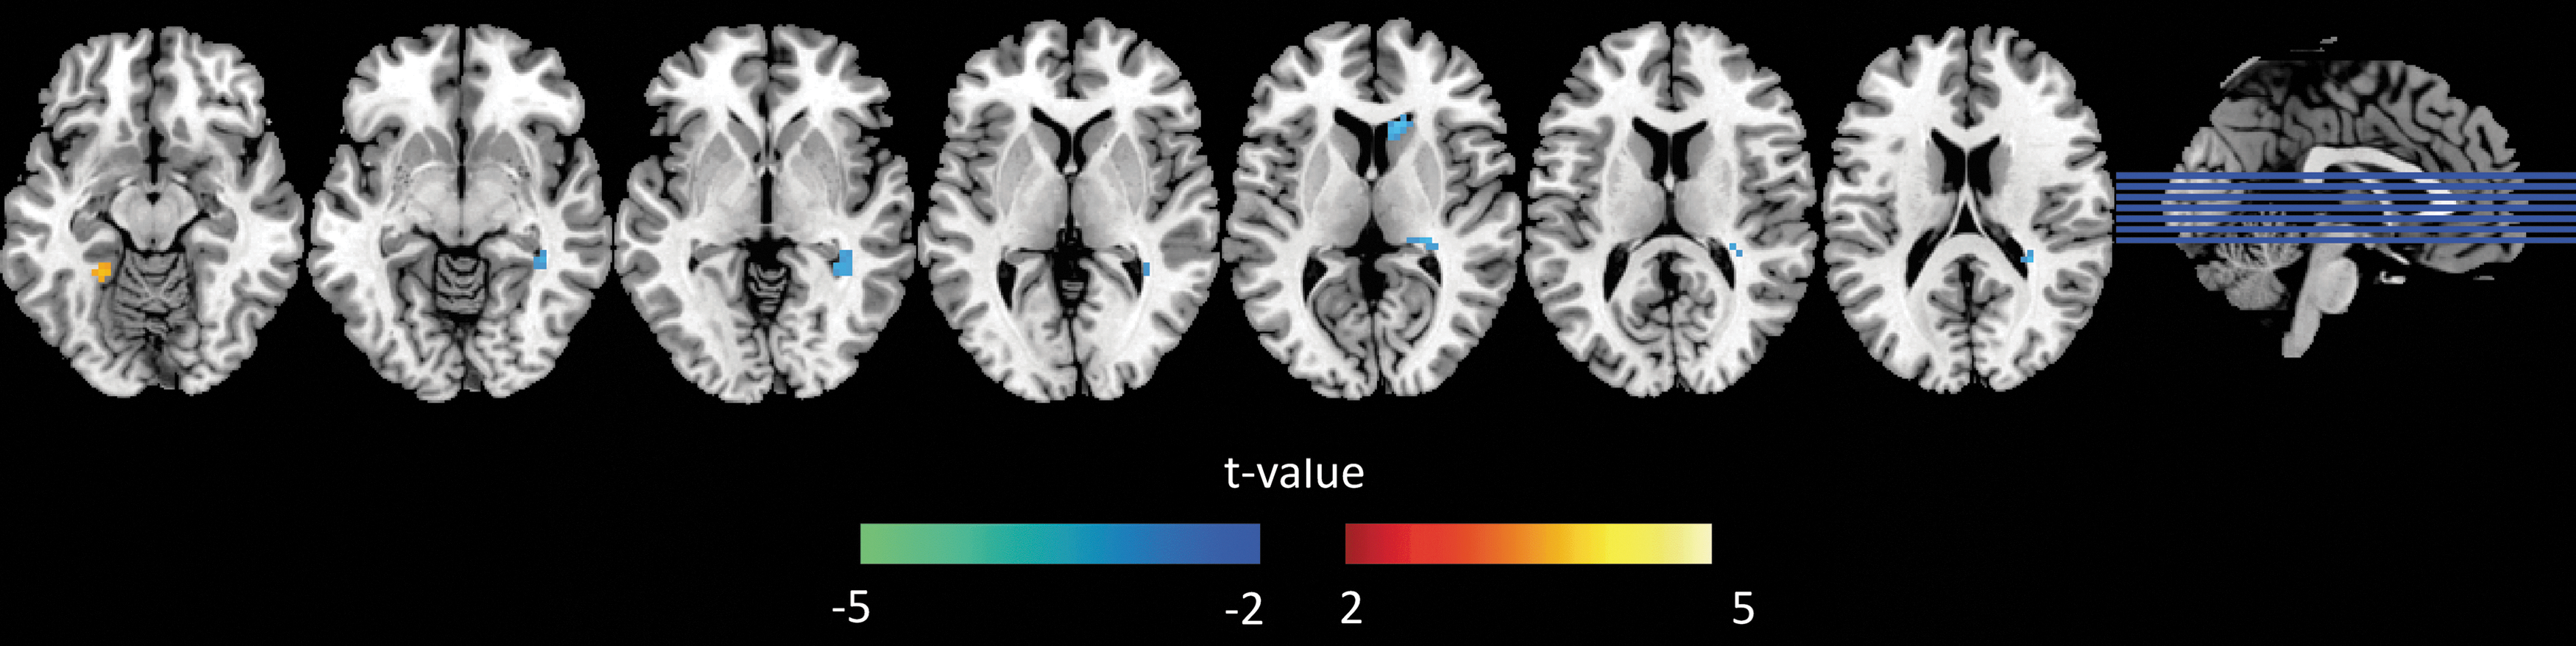
Group differences between 70− and 80+ cases based on a two-sample t-test with gender and education as covariates. The threshold was set to a corrected threshold of p < 0.05, determined by AlphaSim (threshold = p < 0.001). The color scale represents t-values. Green-blue color represents longer time shift in 80+ compared with 70−. Color images available online at
As shown in Figure 4, the time-shift values have a large variance in ventricles, brain stem, temporal lobe, and inferior frontal lobes. When comparing the variance in different vascular territories (Fig. 5), the PCA (median value = 0.81, 25th percentiles = 0.66, and 75th percentiles = 1.05) territory displays a more pronounced variance compared with ACA (median value = 0.69, 25th percentiles = 0.54, and 75th percentiles = 0.79) and MCA (median value = 0.66, 25th percentiles = 0.54, and 75th percentiles = 0.79).
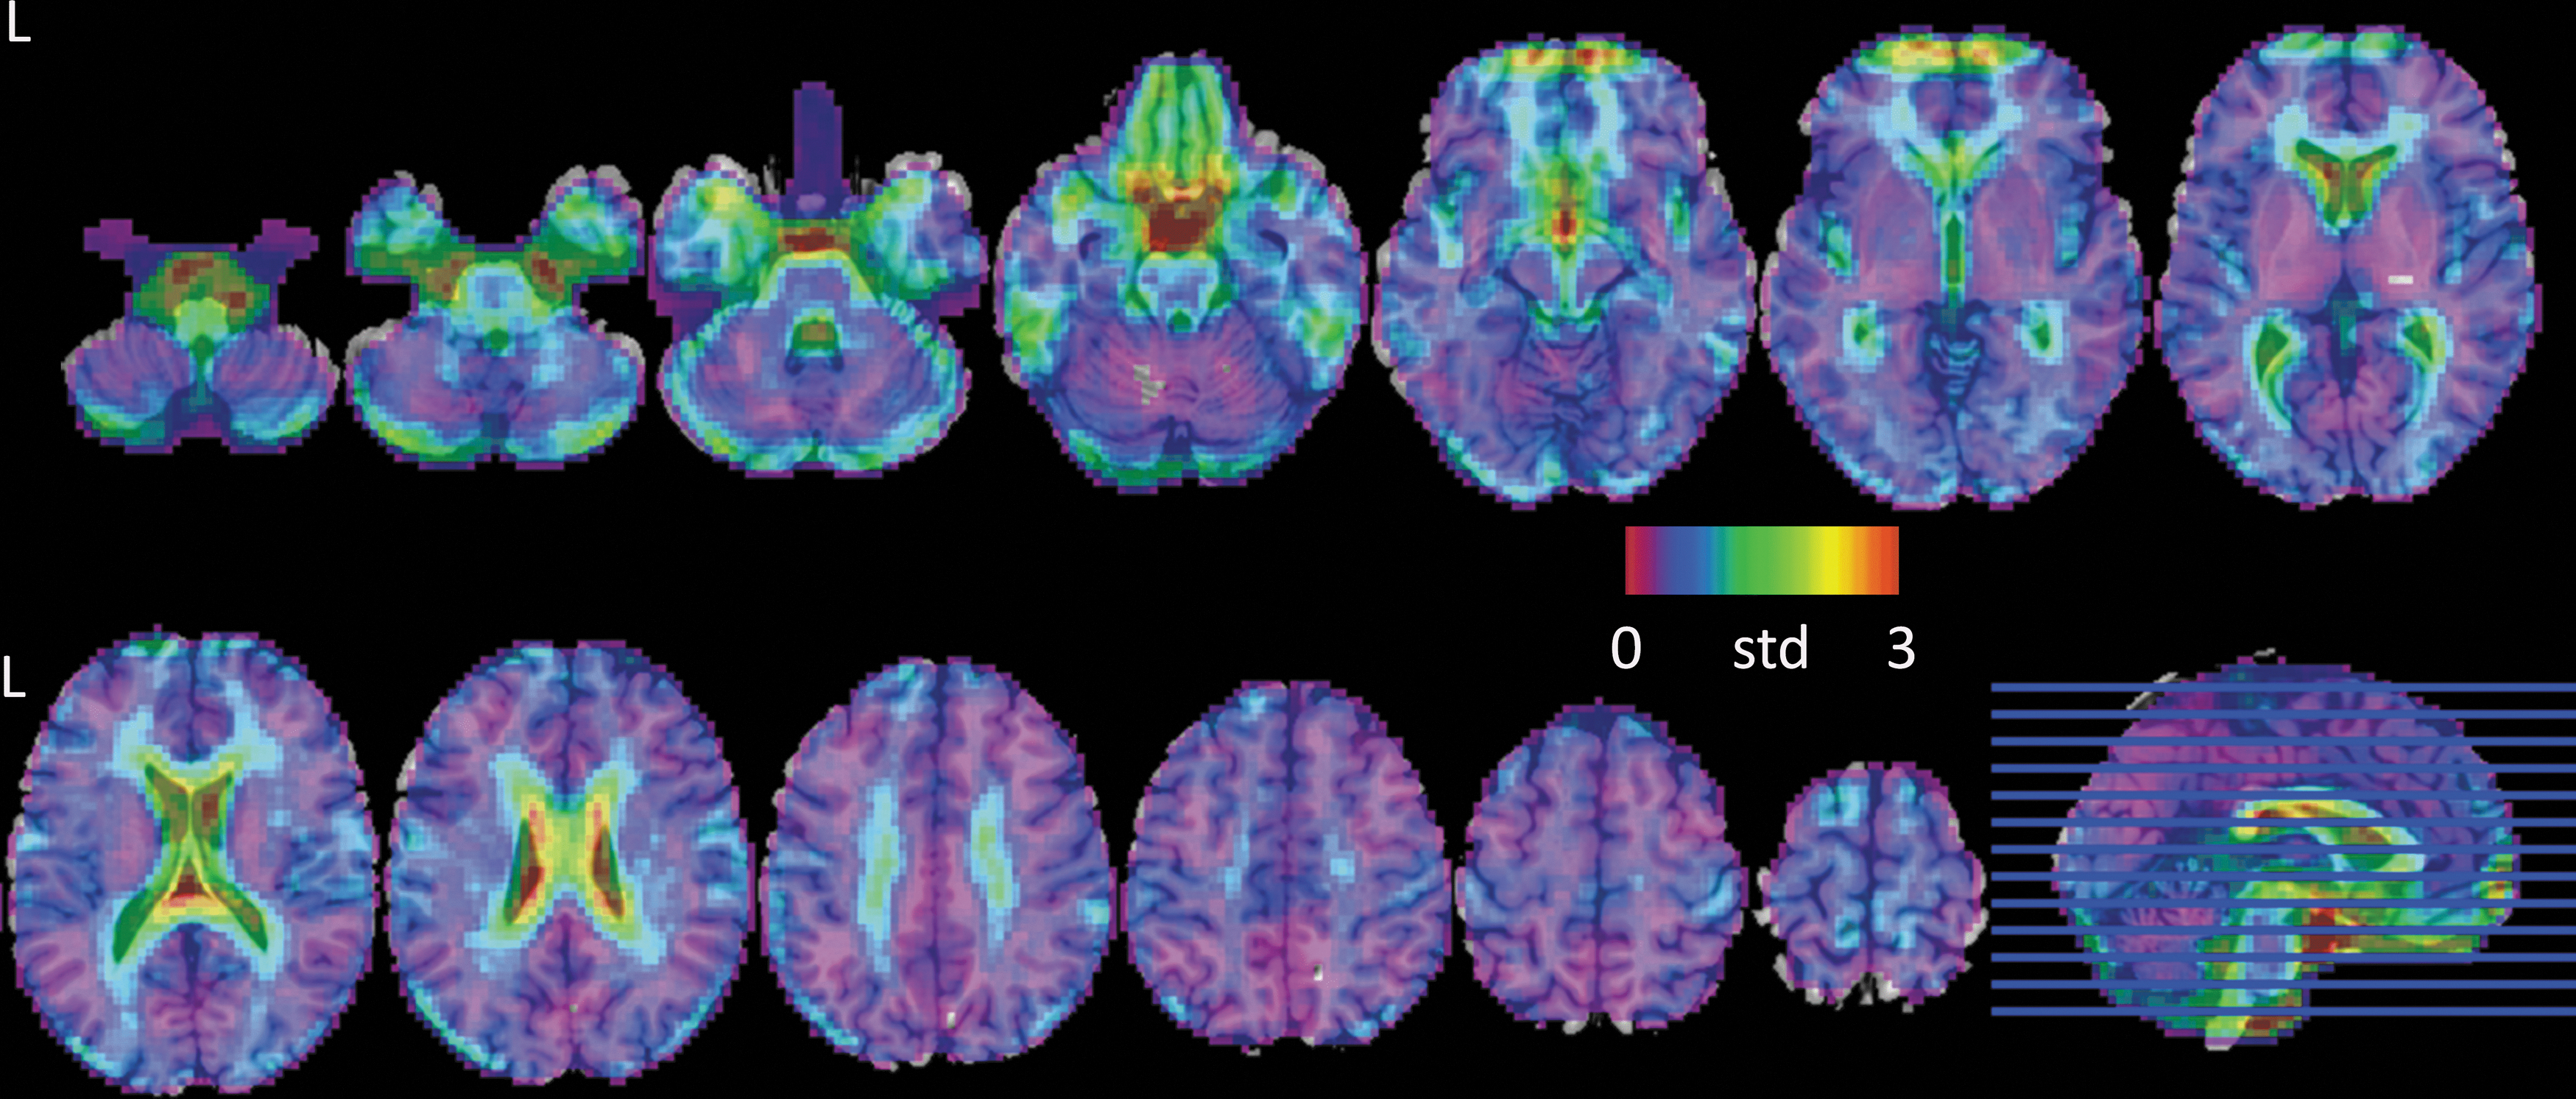
Cross-participant variability of TSM. Color images available online at
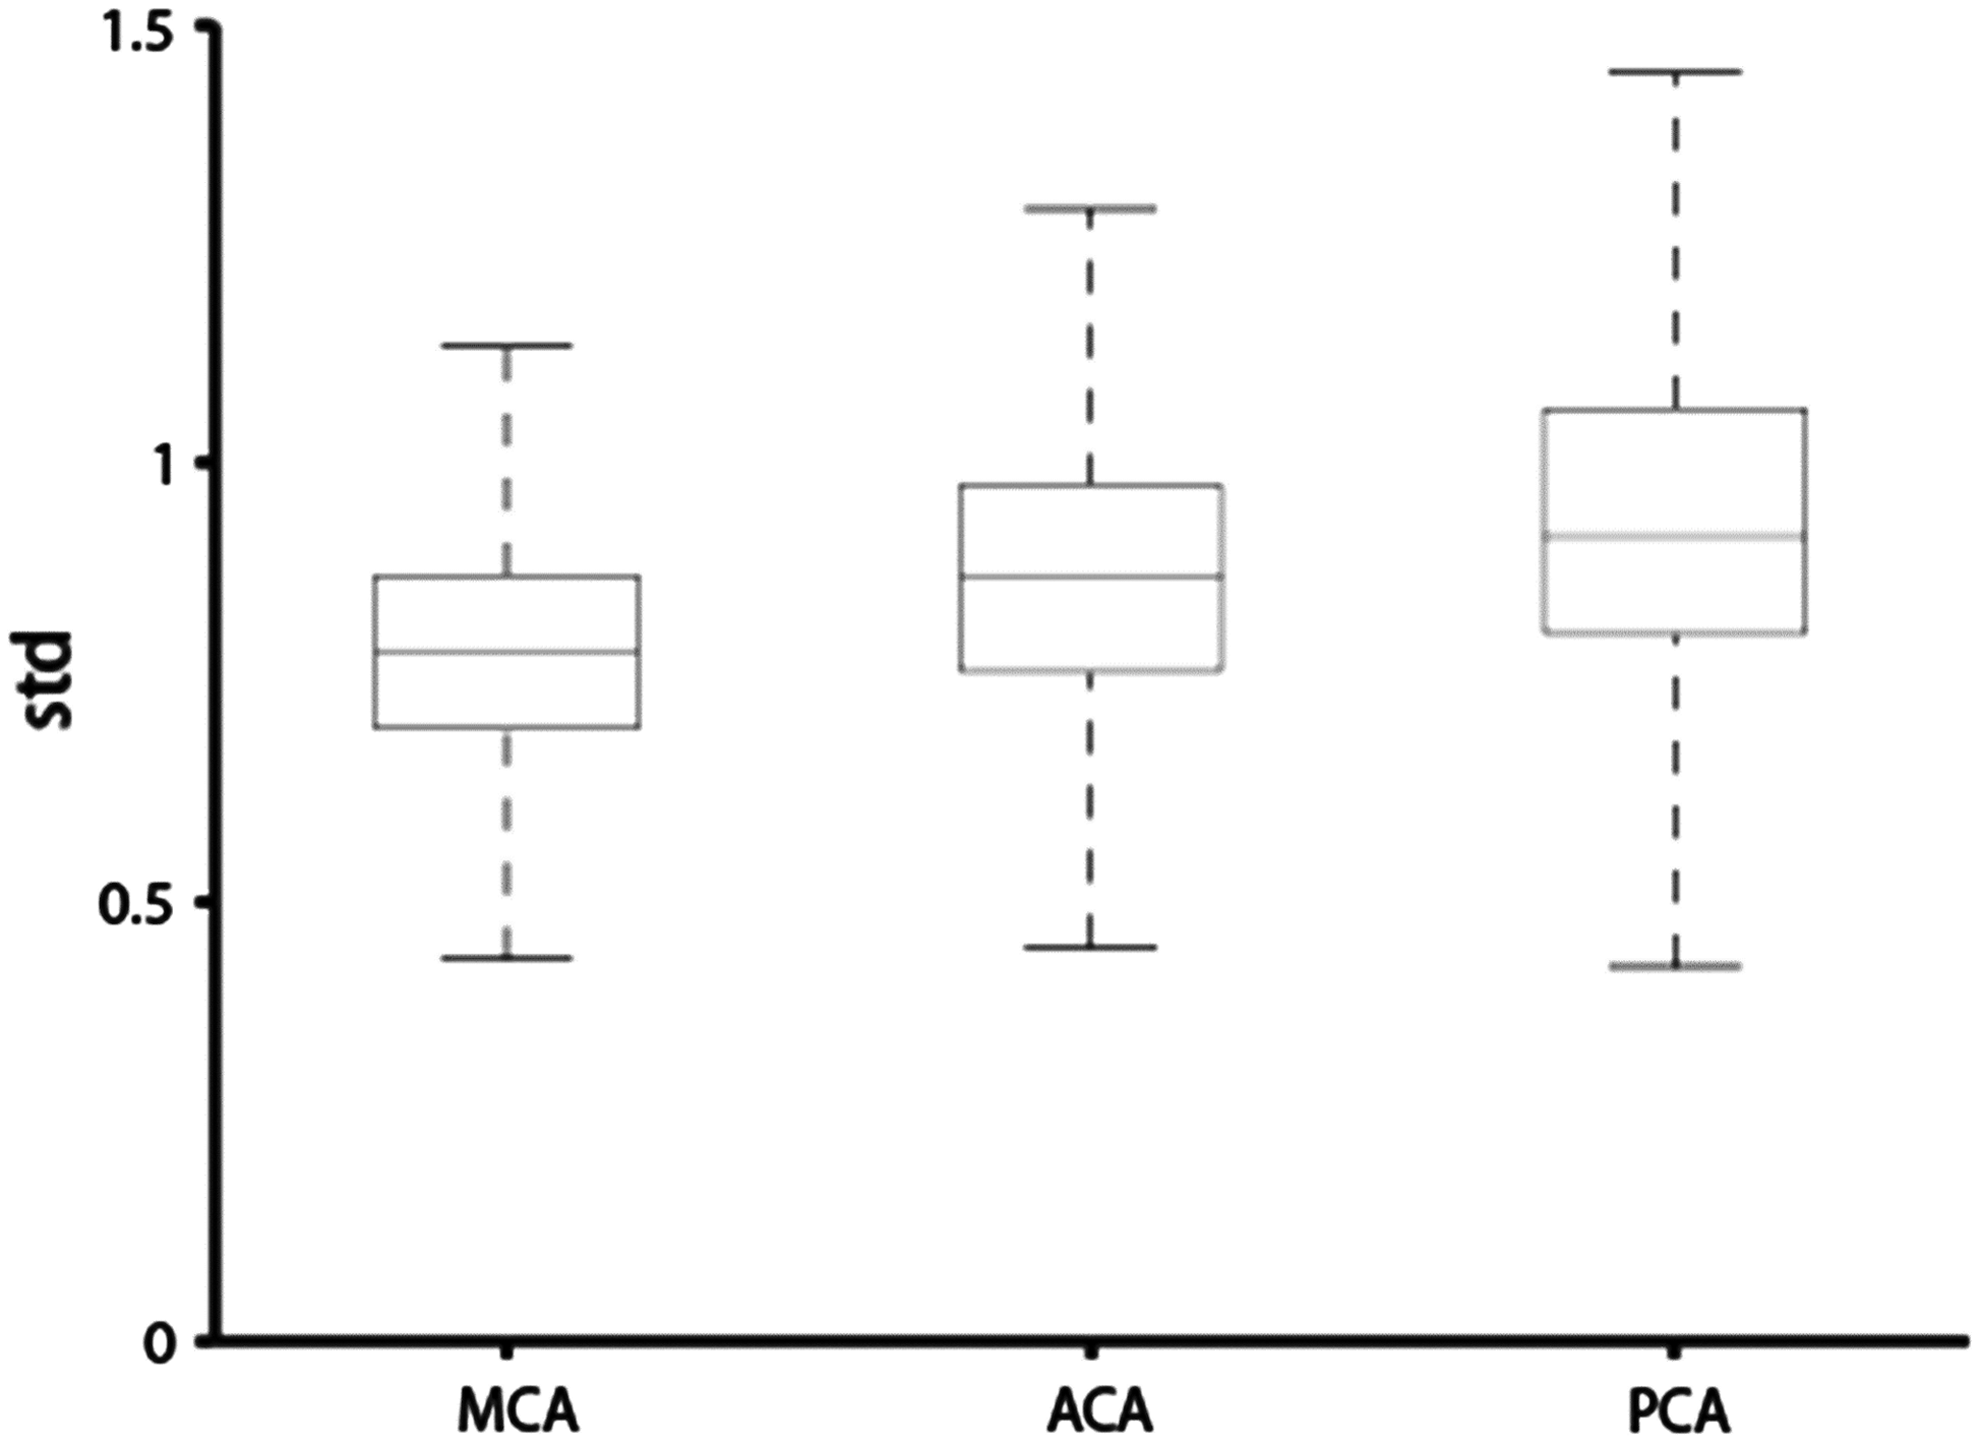
Cross-participant variability of time-shift values in different vascular territories. MCA, middle cerebral artery; ACA, anterior cerebral artery; PCA, posterior cerebral artery.
With respect to the functional connectivity maps of DMN in a single participant (Fig. 6), an enhanced correlation coefficient between the seed (in PCC) and the medial prefrontal cortex (mPFC) could be observed in maps obtained from the data processed by the time-shift regression method compared with the global average regression. The results of the paired t-test between the two covariance regression strategies shown in Figure 7 indicate that the time-shift regression method could enhance the connectivity within the DMN, including PCC, mPFC, middle temporal lobe, and angular gyrus. Details of the results were listed in Table 2.
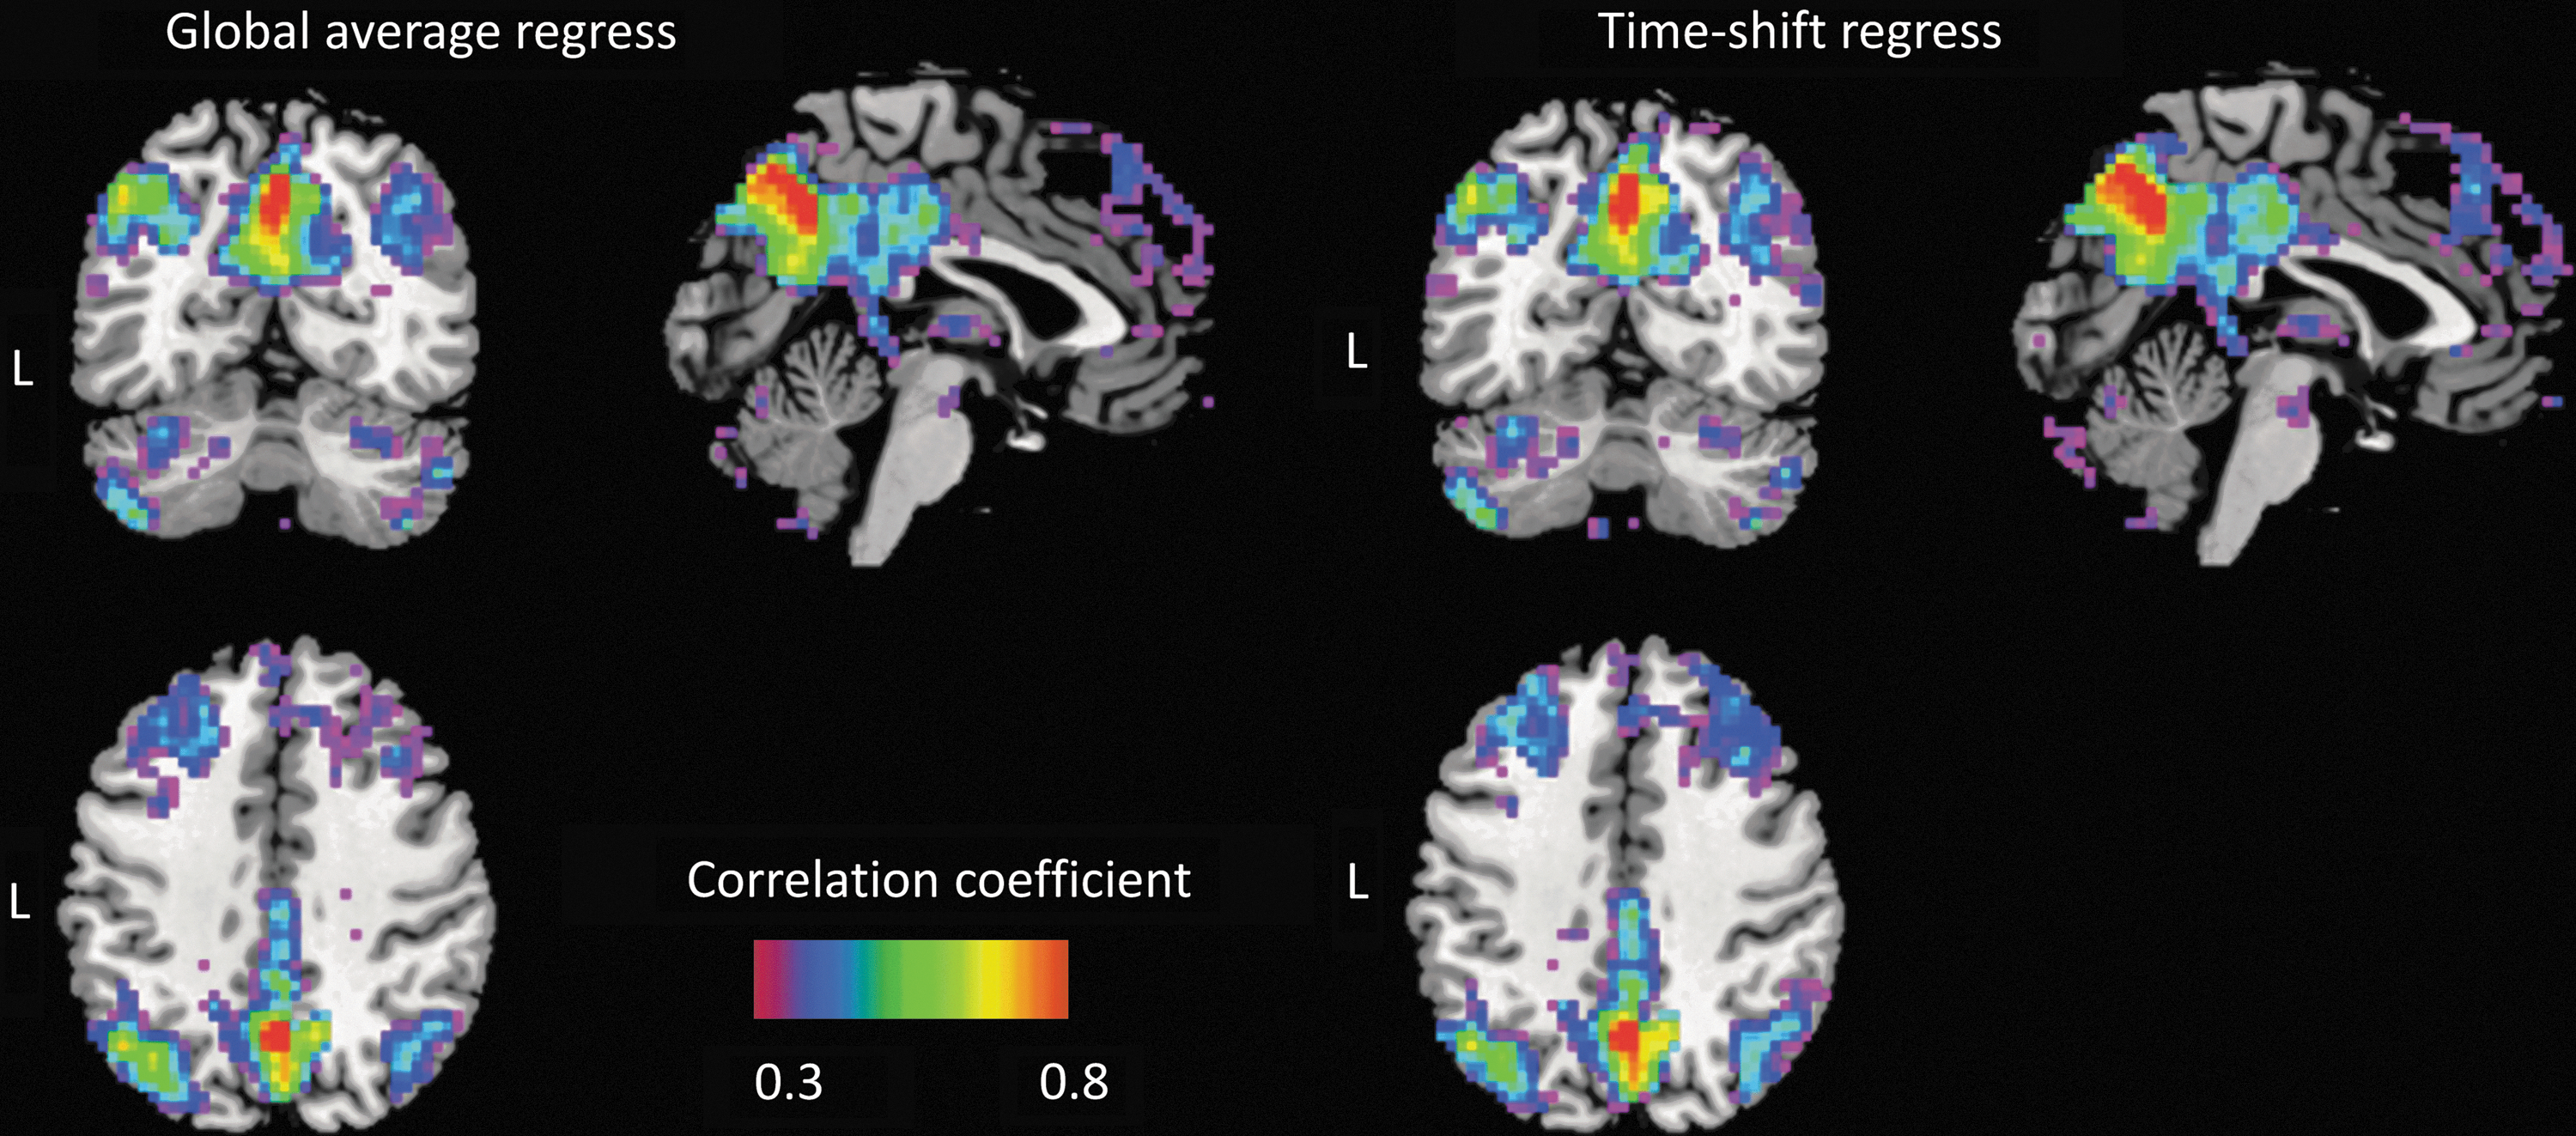
Functional connectivity map of the default mode network obtained from two different types of covariance regression strategies. Color images available online at
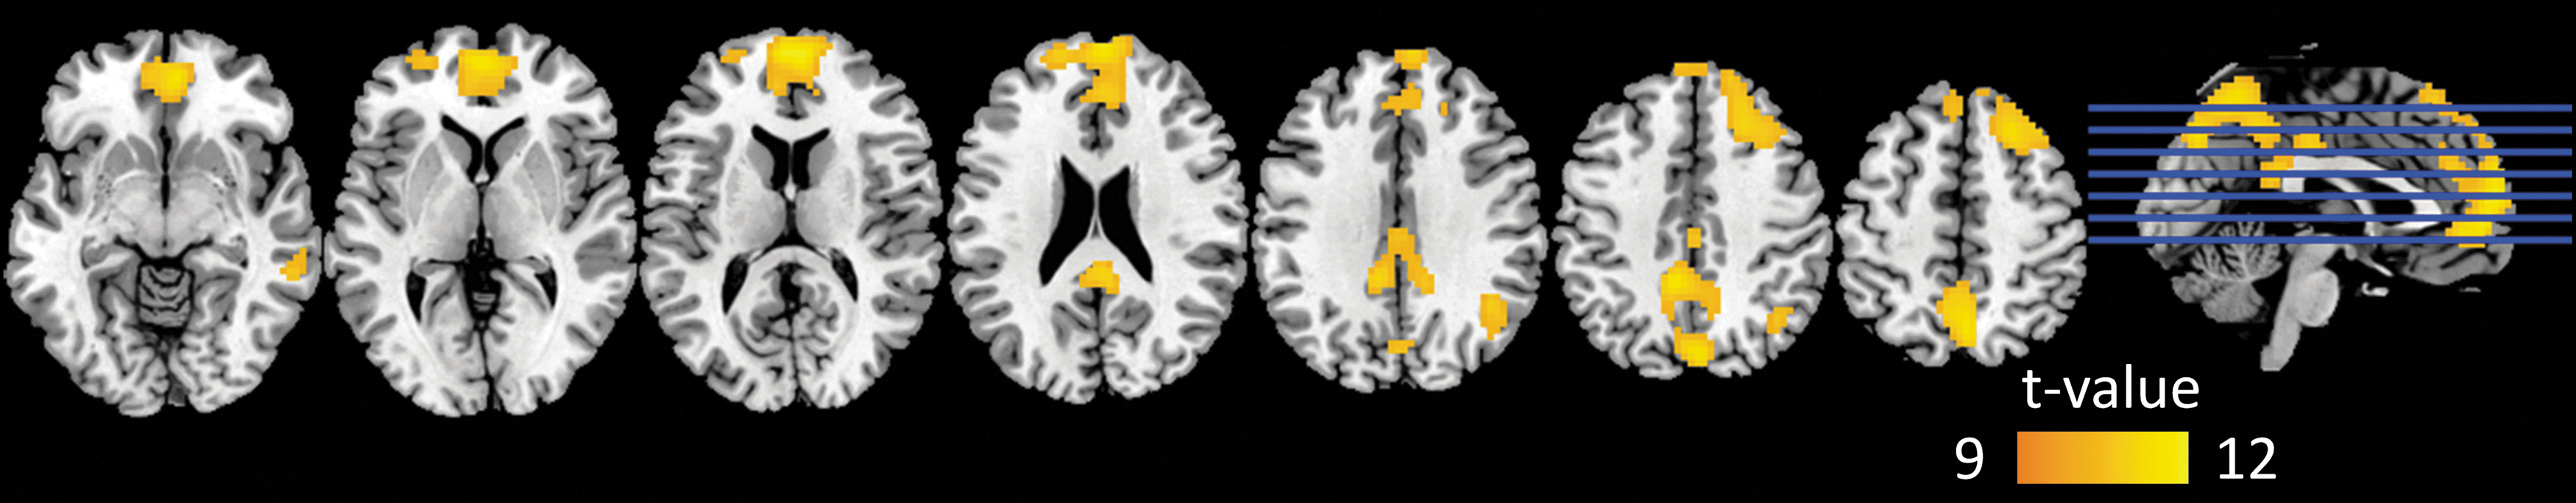
Time-shift regression versus global average regression differences of the functional connectivity maps among all participants. The orange-yellow represents higher correlation coefficient values with time-shift regression compared with global average regression. Color images available online at
Discussion
To our knowledge, this is the first study that evaluates the impact of the local timing of the vascular response on RS network functional connectivity patterns. Using innovative TSMs, our results show first that vascular speeds vary across the different cortical areas in the absence of external stimuli. Second, we demonstrate that taking into account the “reactivity maps” previously extracted, changes in RS-fMRI network activation in terms of delayed responses are present mainly in the periphery of the DMN.
The present findings show regional differences in terms of vascular speed notably in the precentral gyrus and motor cortex. These regions have therefore different timing of blood flow arrival than the rest of the brain. These results are in line with previous observations using breath-holding, showing changes in vascular reactivity between different parts of the brain (Geranmayeh et al., 2015; Iranmahboob et al., 2016; Lipp et al., 2015; Tancredi and Hoge, 2013). The motor cortex and precentral gyrus include representations of the respiratory muscles (Colebatch et al., 1991; Li and Rymer, 2011). This can partly explain the differences in cerebrovascular response of these brain areas.
After creating the “delayed maps” from the vascular response, we proceeded to take these maps into the RS analyses, using the DMN as the most prominent example. Our findings reveal significant differences in RS DMN functional connectivity patterns (in particular in its periphery) when taking into account the “delayed maps” of vascular response. In particular, the time-shift regression method could enhance the connectivity within the DMN, including PCC, mPFC, middle temporal lobe, and angular gyrus. These results are in line with previous works investigating changes in the cerebrovascular reactivity (Golestani et al., 2016; Haight et al., 2015), showing that the BOLD signal is potentially mediated by concomitant alterations in the cerebrovascular response. Our observations support the idea that the presence of varied cerebrovascular response may be the major vascular modulator of RS-fMRI (Golestani et al., 2016). The present results imply that not taking into account any vascular information is a good approximation, yet it is not totally accurate. In line with previous studies (Golestani et al., 2016), we suggest a group correction for vascular maps in RS-fMRI analyses, to depict cerebrovascular differences and exclude potential confounding effects.
Functional connectivity analyses, regardless whether seed based or independent component analysis based, intrinsically assume that the vascular BOLD response to neuronal activation is equal across the brain. We, however, know from vascular anatomy that this is not the case. The known vascular variations in the blood supply of the brain have been ignored in most fMRI studies, yet may cause a systematic and local effect in the brain—while other physiological parameters such as respiration in general affect the entire brain globally. Without the cerebrovascular response, the BOLD signal after standard preprocessing steps may still contain the perfusion-related pattern, but in different phases across different brain areas. This type of “noise” will reduce the correlation coefficient when running functional connectivity analysis. By regressing out the global averaged signal, this perfusion pattern could be removed from the areas that are in the same phase of the global pattern, but still exist in the voxels containing perfusion patterns in different phases.
DMN is a widely distributed network that has areas located in at least two brain vascular territories, ACA and MCA. It is further know that the DMN recovers in an anteroposterior temporal gradient when switching from task to rest (Van et al., 2012).
The correlation coefficient value between PCC and mPFC will be affected by the brain vascular response time in ACA and MCA. The shifted regressor can provide better modeling of the BOLD fluctuation due to brain vascular response, removing this part of noise can further improve the accuracy of real functional connectivity without “perfusion relationship.” Several brain vascular territory-based regressor combinations could also been considered to remove this component, paralleling the idea of modeling physiological patterns proposed in a previous study (Chang et al., 2009). Our results could further demonstrate that when taking into account these local variations in time shift, this may indeed and as expected increase the estimated correlation.
Besides their neuroradiological relevance, our observations may also have clinical significance. Small but notable differences in the cerebrovascular response may be particularly important in a clinical population. In fact, elderly individuals (80+) may have stronger variation in cerebrovascular response compared with younger controls (70−) due to increasing prevalence of vascular comorbidity. The observed variations of this parameter between cases younger than 70 years and older than 80 years further suggest that this hemodynamic parameter may display significant fluctuations in elderly individuals due to vascular morbidities. Consequently, vascular-related confounding effects on RS-fMRI may be stronger in very old individuals. Therefore, when performing RS analyses in young volunteers, correcting for vascular maps might not generate prominent differences. However, in an older cohort with vascular comorbidity, the situation may be very different.
The temporal delay in BOLD signals has first been investigated in acute stroke by Yating et al. (Lv et al., 2013). Some other groups also tried to calculate the time delay of the lesion area in ischemic stroke and moyamoya patients (Christen et al., 2015; Khalil et al., 2017; Siegel et al., 2016). These studies used the averaged time series of BOLD signal within a whole-brain mask or manually picked region of interest (ROI) as the template of fluctuation pattern to measure the time delay. Due to the changed time shift in different vascular territories, simply averaging the time series of all voxels together will mix the patterns in different phases. The manually selected ROI might have subjective bias and might also lead to unclear patterns due to the insufficient signal to noise ratio. One of our previous studies (Qian et al., 2015) showed that the abnormal perfusion areas detected with iterative algorithms were more consistent with dynamic susceptibility contrast MRI than the method without iteration. In such cases, the iterative algorithm proposed in this study could extract the time series pattern automatically and more accurately. Although the results in normal subjects were closely matched to the known anatomic vascular territories, this algorithm was based on the hypothesis that the first template obtained by the average time series of all brain voxels still keeps the main pattern for calculating TSM. However, this hypothesis may not always be correct (e.g., using prior knowledge of whole-brain perfusion pattern may improve the starting template in the iterative algorithm). In this study, we did not acquire any CT/MR perfusion data with contrast agent injected. So, the accuracy and reliability of this method in normal subjects still need to be evaluated in a future study.
To conclude, the present study aims to specifically assess the TSMs that give an estimate of the local timing of the vascular response and to check whether local differences in the speed of the vascular response influence the estimated RS networks. Our results show that taking into account the cerebrovascular delayed maps slightly modify the DMN as the most prominent example of the RSNs. Therefore, we suggest that a group correction for vascular maps in RS-fMRI measurements is essential to correctly depict functional differences and to exclude potential confounding effects.
Limitations
Two main limitations should be considered when interpreting our data. First, the present analysis is confined to the DMN and does not address the impact of the cerebrovascular reactivity on other RSN activation patterns. Second, the temporal resolution of the BOLD signal was only 2000 msec, so we can only detect the large time delay. Future works should extend this investigation and study possible influences of cerebrovascular reactivity on other RSNs. Moreover, a simultaneous multislice EPI sequence to acquire BOLD signal in a higher spatial and temporal resolution should be applied to detect the time delay more accurately.
Footnotes
Acknowledgments
The authors acknowledge Dr. Ignacio Vallines, Dr. Aurelien Stalder, and Dr. Yi Sun for discussing this research project and giving useful suggestions during the preparation of the article.
Author Disclosure Statement
T.Q. is an employee of Siemens Healthcare.