
Abstract
Background:
Autism spectrum disorder (ASD) is a highly heterogeneous developmental disorder with diverse clinical manifestations. Neuroimaging studies have explored functional connectivity (FC) of ASD through resting-state functional magnetic resonance imaging studies; however, the findings have remained inconsistent, thus reflecting the possibility of multiple subtypes. Identification of the relationship between clinical symptoms and FC measures may help clarify the inconsistencies in earlier findings and advance our understanding of ASD subtypes.
Methods:
Canonical correlation analysis was performed on 210 ASD subjects from the Autism Brain Imaging Data Exchange to identify significant linear combinations of resting-state connectomic and clinical profiles of ASD. Then, hierarchical clustering defined ASD subtypes based on distinct brain–behavior relationships. Finally, a support vector machine (SVM) classifier was used to verify that subtypes comprised subjects with distinct clinical and connectivity features.
Results:
Three ASD subtypes were identified. Subtype 1 exhibited increased intra-network FC, increased Intelligence Quotient (IQ) scores, and restricted and repetitive behaviors. Subtype 2 was characterized by decreased whole-brain FC and more severe Autism Diagnostic Interview-Revised and Social Responsiveness Scale symptoms. Subtype 3 demonstrated mixed FC, low IQ scores, as well as social motivation and verbal deficits. To verify subtype assignment, a multi-class SVM using connectomic and clinical profiles yielded an average accuracy of 71.3% and 65.2% respectively for subtype classification, which is significantly higher than chance (33.3%).
Conclusion:
The present study demonstrates that combining connectomic and behavioral measures is a powerful approach for disease subtyping and suggests that there are ASD subtypes with distinct connectomic and clinical profiles.
Impact statement
Autism spectrum disorder (ASD) is a highly heterogeneous developmental disorder with diverse clinical manifestations. Neuroimaging studies have explored the functional connectivity of ASD through resting-state functional magnetic resonance imaging studies; however the findings have remained inconsistent, thus reflecting the possibility of multiple subtypes. Identifying subtypes of ASD based on correlated clinical and connectomic profiles may elucidate the heterogeneity of ASD and lead to better targeted therapies for each subtype.
Introduction
Autism Spectrum Disorder (ASD) is a heterogeneous disorder characterized by deficits in social communication and social interaction, as well as restricted and repetitive behaviors (RRBs; American Psychiatric, 2013). The symptoms and severities of ASD vary widely; social communication deficits range from nonverbal ASD to difficulty interacting and relating to others, whereas RRBs range from self-stimming behaviors to intense and restricted focus (American Psychiatric, 2013). In addition, there is variation in cognitive impairments implicated in the disorder; ASD is comorbid with intellectual disabilities 50–80% of the time (Simonoff et al., 2008), whereas ∼44% of individuals with ASD have Intelligence Quotient (IQ) scores in the average to above average range (Maenner et al., 2020). The underlying brain connectivity associated with the deficits in ASD behavior and cognition is not fully understood.
Resting-state functional connectivity (FC) patterns are predictive of clinical symptoms in ASD (Plitt et al., 2015). The default mode network (DMN) is the most highly implicated network in ASD and it plays a role in social functions, mentalizing, and the theory of mind (Padmanabhan et al., 2017). To date, no consistent pattern of aberrant FC in ASD has emerged in the literature (see Hull et al., 2016). Studies reporting hyperconnectivity across brain networks, including the DMN, have suggested that hyperconnectivity is associated with RRB severity (Dupong and Di Martino, 2020; McKinnon et al., 2019; Monk et al., 2009; Uddin et al., 2013b). However, other studies have indicated that hypoconnectivity across brain regions is predictive of RRB severity (Assaf et al., 2010; Weng et al., 2010). In addition, several studies have found anterior–posterior hypoconnectivity involving regions of the DMN in ASD, and the degree of hypoconnectivity was predictive of the severity of social impairments (Assaf et al., 2010; Weng et al., 2010; Yerys et al., 2015).
The heterogeneity of FC patterns in ASD has led to the development of several competing neurodevelopmental models of ASD. These theories include the underconnectivity hypothesis (Just et al., 2012), aberrant within- and between-network connectivity (Lynch et al., 2013; Monk et al., 2009; Yerys et al., 2015), abnormal local and long distance connections (Anderson et al., 2011; Belmonte et al., 2004), and age-related changes in connectivity (Uddin et al., 2013a). The heterogeneity in clinical presentation and neurodevelopmental models of ASD may indicate that there are ASD subtypes with distinct clinical and FC patterns.
A few studies have explored ASD subtypes based on (1) structural magnetic resonance imaging (MRI; Hong et al., 2018; Hrdlicka et al., 2005), (2) cognitive lab tasks (Feczko et al., 2018), (3) common symptoms of ASD (Georgiades et al., 2013), and (4) resting-state functional MRI (fMRI; Easson et al., 2019). The recent work that subtyped ASD based on resting-state FC and their clinical profiles treated the two dimensions independently (Easson et al., 2019). However, current literature has shown that FC profiles and ASD symptoms co-occur (Assaf et al., 2010; Lynch et al., 2013; Monk et al., 2009). Here, we present an alternative approach to subtype ASD by using canonical correlation analysis (CCA) to examine dimensions of connectomic patterns and associated clinical profiles, aiming at elucidating the complex and heterogeneous nature of ASD.
CCA is a multivariate statistical method that is used to identify correlations between two sets of variables (Hotelling, 1992). It has been used to identify linear combinations of connectivity features that were correlated with a linear combination of clinical features in psychiatric disorders (Drysdale et al., 2017; Xia et al., 2018). Xia et al. linked dimensions of psychopathology with specific FC profiles, and Drysdale et al. identified linear combinations of connectivity features with major depressive disorder symptoms by using CCA. Inspired by the studies cited earlier, we applied CCA to identify the association of brain–behavior profiles and then used hierarchical clustering to define subtypes with specific patterns of FC and clinical symptoms. Finally, we use a multiclass support vector machine (SVM) classifier with fivefold cross-validation to verify subtype assignment by predicting which subtype each subject belongs to by using their FC and clinical profiles.
Materials and Methods
Dataset
Resting-state fMRI data and corresponding phenotypic information from the Autism Brain Imaging Data Exchange (ABIDE), an open-access consortium of neuroimaging data from more than 24 international scanning sites (Di Martino et al., 2014), were used in this analysis. The ABIDE study was approved by the local Institutional Review Boards (IRBs) of all participating sites and sites are required to confirm that their local IRB or ethics committee have approved both the initial data collection and the retrospective sharing of a fully deidentified version of the datasets. Two hundred ten ASD subjects from seven sites (ETH Zurich, Georgetown University, Kennedy Krieger Institute, New York University Langone Medical Center Sample 1, New York University Langone Medical Center Sample 2, San Diego State University, and Trinity Center for Health Sciences) with resting-state fMRI data, T1-weighted structural scans, and clinical assessments containing IQ scores, Autism Diagnostic Interview-Revised (ADI-R) assessments, and Social Responsiveness Scale (SRS) scores were chosen for analysis. Demographic information, including scanning sites, age, sex, and mean values of IQ (full scale IQ (FIQ), verbal IQ (VIQ), performance IQ (PIQ), ADI-R (social, verbal, and RRB), and SRS (awareness, cognition, communication, motivation, and mannerisms), is shown in Table 1. Further information regarding subject medication status and comorbidities can be found in Supplementary Table S1.
Subject Demographic Information
ADI-R, Autism Diagnostic Interview-Revised; ETH, ETH Zurich; GU, Georgetown University; IQ, Intelligence Quotient; KKI, Kennedy Krieger Institute; NYU 1, New York University Langone Medical Center Sample 1; NYU 2, New York University Langone Medical Center Sample 2; SD, standard deviation; SDSU, San Diego State University; SRS, Social Responsiveness Scale; TCD, Trinity Center for Health Sciences; .
The ADI-R contains social, verbal, and RRB subscales. Each subscale consists of individual questions that are rated on a scale of 0–3, where a score of 0 means that the behavior is not present and a score of 3 means that the behavior is severely present. For each subscale, the numbers are summed and the participant is given a single score (Lord et al., 1994). The SRS contains 65 questions measuring behavior in the following social domains: awareness, cognition, communication, motivation, and mannerism. Each subscale consists of items that are scored from 1 to 4, where a score of 1 means the symptom is not present and a score of 4 means the symptom is severely present. The scores for each of the social subscales are summed, and a single score is given to each participant for each subscale (Booker and Starling, 2011).
Image acquisition
Imaging data used in this analysis were collected on 3T MRI scanners. Scan parameters for the resting-state fMRI protocols are summarized in Table 2. For each subject, a T1-weighted structural image was collected and used for registration to MNI152 space. Full details for acquisition parameters, informed consent, and site-specific protocols can be found at
Resting-State Functional Magnetic Resonance Imaging Scan Parameters
ETH Zurich (ETH), Georgetown University (GU), Kennedy Krieger Institute (KKI), New York University Langone Medical Center Sample 1 (NYU 1), New York University Langone Medical Center Sample 2 (NYU 2), San Diego State University (SDSU), and Trinity Center for Health Sciences (TCD), degrees (deg), Echo Time (TE), Repetition Time (TR), Field of View (FOV).
Preprocessing
The resting-state fMRI data were preprocessed by using the Connectome Computation System (CCS) pipeline (Zuo et al., 2013), and data were parcellated into 200 regions of interests (ROIs) through a spectrally constrained clustering algorithm (Craddock et al., 2012). The CCS preprocessing pipeline included slice time correction, motion correction, skull stripping, global mean intensity normalization, nuisance signal regression, band pass filtering (0.01–0.1 Hz), and registration of the resting-state fMRI image to the T1-weighted image, followed by a transformation to standard space (Zuo et al., 2013).
Functional connectivity matrices and parcellation
Pearson's correlation coefficient was used to ascertain the FC of each ROI pair, resulting in a 200 × 200 FC matrix for each subject (Fig. 1b). Each correlation coefficient was Fisher z-transformed; then, linear regression was used to regress out age, sex, and site covariates to ensure that confounding variables did not affect CCA results. Cortical ROIs from the resultant residual matrices were then grouped into networks by using a seven-network liberal parcellation mask from Thomas Yeo (Yeo et al., 2011).
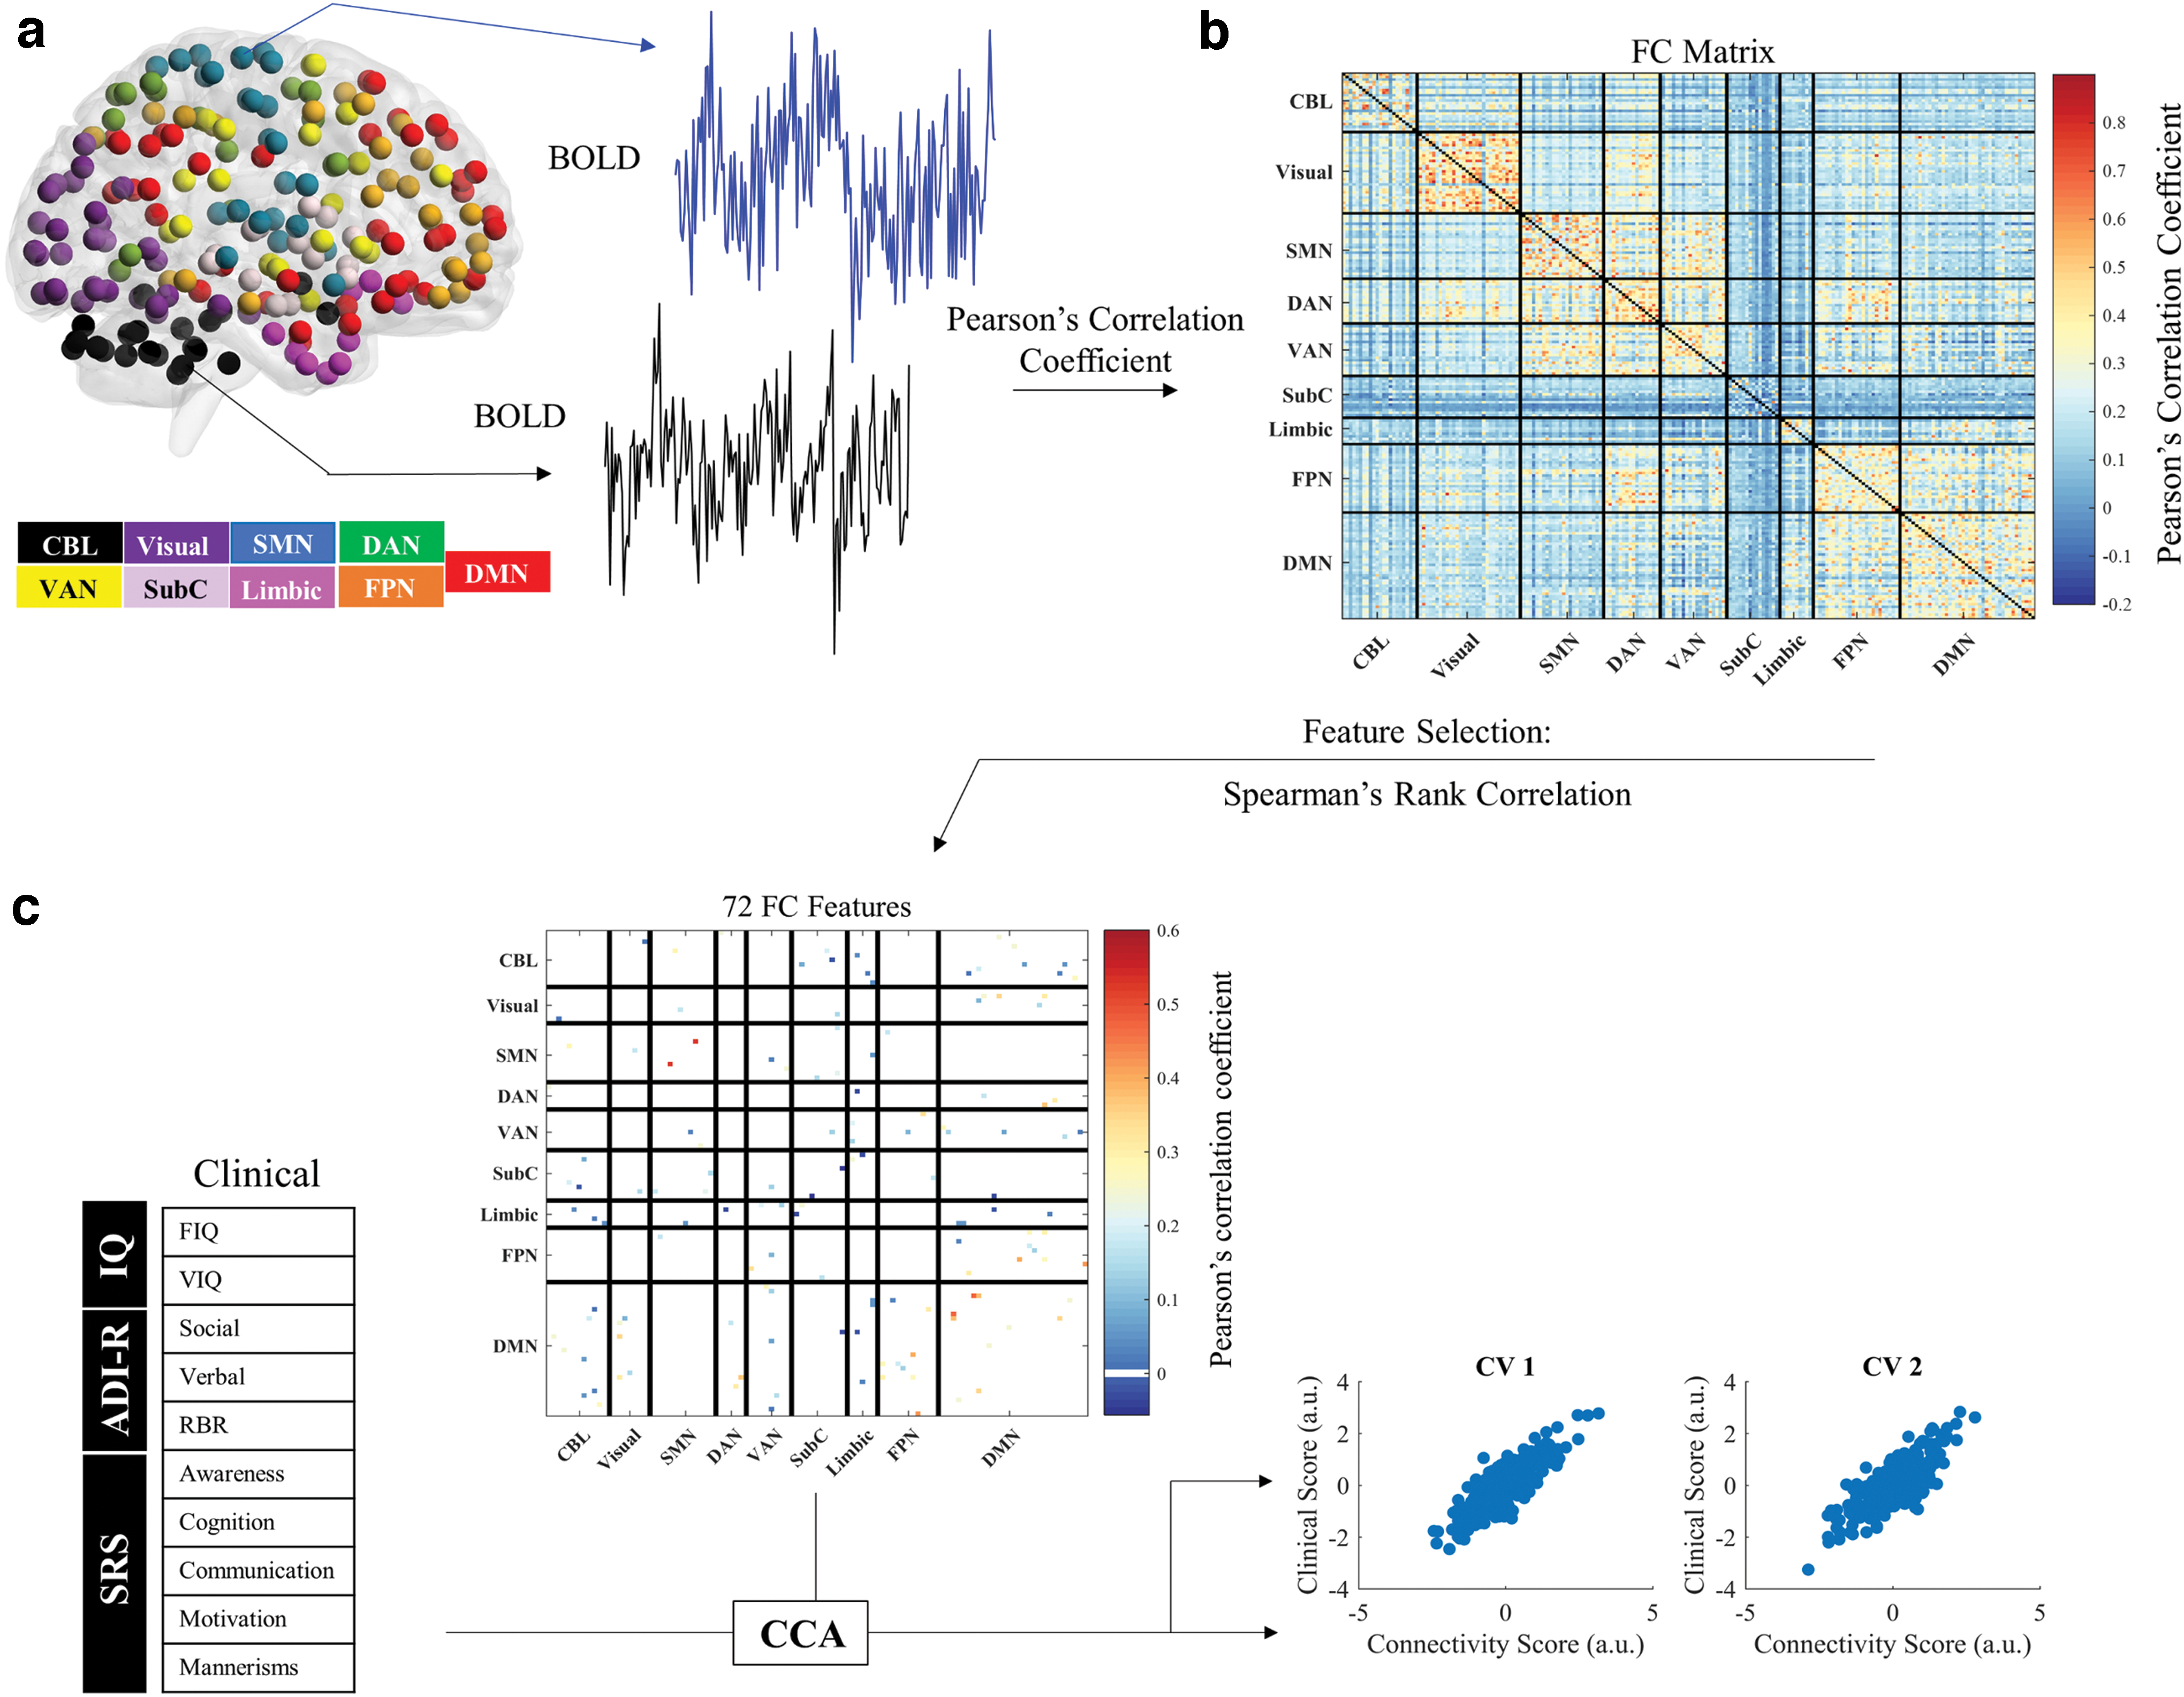
Data analysis and CCA schematic.
Feature selection
The FC matrices contain 19,900 (200 × 199/2) unique connectivity features for every subject. To identify non-redundant and relevant connectivity features that will lead to meaningful ASD subtypes based on correlated clinical and connectivity features, we selected a subset of connectivity features by using Spearman's rank correlation coefficients. The top 100 FC features that were most highly correlated with 1 or more of the 11 clinical features were selected by using MATLAB's
The neuroanatomical distributions of the FC features identified by using Spearman's rank correlation coefficient.
Canonical correlation analysis
CCA is an unsupervised learning technique that assigns loadings to two sets of variables to maximize their correlation (Hotelling, 1992). Here, we used CCA to identify linear combinations of FC and clinical features to define a low dimensional representation of the selected features in subjects with ASD. The input data consisted of 72 unique FC features and 10 clinical variables. Each resulting linear combination (“canonical variate”) represents a weighted set of FC features that are related to a weighted set of clinical features (Fig. 1c). Bartlett's chi-square test was used to evaluate canonical correlations, and the corresponding p value (the right tail significance level for χ2) was used to test for the significance of canonical correlations (Mardia et al., 1979). The connectivity patterns from the first two canonical variates (CVs) were used as the dimensions for which subjects were projected onto for subtyping.
Hierarchical clustering
We applied hierarchical clustering to define distinct subtypes of ASD with linked FC and clinical profiles along the first two CV dimensions. The optimal number of clusters was determined by using the Calinski-Harabsz method, which maximizes the between-subtype to within-subtype variance while maintaining a sufficient number of subjects in each subtype to be able to sustain high statistical power to detect subtype differences. To identify subtypes, a dissimilarity matrix describing the Euclidean distance between each pair of subjects was calculated by using MATLAB's
FC and clinical differences between subtypes
A Kruskal-Wallis one-way analysis of variance (ANOVA) with false-discovery rate (FDR) correction was used to identify FC differences between the three subtypes. The assumptions were checked to ensure the distributions had the same shape before performing the Kruskal-Wallis ANOVA. To determine the unique resting-state FC patterns associated with each ASD subtype, Wilcoxon rank-sum tests were used to test for differences between the resting-state profiles of each subtype compared with the other two. The z value of the FC features that significantly differed (p < 0.05, FDR corrected) between subtypes indicates strength in connectivity compared with the other subtypes. To identify FC features that differed most between subtypes, Bonferroni correction was applied for the number of FC features tested (p < 0.0007).
To determine whether subtypes of ASD defined by resting-state FC patterns were associated with specific clinical features, Kruskal-Wallis one-way ANOVAs and post hoc multiple-comparisons Tukey analysis were used to investigate the clinical differences between the subtypes. A Kruskal-Wallis one-way ANOVA was also used to ensure that there were no significant between-subtype differences in age, and a chi-square goodness-of-fit test was used to ensure there were no significant between-subtype differences in comorbidity status, medication status, sex, or scan site.
Subtype verification
To ensure that distinct FC biomarkers and clinical features were associated with each subtype, an SVM classifier was used on FC profiles and clinical profiles independently to determine whether subjects could be accurately classified through each domain. A one-versus-all multiclass SVM classifier with a linear kernel function was used on the 72 FC and 10 clinical features identified through feature selection. Classifier training was performed by using libsvm toolbox (a library for SVMs) and the
Redundancy analysis
Redundancy analysis (RDA) is a non-symmetric statistical method that is used to analyze the variation in a set of independent variables that can be explained by a set of dependent variables (Zuur et al., 2007). We used RDA to explore the directional relationship between FC and clinical features. This analysis was performed in R by using the RDA function in the “Vegan” package to identify which set of features are more responsible for influencing the results (Oksanen et al., 2007).
Results
Feature selection
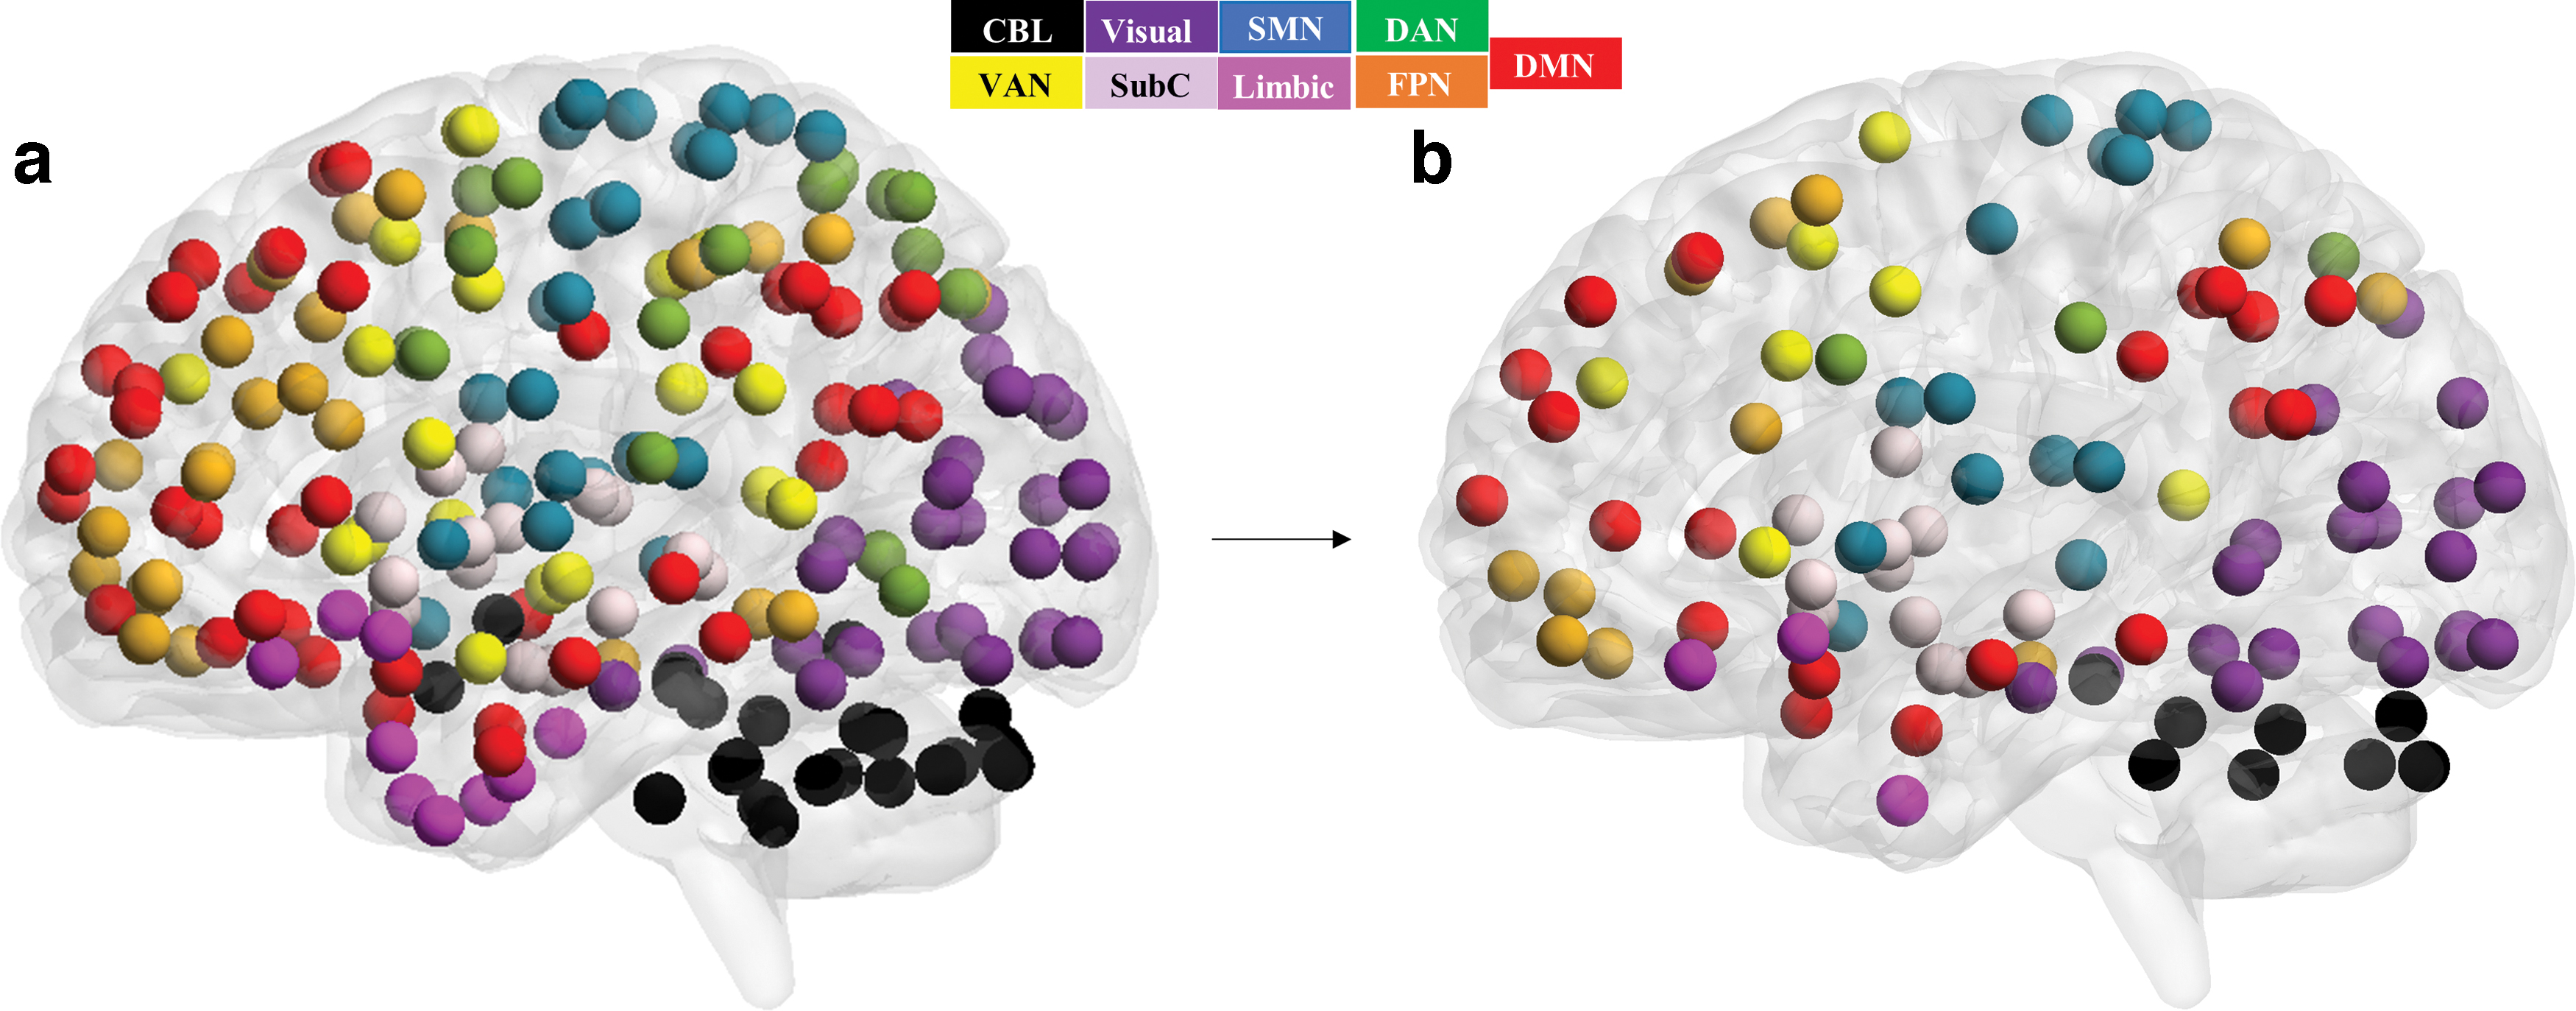
Spearman's rank correlation identified 100 FC features that were most highly correlated with ASD symptoms (p < 5.15 × 10⁻⁴). Each of the 11 clinical features was highly correlated with at least 1 of the 100 FC features, ensuring the use of all variables in CCA. Multicollinear features were removed for both clinical and FC datasets to ensure the absence of multicollinearity before CCA; one clinical feature (VIQ) was removed from the clinical dataset, and 28 FC features were removed from the FC dataset. The resulting 10 clinical and 72 FC features with a VIF of less than 5 were used in CCA. The majority of the FC features were from the DMN (25 FC features), followed by the visual network (18 FC features), frontoparietal network (FPN; 11 FC features), subcortical (SubC) regions (11 FC features), somatomotor network (SMN; 9 FC features), cerebellar (CBL) regions (9 FC features), ventral attention network (VAN; 9 FC features), limbic network (5 FC features), and the dorsal attention network (DAN; 2 FC features). The neuroanatomical distribution of the nodes associated with the 72 FC features was viewed by using BrainNetViewer (Xia et al., 2013; Fig. 2 and Supplementary Table S2).
Linked connectivity and clinical features
The CCA identified CVs that represented linear combinations of brain connectivity and clinical features. The first CV (p < 0.001, R = 0.75) was defined by FCs predominantly involving the DMN (including within DMN FC) and SubC/limbic network (Fig. 3a–c; Supplementary Tables S3 and S4). This combination of connectivity features was correlated with a combination of social cognition (standardized loading: 0.66) and verbal features (standardized loading: 0.35) of ASD. The proportion of variance explained by the clinical and FC features for the first CV, indicated by the squared canonical correlation, was 56.9% (R2 CV1 = 0.569). The second CV (p < 0.001, R = 0.74) was defined by predominantly intra-network DMN FC, SubC/limbic network, and CBL FC (Fig. 3d–f; Supplementary Tables S5 and S6). This combination of connectivity features was correlated with a combination of social motivation (standardized loading: −0.70), verbal (standardized loading: −0.56), social awareness (standardized loading: 0.48), and RRB (standardized loading: 0.47) symptoms of ASD. The proportion of variance explained by the clinical and FC features for the second CV was 55.1% (R2 CV2 = 0.551).
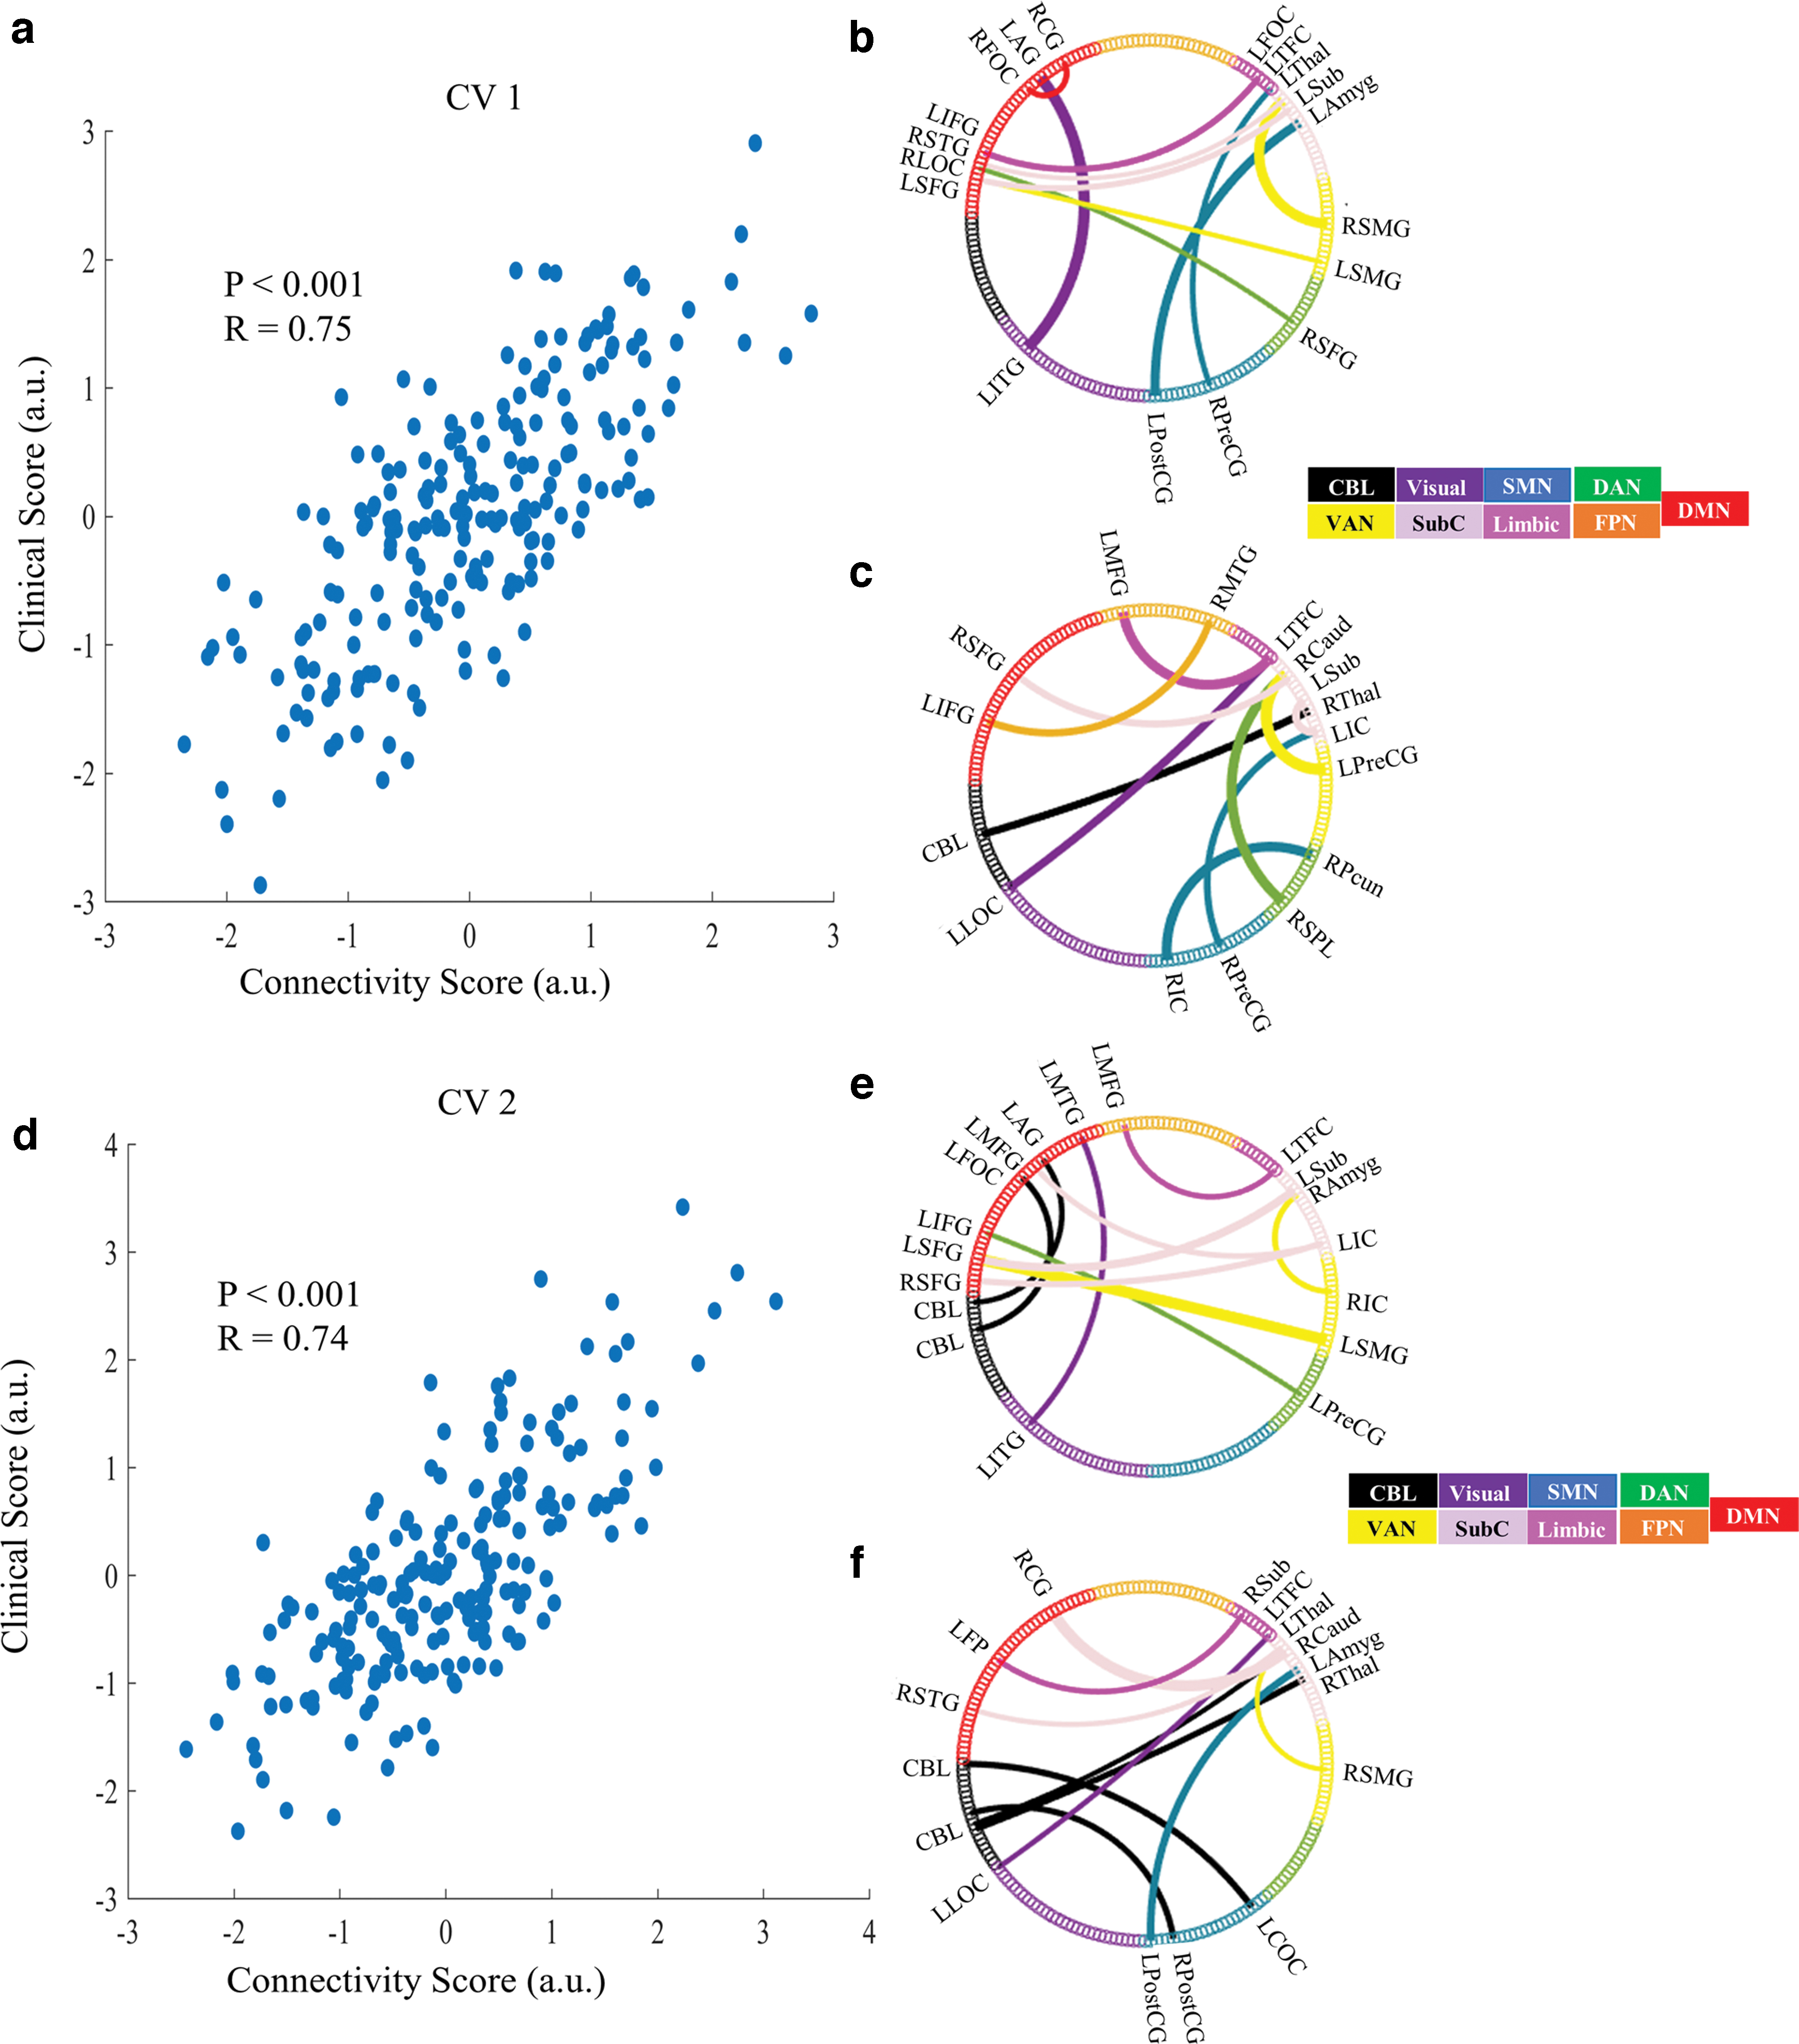
Significant CVs.
Hierarchical clustering
The Calinski-Harabasz criterion resulted in three as the optimal number of subtypes. Hierarchical clustering with Euclidean distance identified three subtypes of ASD along the first two CV dimensions; there are 47 subjects in subtype 1 (22.4%), 55 subjects in subtype 2 (26.2%), and 108 subjects in subtype 3 (51.4%; Fig. 4). There were no significant between-subtype differences in age, site, sex, medication status, or comorbidities.
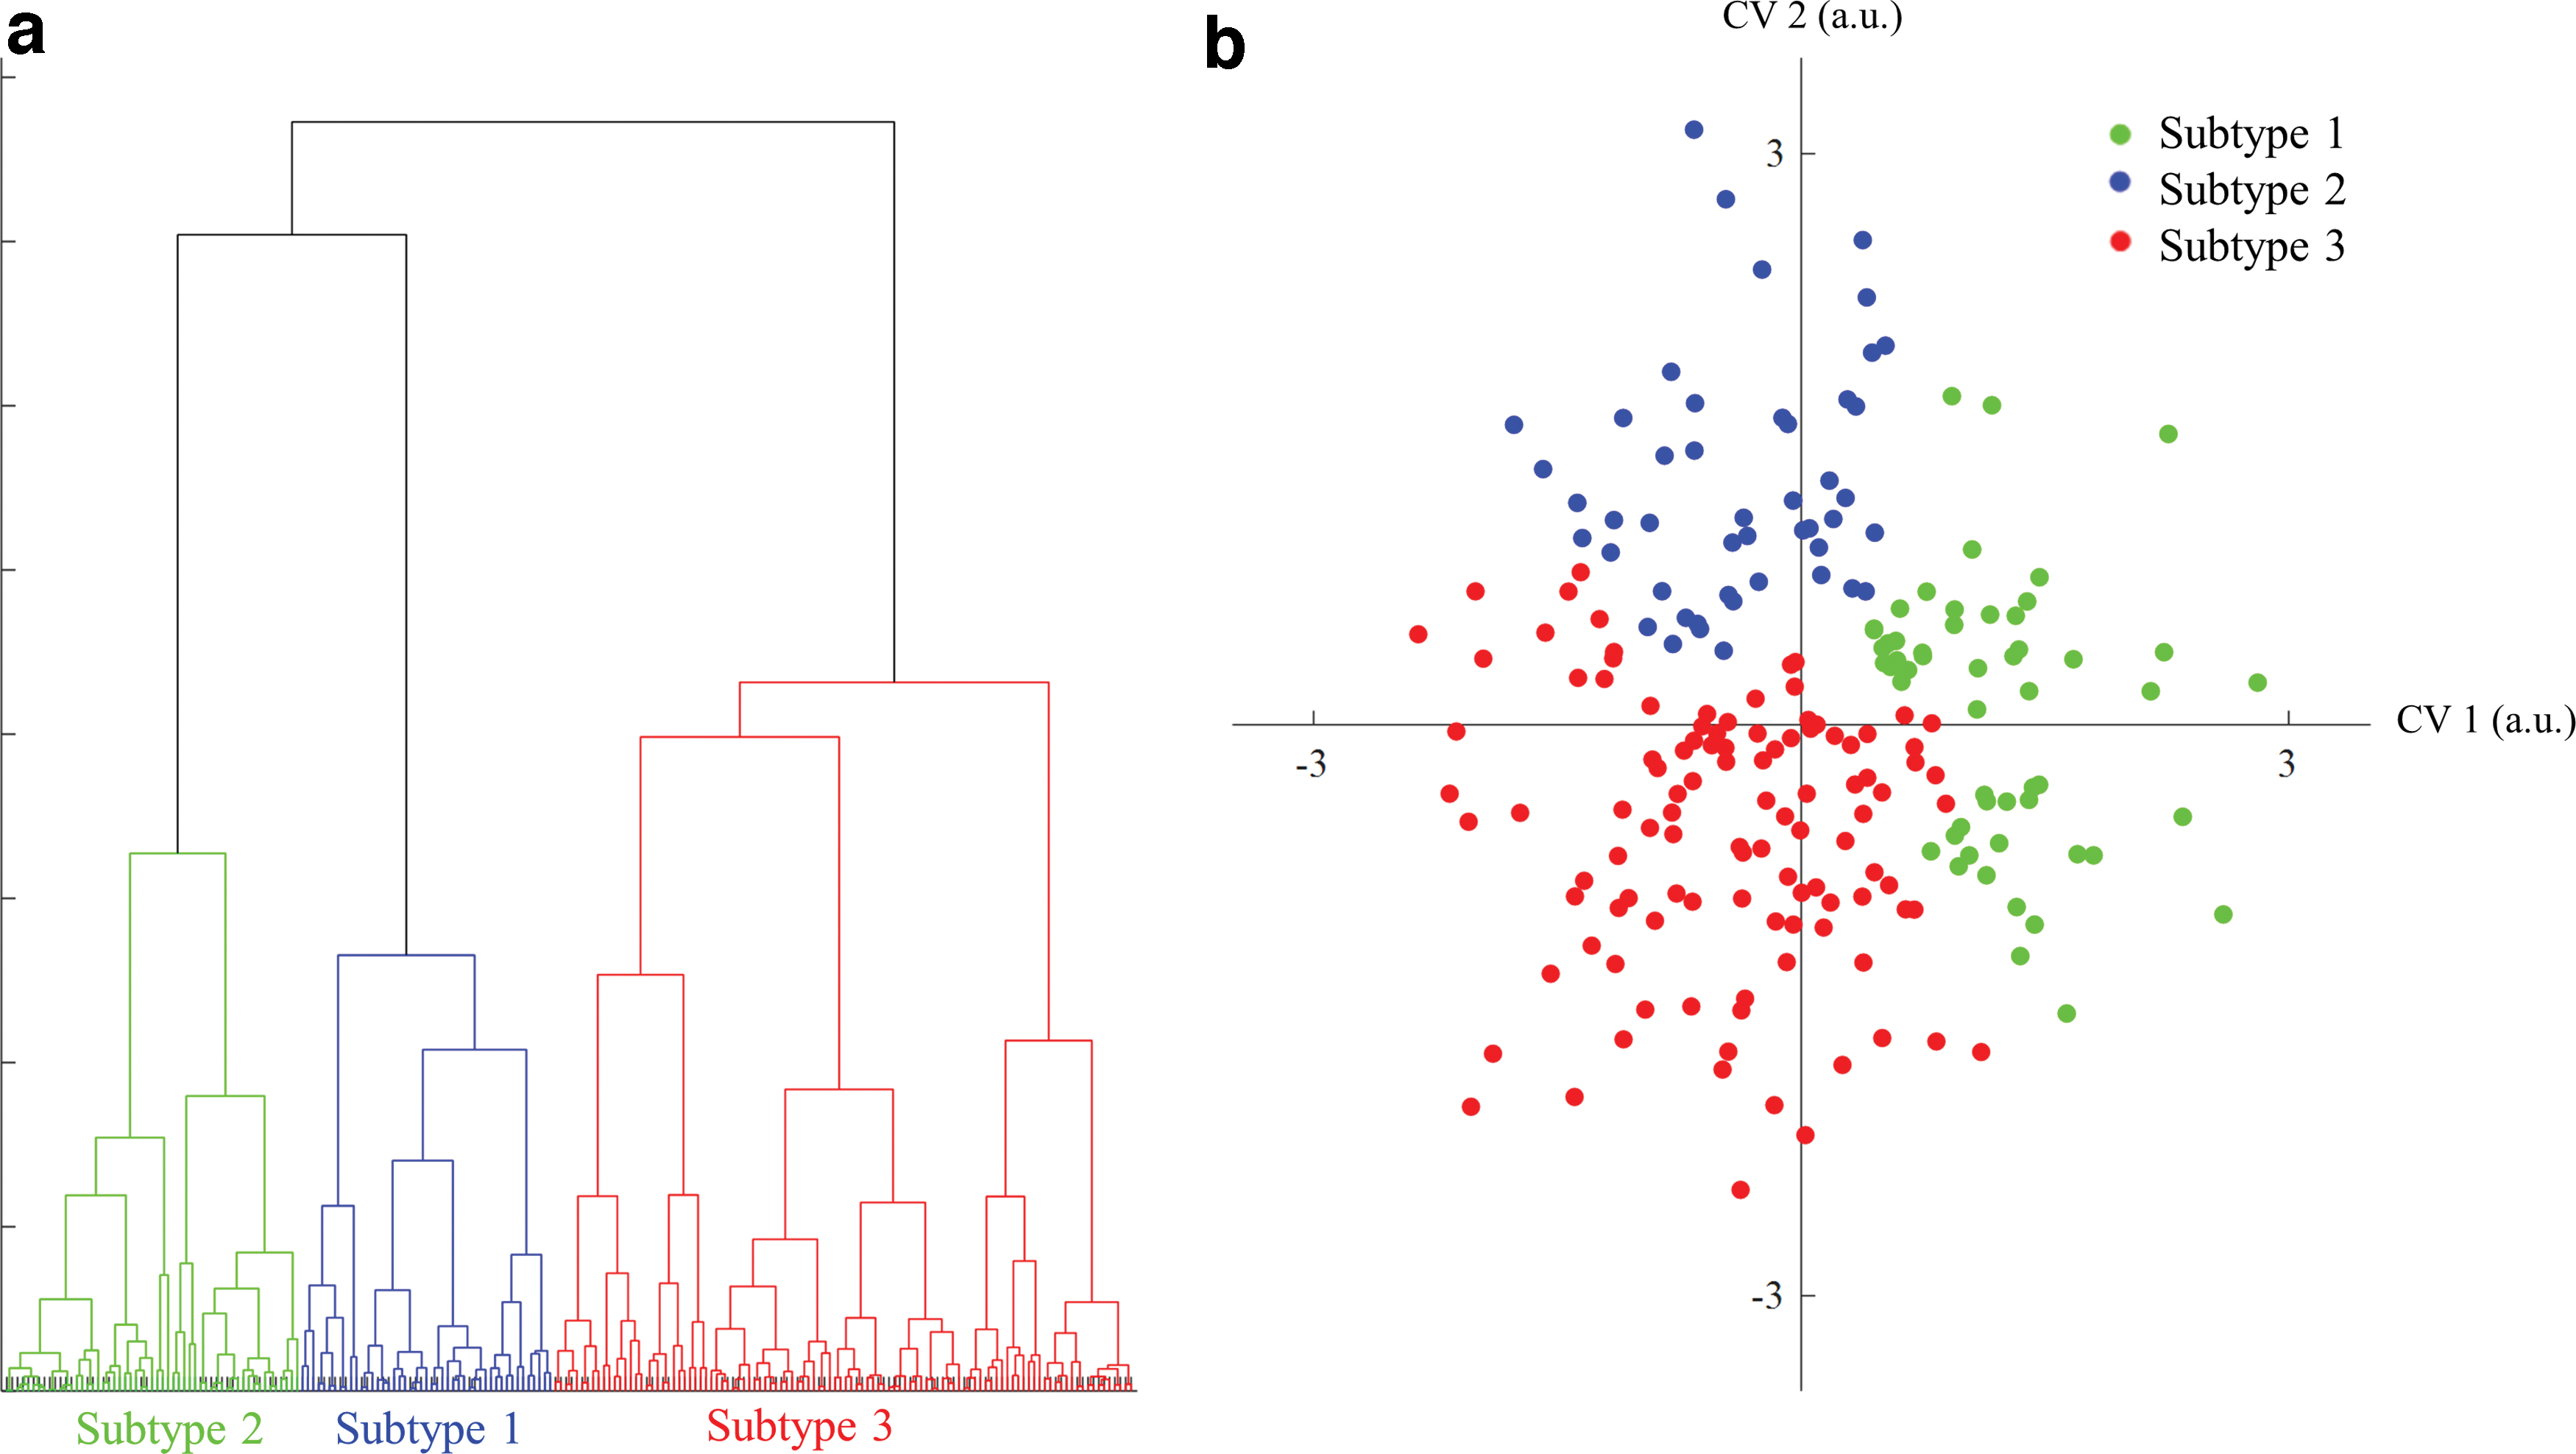
Hierarchical clustering.
Clinical and FC features define three ASD subtypes
Kruskal-Wallis one-way ANOVAs and post hoc multiple-comparisons Tukey analysis were used to determine the clinical differences between subtypes. This analysis identified that all 10 of the clinical features significantly differed across subtypes: FIQ (p = 0.01, χ 2 = 9.2), VIQ (p = 0.01, χ 2 = 9.3), ADI-R social (p < 0.001, χ 2 = 19.7), verbal (p < 0.001, χ 2 = 35.0), RRB (p < 0.001, χ 2 = 29.8), SRS awareness (p < 0.001, χ 2 = 26.2), cognition (p < 0.001, χ 2 = 52.8), communication (p < 0.001, χ 2 = 35.4), mannerisms (p < 0.001, χ 2 = 27.2), and motivation (p < 0.001, χ 2 = 26.2; Fig. 5).
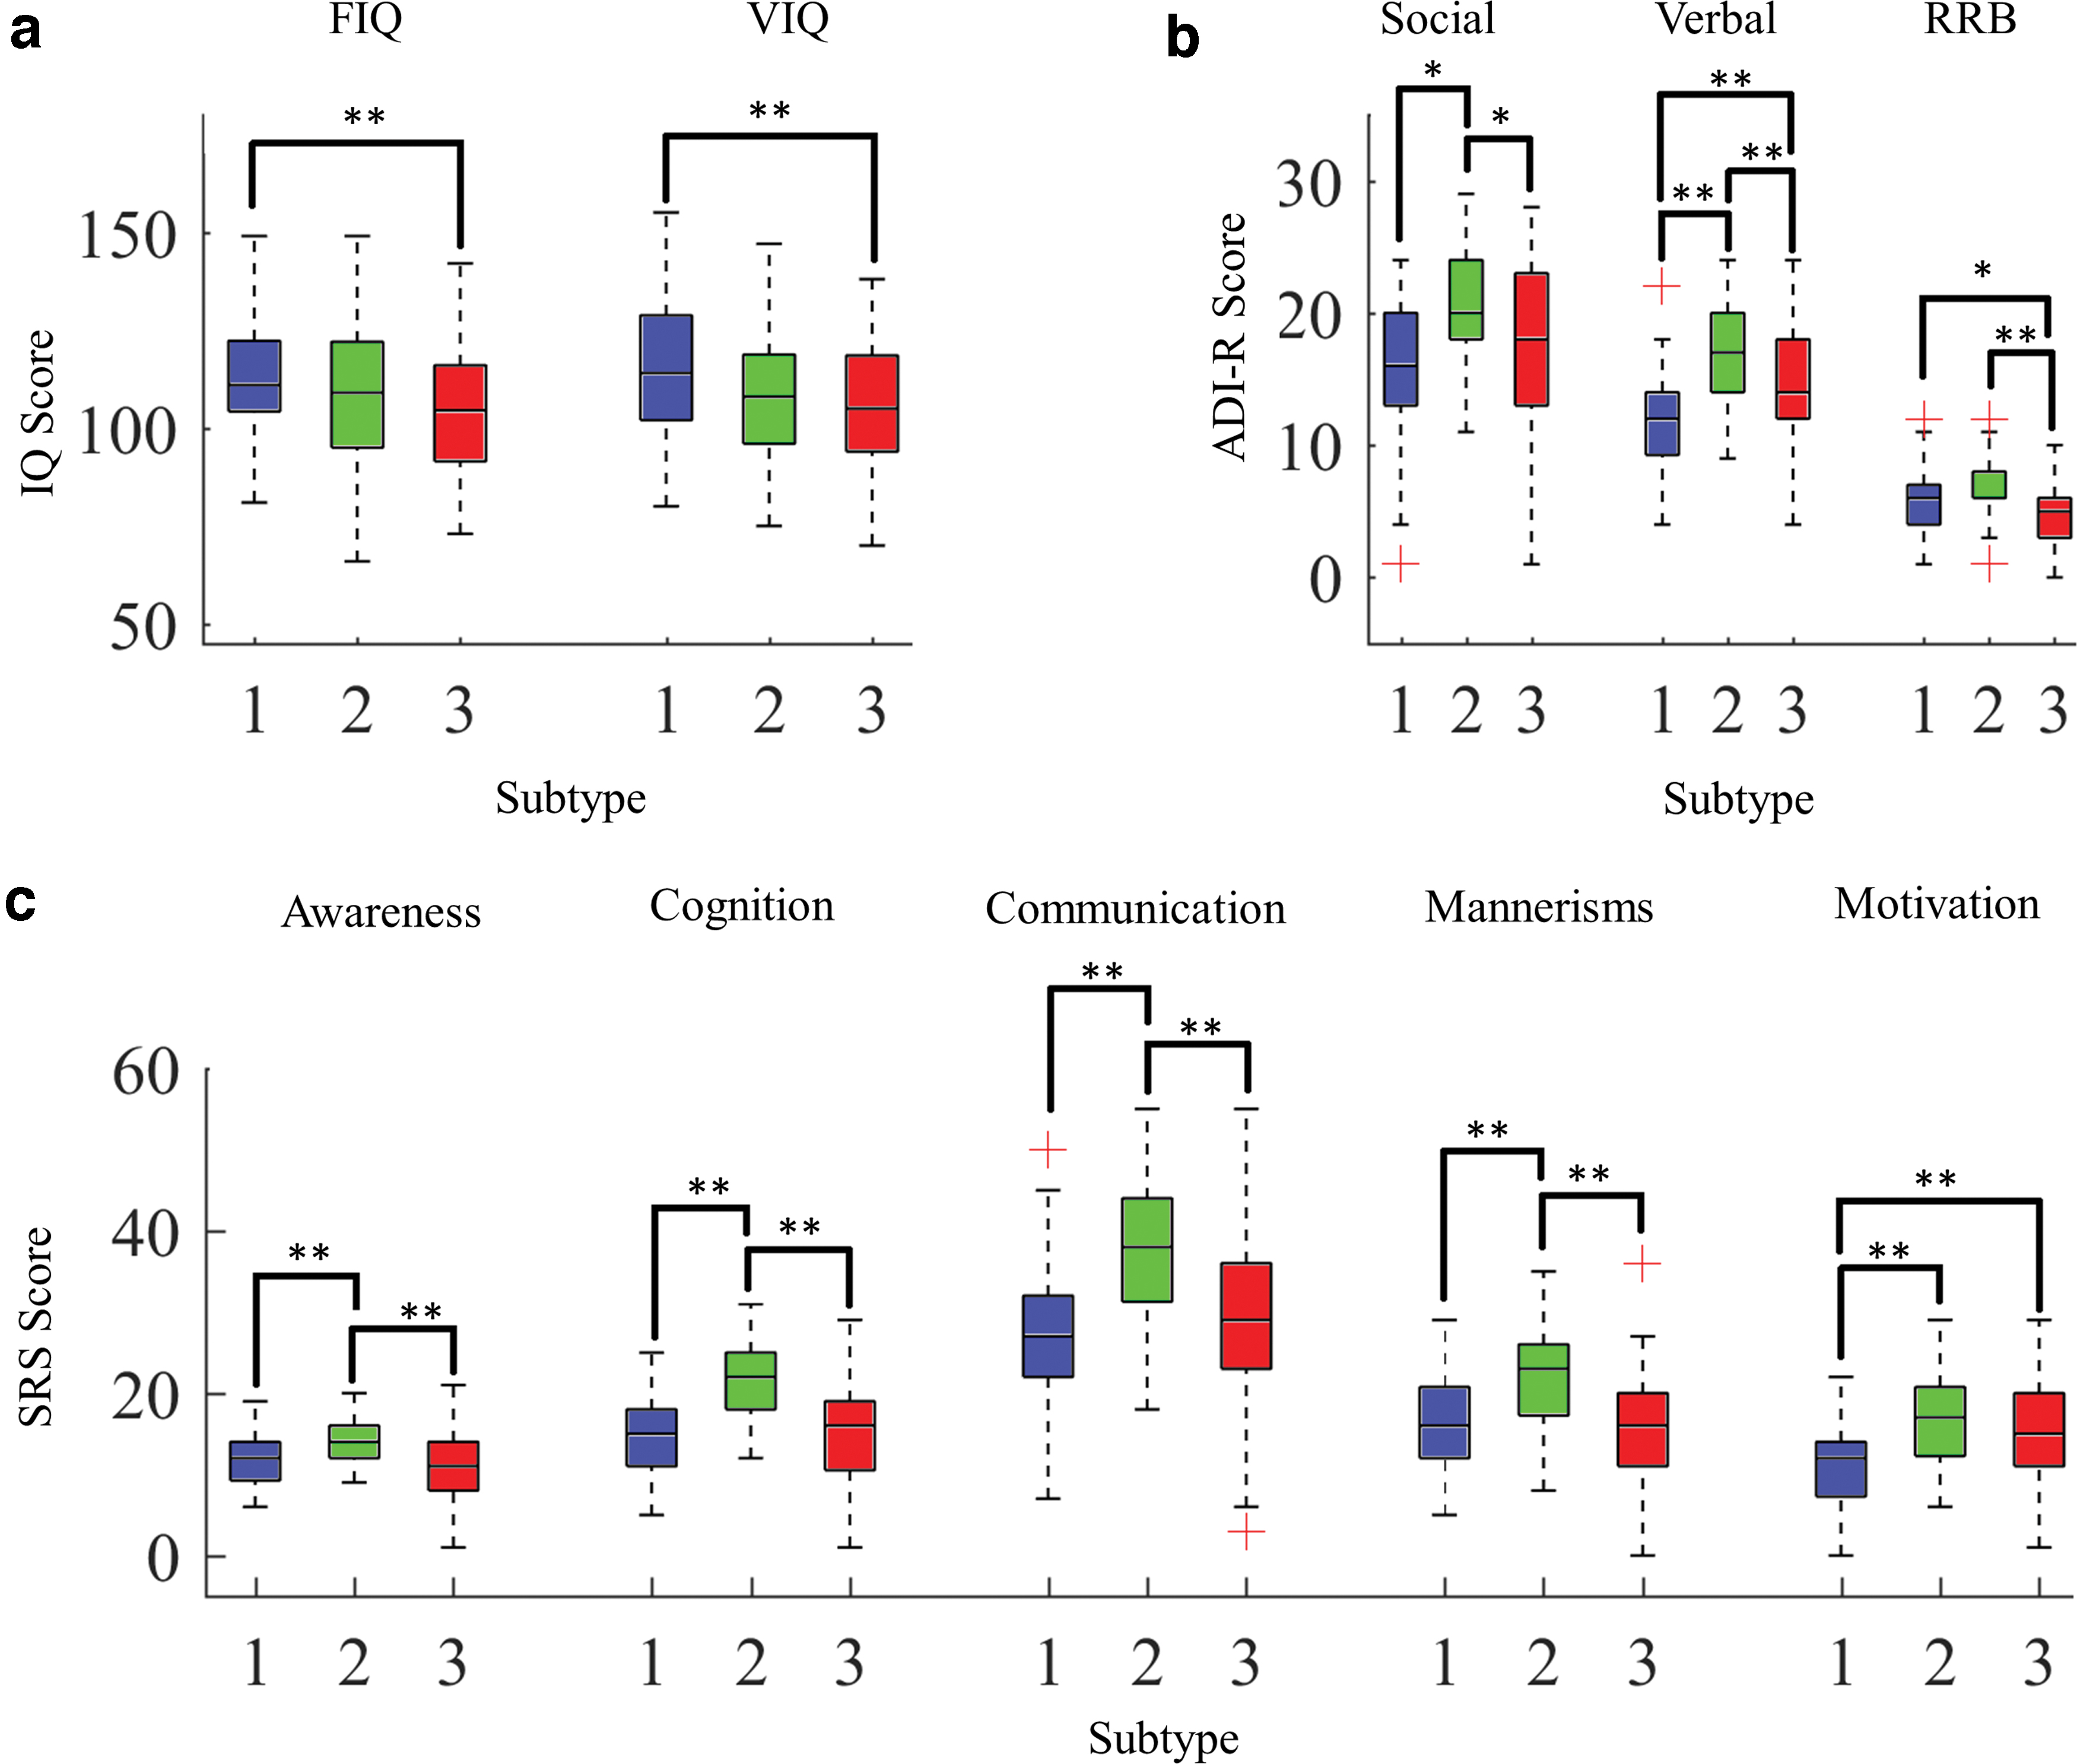
Kruskal-Wallis one-way ANOVA boxplots depicting
Subtype 1 is characterized by significantly higher RRB (p = 0.02, χ 2 = 28.2), FIQ (p = 0.009, χ 2 = 13.1), and VIQ scores (p = 0.007, χ 2 = 32.3) compared with subtype 3. Subtype 2 is characterized by deficits in all clinical features across ADI-R and SRS scales, as indicated by significantly higher scores, than subtype 1 across ADI-R social (p < 0.01, χ 2 = −53.2), ADI-R verbal (p < 0.01, χ 2 = −71.2), SRS awareness (p = 0.007, χ 2 = −36.6), SRS cognition (p < 0.001, χ 2 = −73.2), SRS communication (p < 0.001, χ 2 = −62.5), SRS mannerisms (p < 0.001, χ 2 = −49.4), and SRS motivation (p < 0.001, χ 2 = −59.6) symptoms. Subtype 2 exhibited significantly higher scores compared with subtype 3 across ADI-R social (p = 0.013, χ 2 = 28.3), ADI-R verbal (p = 0.004, χ 2 = 32.4), ADI-R RRB (p < 0.001, χ 2 = 53.4), SRS awareness (p < 0.001, χ 2 = 51.3), SRS cognition (p < 0.001, χ 2 = 67.1), SRS communication (p < 0.001, χ 2 = 53.3), and SRS mannerism (p < 0.001 χ 2 = 49.8) symptoms. Subtype 3 is characterized by significantly lower FIQ (p = 0.009, χ 2 = 31.1) and VIQ (p = 0.007, χ 2 = 32.3) than subtype 1, as well as significant verbal deficits (p < 0.001, χ 2 = −38.8) and social motivation deficits (p < 0.001, χ 2 = −43.2) compared with subtype 1.
A Kruskal-Wallis one-way ANOVA with FDR correction identified the FCs in which the three subtypes differed (Fig. 6a and Supplementary Table S7). Wilcoxon rank-sum tests with FDR correction were used to identify FC differences between each subtype compared with the other two. Subtype 1 was characterized by overall increased FC, predominantly including nodes in the DMN, CBL, and SubC networks, and a single hypoconnected FC feature between the visual and SubC network (Fig. 6b and Supplementary Table S8). Subtype 2 was characterized by widespread hypoconnectivity spanning across many networks and six hyperconnected FC features (Fig. 6c and Supplementary Table S9). Subtype 3 was defined by a mix of hyper- and hypoconnectivity, predominantly hypoconnectivity between SubC and DMN nodes and hyperconnectivity involving the DMN (Fig. 6d; Supplementary Table S10).

FC differences between subtypes. FCs that differ between at least two of three subtypes as determined from a Kruskal-Wallis one-way ANOVA with post hoc multiple comparisons and FDR correction (p < 0.05, FDR corrected;
Bonferroni correction revealed significantly different FC features (p < 0.0007) in each subtype (Supplementary Fig. S1a; Supplementary Tables S11 and S12). Further information regarding the Bonferroni-corrected Kruskal-Wallis ANOVA and corresponding effect size (η 2) can be found in Supplementary Table S11. An η 2 value of less than 0.01 indicates a small effect, 0.06 is considered to be moderate, and 0.14 is considered to be a large effect (Cohen, 1988). Subtype 1 was defined by eight hyperconnected features involving mainly the DMN, SubC, CBL, and visual network (Supplementary Fig. S1b; Supplementary Table S13 and S14). Subtype 2 was characterized by 19 hypoconnected features (predominantly involving DMN, CBL and FPN) and 1 hyperconnected feature (Supplementary Fig. S1c; Supplementary Table S15 and S16). Subtype 3 exhibited four hypoconnected features involving the SubC network and frontal nodes (Supplementary Fig. S1d; Supplementary Table S17 and S18). In addition, further information regarding the Bonferroni-corrected Wilcoxon rank-sum tests and corresponding effect size (r) can be found in Supplementary Tables S13–S18. An r value of less than 0.3 is considered to be a small effect, between 0.3 and 0.5 is considered to be moderate, and greater than 0.5 is considered to be a large effect (Cohen, 1988).
Subtype classification and RDA
To verify subtype assignment, a multiclass SVM classifier with five-fold cross-validation was used to determine whether the FC and clinical features used in CCA could predict subtype. The macro-average F1 measure was 71.3% for FC features and 65.2% for clinical features. The sensitivity, specificity, f1-measure, and macro-average f1-measure for the classification system used on FC features and clinical features can be found in Table 3. The results of the RDA revealed that the variance explained by FC features (45.6% explained variance) influence the results more than the clinical features (9.86% explained variance).
Results for Support Vector Machine Classification of Subtypes Based on Functional Connectivity and Clinical Features
FC, functional connectivity.
Discussion
The aim of the current study was to define the subtypes of ASD using both FC and clinical profiles. The ASD is characterized by a wide range of symptoms that vary on a spectrum of severity; however, the underlying connectomic patterns associated with this clinical variation are not clearly understood. By linking FC profiles and clinical symptoms, three distinct subtypes with disparate patterns of connectivity and clinical symptoms were identified: Subtype 1 exhibited high IQ, high RRB scores, and widespread intra-network hyperconnectivity, subtype 2 exhibited increased ADI-R and SRS symptoms and predominantly hypoconnectivity, and subtype 3 was characterized by low IQ, social motivation deficits, verbal deficits, and mixed connectivity. The resulting subtypes may provide insights into the inconsistencies of previous studies and allow future therapies to be better targeted for specific ASD subtypes.
Although studies have shown that ASD is multifaceted in terms of clinical and FC presentation (see Hull et al., 2016), previous work subtyping were based on either clinical (Georgiades et al., 2013) or FC (Easson et al., 2019) domains treated independently. Easson et al. defined two subtypes of ASD based on differences in resting-state fMRI profiles; however, there were no significant differences in terms of clinical scores (IQ, SRS, or ADOS) between subtypes (Easson et al., 2019). The FC profiles may not adequately capture all facets of ASD and may explain the lack of correspondence between subtypes derived from FC and clinical features. Therefore, CCA is advantageous to capture the brain–behavior relationships in ASD. To the best of our knowledge, no previous work has been done to subtype ASD based on linked dimensions of FC and clinical features.
Clinical and FC features define three ASD subtypes
Subtypes differ in terms of associated FC and clinical features. Defining features of subtype 1 include high IQ, more severe RRB symptoms, and intra-network hyperconnectivity (predominantly involving DMN, SubC, CBL, and SMN). Individuals with RRBs may engage in stereotyped and repetitive movements or speech and have an insistence on sameness and routine (American Psychiatric, 2013). Although the majority of findings tend to support the hypoconnectivity theory of ASD, several studies report hyperconnectivity in ASD as well (see Hull et al., 2016). Subtype 1 is also consistent with the findings of previous work showing hyperconnectivity in ASD across brain regions, including the DMN, SubC nodes, and frontal/occipital regions, and the salience network is correlated with RRB severity (Dupong and Di Martino, 2020; McKinnon et al., 2019; Monk et al., 2009; Uddin et al., 2013b).
The underconnectivity theory of ASD posits that this reduction in connectivity is associated with cognitive deficits (Just et al., 2012). The mechanism underlying the underconnectivity theory is that there is reduced function of neural circuitry, which is believed to affect cognitive processing, switching tasks, perceptual abilities, and abstraction (Just et al., 2012). This is in accordance with the findings in subtype 1, which is the only subtype that was not characterized by hypoconnectivity, and had the highest IQ in comparison to the other two subtypes.
The underconnectivity theory also suggests that behavioral features of ASD arise from reduced brain connectivity (Just et al., 2012). This is in accordance with subtype 2, which was defined by decreased whole-brain FC, and more severe deficits across ADI-R and SRS scales. Previous work found that intra-network hypoconnectivity and hypoconnectivity within the DMN have been associated with social deficits in ASD (Assaf et al., 2010; Weng et al., 2010; Yerys et al., 2015). In addition, Verly et al. reported hypoconnectivity between CBL and supratentorial regions and it is suggested that this hypoconnectivity may be responsible for communication deficits in ASD (Verly et al., 2014).
Subtype 3 was defined by mixed connectivity, low FIQ, low VIQ, social motivation deficits, and verbal deficits. Subtype 3 exhibited decreased FC within DMN nodes, decreased FC between DMN and SubC regions, and increased FC between intra-network regions (predominantly including the DMN). Hypoconnectivity has been associated with cognitive deficits (Just et al., 2012) and social deficits (Assaf et al., 2010; Weng et al., 2010; Yerys et al., 2015). Conversely, other studies have suggested that hyperconnectivity across long- and short-range connections, as well as DMN hyperconnectivity, predicted social deficits in children with ASD (Lynch et al., 2013; Supekar et al., 2013). The findings of subtype 3 are in line with previous work that has found a combination of hyper- and hypoconnectivity in ASD between several DMN nodes and visual, SubC, SMN, salience, VAN, and CBL regions (Olivito et al., 2017; Yerys et al., 2015).
It has been suggested that the inconsistencies in ASD literature may be due to age-related differences in the participants included in these studies (Uddin et al., 2013a). Studies including children younger than the age of 12 have reported predominantly hyperconnectivity in ASD as compared with healthy controls, whereas studies demonstrating hypoconnectivity have mostly included individuals older than the age of 12 (Uddin et al., 2013a). In addition, comorbidities such as ADHD and depression, as well as medication status have been found to play a role in FC results (Reiser et al., 2012; Tomasi and Volkow, 2012). However, there were no significant effects of age, medication status, comorbidities, site, or sex in subtypes. Nevertheless, additional work is needed to fully assess the role of age, comorbidity, and medication in ASD subtypes.
After Bonferroni correction (p < 0.0007), subtype 1 exhibited 6 significant hyperconnected FC features (Supplementary Fig. S1b and Supplementary Table S13), subtype 2 exhibited 19 significant hypoconnected FC features and a single hyperconnected FC feature (Supplementary Fig. S1c and Supplementary Table S15), and subtype 3 was defined by 4 significant hypoconnected FC features (Supplementary Fig. S1d and Supplementary Table S17). Interestingly, only the hypoconnected FC features in subtype 3 were significant after Bonferroni correction, which suggests that subtype 3 is largely driven by the hypoconnected features. The significant FC features across all three subtypes include regions in the SubC and DMN. However, the nodes and direction of connectivity (increase or decrease) differ between subtypes. The DMN is the most commonly implicated network in ASD and is involved in a wide range of cognitive and social tasks (Padmanabhan et al., 2017); however, the FC literature involving the DMN has been widely inconsistent (see Hull et al., 2016). In addition, the SubC network is implicated in reward processing, social motivation, social behaviors, and RRBs (Abbott et al., 2018; Clements et al., 2018). The social motivation hypothesis suggests that individuals with ASD have aberrant processing in SubC regions involved in reward processing, resulting in unrewarding social interactions that can lead to abnormal social behaviors (Clements et al., 2018). However, there are also mixed results regarding SubC regions in literature (Maximo et al., 2014; Woodward et al., 2017). It is possible that the mixed results in ASD in regards to these two networks may be explained by subtypes of ASD.
Classification and RDA
In our work, a multiclass SVM classifier was able to classify subjects with 71.3% accuracy for FC features, and 65.2% accuracy for clinical features. Both are significantly higher than chance (33.3%), indicating that there are distinct clinical and FC differences associated with each subtype.
The RDA revealed that FC features influence the results more than clinical features. This suggests that FC features have more of an effect on clinical features than clinical features have on FC features. This finding is in agreement with recent work that has found a causal relationship between dysfunctional connectivity and psychopathology (Brady et al., 2019). This is also consistent with the SVM classification results, which revealed that FC features yielded higher subtype classification accuracy than clinical features, thus suggesting that FC features drive subtype results more than clinical features. However, the RDA results must be interpreted with caution (Yan et al., 2017). The clinical variables only account for a small percent of the variance. This could be because there are various other factors that might affect results, for example, site effects, phenotypic differences, and subjects with eyes open versus eyes closed during the scan, among other variables (Agcaoglu et al., 2019; Yu et al., 2018). Thus, more phenotypic information and a homogenous group of subjects should be used in future analysis to better understand the clinical-connectivity relationships.
Limitations and future work
Although this work increases our understanding of the associations between clinical profiles of ASD and aberrant FC, there are several limitations of this study that must be considered. Although data from sites with similar scanning procedures and inclusion criteria were used in this study, and further age, sex, and site-related factors were regressed out of the data before analysis, replication of our findings in an independent, single-site dataset with small age discrepancies would be necessary to address the limitation of this multi-site sample. In addition, a more extensive and consistent ASD clinical assessment would be critical for a further understanding of how brain connectivity relates to ASD symptoms. It would also be beneficial to use clinical and resting-state fMRI data from a much larger population to be able to further characterize the associations between brain connectivity and ASD symptoms. This would be useful for a cluster discovery set of subjects, and for replication of this work. Finally, NYU sample 1, NYU sample 2, and SDSU did not exclude participants based on FIQ, whereas criteria at ETH, GU, KKI, and TCD limited ASD participants to an FIQ of greater than 70 or 80. Including subjects with low IQs would be important for determining whether similar subtypes exist across a wider scope of cognitive deficits.
Conclusion
The present study identified three ASD subtypes with distinct FC patterns and clinical manifestations by using associative analysis of connectomic and clinical profiles. These findings may provide a perspective for the inconsistent reports in ASD FC studies, and they suggest the importance of specific treatments and therapies for each ASD subtype.
Footnotes
Acknowledgments
The authors thank the contributors to the Autism Brain Imaging Data Exchange and Preprocessed Connectomes Project for access to subject data.
Authors' Contributions
A.M.R.: Conceptualization, Methodology, Software, Formal Analysis, Investigation, Visualization, Writing—Original Draft. K.L.: Methodology, Conceptualization, Supervision, Writing-Review, and Editing. J.L.: Writing-Review and Editing. X.P.H.: Conceptualization, Supervision, Writing-Review, and Editing.
Author Disclosure Statement
No competing financial interests exist.
Funding Information
This research did not receive any specific grant from funding agencies in the public, commercial, or not-for-profit sectors.
Supplementary Material
Supplementary Figure S1
Supplementary Table S1
Supplementary Table S2
Supplementary Table S3
Supplementary Table S4
Supplementary Table S5
Supplementary Table S6
Supplementary Table S7
Supplementary Table S8
Supplementary Table S9
Supplementary Table S10
Supplementary Table S11
Supplementary Table S12
Supplementary Table S13
Supplementary Table S14
Supplementary Table S15
Supplementary Table S16
Supplementary Table S17
Supplementary Table S18
References
Supplementary Material
Please find the following supplemental material available below.
For Open Access articles published under a Creative Commons License, all supplemental material carries the same license as the article it is associated with.
For non-Open Access articles published, all supplemental material carries a non-exclusive license, and permission requests for re-use of supplemental material or any part of supplemental material shall be sent directly to the copyright owner as specified in the copyright notice associated with the article.