
Abstract
Introduction:
Both major depressive disorder (MDD) and schizophrenia (SCH) are characterized by neurodevelopmental abnormalities; however, transdiagnostic and diagnosis-specific patterns of such abnormalities have rarely been examined, particularly in large-scale functional brain networks via advanced multilayer network models.
Methods:
Here, we collected resting-state functional magnetic resonance imaging data from 45 MDD patients, 64 SCH patients, and 48 healthy controls (HCs; 13–45 years old), and we constructed functional networks in different frequency intervals. The frequency-dependent networks were then fused by multiplex network models, followed by graph-based topological analyses.
Results:
We found that functional networks of the patients showed common neurodevelopmental abnormalities in the right ventromedial parietooccipital sulcus (opposite correlations with age to HCs), whereas functional networks of the MDD patients exhibited specific alterations in the left superior parietal lobule and right precentral gyrus with respect to cross-frequency interactions. These findings were quite different from those from brain networks within each frequency interval, which revealed SCH-specific neurodevelopmental abnormalities in the right superior temporal gyrus (opposite correlations with age to the other two groups) in 0.027–0.073 Hz, and SCH-specific alterations in the left superior temporal gyrus and bilateral insula in 0.073–0.198 Hz. Finally, multivariate analysis of age prediction revealed that the subcortical network lost prediction ability in both patient groups, whereas the visual network exhibited additional prediction ability in the MDD patients.
Discussion and Conclusion:
Altogether, these findings demonstrate transdiagnostic and diagnosis-specific neurodevelopmental abnormalities and alterations in large-scale functional brain networks between MDD and SCH, which have important implications for understanding shared and unique neural mechanisms underlying the diseases.
Impact statement
Recent methodological advances in network neuroscience allow integrating connectivity information from different scales or aspects through multilayer network models. Utilizing such models, we found common and specific neurodevelopmental abnormalities in multiband functional brain networks between major depressive disorder (MDD) and schizophrenia (SCH), and the abnormalities cannot be uncovered by individually analyzing brain networks within each frequency interval. These findings have important implications for understanding shared and unique neural mechanisms underlying MDD and SCH and highlight the necessity of integrating connectivity information from different frequency intervals to search for new biomarkers of the diseases.
Introduction
Major depressive disorder (MDD) and schizophrenia (SCH) are two common psychiatric disorders worldwide, with global prevalences of ∼3.4% and 0.3%, respectively (Ritchie and Roser, 2018). Despite different manifestations, several independent lines of evidence indicate that MDD and SCH share similarities in many aspects, including comorbidity (Kessler et al., 1997), behavioral symptoms (Pizzagalli, 2014), genetics (Maier et al., 2002), and cytokine alterations (Goldsmith et al., 2016). More recently, accumulating evidence from neuroimaging studies further shows that both MDD and SCH are characterized by neurodevelopmental abnormalities that are embodied in not only local architecture but also large-scale network organization of the brain (Charlton et al., 2015; Rapoport et al., 2012; Savitz and Drevets, 2009).
Currently, MDD- and SCH-related neurodevelopmental abnormalities as well as their similarities and differences across the two diseases have been well documented in the local architecture of brain structure and function, such as cerebral morphology (Sacchet et al., 2017), white matter microstructure (Kochunov et al., 2013), and task-evoked activation (Rao et al., 2015). Recently, a growing number of studies have started to explore MDD- and SCH-related neurodevelopmental abnormalities from the perspective of large-scale brain networks not only due to the fact that the human brain essentially operates as an interconnected network but also due to increasingly popular views of the two diseases as brain network disorders (Gong and He, 2015; van den Heuvel and Fornito, 2014). It is found that MDD is associated with disappeared positive correlations between age and local network properties of the prefrontal and cingulate cortex in white-matter structural brain networks (Charlton et al., 2015), and SCH is related to stronger negative and even opposite associations between age and network efficiency of the cingulo-opercular and frontoparietal components in functional brain networks (Li et al., 2019; Sheffield et al., 2016) and delayed development of cortical thickness covariance between the left occipital cortex and the left temporal lobe (Zalesky et al., 2015). Despite the progress, however, there are no studies so far that simultaneously examine the two diseases with respect to their common and specific neurodevelopmental network abnormalities using the same imaging modality. Mapping transdiagnostic and diagnosis-specific neurodevelopmental network abnormalities in MDD and SCH has important implications for understanding shared and unique neural mechanisms underlying the diseases (Fusar-Poli et al., 2019; McGorry et al., 2018; van den Heuvel and Sporns, 2019).
In this study, we aimed at investigating transdiagnostic and diagnosis-specific neurodevelopmental abnormalities in large-scale functional brain networks between MDD and SCH. To this end, we collected resting-state functional magnetic resonance imaging (R-fMRI) data from 45 MDD patients, 64 SCH patients, and 48 healthy controls (HCs) who were aged from 13 to 45 years old, and we constructed individual functional brain networks with R-fMRI data. The R-fMRI measures endogenous or spontaneous brain activity as low-frequency (typically <0.1 Hz) fluctuations in blood oxygen level-dependent signals, and it has been widely used for studying intrinsic functional brain networks in both health and disease (Wang et al., 2010). However, in addition to low-frequency fluctuations, mounting evidence suggests the neurobiological significance of high-frequency signals embedded in R-fMRI data (Chen and Glover, 2015; Liao et al., 2013), particularly for interregional functional integration (Gohel and Biswal, 2015). Accordingly, to more comprehensively map MDD- and SCH-related neurodevelopmental network abnormalities, we focused on the full frequency spectrum of both low- and high-frequency signals in this study. It should be noted that instead of treating this broad frequency range in a unitary manner, we divided it into four frequency intervals wherein individual functional brain networks were separately constructed. This is because distinct frequency intervals are shown to relate to specific physiological processes (Buzsáki and Draguhn, 2004), exhibit unique topological organizations (Sasai et al., 2014; Thompson and Fransson, 2015), and have differential sensitivities in identifying disease-related network alterations (Luo et al., 2015; Wang et al., 2013). By analyzing functional brain networks in different frequency intervals, we can examine whether MDD- and SCH-related neurodevelopmental network abnormalities are frequency dependent.
On the other hand, treating frequency-specific functional networks independently cannot give a complete picture of the topological organization of large-scale functional brain networks due to the inability of this approach to model cross-frequency interactions (De Domenico et al., 2016; Guillon et al., 2017; Tewarie et al., 2016; Yu et al., 2017). Thus, it is vital to integrate information of functional brain networks in different frequency intervals. Benefiting from recent methodological advances, the advent of multilayer network approaches makes it possible to treat multiple networks as a whole by modeling each individual network as a layer to form an interconnected multilayer network (Betzel and Bassett, 2017; De Domenico, 2017; Vaiana and Muldoon, 2020). Accordingly, in addition to analyzing functional brain networks in different frequency intervals individually, we employed multilayer network approaches as an alternative and, perhaps, a better way to uncover MDD- and SCH-related neurodevelopmental network abnormalities from a holistic perspective.
In summary, we investigated the transdiagnostic and diagnosis-specific neurodevelopmental abnormalities in MDD and SCH by constructing functional brain networks in four different frequency intervals and analyzing the frequency-specific networks one by one (single-layer network model) and as a whole (multilayer network model). We hypothesize that (1) patients with MDD and SCH present both shared and distinct neurodevelopmental abnormalities; and (2) multilayer network analysis of all frequency intervals as a whole can reveal abnormalities differing from those captured by single-layer network analysis of each individual frequency interval.
Materials and Methods
Participants
A total of 166 right-handed participants of Han ethnicity were recruited in this study, including 46 patients with MDD, 71 patients with SCH, and 49 HCs. All patients met the Diagnostic and Statistical Manual of Mental Disorders, IV Edition (DSM-IV) criteria for first-episode unipolar MDD or first-episode SCH, as assessed with structured clinical interviews based on the DSM-IV by two professional psychiatrists. All patients were recruited from the Department of Psychiatry at the First Affiliated Hospital, College of Medicine, Zhejiang University. The HCs were recruited from the local community via advertisements and had no history of any neurological or psychiatric disorders. The exclusion criteria for all participants were as follows: (1) any therapy before the study; (2) significant medical illness; (3) a history of neurological disorders (e.g., cerebral trauma or seizure disorder) or MRI evidence for structural brain abnormalities; (4) any other current or past psychiatric axis-I or axis-II disorders; (5) current alcohol and drug abuse; (6) a full-scale intelligence quotient score <80; (7) pregnancy, breastfeeding, or any ongoing family planning; and (8) MRI contraindications, including metallic implants, retractors or braces, and claustrophobia. Notably, nine participants (one MDD patient, seven SCH patients, and one HC) were excluded due to excess head motion. This study was approved by the Ethics Committee of the First Affiliated Hospital of the College of Medicine of Zhejiang University and conducted in accordance with the Code of Ethics of the World Medical Association (Declaration of Helsinki) (ChiCTR1900022677). Written informed consent was provided by all participants or their parents or legal guardians before their participation in this study.
Clinical procedures
Clinical severity was assessed by the 17-item Hamilton Depression Rating Scale for each MDD patient and by the Positive and Negative Symptom Scale for each SCH patient. In addition, disease duration was collected for each patient.
Neuropsychological tests
Each participant underwent a battery of neuropsychological tests, including the Wisconsin Card Sorting Test (Monchi et al., 2001) for executive function, the Continuous Performance Test (Rosvold et al., 1956) for sustained and selective attention, the Trail Making Test (Arnett and Labovitz, 1995) for visual attention and task switching, and the Stroop Color-Word Test (Jensen and Rohwer, 1966) for selective attention, information processing speed, and cognitive flexibility.
Image acquisition
All data were acquired on a Philips Achieva 3.0 T TX MRI system (Philips Healthcare, Netherlands) with an eight-channel head coil array. The R-fMRI data were obtained axially by using a fast field echo–echo planar imaging sequence with the following parameters: 24 slices, repetition time (TR) = 2000 ms, echo time (TE) = 35 ms, field of view (FOV) = 240 × 240 mm2, flip angle (FA) = 80°, matrix = 100 × 100, thickness = 5.0 mm, and gap = 1.0 mm. The scanning session lasted 6 min and 40 sec. During the R-fMRI scan, all participants were instructed to relax, keep their eyes closed, remain still and awake, and not to think of anything in particular. In addition, individual three-dimensional high-resolution T1-weighted images were acquired with a fast field echo sequence: 150 slices, TR = 7.5 ms, TE = 3.7 ms, FOV = 240 × 240 mm2, FA = 8°, matrix = 240 × 240, thickness = 1 mm, and no gap.
Data preprocessing
The R-fMRI data preprocessing was performed by using the GRETNA toolbox (Wang et al., 2015) based on the SPM12 package. First, individual functional images were corrected for head motion (6-parameter rigid-body transformation) after removal of the first five volumes. Nine participants (one MDD patient, seven SCH patients, and one HC) were excluded from further analyses due to excess head motion according to the criteria of >2 mm in translation or 2 degrees in rotation in any direction or >0.5 mm in mean framewise displacement. For the remaining 157 participants, there were no significant differences in the mean framewise displacement among the three groups (MDD: 0.185 ± 0.054, SCH: 0.182 ± 0.057, and HCs: 0.183 ± 0.064; F [2,154] = 0.020, p = 0.980). Then, the corrected images were coregistered to individual T1 images and spatially normalized into standard Montreal Neurological Institute space via transformation fields derived from tissue segmentation of the T1 images. During T1 segmentation, study-specific tissue probability maps were used to improve the estimation accuracy of the transformation fields (Huang et al., 2010). Subsequently, the normalized images further underwent linear trend removal and temporal bandpass filtering. For bandpass filtering, four frequency intervals (Slow 2: 0.198–0.25 Hz, Slow 3: 0.073–0.198 Hz, Slow 4: 0.027–0.073 Hz, and Slow 5: 0.01–0.027 Hz) were separately applied to the functional images (Buzsáki and Draguhn, 2004; Zuo et al., 2010). Finally, several nuisance signals were regressed out from each voxel's time series of the filtered images to exclude non-neuronal sources, including 24-parameter head motion profiles (Friston et al., 1996), white matter signals, cerebrospinal fluid signals, and global signals. Notably, all nuisance signals were filtered with the same frequency intervals as the R-fMRI data to avoid reintroducing frequency components of non-interest and to achieve better correction for noise signals in the frequencies of interest (Hallquist et al., 2013).
Construction of frequency-specific single-layer functional brain networks
To construct individual large-scale functional brain networks, a prior brain atlas was first used to divide the brain into a set of 246 regions of interest (Fan et al., 2016). Then, the mean time series was extracted for each region and correlated with each other to generate a 246 × 246 functional connectivity matrix for each participant in each frequency interval. After excluding negative correlations from each functional connectivity matrix because of their ambiguous interpretation (Weissenbacher et al., 2009) and detrimental effects on test–retest reliability (Wang et al., 2011), the functional connectivity matrices were further converted into a set of weighted networks by using a sparsity-based thresholding procedure to exclude the effects of spurious connections on subsequent network analyses, where sparsity is defined as the ratio of the number of actual edges to the maximum possible number of edges in a network. At a fixed sparsity, the sparsity-based thresholding procedure ensures the same number of connections across participants by applying a subject-specific threshold to exclude weak connections. Given the lack of a definitive standard for choosing a single sparsity, a consecutive sparsity range of [0.145 0.4] with an interval of 0.005 was used in the current study. This range was determined to guarantee that the resultant networks have sparse network properties and no isolated nodes or multiple connected components (Achard et al., 2006; Wang et al., 2009).
Construction of cross-frequency multiplex functional brain networks
Recently, several studies have proposed multilayer network approaches to integrate functional brain networks derived from different frequency intervals (De Domenico et al., 2016; Guillon et al., 2017; Tewarie et al., 2016). In such a multilayer network, frequency-specific functional brain networks are treated as layers, which are interconnected with each other by estimating cross-frequency coupling between any pair of nodes between layers. In this study, we employed a simplified but frequently used form of multilayer network model, that is, a multiplex network model wherein different layers are interconnected only via edges that link each node with its replicas over layers. Consistent with previous studies of multiplex brain networks (Guillon et al., 2017; Pedersen et al., 2018), the weights of inter-layer edges were set to 1 in this study. We also tested the effects of different weights of inter-layer edges (0.9 and 1.1) and found largely comparable results. Thus, we only showed results derived from multiplex brain networks with inter-layer edge weights of 1.
Networks measures
For each frequency-specific single-layer network derived earlier (157 participants × 4 frequency intervals × 52 sparsity levels), we calculated seven nodal measures, including degree (ki
), efficiency (ei
), clustering coefficient (ci
), eigenvector centrality (vi
), PageRank centrality (
Statistical analysis
For demographic data, age and education were examined with one-way analysis of variance, and sex was examined with a chi-squared test. Disease duration was examined with a two-sample t-test. For neuropsychological variables and multiplex nodal network measures, a univariate general linear model was performed by using the Multivariate and Repeated-Measures toolbox (McFarquhar et al., 2016) with group as a between-subject factor, age as a covariate of interest, and sex, education, and mean framewise displacement of head motion (if applicable) as covariates of non-interest. For single-layer nodal network measures, a multivariate general linear model was performed with group as a between-subject factor, frequency as a within-subject factor, age as a covariate of interest, and sex, education, and mean framewise displacement of head motion as covariates of non-interest. Specifically, for a given nodal measure of each region, the general linear model is as follows:
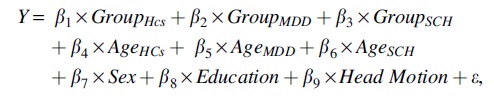
where Y is a vector containing values of the given nodal measure derived from the multiplex brain networks of all participants, or a matrix containing values of the given nodal measure derived from the four single-layer brain networks of all participants; Group is an indicator variable with 1 for members in the group and 0 otherwise; and
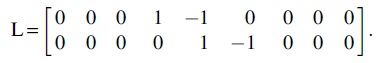
For the single-layer brain networks, group effects and group × frequency interaction effects on the relationships between age and network measures were separately tested by using the between-subject contrast, L, and within-subject contrast, M, described as follows:
In addition, we tested age-independent group effects on network measures derived from the multiplex brain networks  and age-independent group
 and group × frequency interaction
  effects on network measures derived from the single-layer brain networks. The false discovery rate (FDR) procedure was used to correct for multiple comparisons at the level of q < 0.05 (15 tests for neuropsychological variables, and 246 tests for each nodal measure). For significant group main and group-related interaction effects, post hoc tests were further performed followed by multiple comparison correction with the FDR procedure. Finally, Spearman rank correlation was used to examine the relationships among clinical, neuropsychological, and network measures in each patient group. The neuropsychological and network measures involved those showing significant abnormalities (neurodevelopmental changes or age-independent alterations) in the patients. Effects of age, sex, education, and mean framewise displacement of head motion (if applicable) were removed from the neuropsychological and network measures. The FDR procedure was used to correct for multiple comparisons in each patient group (MDD: 38 correlations; SCH: 138 correlations).
Support vector regression for age prediction
Linear support vector regression methods were utilized to predict individual ages for each group at the whole-brain and subnetwork levels (Yeo et al., 2011) based on the network measures and positive FC, respectively. Individual ages were estimated via a 10-fold cross-validation with 100 repetitions, and the model performance was evaluated by median Pearson's r between the real ages and predicted values. The FDR procedure was used to correct for multiple comparisons separately for whole-brain (6 tests) and subnetwork (132 tests) analyses. In addition, we utilized the brain basis set method (Sripada et al., 2019) for age prediction to test reproducibility of the results.
Results
Demographic and clinical characteristics
There were no significant differences in sex, age, or education among the three groups, or in disease duration between the two patient groups (p > 0.05; Table 1).
Demographic and Clinical Variables
F, female; HAMD, Hamilton Depression Scale; HCs, healthy controls; M, male; MDD, major depressive disorder; PANSS, Positive and Negative Syndrome Scale. SCH, schizophrenia.
Age-related changes in the patients
Neuropsychological tests
No significant group effects were observed on the relationships between age and any neuropsychological test (p > 0.05, FDR corrected; Supplementary Table S1).
Single-layer brain networks
No significant group effects were observed on the relationships between age and any single-layer brain network measure (p > 0.05, FDR corrected).
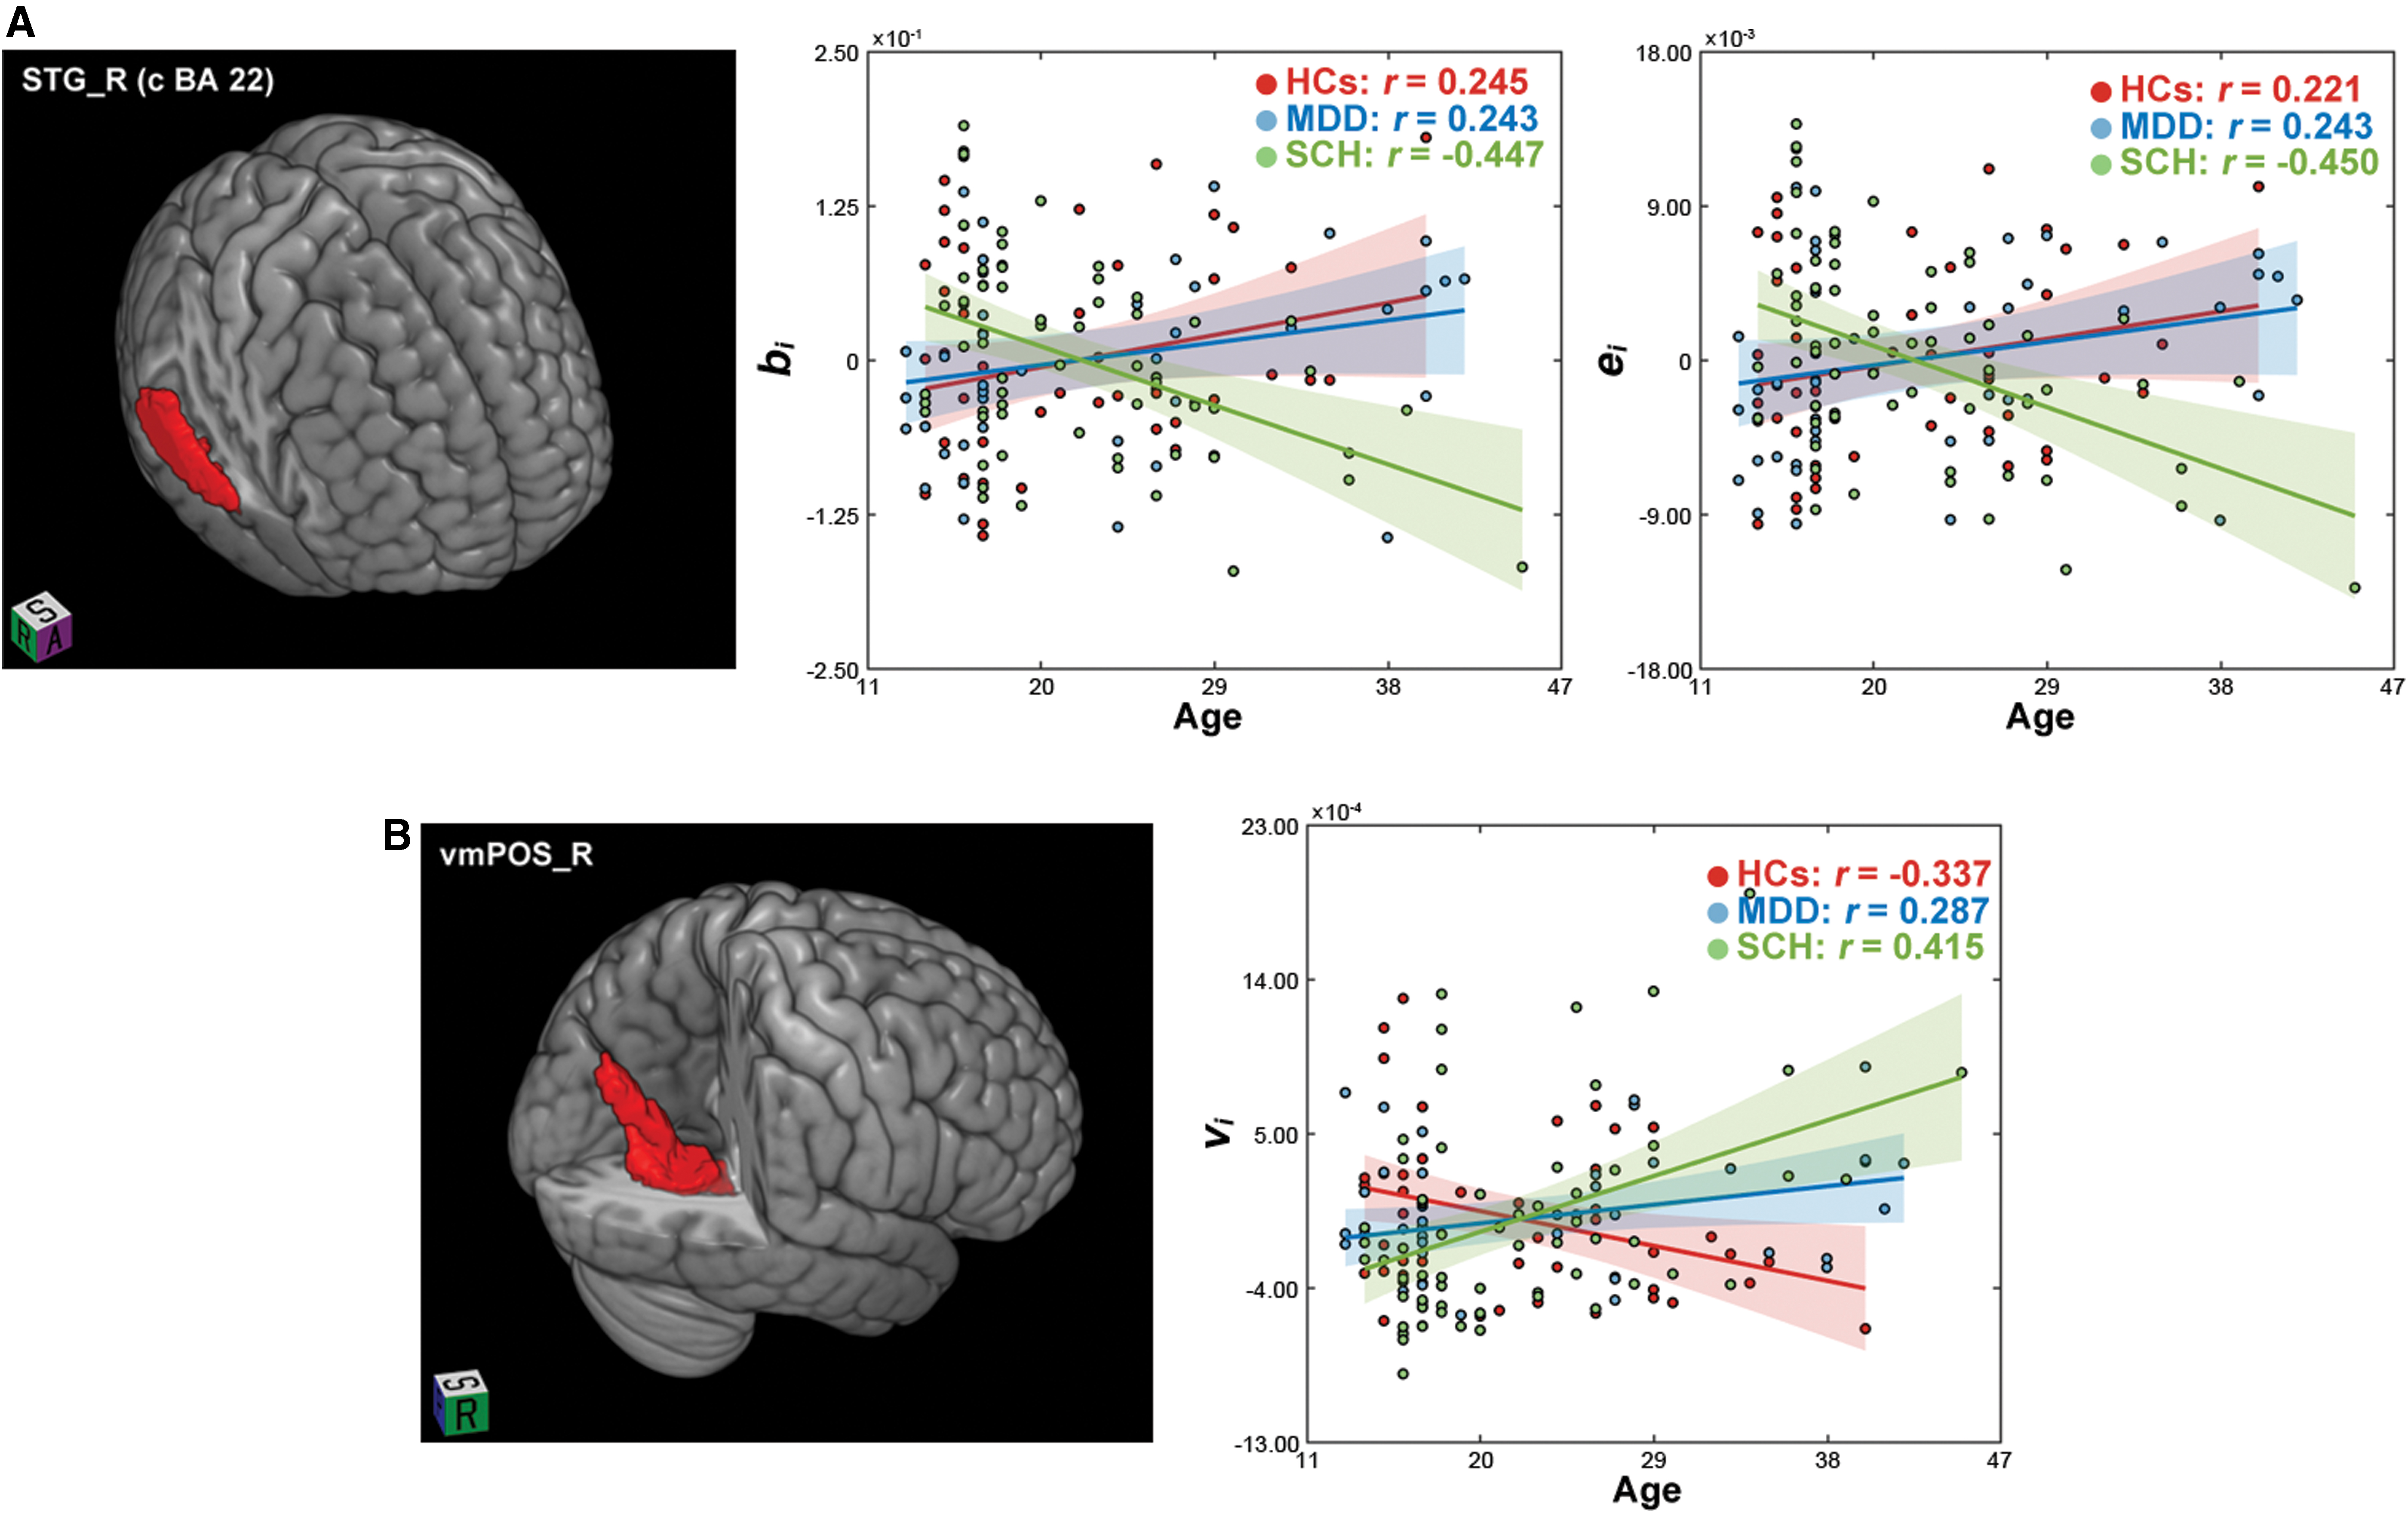
Significant group × frequency interaction effects were observed on the relationships between age and nodal betweenness (F [2,148] = 4.662, p < 0.001) and nodal efficiency (F [2,148] = 4.642, p < 0.001) in the right superior temporal gyrus (caudal Brodmann area 22). Post hoc tests revealed that only in the Slow 4, different associations with age were observed among the three groups characterized by opposite patterns in the patients with SCH (r age-nodal betweenness = −0.447; r age-nodal efficiency = −0.450) relative to the HCs (r age-nodal betweenness = 0.245, F [1,148] = 13.656, p < 0.001; r age-nodal efficiency = 0.221, F [1,148] = 12.733, p < 0.001) and the patients with MDD (r age-nodal betweenness = 0.243, F [1,148] = 14.841, p < 0.001; r age-nodal efficiency = 0.243, F [2,148] = 15.877, P < 0.001; Fig. 1A).
Group effects on the relationships between age and the topological organization of single-layer
Multiplex brain networks
A significant group effect was observed on the relationships between age and nodal eigenvector centrality in the right ventromedial parietooccipital sulcus (F [2,148] = 9.171, p < 0.001). Post hoc tests revealed that the positive correlation with age observed in the HCs (r = −0.337) reversed in the patients (MDD: r = 0.287, F [1,148] = 7.172, p = 0.008; SCH: r = 0.415, F [1,148] = 18.338, p < 0.001). Moreover, the associations with age differed significantly between the two patient groups (F [1,148] = 4.214, p = 0.042; Fig. 1B).
Age-independent alterations in the patients
Age-independent alterations in neuropsychological tests (Supplementary Table S1) and network measures (Supplementary Fig. S1) were summarized and discussed in the Supplementary Data.
Correlation results
No significant correlations were observed among clinical, neuropsychological, and brain network measures in neither the MDD nor SCH patients (p > 0.05, FDR corrected).
Age prediction
At the whole-brain level, individual ages were predicted in the HCs and MDD but not SCH patients regardless of the features used (multiplex network measures: median r HCs = 0.412, p = 0.002; median r MDD = 0.401, p = 0.003; median r SCH = −0.120, p = 0.827; FC: median r HCs = 0.440, p < 0.001; median r MDD = 0.616, p < 0.001; median r SCH = 0.026, p = 0.418). Further analyses revealed low Spearman rank correlations in the nodal/edge contribution weights (i.e., beta values averaged across all multiplex nodal measures/frequency intervals, folds, and repetitions) between HCs and MDD patients (rho = 0.031 and 0.142, respectively). After Z-transformation of the contribution weights, we found that features contributing the most to the age prediction (Z > 1) were involved in the same subsystems between the two groups for both nodes (somatomotor and ventral attention networks) and FC (subcortical, visual, and default-mode networks; Supplementary Fig. S2). For the subnetwork analyses, network measures derived from the ventral attention (median r = 0.411, p = 0.002) and default-mode (median r = 0.399, p = 0.003) networks could predict individual ages for the HCs, and network measures derived from the somatomotor (median r = 0.488, p < 0.001) and frontoparietal (median r = 0.623, p < 0.001) networks were predictive of ages for the MDD patients. All subnetworks failed to predict ages for the SCH patients (p > 0.05, FDR corrected). With regard to subnetwork FC, the patterns of age prediction differed remarkably among the three groups (Fig. 2). Generally, compared with the HCs, more subnetworks in the MDD group whereas less subnetworks in the SCH groups were capable of predicting individual ages. We further defined an age prediction additional score for each subnetwork as the number of its FC that was able to predict individual ages of the patients (MDD or SCH) but not the HCs. Similarly, an age prediction lost score was defined for each subnetwork as the number of its FC that was able to predict individual ages of the HCs but not the patients (MDD or SCH). We found that the MDD patients exhibited a high age prediction additional score in the visual network and a high age prediction loss score in the subcortical network, whereas the SCH patients showed a high age prediction loss score in the subcortical and ventral attention networks. These findings were largely reproducible by using the brain basis set method for age prediction.
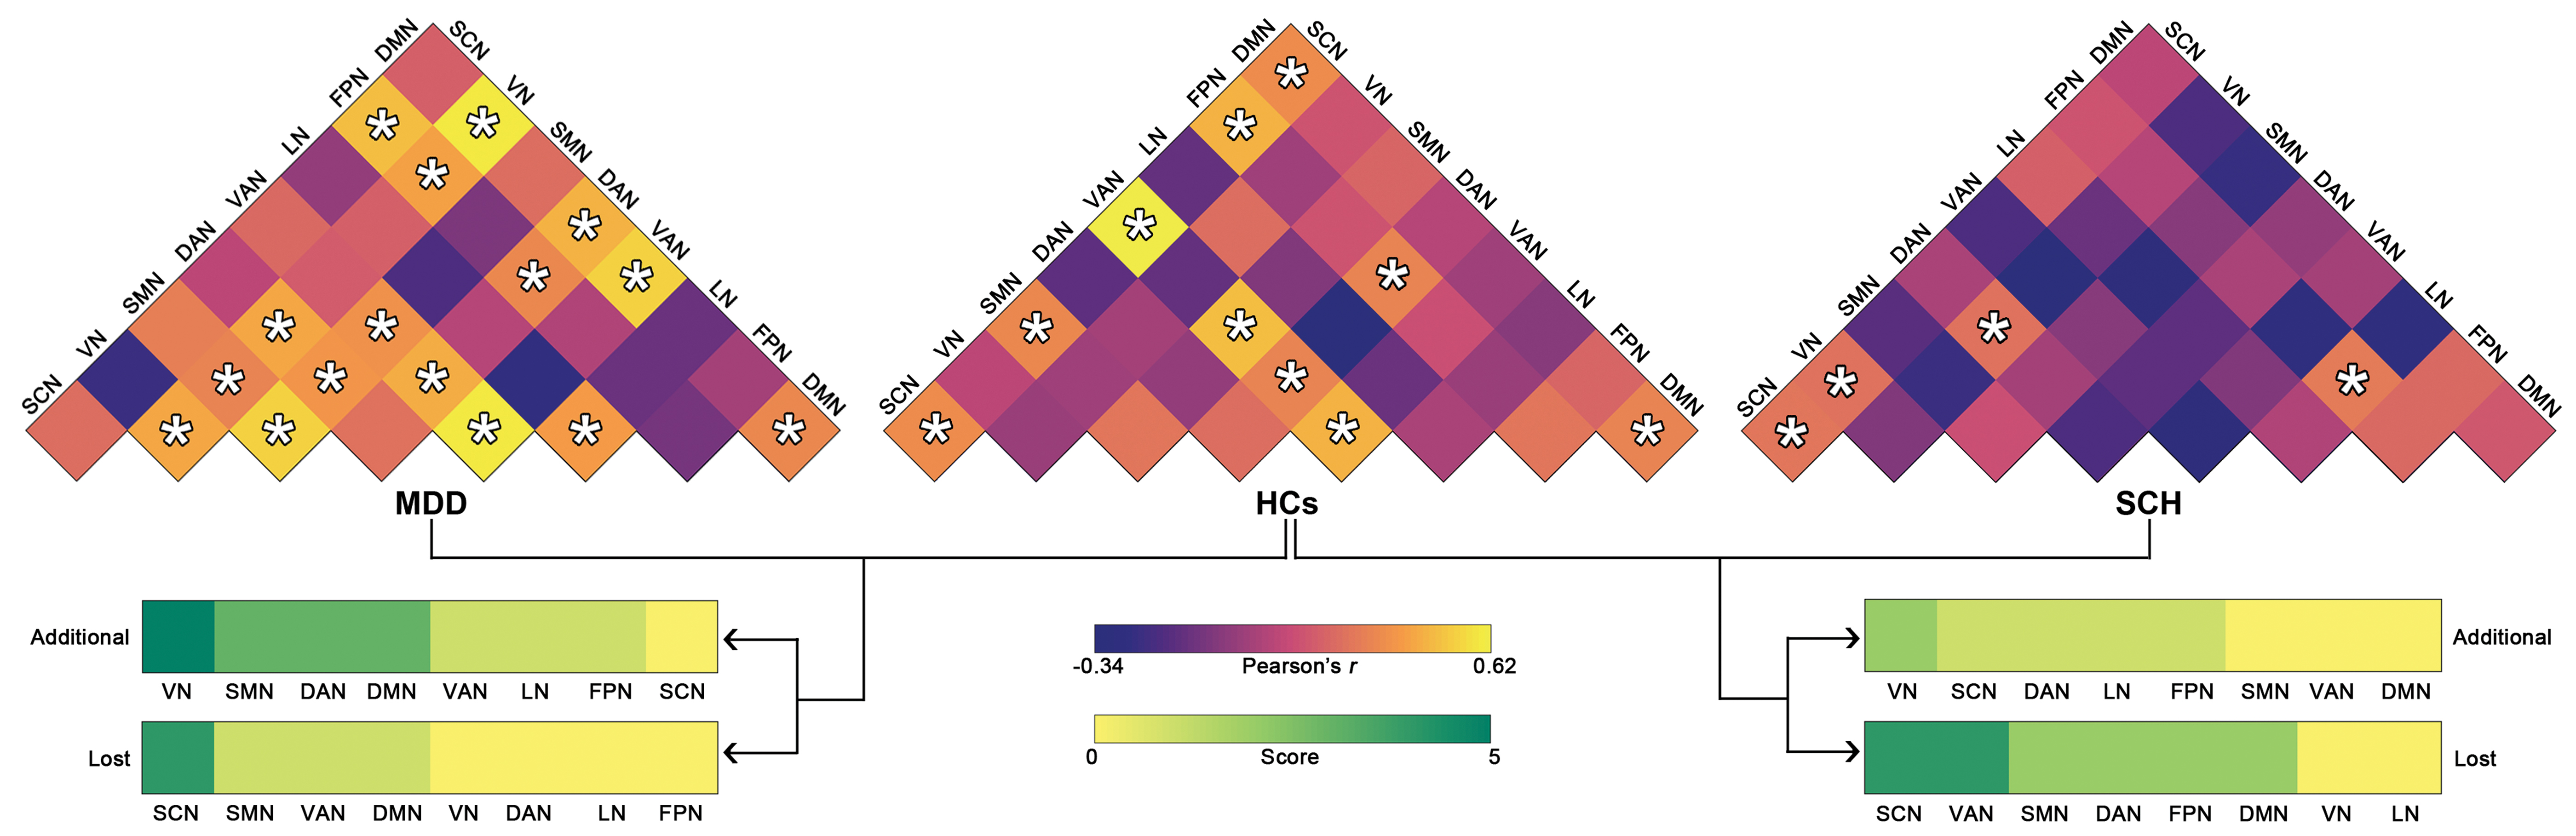
Age prediction by intra- and inter-network functional connectivity. *Significant linear correlation between real ages and predicted values (p < 0.05, FDR corrected). DAN, dorsal attention network; DMN, default-mode network; FPN, frontoparietal network; LN, limbic network; SCN, subcortical network; SMN, somatomotor network; VAN, ventral attention network; VN, visual network. Color images are available online.
Discussion
This study investigated transdiagnostic and diagnosis-specific neurodevelopmental abnormalities of large-scale functional brain networks between MDD and SCH. We found common and specific neurodevelopmental abnormalities between the two patient groups in regional and subnetwork levels. In addition, we found convergent and divergent network alterations between MDD and SCH that were age independent and were mainly detected in high-frequency single-layer networks. These findings have important implications for understanding shared and unique neural mechanisms between MDD and SCH.
Neurodevelopmental network abnormalities in MDD and SCH
In this study, we found common neurodevelopmental abnormalities between MDD and SCH in the right ventromedial parietooccipital sulcus characterized by opposite (positive) correlations of its eigenvector centrality with age to the HCs (negative). Such aberrant neurodevelopmental trajectories indicate that in contrast to continually descending roles with increasing age in the HCs, the right ventromedial parietooccipital sulcus becomes increasingly important in MDD and SCH in coordinating whole-brain information flow via similar mechanisms. The ventromedial parietooccipital sulcus is a subregion of the medioventral occipital cortex (Fan et al., 2016). A previous study showed that dynamic FC of the medioventral occipital cortex can serve as an effective feature to differentiate MDD patients from HCs (Yan et al., 2020). With respect to the ventromedial parietooccipital sulcus, it is rarely reported to show network alterations in patients with MDD or SCH, particularly in the context of brain network development. Using the fine-grained, connectivity-based parcellation atlas (Fan et al., 2016), here we demonstrated the important roles of the ventromedial parietooccipital sulcus in understanding developmental abnormities common to MDD and SCH. In patients with chronic fatigue syndrome, the right ventromedial parietooccipital sulcus was reported to show decreased sample entropy of fMRI signals, which was correlated with fatigue-related questionnaire scores (Shan et al., 2018). These findings suggest the involvement of the right ventromedial parietooccipital sulcus in fatigue. Given that fatigue is one of the most prominent behavioral symptoms in MDD (Ahern and Semkovska, 2017) and SCH (Hedlund et al., 2015), the observed neurodevelopmental abnormalities in the right ventromedial parietooccipital sulcus are believed to be responsible for fatigue symptoms in MDD and SCH during development. Of note, although both the patient groups exhibited positive correlations with age in the right ventromedial parietooccipital sulcus, a higher positive correlation was observed in the SCH patients. It is interesting for future studies to examine the faster age-related changes in SCH than MDD in the context of fatigue.
In addition to common neurodevelopmental abnormalities between MDD and SCH, we found SCH-specific neurodevelopmental abnormalities in the right superior temporal gyrus (caudal Brodmann area 22) characterized by opposite (negative) correlations of its efficiency and betweenness with age to the HCs and MDD patients (positive). The positive correlation observed in the HCs implies continuously increasing roles of the right superior temporal gyrus (caudal Brodmann area 22) in information transfer and processing over the whole brain as age increases. The age-related increase is speculated to support normal development of speech functions considering previous findings that the right superior temporal gyrus (caudal Brodmann area 22) is involved in the process of speech (Strotzer, 2009). Interestingly, such age-related changes were preserved in the MDD patients but exhibited a reversed pattern in the SCH patients. The SCH-specific changes may be a possible neural basis underlying stagnant or even degenerated speech-related functions during development in SCH (Condray, 2005), and they may serve as a unique signature to distinguish SCH from MDD. Notably, the SCH-specific neurodevelopmental changes were detected only in the Slow 4 (0.027–0.073 Hz). There are numerous studies that reported frequency-dependent network alterations in SCH. For example, Luo et al. (2019) found that different frequency intervals led to different sets of regions that were detected to show abnormal dynamic functional connectivity strength in patients with SCH. In particular, a previous study showed a greater sensitivity of the Slow 4 to detect network dysfunction in patients with early onset SCH, which was related to clinical symptoms of the patients (Wang et al., 2017). From a neurodevelopmental perspective, here our findings indicate that the Slow 4 is associated with SCH-specific neurodevelopmental network changes in the right superior temporal gyrus (caudal Brodmann area 22). These findings jointly suggest that network organization in the Slow 4 plays crucial roles in the psychological and neural mechanisms underlying SCH. A deeper understanding of the frequency selectivity can benefit from knowledge on the physiological origins of different rhythmic fluctuations in the brain.
Abnormal patterns of age prediction in MDD and SCH
In this study, our multivariate analysis of age prediction revealed that individual ages of the HCs and MDD but not SCH patients can be predicted. Moreover, the findings were robust against the choices of prediction features (network measures or FC) and prediction approaches (support vector regression or brain bias set). These findings collectively suggest a loss in the global relationship between age and functional network organization in SCH. Further subnetwork analyses revealed that the failure of age prediction in the SCH patients was due to the lost associations with age for multiple subnetworks, in particular the subcortical and ventral attention networks. Previous evidence from meta-analysis of FC showed that components in these two networks play core roles in the disconnected nature of brain networks in SCH (Dong et al., 2018). It, thus, seems that the subcortical and ventral attention networks are the regions on which network dysfunction and neurodevelopmental abnormality converge for SCH. Interestingly, the lost association with age in the subcortical network was also observed in the MDD patients. There are numerous studies demonstrating alterations of subcortical structures in MDD (Schmaal et al., 2016) and SCH (van Erp et al., 2016). Besides the alterations, our findings further indicate that subcortical regions are important for understanding shared neural mechanisms between MDD and SCH from a neurodevelopmental perspective. Notably, the visual network was found to show an additional association with age in the MDD but not SCH patients. Deficient visual function (Ahern and Semkovska, 2017) and structural alterations of visual regions (Schmaal et al., 2017) have been reported in MDD patients. Extending these findings, our results provide evidence for abnormal neurodevelopment of the visual network in MDD, and they indicate that such neurodevelopmental abnormality is a unique signature of MDD. Overall, largely different patterns of multivariate age prediction were observed between MDD and SCH. At the subnetwork level, the subcortical network lost prediction ability in both patient groups, and the visual network exhibited additional prediction ability in the MDD patients.
Limitations and future directions
First, the sample size was relatively small in this study since only first-episode, drug-naive patients were included. This limits the ability to generalize our findings to entire populations of MDD and SCH. Second, this study investigated static functional brain networks in patients with MDD and SCH, which ignored the dynamic nature of the brain (De Domenico, 2017). Using dynamic approaches, future studies can explore temporal evolution of functional brain networks to provide richer and more refined information on convergent and divergent neurodevelopmental changes between MDD and SCH. Third, we employed a simplified multilayer network model (i.e., multiplex network) in this study. Despite frequent usage in previous literature, multiplex networks neglect inter-layer interactions between different nodes, which may be informative for the diagnosis and prognosis of MDD and SCH. Future studies are required to test this speculation by modeling all inter-layer interactions (Buldu and Porter, 2018). Fourth, we utilized a linear model to characterize MDD- and SCH-related neurodevelopmental changes since the participants in this study were relatively narrow in terms of their age distribution (13–45 years old). It would be interesting in the future to explore age-related brain network changes across the lifespan by using quadratic and cubic models. Fifth, despite non-significant differences between the two patient groups, disease duration was longer for the SCH patients than MDD patients in this study. This may confound our findings of diagnosis-specific neurodevelopmental abnormalities and age-independent network alterations. However, no significant correlations were found between disease duration and any brain network measure in neither the MDD nor the SCH group, suggesting the limited effects of differences in disease duration on our findings. Finally, we found that high-frequency fluctuations in R-fMRI signals contained important information for characterizing MDD- and SCH-related network alterations. Given the relatively coarse temporal resolution of conventional echo planar imaging sequences, future studies are required to deeply explore the pathophysiological significance of high-frequency fluctuations in MDD and SCH by employing advanced imaging sequences, such as multiband accelerated echo planar imaging (Smith et al., 2013).
Conclusions
In summary, this study investigated transdiagnostic and diagnosis-specific neurodevelopmental abnormalities between MDD and SCH through single-layer and multiplex network analyses of large-scale functional brain networks in different frequency intervals. Common and specific neurodevelopmental and age-independent network abnormalities were observed between the two diseases. These findings shed new light on shared and unique neural mechanisms underlying MDD and SCH.
Footnotes
Authors' Contributions
J.W. and M.H. designed experiments. F.P., Z.S., K.J., H.Z., S.L., and D.S. carried out experiments. J.L. and Z.L. analyzed experimental data. J.L. wrote the article. J.W., M.H., and Y.X. revised the article.
Author Disclosure Statement
The authors declare no competing interests.
Funding Information
This work was supported by the National Natural Science Foundation of China (Grant Nos. 81922036 and 81671764), the National Key Research and Development Program of China (Grant Nos. 2016YFC1307005 and 2016YFC1306900), the Key-Area Research and Development Program of Guangdong Province (Grant No. 2019B030335001), the Key Realm R&D Program of Guangzhou (Grant No. 202007030005), the Major Subject of Zhejiang Province (Grant No. 2015C03040), and the Basic Public Welfare Research Projects of Zhejiang Province (Grant No. LGF18H090003). The funding sources had no roles in the study design, data collection, data analysis, data interpretation, or writing of this article.
Supplementary Material
Supplementary Data
Supplementary Figure S1
Supplementary Figure S2
Supplementary Table S1
References
Supplementary Material
Please find the following supplemental material available below.
For Open Access articles published under a Creative Commons License, all supplemental material carries the same license as the article it is associated with.
For non-Open Access articles published, all supplemental material carries a non-exclusive license, and permission requests for re-use of supplemental material or any part of supplemental material shall be sent directly to the copyright owner as specified in the copyright notice associated with the article.