
Abstract
Hypoxia can stimulate 18F-fluorodeoxyglucose (18F-FDG) uptake in cultured tumor cells. This study has investigated the effect of lentiviral vector-mediated RNA interference (RNAi) targeting hypoxia-inducible factor 1α (HIF-1α) on the changes in HIF-1 and glucose transporter 1 (Glut-1) expression, the cell growth, and the uptake of 18F-FDG in the human pancreatic cancer cell line, Patu8988. Lentiviral RNAi vector targeting the HIF-1α gene (LV-HIF-1αRNAi) was constructed and used to treat cells at various concentrations (25–200 nM). The expression changes of HIF-1α and Glut-1 in hypoxic Patu8988 cells after RNAi treatment were determined using real time reverse transcription–polymerase chain reaction (real-time PCR). The inhibition rate of cell proliferation 48 hours after the addition of 10 μL of different concentrations of LV-HIF-1αRNAi (25–200 nM) was assayed using the MTT method. Meanwhile, the cell uptake of 18F-FDG was also assessed. After RNAi transfection, the relative expression levels of HIF-1α mRNA and Glut-1 under hypoxia were reduced and the relative expression levels of HIF-1α protein also decreased. Compared with the control group, the inhibition rates of cell proliferation under different viral dosages were 5.98%, 15.65%, 26.42%, and 40.81%, respectively, positively correlated with the viral doses (r=0.558, p<0.05). Under hypoxia, Glut-1 mRNA expression in Patu8988 cells treated with 200 nM of LV-HIF-1αRNAi for 24, 48, and 72 hours, respectively, was positively correlated with the inhibition rate of cell proliferation (r=0.618, p<0.05) as well as the inhibition rate of 18F-FDG uptake (r=0.664, p<0.05), while the latter two displayed a positive correlation with each other too (r=0.582, p<0.05). Under hypoxia, RNAi targeting HIF-1α significantly inhibited the expression of Glut-1 mRNA in Patu8988 pancreatic cancer cells and their uptake of 18F-FDG. These results suggest that LV-HIF-1αRNAi may form a new treatment for pancreatic cancer, and the effectiveness of the treatment can be readily assessed with 18F-FDG imaging.
Introduction
Pancreatic cancer is a common cancer of the digestive system, ranked second among gastrointestinal cancer deaths. 1,2 Hypoxia-inducible factor 1α (HIF-1α) is a key transcription factor regulating the oxygen homeostasis and hypoxic response and forms the major pathway transducing the signal for hypoxia-inducible gene transcription. Through binding to the specific DNA sequence of its target genes, HIF-1α regulates the transcription of genes involved in energy metabolism as well as in tumor angiogenesis, invasion, metastasis, apoptosis, and resistance to chemotherapy and radiotherapy. 3 –5 HIF-1 consists of α and β subunits. Anoxia or hypoxia induces high expression of HIF-1α in the cells or in the body, while HIF-1β is constitutively expressed, almost free from the regulation of oxygen. HIF-1α expression is closely correlated with the growth, angiogenesis, invasion, and metastasis of pancreatic tumor. 6 –10 Glut-1 is a member of the glucose transporter protein family, playing an important role as a transmembrane transport carrier in the cells. The expression of Glut-1 is upregulated in many malignant tumors and atypical hyperplasia tissues with a high risk of malignant transformation, which is considered the way through which tumor cells increase the uptake and utilization of glucose to meet the energy needs for the rapid proliferation of tumor cells.
Since part of the tumor tissue is in a relatively hypoxic state, under such a condition, abnormally upregulated Glut-l on the tumor cell surface can transport large amounts of glucose into the cells, which are first phosphorylated into glucose-6-phosphate by the hexokinase and subsequently transformed by isomerase into fructose-6-phosphate.
After the deoxygenation and translocation of the hydroxy group on the second carbon atom in the molecule, the original glucose ring transforms into deoxyglucose (FDG), which cannot be changed to fructose and hence is retained in the tumor cells. Therefore, after injection of 18F-FDG into the body, photons emitted by 18F penetrating the tumor tissues can be detected by the probe of positron emission tomography (PET) and reconstructed into an intuitive image of the glucose concentrated in the lesion. Thus, FDG-PET can directly reflect the biochemical properties of tumor tissue. 18F-FDG metabolic imaging has already been widely used in the clinical studies, which is of great significance for the identification, classification, staging, efficacy evaluation, residual and recurrent tumor identification, and prognosis, etc., of benign and malignant tumors. Tumor cells in the hypoxic state show more uptake of 18F-FDG. Application of 18F-FDG metabolic imaging may partly reflect the hypoxic state of tumor tissue. RNA interference (RNAi), a new gene blocking technology, is a process of sequence-specific post-transcriptional gene silencing mediated by double-stranded RNA fragments, which turns off gene expression at the mRNA level, and thus can quickly, efficiently, and specifically suppress the expression of target genes. 11 –15
Molecular imaging techniques can serve as powerful tools to track siRNA/small hairpin RNA (shRNA) delivery in vivo as well as to assess the silencing effects. 16,17 To date, multiple molecular imaging modalities have been applied in RNAi-related research, including magnetic resonance imaging, magnetic resonance spectroscopy, single-photon emission computed tomography, and PET. Due to its high sensitivity, PET has the greatest clinical potential among all molecular imaging modalities. PET and bioluminescence imaging have been used to evaluate the biodistribution and function of siRNA-containing nanoparticles in mice inoculated with luciferase-transfected tumor cells. 18 Utilizing the most widely used positron emitter 18F, a recent study examined the biodistribution of radiolabeled siRNAs. 19 Replacement of the 2′-hydroxyl group of certain nucleotides in the siRNA sequence with a fluorine atom or a methoxy group was found to be compatible with RNAi. PET imaging, performed after intravenous injection of 18F-labeled siRNAs (fluorine/methoxy substituted or unmodified) in rodents, showed rapid renal and hepatic clearance of radioactivity. Although tissue distribution profiles of these siRNAs were similar, fluorine-modified siRNAs exhibited better blood persistence and stability than both the methoxy-substituted and unmodified siRNAs. Molecular imaging may play a key role in selecting siRNA delivery systems with optimal biodistribution, pharmacokinetics, and targeting efficacy for future RNAi-based therapies. An alternative approach to confirm the efficiency of RNAi is to measure the silencing effect and/or therapeutic response. Currently, the majority of such studies use optical imaging techniques (both bioluminescence and fluorescence), which allow semiquantitative or quantitative measurement of gene inhibition.
The present study focuses on the application of lentiviral vector-mediated RNAi technology to reduce HIF-1α gene expression in the human pancreatic cancer cell line, Patu8988, and investigates the changes in HIF-1α expression, Glut-l mRNA expression, and 18F-FDG uptake, as well as the relationships among the three events. A similar study has never been reported in the literature.
Materials and Methods
Materials and reagents
Patu8988 human pancreatic cancer cells were obtained from the Jiangsu Institute of Hematology (Jiangsu, China). They were maintained in RPMI1640 medium, supplemented with 10% fetal bovine serum (FBS), in a 37°C, 5% CO2 incubator. The cells were passaged every other or third day. Trypsin and FBS were purchased from Life Technologies Corporation (Carlsbad, CA). Dulbecco's modified Eagle's medium was purchased from Thermo Fisher Scientific (Waltham, MA). Trizol, RT Kit, and SYBR Premix Ex Taq were purchased from TaKaRa Biotechnology (Dalian) Co., Ltd. (Dalian, China). Mouse antihuman β-actin monoclonal antibody was purchased from Cell Signaling Technology, Inc. (Danvers, MA). Mouse antihuman HIF-1α monoclonal antibody was purchased from R&D Systems (Minneapolis, MN). Horseradish peroxidase (HRP)-labeled goat antimouse secondary antibody was purchased from Santa Cruz Biotechnology, Inc. (Santa Cruz, CA). Negative control siRNA was purchased from Shanghai Biotent Co., Ltd. (Shanghai, China). HiPerFect Transfection Reagent was provided by Qiagen (Hilden, Germany). HIF-1α and β-actin primers were synthesized by Shanghai DaWeiKe Biotechnology Co., Ltd. (Shanghai, China). Lentiviral HIF-1α interference vector was designed and constructed by Shanghai GeneChem Co., Ltd. (Shanghai, China); the target sequence was the following: 5′-GACTCGTAGCTGTCTTGAT-3′ (GenBank access number: NM_001530). The sequence for α-oligonucleotide constituting short hairpin RNA (shRNA) was the following: 5′-GTGATGAAAGAATTACCGAAT-GGTACC-ATTCGGTAATTCTTTCATCAC-TTTTT-3′. HIF-1α RNAi vector LV-RNAi-HIF-1α was successfully constructed by lentiviral packaging.
Cell transfection and hypoxic treatment
Patu8988 cells were inoculated into a 96-well culture panel at 3×10⁵ cells per well. Each group had six replicate wells. After overnight culture, the cells were refreshed with serum- and antibiotic-free Opti-MEM and cultivated for another 8 hours. The cells were then transfected with Opti-MEM-diluted LV-HIF-1αRNAi at different final concentrations (25, 50, 100, and 200 nM, respectively) and detected and analyzed after culture for 24, 48, and 72 hours, respectively. Blank control groups (nontransfected Patu8988 cells) and negative control (empty vector) groups were also included for comparison. Each experiment was repeated thrice: one-way ANOVA indicated that the differences among repeats were not statistically significant (p>0.05). After transfection for 12 hours, the plate was placed into a 37°C, 0.5% O2 hypoxic incubator and cultivated for another 4 hours. The cells were then cultured under normoxic condition for the subsequent experiment.
Real-time PCR
Experimental groups were followed by CON group (control group): cells transfected with empty vector. Total RNAs were extracted from Patu8988 cells with an RNA extraction kit and reverse transcripted into cDNA with a reverse transcription kit. The primers for HIF-1α were forward, 5′-AGATTTAGACTTGGAGATGTTAGC-3′; reverse, 5′-CAGTGGTG GCAGTGGTAG-3′. The primers for internal reference β-actin were forward, 5′-ACTGGAACGGTGAAGGTGAC-3′; reverse, 5′-AGAGAAGTGGGGTGGCTTTT-3′. The reaction system (50 μL) was as follows: SYBR Green Mix 32.5 μL, forward primer 1.5 μL, reverse 1.5 μL, cDNA template 2 μL, and ddH2O 12.5 μL. The amplification conditions were as follows: 50°C 2 minutes, 95°C 5 minutes; 95°C 15 seconds, 60°C 45 seconds, 40 cycles. The data were analyzed using ABI Prism 7500 SDS software. The Glut-1 mRNA levels were detected by real-time PCR with the β-actin gene as the internal control. The primers for Glut-1 were as follows: forward, 5′-TCAATGCTGATGATG AACCTGCT-3′; reverse, 5′-GGTGACACTTCACCCACATACA-3′. The primers for β-actin were as follows: forward, 5′-ATCAACTTTCGATGGTAGTCG-3′; reverse, 5′-GGCACACGCAGCTCATTG-3′. The reaction system (50 μL) was as follows: SYBR Green Mix 32.5 μL, forward primer 1.5 μL, reverse primer 1.5 μL, cDNA template 2 μL, and ddH2O 12.5 μL. The amplification conditions were as follows: 95°C 10 seconds; 95°C 5 seconds, 55°C 34 seconds, 72°C 1 minute, 40 cycles. Each testing sample was in duplicate. The relative level of mRNA expression was determined using the 2−ΔΔCt method.
Western blotting
Expression of HIF-1α was detected by western blot. Patu8988 cells were inoculated into a 96-well culture panel at 3×10⁵ cells per well. Transfected with Opti-MEM-diluted LV-HIF-1αRNAi at different final concentrations (25, 50, 100, and 200 nM, respectively) for 48 hours, the culture medium in the 96-well panel was removed, and the cells were rinsed twice with cold phosphate-buffered saline (PBS). On ice, 200 μL cell lysis buffer (containing 150 mM NaCl, 10 mM Tris-HCl, 5 mM EDTA, 1% Triton-X100 [v/v], 1 mM PMSF, and 50 μg/mL leupeptin) was quickly added into the cells, which were lysed in an ice bath for 20 minutes. The cell lysates were then centrifuged at 15,000 rpm, 4°C for 20 minutes to harvest the supernatant. The proteins were quantitated by the Coomassie blue method, separated by sodium dodecyl sulfate–polyacrylamide gel electrophoresis, and transferred onto the nitrocellulose membrane. After blocking with bovine serum albumin, the membrane was incubated with mouse antihuman HIF-1α monoclonal antibody (1:200) overnight at 4°C. After thorough washing, the membrane was incubated with HRP-conjugated goat antimouse secondary antibody for 4 hours. The target protein was finally visualized by the enhanced chemiluminescence method and film exposure and development. The membranes were reprobed with β-actin (1:1000; Cell Signaling Technology, Beverly, MA) after stripping. The signal intensity of primary antibody binding was quantitatively analyzed with Sigma Scan Pro 5 and normalized to a loading control, β-actin. 20
MTT assay
The inhibition of cell growth was detected using the MTT assay. MTT colorimetric assay was adopted to detect the sensitivity of Patu8988 cells in vitro after using different dosages of LV-HIF-1αRNAi. Briefly, 1 day before transfection, the cells were trypsinized, counted, and plated onto a 96-well plate at a density of 3×10⁵ cells per well. The authors divided them into 3 groups: the blank group (no cells), control group (treated with saline), and experiment group (LV-HIF-1αRNAi). LV-HIF-1αRNAi-treated cells were divided into 4 groups according to the dosages (10, 50, 100, 200 nM). Then, the blank control groups (nontransfected Patu8988 cells) and negative control groups (transfected empty vector cells) were inoculated into the 96-well culture panel at about 3×10⁵/L in each well. After 48 hours of culture, the cells were added with 20 μL/well of MTT (5 mg/mL) and incubated at 37°C for another 4 hours. The culture medium was then replaced with 150 μL dimethyl sulfoxide (DMSO), and the plate was shaken for 10 minutes on an oscillation apparatus to dissolve the crystals of MTT metabolites. The absorbance (A value) of each well at a 490 nm wavelength was measured on a microplate reader. Actual absorbance=absorbance of the experimental group−absorbance of DMSO. The inhibition rate was calculated as follows: Growth inhibition rate=(Acontrol group−Aexperimental group)/Acontrol group×100%. The experiment was repeated thrice.
The effect of HIF-1α RNAi on the uptake of 18F-FDG
Patu8988 cells in the logarithmic growing phase were inoculated into a 96-well culture panel at a density of 3×10⁵/mL. LV-HIF-1αRNAi transfection was performed 24 hours later using Lipofectamine 2000 (Invitrogen, Carlsbad, CA). The authors divided them into 3 groups: the blank group (no cells), control group (treated with saline), and experiment group (LV-HIF-1αRNAi). LV-HIF-1αRNAi-treated cells were divided into 4 groups according to the dosages (10, 50, 100, and 200 nM, respectively). Then, the blank control groups (nontransfected Patu8988 cells) and negative control groups (cells transfected with empty vector) were inoculated into the 96-well plate at about 3×10⁵/L in each well. The cells were transferred to a 37°C, 0.5% O2 incubator 12 hours after the transfection and cultivated for another 4 hours under hypoxic condition. The cells were then placed back to normoxic condition, added with 18F-FDG (0.74 kBq/μL), and incubated for another 1 hour. After the cultivation, the plate was placed on ice, and the supernatant in each well was quickly collected into the respective numbered test tubes. The cells were washed with cold PBS, which was also collected and mixed with the corresponding original supernatant from each well. Cells were then harvested into individual test tubes, which were numbered corresponding to their supernatants. The rate of cell uptake of 18F-FDG was measured with a γ counter, and the inhibition rate of 18F-FDG uptake was calculated according to the formula as follows: Uptake inhibition rate=(uptake rate of control cells−uptake rate of experiment cells)/uptake rate of control cells×100%.
Results
The effect of RNAi on HIF-1α mRNA expression
The analysis of cycle threshold (Ct) of real-time PCR is shown in Table 1. Real-time PCR results indicated that, under hypoxia, after RNAi with 25, 50, 100, and 200 nM of LV-HIF-1αRNAi, respectively, the relative expression levels of HIF-1α/β-actin mRNA in Patu8988 cells were 0.426±0.036, 0.334±0.031, 0.262±0.022, and 0.223±0.018, respectively, while the corresponding levels in negative and blank control groups were 0.967±0.006 and 0.971±0.012, respectively; the differences were statistically significant (F=14.54 and 15.38, respectively, p<0.05) (Fig. 1). Under normoxia, after RNAi with 25, 50, 100, and 200 nM of LV-HIF-1αRNAi, respectively, the relative expression levels of HIF-1α/β-actin mRNA in Patu8988 cells were 0.606±0.030, 0.574±0.026, 0.518±0.023, and 0.432±0.019, respectively, while the corresponding levels in negative and blank control groups were 0.638±0.010 and 0.652±0.015, respectively; the differences were statistically significant (F=11.55 and 12.36, respectively, p<0.05; Fig. 2). Under hypoxic conditions, after treatment with 200 nM LV-HIF-1αRNAi for 24, 48, and 72 hours, respectively, the relative expression levels of HIF-1α/β-actin mRNA changed to 0.321±0.028, 0.223±0.018, and 0.165±0.016, respectively, while the corresponding levels in negative control were 0.971±0.021, 0.964±0.020, and 0.959±0.018, respectively, and in blank control were 0.976±0.020, 0.972±0.016, and 0.969±0.012, respectively, with a statistically significant difference (F=14.36 and 18.26, respectively, p<0.05).
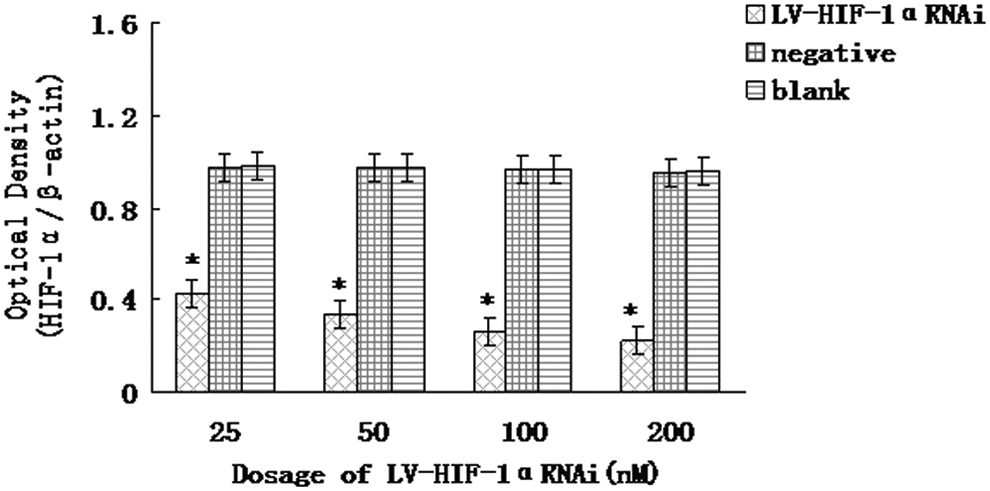
Under hypoxic conditions, downregulation of hypoxia-inducible factor 1α (HIF-1α) mRNA expression by LV-HIF-1αRNAi. The mRNA expression of HIF-1α was, respectively, significantly decreased in the experimental group compared with the blank control group and the negative control group *(p<0.05).
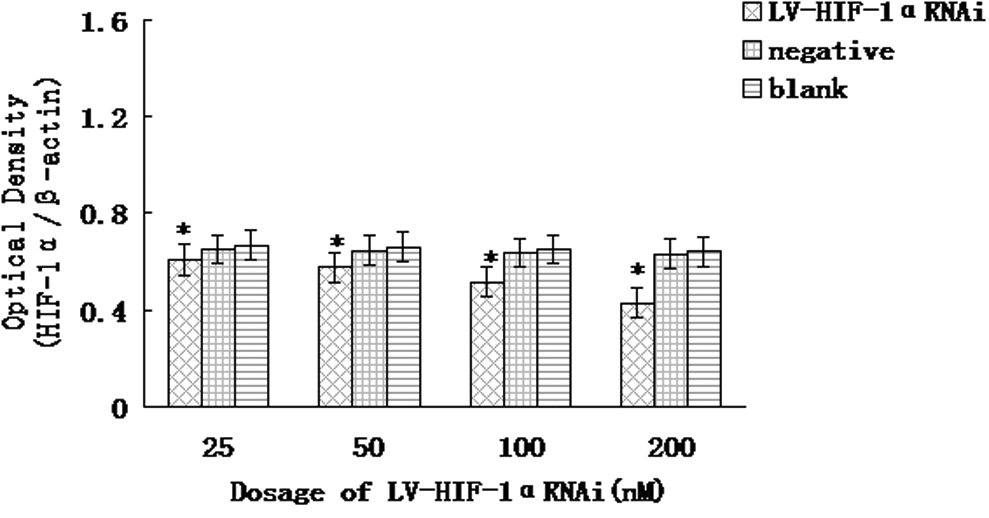
Under normoxic conditions, downregulation of HIF-1α mRNA expression by LV-HIF-1αRNAi. The mRNA expression of HIF-1α was, respectively, significantly decreased in the experimental group compared with the blank control group and the negative control group *(p<0.05).
Groups 1–5, cells were incubated under normoxia; groups 6–10, cells were incubated under hypoxia.
LV-RNAi-1–4, different concentrations of LV-HIF-1αRNAi (25, 50, 100, and 200 nM, respectively).
ΔCt, HIF-1α Ct-β-actin Ct; −ΔΔCt, mean value of CONΔCt-LV-RNAiΔCt; 2−ΔΔCt, the relative expression level of the HIF-1α gene compared with the CON group.
Ct, cycle threshold; HIF-1α, hypoxia-inducible factor 1α.
The effect of RNAi on HIF-1α protein expression
The results of the western blot showed that in the hypoxic state, after RNAi with 25, 50, 100, and 200 nM of LV-HIF-1αRNAi, respectively, the relative expression levels of HIF-1α/β-actin protein in Patu8988 cells were 0.672±0.026, 0.348±0.022, 0.226±0.016, and 0.164±0.012, respectively, while the corresponding protein levels in negative and blank control groups were 0.721±0.015 and 0.736±0.023, respectively; the differences were statistically significant (F=15.94 and 12.65, respectively, p<0.05) (Fig. 3). In the normoxic state, after RNAi with 25, 50, 100, and 200 nM of LV-HIF-1αRNAi, respectively, the relative expression levels of HIF-1α/β-actin protein in Patu8988 cells were 0.611±0.023, 0.583±0.020, 0.532±0.016, and 0.459±0.013, respectively, while the corresponding protein levels in negative and blank control groups were 0.639±0.013 and 0.654±0.019, respectively; the differences were statistically significant (F=14.46 and 13.51, respectively, p<0.05; Fig. 4). Under hypoxic conditions, after treatment with 200 nM LV-HIF-1αRNAi for 24, 48, and 72 hours, respectively, HIF-1α/β-actin protein expression levels changed to 0.238±0.016, 0.164±0.012, and 0.112±0.010, respectively, while the corresponding levels in negative control groups were 0.726±0.012, 0.720±0.016, and 0.717±0.015, respectively, and in blank control groups were 0.744±0.018, 0.735±0.012, and 0.728±0.010, respectively, with a statistically significant difference (F=13.62 and 16.52, respectively, p<0.05).
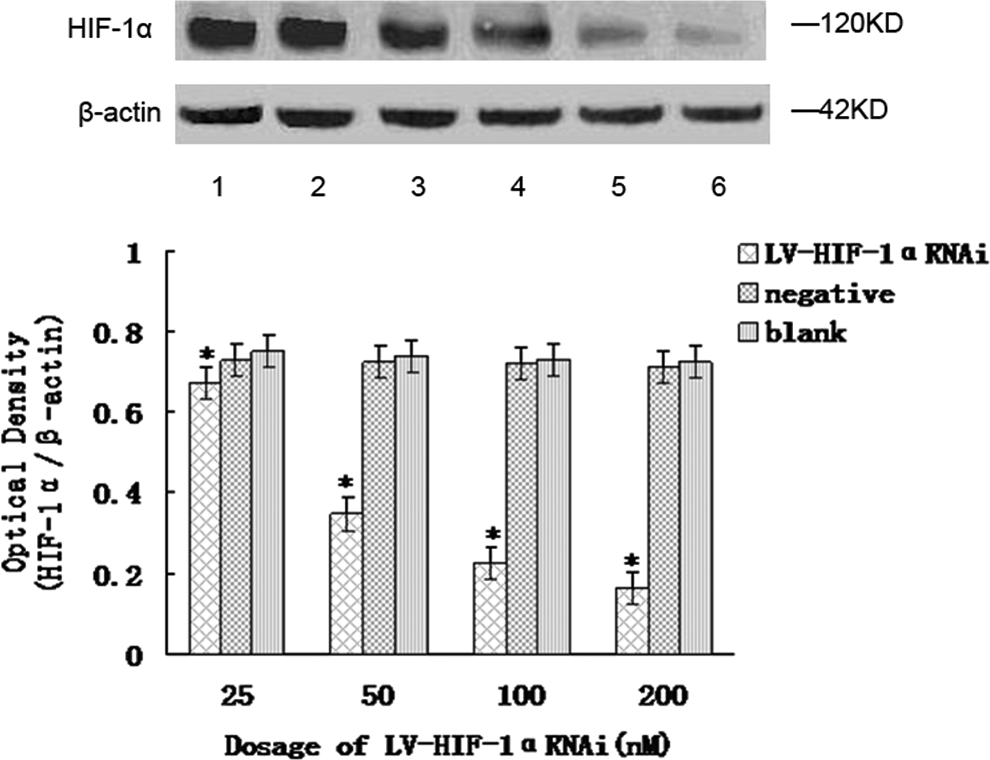
Under hypoxic conditions, downregulation of HIF-1α protein expression by LV-HIF-1αRNAi. The mRNA expression of HIF-1α was, respectively, significantly decreased in the experimental group compared with the blank control group and the negative control group *(p<0.05). Lane 1, blank control group; lane 2, negative control group; lanes 3–6, experimental group (LV-HIF-1αRNAi at different concentrations).
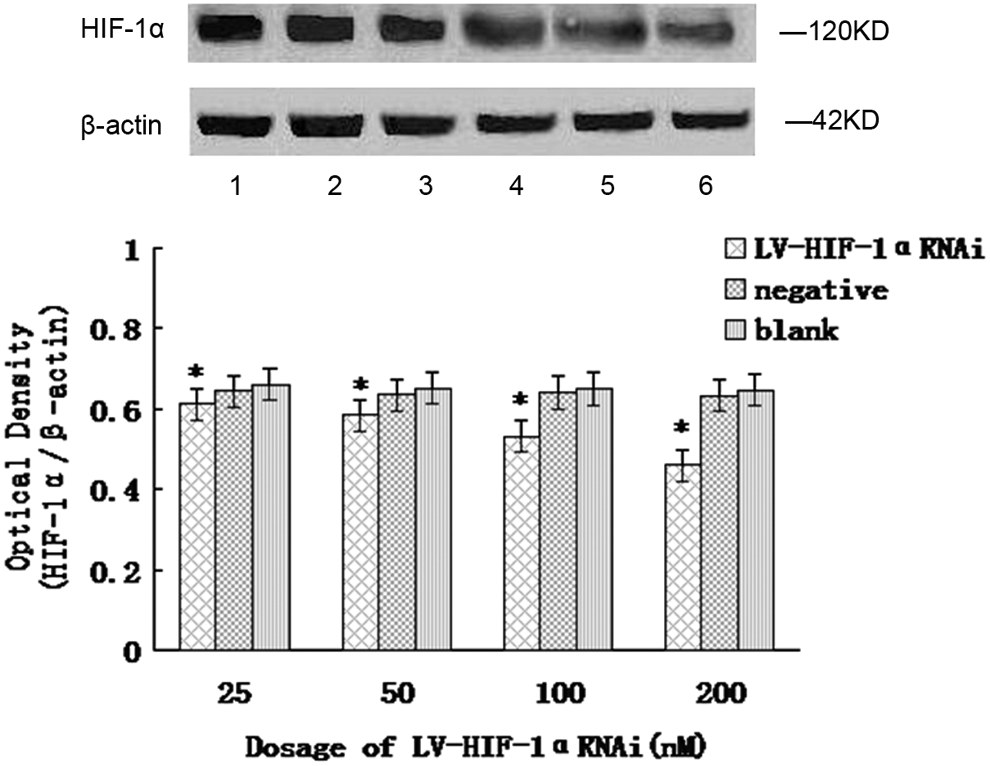
Under normoxic conditions, downregulation of HIF-1α protein expression by LV-HIF-1αRNAi. The mRNA expression of HIF-1α was, respectively, significantly decreased in the experimental group compared with the blank control group and the negative control group *(p<0.05). Lane 1, blank control group; lane 2, negative control group; lanes 3–6, experimental group (LV-HIF-1αRNAi at different concentrations).
The effect of HIF-1α RNAi on the mRNA expression of Glut-1
The analysis of Ct of real-time PCR is shown in Table 2. Similarly, under hypoxic conditions, after RNAi with 25, 50, 100, and 200 nM of LV-HIF-1αRNAi, respectively, the relative expression levels of Glut-1/β-actin mRNA in Patu8988 cells were 0.056±0.011, 0.048±0.008, 0.039±0.006, and 0.027±0.005, respectively, while the corresponding mRNA levels in negative and blank control groups were 0.122±0.021 and 0.129±0.024, respectively; the differences were statistically significant (F=18.54 and 16.81, respectively, p<0.05; Fig. 5). Under normoxic conditions, after RNAi with 25, 50, 100, and 200 nM of LV-HIF-1αRNAi, respectively, the relative expression levels of Glut-1/β-actin mRNA in Patu8988 cells were 0.042±0.018, 0.035±0.015, 0.029±0.011, and 0.020±0.008, respectively, while the corresponding mRNA levels in negative and blank control groups were 0.062±0.020 and 0.071±0.023, respectively; the differences were statistically significant (F=14.33 and 13.29, respectively, p<0.05; Fig. 6). Under hypoxic conditions, after treatment with 200 nM LV-HIF-1αRNAi for 24, 48, and 72 hours, respectively, Glut-1/β-actin mRNA expression levels changed to 0.034±0.011, 0.027±0.005, and 0.011±0.003, respectively, while the corresponding levels in negative control groups were 0.128±0.018, 0.120±0.013, and 0.117±0.009, respectively, and in blank control groups were 0.136±0.024, 0.130±0.019, and 0.122±0.012, respectively, with a statistically significant difference (F=14.96 and 16.19, respectively, p<0.05).
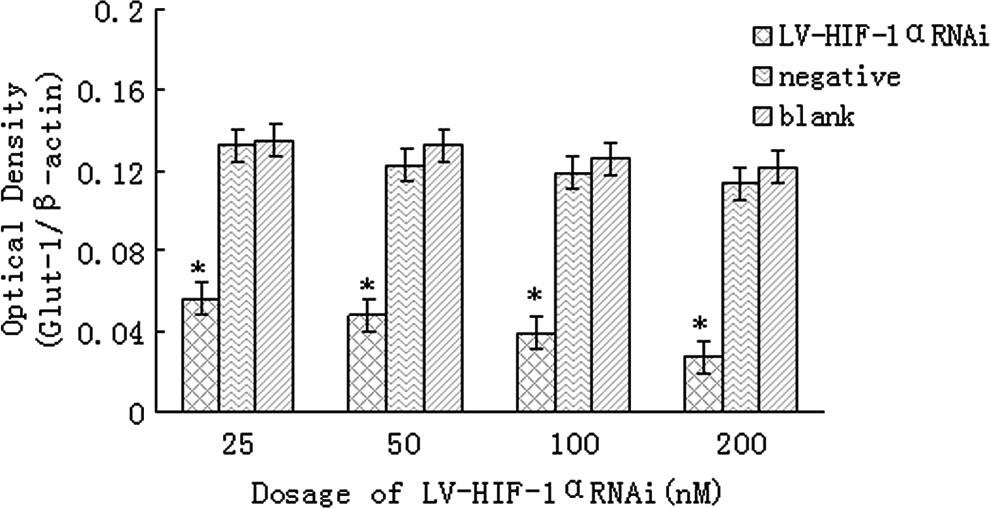
Under hypoxic conditions, downregulation of glucose transporter 1 (Glut-1) mRNA expression by LV-HIF-1αRNAi. The mRNA expression of HIF-1α was, respectively, significantly decreased in the experimental group compared with the blank control group and the negative control group *(p<0.05).
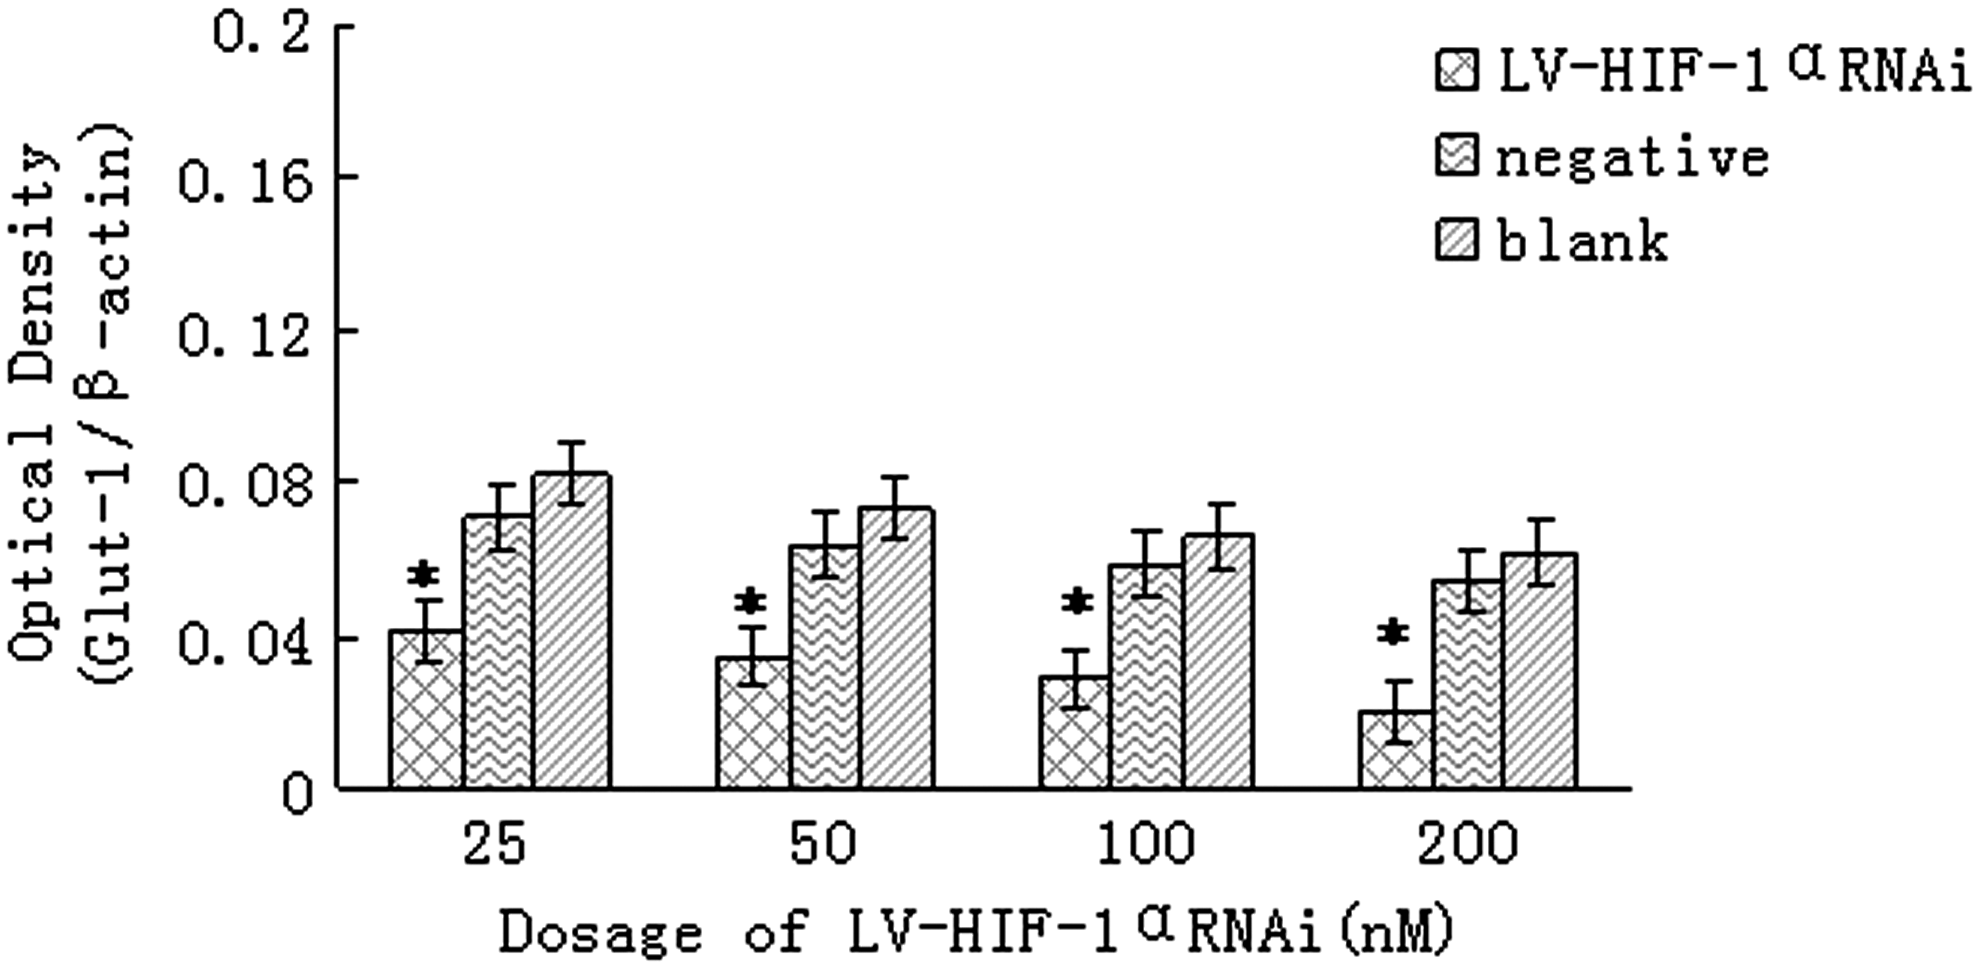
Under normoxic conditions, downregulation of Glut-1 mRNA expression by LV-HIF-1αRNAi. The mRNA expression of HIF-1α was, respectively, significantly decreased in the experimental group compared with the blank control group and the negative control group *(p<0.05).
Groups 1–5, cells were incubated under normoxia; groups 6–10, cells were incubated under hypoxia.
LV-RNAi-1–4, different concentrations of LV-HIF-1αRNAi (25, 50, 100, and 200 nM, respectively)
ΔCt, Glut-1 Ct-β-actin Ct; −ΔΔCt, mean value of CONΔCt-LV-RNAiΔCt; 2−ΔΔCt, the relative expression level of the Glut-1gene compared with the CON group.
Glut-1, glucose transporter 1.
The effect of HIF-1α RNAi on the growth of Patu8988 cells
The inhibition rate of cell growth was detected by MTT colorimetric assay. Under hypoxic conditions, after 48 hours of treatment with LV-HIF-1αRNAi at 25, 50, 100, and 200 nM, respectively, the growth inhibition rates were 5.98%, 15.65%, 26.42%, and 40.81%, while the growth inhibition rates in the negative control group were 2.26%, 8.31%, 15.26%, and 22.78%, and those in the blank control group were 1.51%, 5.52%, 13.12%, and 20.36%, respectively (Fig. 7). After using LV-HIF-1αRNAi (25–200 nM) for 48 hours, the inhibition rates in the experimental group were higher than those in the negative and blank control groups (p<0.05). The inhibition rate was positively correlated with the dose of RNAi (r=0.558, p<0.05). Under normoxic conditions, after 48 hours of treatment with LV-HIF-1αRNAi at 25, 50, 100, and 200 nM, respectively, the growth inhibition rates were 2.21%, 6.32%, 14.58%, and 25.84%, while the growth inhibition rates in the negative control group were 1.84%, 4.13%, 10.36%, and 18.52%, and those in the blank control group were 0.58%, 3.69%, 8.46%, and 16.69%, respectively (Fig. 8). Under hypoxic conditions, after treatment of Patu8988 cells with 200 nM LV-HIF-1αRNAi for 24, 48, and 72 hours, the inhibition rates were 30.62%, 40.81%, and 47.12%, respectively, while the inhibition rates in the negative control group were 15.20%, 22.68%, and 30.53%, respectively, and those in the blank control group were 13.82%, 20.42%, and 28.34%, respectively; the difference was statistically significant (F=19.64 and 16.81, respectively, p<0.05).
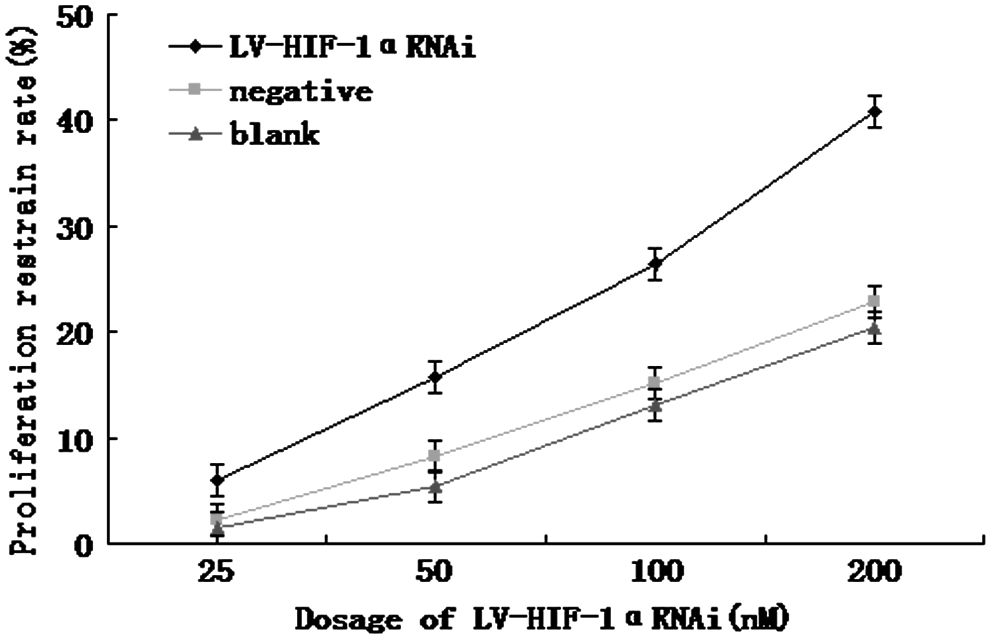
Under hypoxic conditions, higher inhibition rates by different dosages of LV-HIF-1αRNAi.
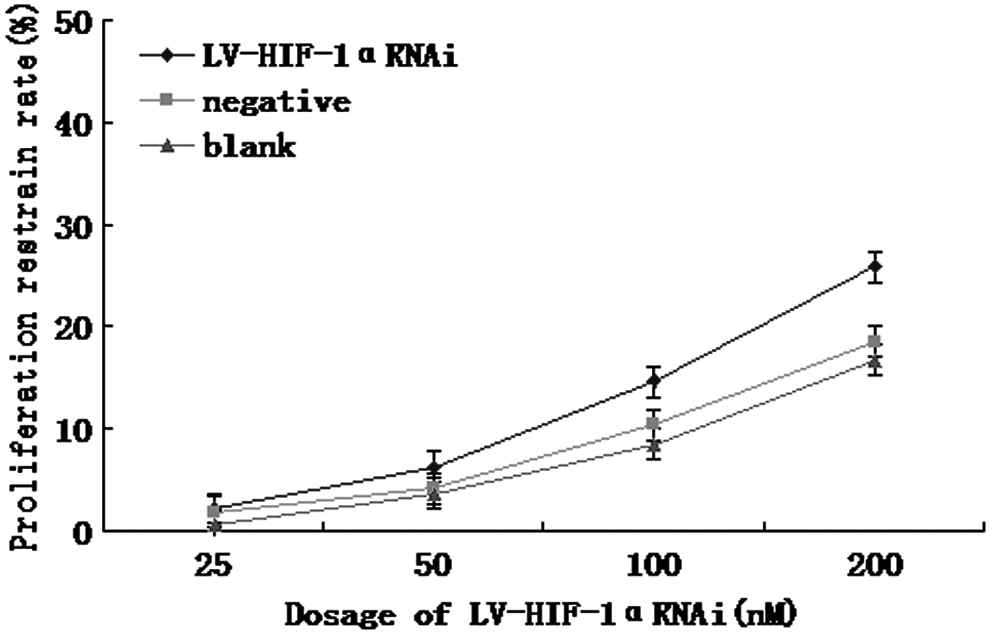
Under normoxic conditions, higher inhibition rates by different dosages of LV-HIF-1αRNAi.
The effect of HIF-1α RNAi on 18F-FDG uptake
Under hypoxic conditions, after 48 hours of treatment with 25, 50, 100, and 200 nM of LV-HIF-1αRNAi, respectively, the 18F-FDG uptake rates were 32.12%, 25.36%, 17.42%, and 10.16%, respectively, while the 18F-FDG uptake rates in the negative control group were 38.64%, 36.14%, 34.62%, and 30.52%, and those in the blank control group were 41.33%, 38.69%, 36.46%, and 34.21%, respectively. After using LV-HIF-1αRNAi (25–200 nM) for 48 hours, the 18F-FDG uptake rates in the experimental group were lower than those in negative and blank control groups (p<0.05; Fig. 9). The 18F-FDG uptake rate exhibited a negative correlation with the RNAi dose (r=−0.521, p<0.05). Under normoxic conditions, after 48 hours of treatment with 25, 50, 100, and 200 nM of LV-HIF-1αRNAi, respectively, the 18F-FDG uptake rates were 27.21%, 20.52%, 13.38%, and 5.44%, respectively, while the 18F-FDG uptake rates in the negative control group were 31.85%, 25.31%, 18.36%, and 10.25%, and those in blank control group were 32.84%, 26.11%, 19.06%, and 12.12%, respectively (Fig. 10). Under hypoxic conditions, after being transfected with 200 nM LV-HIF-1αRNAi for 24, 48, and 72 hours, respectively, the 18F-FDG uptake rates of Patu8988 cells changed to 17.28%, 10.16%, and 6.34%, respectively, while the 18F-FDG uptake rates in the negative control group were 35.46%, 31.54%, and 26.54%, respectively, and those in the blank control group were 36.33%, 33.81%, and 28.13%, respectively; the difference was statistically significant (F=10.72 and 13.59, respectively, p<0.05).
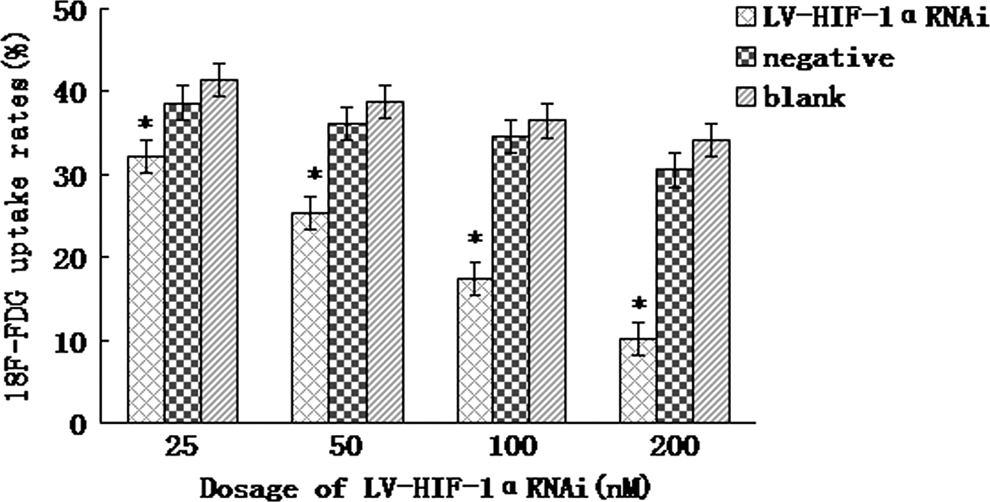
Under hypoxic conditions, lower 18F-FDG uptake rates by different dosages of LV-HIF-1αRNAi. *(p<0.05).
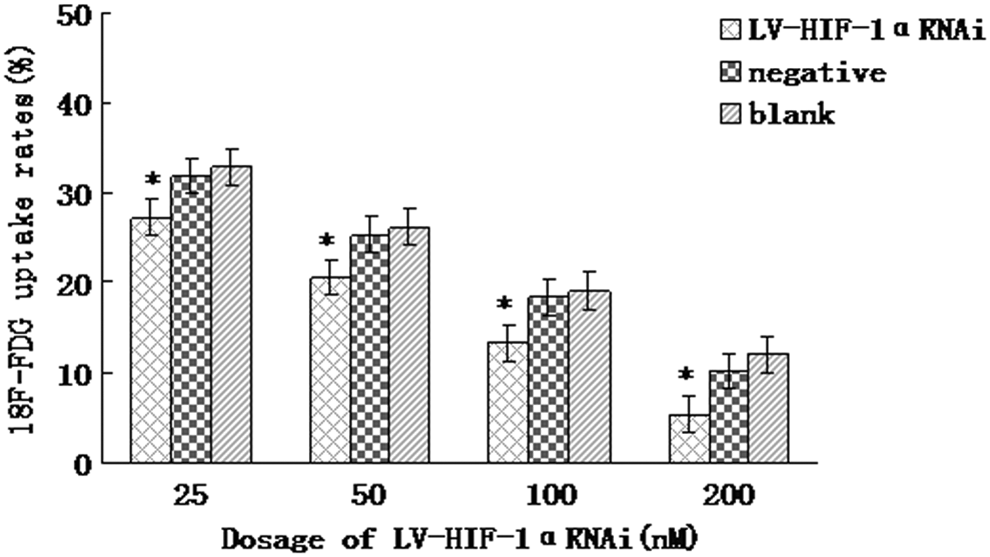
Under normoxic conditions, lower 18F-FDG uptake rates by different dosages of LV-HIF-1αRNAi. *(p<0.05).
The relationships among the inhibition rates of Glut-1 mRNA expression, cell growth, and 18F-FDG uptake after RNAi
Figures 11 and 12 show the relationships among the inhibition rates of Glut-1 mRNA expression, cell growth, and 18F-FDG uptake 48 hours after the transfection with different concentrations of LV-HIF-1αRNAi under hypoxic and normoxic conditions, respectively. Under hypoxic conditions, after transfection of the Patu8988 cells with 200 nM LV-HIF-1αRNAi for 24, 48, and 72 hours, respectively, the inhibition rate of Glut-1 mRNA expression showed a positive correlation with both the growth inhibition rate (r=0.618, p<0.05) and the inhibition rate of 18F-FDG uptake (r=0.664, p<0.05), while the latter two positively correlated with each other too (r=0.582, p<0.05).
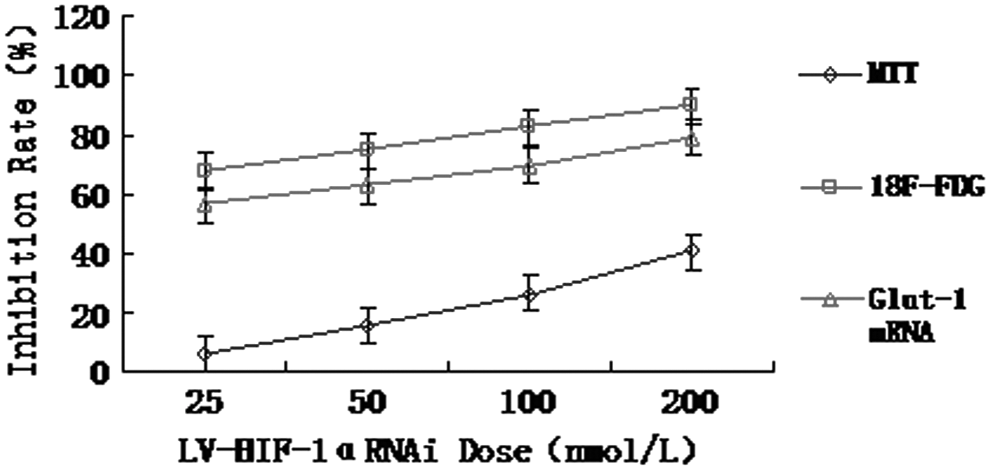
Under hypoxic conditions, the relationships among the inhibition rates of 18F-FDG uptake, cell growth (MTT assay), and Glut-1 mRNA expression after LV-HIF-1αRNAi treatment.
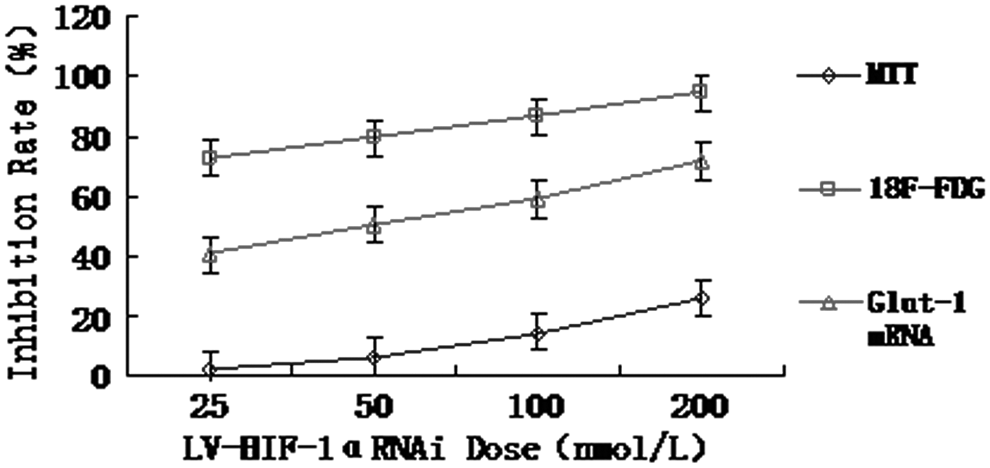
Under normoxic conditions, the relationships among the inhibition rates of Glut-1 mRNA expression, cell growth, and 18F-FDG uptake 48 hours after the transfection with different concentrations of LV-HIF-1αRNAi.
Discussion
RNAi, as a new tool in the field of functional gene research, exhibits a high degree of sequence specificity and can specifically silence the target genes to achieve the effect of mutations with functional loss or reduction. Since the first report in 2001 that small RNA fragments can specifically inhibit gene expression in mammalian cells, 21 there is a boom of subsequent RNAi studies in mammals, which also creates an awareness that selective intervention of overexpressed oncogenes may become a new means of tumor gene therapy. Treatment using RNAi technology has already become a new hot spot in pancreatic cancer gene therapy.
Gene therapy vector system is one of the important factors related to the success of gene therapy. An ideal vector should be able to effectively transfer one or more functional genes to a specific target, to escape the surveillance of the immune system without causing inflammation, and to be stably and conveniently amplified and purified to a large scale. Meanwhile, it should be safe for both the host and the environment and able to express the transferred exogenous genes under an appropriate regulatory mechanism. Lentivirus belongs to the family of retroviruses, which are noncarcinogenic and often used as gene therapy vectors. Its characteristics are able to infect both dividing and nondividing cells, generating a chronic infection with long latency and duration. 22 The present lentiviral expression system comprises three main parts: a lentiviral expression vector, a lentiviral packaging plasmid, and a cell line to produce pseudoviral particles (such as 293T cells). Such a system includes all the required genetic information for the process of virus packaging, transfection, stable integration into the genomic DNA, and expression of siRNA, cDNA, or reporter genes. For a large variety of cells, transduction mediated by lentivirus can achieve a nearly 100% transfection efficiency, which greatly increases the screening success rate for stable cell lines. 23,24
The blood supply in pancreatic cancer is poor. A possible reason for its continuous proliferation, invasion, and metastasis under severe hypoxia is the induction of HIF-1α gene expression in pancreatic cancer by the continuous hypoxia. 25 Recent studies showed that HIF-1, as a transcription factor, plays a very important role in the cells. HIF-1 comprises α and β subunits, and HIF-1α is the main subunit for HIF-1 expression and activity. As a transcription factor, HIF-1 binds to a variety of target genes and regulates their transcription activity, mediating a series of hypoxic adaptive responses in cells and tissues. 26 HIF-1α overexpression upregulates the expression of vascular endothelial growth factor, Glut-1, and a number of genes encoding the key glycolysis enzymes, promotes tumor angiogenesis and energy metabolism, and plays a central role in the promotion of tumor invasion and metastasis. 10
Using the HIF-1α gene sequence-specific lentiviral vector LV-HIF-1αRNAi as an RNAi tool, this study has successfully transfected the human pancreatic cancer cell line, Patu8988, downregulated its HIF-1α gene expression, and inhibited the cell proliferation. Such an effect was dose and time dependent. In this study, the maximum dose of LV-HIF-1αRNAi was 200 nM, under which the level of HIF-1α expression was reduced by 76.72%, and the cell growth was significantly inhibited too, which is in agreement with the results of Hanze et al. 27 who reported that RNAi with chemically synthesized double-stranded RNA reduced the HIF-1α mRNA expression by ∼70% in a hypoxic state. Jung et al. 28 also showed that HIF-1α is sensitive to hypoxia; HIF-1α protein expression becomes evident 10 minutes after the hypoxic induction and reaches its maximum level 3 hours after the hypoxia. Western blot results indicated that, under hypoxia, the protein expression of HIF-1α was significantly reduced in all groups of LV-HIF-1αRNAi-treated cells.
With the increase of HIF-1α expression, the protein level of Glut-1 rises too, resulting in an increased glucose uptake in the cell. 29 As an analogue, 18F-FDG shares a similar cellular transport process with glucose. Intracellular 18F-FDG is transformed into 18F-FDG-6-phosphate by hexokinase and retained inside the cells without further involvement in the glucose metabolism. The growth and metabolism of tumor tissue are vigorous; the increased metabolic activity in tumor lesion significantly augments the glucose uptake and glycolysis in tumor cells, while the 18F-FDG uptake and Glut-1 expression display an evident positive correlation. 30 A study has also shown that hypoxia-induced increase in Glut-1 expression can elevate the 18F-FDG uptake too. 31
The results of this study demonstrated that LV-HIF-1αRNAi transfection significantly inhibited the growth of Patu8988 cells in a dose-dependent manner, while both the expression level of Glut-1 mRNA and the cell uptake of 18F-FDG were negatively correlated with the dose of LV-HIF-1αRNAi. In general, under hypoxic conditions, in LV-HIF-1αRNAi-treated Patu8988 cells, the inhibition rate of Glut-1 mRNA expression was positively correlated with both the inhibition rate of cell growth (r=0.618, p<0.05) and the inhibition rate of 18F-FDG uptake (r=0.664, p<0.05), while the latter two showed a positive correlation with each other too (r=0.582, p<0.05). These results indicate that lentiviral vector-mediated HIF-1α RNAi significantly inhibited the growth and metabolism of Patu8988 pancreatic cancer cells and reduced the expression of Glut-1 mRNA and subsequently the uptake and utilization of glucose, which is manifested as a declined uptake of 18F-FDG in Patu8988 cells in the hypoxic state.
Compared with chemically synthesized siRNA oligos and transient expression-based shRNA vectors, lentiviral shRNA vectors (after being packaged with the lentiviral packaging system) can transduce the cells and integrate into the genome of infected cells to stably express the transferred genes in the long term. Especially, when used in in vivo studies, unlike other chemical transfections, the lentiviral vector does not cause nonspecific reactions and is thus suitable for in vivo RNAi studies, such as tumor formation experiments with stably transfected cell lines, intratumoral injection, and local injection. This also provides a possibility to realize RNAi therapy targeting the pathogenic gene in somatic cells in the patients. 32 –34
In conclusion, this study has demonstrated the effect of lentiviral vector-mediated HIF-1α RNAi in pancreatic cancer cells and that such an effect can be reflected by 18F-FDG uptake, suggesting that 18F-FDG metabolic imaging may be used in the clinic to determine the efficacy of molecular therapy of pancreatic cancer targeting the HIF-1α in the patient's body.
Footnotes
Acknowledgment
This study was financially supported by the Science and Technology Development Fund from Nanjing Medical University (09NJMUM054).
Disclosure Statement
No competing financial interests exist.