
Abstract
Background:
Lung combined large-cell neuroendocrine carcinoma (CoLCNEC) refers to lung regions exhibiting both the features of large-cell neuroendocrine carcinoma (LCNEC) and the defined components of nonsmall cell lung cancer (NSCLC), with a relatively high mitotic rate. Diagnosing and predicting the prognosis of CoLCNEC are challenging. This study explored spatial transcriptomic expression patterns and identified crucial genes.
Methods:
We utilized a sample from a CoLCNEC patient containing three distinct components, namely, LCNEC, adenocarcinoma, and squamous cell carcinoma, with the former being predominant. Spatial transcriptomics (ST) technology, which employs the 10× Genomics Visium formalin-fixed paraffin-embedded ST kit, was applied along with high-throughput sequencing to obtain gene expression information and spatial locations for each spot. Subsequent analysis included differentially gene expression and functional enrichment. Finally, immunohistochemistry was employed to validate the marker protein structural maintenance of chromosomes 1A (SMC1A). Then, SMC1A was overexpressed and silenced in NCI-H661 and LTEP-a-2 cells, and the migration and invasion ability of the cells were detected by scratch assay and Transwell, respectively. The role of SMC1A in cancer cell cycle was detected by Real-time Reverse Transcription-PCR(RT-qPCR), Western blot, and flow cytometry, the apoptosis was detected by flow cytometry.
Results:
The results revealed that tumor tissue regions had higher unique molecular identifiers and gene counts than nontumor regions did. Unsupervised clustering identified four clusters, revealing the uniform distribution of unique transcripts, which were mapped onto slices to display apparent spatial separation. Differentially gene expression analysis revealed genes highly expressed in cancer cells. Further analysis of different regions revealed distinct cellular subgroups enriched through differentially gene expression analysis in various pathways, such as the cell cycle and DNA replication. Finally, SMC1A was chosen as a candidate gene, and immunohistochemistry confirmed its elevated expression in tumor regions. In addition, compared with oe-NC, oe-SMC1A can significantly promote the migration, invasion and G1/S phase transition of lung cancer cells, and promote the inhibition of apoptosis of cancer cells, while sh-SMC1A is completely opposite.
Conclusions:
In the tumor region of CoLCNEC, SMC1A is significantly upregulated. Moreover, silencing SMC1A effectively inhibits lung cancer cell invasion, migration, and G1/S phase transition, while promoting apoptosis. These findings indicate that SMC1A has the potential to be a new therapeutic target for CoLCNEC treatment.
Introduction
Neuroendocrine carcinoma of the lung is a heterogeneous subtype of lung cancer, accounting for 20%−25% of all lung cancers. This subtype encompasses small-cell lung cancer (SCLC), large-cell neuroendocrine carcinoma (LCNEC), typical carcinoid, and atypical carcinoid. 1 LCNEC is an uncommon primary tumor of the lung arising from argentaffin cells in the bronchial mucosa and presents morphological and differentiation features of neuroendocrine tumors. As a rare and high-grade neuroendocrine carcinoma, its incidence comprises approximately 0.3%−3% of all lung cancers. 2 Although LCNEC is pathologically classified as nonsmall cell lung cancer (NSCLC), it presents increased invasiveness, increased malignancy, and diagnostic challenges compared with NSCLC. LCNEC has a poorer prognosis and is more prone to developing drug resistance, and its biological behavior aligns more closely with that of SCLC. 3 The studies of Welter et al. 2 indicated that LCNEC patients have unfavorable outcomes in advanced stages than NSCLC patients do; however, LCNEC patients have better prognoses in the early stages. However, patients who undergo early surgical intervention face a greater risk of postoperative recurrence and distant metastasis than do NSCLC patients, and LCNEC patients are more likely to develop chemotherapy resistance, leading to a poorer prognosis. Currently, research on LCNEC is relatively limited and lacks precise epidemiological data, and a standardized treatment approach has not yet been established. Combined large-cell neuroendocrine carcinomas (CoLCNECs) refer to regions displaying morphological and histological characteristics of LCNEC alongside distinct NSCLC components, such as squamous cell carcinoma, adenocarcinoma, giant cell carcinoma, and spindle cell carcinoma. 4 CoLCNEC is typically diagnosed in stages III to IV, demonstrating a metastatic pattern similar to SCLC and having a worse prognosis than LCNEC does. 5 Owing to its heterogeneity and overlapping features with other tumors, such as squamous cell carcinoma and SCLC, CoLCNEC poses a diagnostic challenge.
In recent years, with the advancement of spatial transcriptomics (ST) technology, researchers have gained a deeper understanding of the spatial heterogeneity within tumor tissues. This technique enables simultaneous measurement of in situ gene expression patterns, offering valuable insights into the cellular composition and functional characteristics of different regions within the tumor microenvironment. 6 The emergence of STs has led to revolutionary changes in cancer research, allowing the identification of novel biomarkers, potential therapeutic targets, and a more comprehensive understanding of tumor biology. This technology has been widely applied in the study of lung development and respiratory system diseases. In the context of lung cancer, ST has revealed the heterogeneity, evolution, and metastasis of the tumor microenvironment, 7 –9 as well as the origin of intratumoral microbial communities. 10 Researchers, employing ST assessments of gene expression in NSCLC patients, discovered that certain tumors possess the ability to exclude immune effector cells, such as CD8+ T cells, from tumor clusters. They leveraged this information to develop transcriptomic features on account of the expression of CD3 and ICOS, allowing for the prediction of overall patient survival. 11 However, the exploration of spatial heterogeneity in LCNEC remains limited, and a comprehensive study of differentially gene expression profiles in different regions within LCNEC tumors is lacking. Understanding the spatial distribution and expression patterns of LCNEC-related genes is crucial for revealing the molecular mechanisms, progression, and potential therapeutic targets of this invasive subtype of lung cancer.
Based on the unique spatial heterogeneity characteristics of CoLCNEC, we hypothesize that there exist specific gene expressions and spatial distribution patterns of cell subpopulations within its tumor microenvironment that are associated with neuroendocrine differentiation and aggressive phenotypes. These patterns may drive the malignant progression of tumors and differences in clinical prognosis by regulating interactions between the tumor and immune microenvironment, as well as pathways related to tumor cell growth. 12 Therefore, this study aimed to delve into the spatial heterogeneity of CoLCNEC through ST technology. We employed unsupervised clustering algorithms to determine the expression patterns and spatial distributions of genes within tumor tissues. Additionally, we conducted differentially gene expression analysis for different regions of the tumor (including tumor and nontumor regions) and different cellular subgroups within the tumor. By identifying differentially expressed genes and features of cellular subgroups within CoLCNEC tumors, we hoped to elucidate the underlying biological characteristics of this aggressive lung cancer subtype. Furthermore, our findings might contribute to the development of personalized treatment strategies and the identification of potential prognostic markers for CoLCNEC patients. In conclusions, this study comprehensively analyzed the spatial heterogeneity of CoLCNEC via STs, providing valuable insights into the occurrence and development of this tumor and potentially advancing the development of targeted therapies for this invasive subtype of lung cancer.
Methods
Sample background data
Pathologists have reclassified and diagnosed the histology of inpatient LCNEC patients according to the 2021 WHO criteria. 13 The histological and immunohistochemical diagnosis of CoLCNEC requires meeting neuroendocrine morphological characteristics and the simultaneous presence of other histological types within the tumor (such as adenocarcinoma, squamous cell carcinoma). Immunohistochemical detection of Syn, CgA, and CD56 is used to confirm the neuroendocrine nature; CK7, Napsin A, and TTF-1 are utilized for identifying adenocarcinoma components; CK5/6 and p40 are employed for detecting squamous cell carcinoma components. The tumor proliferation index of the neuroendocrine component is assessed by calculating the percentage of Ki67-positive cells in the area with the strongest nuclear labeling. 14 According to these criteria, data from one patient meeting the CoLCNEC criteria were collected. This patient is a 65-year-old male who has never received chemotherapy before. The tumor is located in the upper lobe of the right lung, with an area of approximately 2.5 × 1.6 cm. Histological analysis revealed that the tumor predominantly comprises LCNEC, constituting approximately 60% of the composition. Additionally, there was a concurrent adenocarcinoma component, accounting for approximately 30% of all cases. Among the adenocarcinomas, the acinar type accounted for approximately 60%, whereas the wall-adherent growth type and papillary type each accounted for approximately 20%. Furthermore, the squamous cell carcinoma component constituted approximately 10%, displaying a moderate degree of differentiation, with a localized presence of in situ carcinoma components. The tumor cells densely populated the vicinity of the pleura, with intravascular tumor emboli identified, but there was no evidence of neural invasion. With respect to surgical margins, both bronchial and staple margins are negative. The immunohistochemistry results suggested that in the 202101948-A2 specimen, CK5/6 (squamous epithelium+) and P40 (squamous epithelium+) were positive. In the 202101948-B2 specimen, CK7 (glandular epithelium+), TTF-1 (+), NapsinA (glandular epithelium+), Syn (+), CgA (+), CD56 (+), P53 (+, approximately 20% positive), Ki-67 (+, approximately 50% positive), TOPIIa (+, approximately 40% positive), and β-tubulin-3 (+, approximately 50% positive) were positive, whereas CK5/6 (−), P40 (−), ALK (−), P63 (−), and CD117 (focal+) were negative. Written informed consent for participation in the study was obtained from all participants.
HE staining
The tissues were rinsed with PBS and then fixed with 4% paraformaldehyde. The tissues were subsequently soaked in 70%, 80%, 90%, 95%, and 100% ethanol for 1.5 h. The tissues were then embedded in melted paraffin wax for 3 h, cut into 2.5-μm thick sections, and heated in an oven at 55°C. The tissues were cleared, deparaffinized, and dehydrated. After clearing, dewaxing, and dehydrating, the sections were rinsed three times with double-distilled water and stained with hematoxylin (G1004, Servicebio, Wuhan, China) for 3 min. The sections were then stained with eosin (G1002, Servicebio). The sections were then dehydrated with 95% ethanol for 2 min and finally with absolute ethanol for 2 min. After xylene transparency for 5 min, the sections were sealed with neutral resin (10004160, Sinopharm Group, Beijing, China) and photographed with a Mshot MF53 microscope from Microshot Technology Co. (Guangzhou, China).
Spatial transcriptomics
Based on the method by Villacampa EG et al., 15 we selected one of the mainstream platforms in the field of ST, the Visium platform by 10 × Genomics, along with the formalin-fixed paraffin-embedded (FFPE) assay kit (Product ID: 1000336, Manufacturer: 10 × Genomics, Pleasanton, California, USA). The experimental protocol was as follows: first, FFPE slices were affixed onto a specialized capture area (capsule area), with each area measuring 6.5 × 6.5 mm2 and containing approximately 4992 gene expression spots on a glass slide. The slides were subsequently placed in an oven for 2 h at 60°C. Following dewaxing and rehydration, staining was performed via hematoxylin (Product ID: G1004, Servicebio) and eosin solution (Product ID: G1002, Servicebio). The tumor regions were manually annotated by experienced pathologists. Next, RNA extraction from each sample’s 10 slices of 10 µm FFPE sections was carried out with the Qiagen RNeasy FFPE Kit (Product ID: 73504, Manufacturer: Qiagen, headquartered in Hilden, Germany). A high-sensitivity RNA ScreenTape Kit (Product ID: 5067-5579, Agilent, Tokyo, Japan) at TapeStation (Model: 2200, Agilent) was used for DV200 assessment, ensuring that the DV200 value of the sample RNA exceeded 50%. Histological image acquisition was performed using a Leica Aperio AT2 (Leica Microsystems, Exton, PA, USA). cDNA synthesis was subsequently accomplished with the Visium Spatial Gene Expression Reagent Kit (Product ID: PN-1000189; Pleasanton, California, USA) following the manufacturer’s guidelines for library preparation (Product ID: CG000407; 10× Genomics; Visium User Guide). Finally, sequencing was conducted on the NovaSeq 6000 platform (Illumina, San Diego, California, USA), with an R1 effective length of 28 bp and an R2 effective length of 50 bp for the 10× FFPE sample library.
Spatial transcriptomic analysis
In this section, we employed FastQC software (http://www.bioinformatics.babraham.ac.uk/projects/fastqc/) to assess the data quality. The raw sequencing data were processed with Space Ranger (https://support.10xgenomics.com/spatial-gene-expression/software/downloads/latest) and compared to the human reference genome GRCh38. 16 Following the filtration and removal of PCR duplicate sequences, a gene count matrix was generated. The counts were subsequently normalized via the Seurat R program (version 4.0.0; Lucent Technologies Inc., Union, NJ, USA) with the SCTransform command, and visualization was carried out via SpatialFeaturePlot. After quality filtering, we obtained 3398 valid spots, with an average sequencing depth of approximately 11,670 unique molecular identifiers (UMIs) and approximately 5156 genes per individual spot. The sequencing data of the ST positions were subjected to dimensionality reduction through principal component analysis and the uniform manifold approximation and projection (UMAP) technique. Finally, visualization was conducted through SpatialFeaturePlot in Seurat (version 4.0.0; Lucent Technologies Inc.).
Differentially gene expression analysis and enrichment
In this section, the FindAllMarkers function from the Seurat package was used to conduct differentially expression analysis on genes within the identified clusters. The identification of Differentially Expressed Genes (DEGs) within each cluster was determined through the use of nonparametric Wilcoxon rank-sum tests, with a threshold set at p < 0.05 and log2FC > 1 or log2FC < −1. The ClusterProfiler package in R (version 4.0.0, Lucent Technologies Inc.) was subsequently used to perform enrichment analysis on DEGs between distinct clusters, considering p < 0.05 as statistically significant. 17 Finally, visualization of the analysis results was accomplished with the ggplot package in R (https://cran.r-project.org/web/packages/ggplot2/index.html). For gene set enrichment analysis, the GSEA v4.1.0 tool (http://www.gsea-msigdb.org/gsea/downloads.jsp) was used.
Immunohistochemistry (ICH)
We subjected the fixed cells to slide processing with 4% paraformaldehyde (DF0135; Leagene Biotechnology Co., Ltd., China) and sealed them at room temperature for 60 min with goat serum (C0265; Beyotime Institute of Biotechnology, China). Subsequently, anti-SMC1A (structural maintenance of chromosomes 1A) (1:200) (ab140493, ABclonal Technology, Shanghai, China) was incubated overnight at 4°C. Next, we washed the samples three times with PBS and then incubated them with goat antimouse IgG (H + L) HRP (1:500) (511103, ZEN-Biosicien, China) at room temperature for 1.5 h. After another three washes with PBS, we performed DAB (ZLI-9019, ZSGB-Bio, China) staining for 1 min under light-shielded conditions. Next, the slides were rinsed with tap water, stained with hematoxylin (G1002, Wuhan Sevier Biotechnology Co., Ltd., China) for 1 min, differentiated in 1% hydrochloric acid (C0163M, Beyotime Institute of Biotechnology) for 2 s, and finally washed with tap water for 10 min. Subsequently, the slides were dehydrated with 95% ethanol for 2 min, made transparent with xylene for 5 min, and then sealed with neutral resin (10004160, Pharmaceutical Group Co., Ltd., China). Finally, observation was conducted under an optical microscope (MF53, Guangzhou MSHOT Optoelectronic Technology, China), where the cell nuclei appeared blue and the positive regions presented a brownish-yellow color.
Cell culture and plasmid transfection
NCI-H661 (CL-0300, Pricella, Wuhan, China) and LTEP-a-2 (CL-0146, Pricella) cells were cultured using complete RPMI Medium 1640 (SP032020500, SPERIKON, Chengdu, China). NCI-H661 and LTEP-a-2 cells were seeded into culture dishes at a density of 5 × 10^6 cells/dish. After 24 h, the complete medium was replaced. Four 1.5 mL EP tubes were prepared, each containing 20 μg of plasmid (oe-SMC1A, oe-NC, sh-SMC1A, or sh-NC) dissolved in 980 μL of OPTI-MEM. The solutions were gently mixed and incubated at room temperature for 5 min. Additionally, four more 1.5 mL EP tubes were prepared, each containing 60 μL of transfection reagent Max dissolved in 940 μL of OPTI-MEM. These solutions were gently mixed and allowed to stand at room temperature for 5 min. After 5 min, the mixtures containing the transfection reagent were added to the corresponding tubes containing the plasmids, mixed gently, and incubated at room temperature for 15 min. The mixtures were then pipetted up and down three times with a 1 mL pipette tip and evenly added to the culture dishes. The dishes were gently shaken in a cross-pattern to ensure thorough mixing and incubated for 6 h before replacing the medium. After 48 h of further culture, the cells were collected.
Cell scratch assay
Using a marker pen and a ruler, horizontal lines were evenly drawn on the back of a 6-well plate, approximately 1 cm apart, crossing each well with three lines per well. Cells in the logarithmic growth phase were digested, centrifuged, and resuspended, and the density was adjusted to 5 × 10⁵ cells/well before seeding into the 6-well plate. The cells were cultured until reaching 90% confluence. A uniform scratch was made using a 10 μL pipette tip, followed by washing with PBS to remove detached cells. The medium was replaced with serum-free RPMI Medium 1640, and the cells were cultured for an additional 24 h. Observations and photographs were taken under a microscope, and the cell migration rate was calculated using ImageJ. Migration rate = (initial scratch area − final scratch area)/initial scratch area × 100%.
Trasnswell
Matrigel (356234, Corning, USA) was thawed and mixed with serum-free medium at a ratio of 5:1. A volume of 100 μL of the mixture was added to the upper chamber of a Transwell insert (3422, Corning, USA) and incubated at 37°C for 4–5 h until solidified. Cells were harvested, and their density was adjusted to 5 × 10⁵ cells/mL. A volume of 100 μL of the cell suspension was seeded into the upper chamber, while 500 μL of conditioned medium containing 20% FBS was added to the lower chamber. The setup was cultured at 37°C for 24 h. Afterward, the inserts were removed, and the culture medium in the wells was discarded. The inserts were washed with calcium-free PBS, fixed with 4% paraformaldehyde for 20 min, and then washed with PBS. Subsequently, the cells were stained with 0.1% crystal violet (G1062, Solarbio, Beijing, China) for 20 min. Nonmigrated cells on the upper layer were wiped off, and the migrated cells were counted under a microscope by taking random fields and calculating the average value.
Real-time Reverse Transcription-PCR (RT-qPCR)
RNA was extracted by isopropanol precipitation, 18 and first-strand cDNA was synthesized using Golddenstar™ RT6 cDNA Synthesis Kit Ver.2 (TSK30, QingKe, Beijing, China). Each component was mixed with 2 × T5 Fast q-PCR Mix (SYBR Green I) (TSE20, QingKe, Beijing, China) and then q-PCR reaction was performed on Bio-Rad IQ5. ΔCt (experimental group) = Ct (target gene in experimental group) − Ct (reference gene in experimental group), ΔCt (control group) = Ct (target gene in control group) − Ct (reference gene in control group), ΔΔCt = ΔCt (experimental group) − ΔCt (control group), Using 2−ΔΔCt to represent the fold change in expression of the target gene in the experimental group compared to the control group. The primers utilized for testing are listed in Table 1.
Primer and Sequence
Western blot
The cell samples were transferred into 1.5 mL centrifuge tubes and centrifuged at 3000 rpm for 5 min. The pellet was washed with PBS, followed by centrifugation again. RIPA lysis buffer (P0013B, Beyotime, Shanghai, China) was added, and the mixture was vortexed for 1 min, then allowed to stand on ice for 10 min. Finally, the samples were centrifuged at 13,000 rpm for 20 min at 4°C, and the supernatant was collected as the total protein. Total protein at 500 μg was mixed with 5× SDS loading buffer (8015011, Dakewei, Beijing, China) at 4:1. The protein was denatured by heating in a metal bath, and 60 μg samples were applied to SDS-PAGE gel for electrophoresis, followed by membrane transfer, which was then subjected to blocking, primary antibody, secondary antibody incubation, and color development. Finally, the blots were visualized utilizing a gel imaging system (34580, Thermo, Waltham, MA, USA), and finally developed using a nucleic acid protein gel imager (Universal Hood II, Bio-Rad, America). In Image Lab (Bio-Rad) software, the grayscale value of each band was read out.
Primary antibodies include anti-SMC1A (AP1145, Abclonal, Wuhan, China), anti-CDKN1A (A1483, Abclonal), anti-CDKN2B (A5685, Abclonal), and anti-GAPDH (A19056, Abclonal). Secondary antibodies included HRP-conjugated Goat anti-Rabbit IgG (H + L) (AS014, Abclonal).
Flow cytometry
Cell cycle detection was performed using a flow cytometry cell cycle kit (AC12L543, Life-iLab, Shanghai, China) as follows: The grouped and treated cells were collected and centrifuged at 2000 rpm for 5 min. The cells were washed twice with prechilled PBS, centrifuged at 2000 rpm for 5 min, and the supernatant was discarded. The cell pellet was resuspended in 1 mL of ice-cold 70% ethanol, mixed well, and fixed at 4°C for 2 h or longer. The fixed cells were washed twice with prechilled PBS, centrifuged at 1000 rpm for 5 min, and the supernatant was discarded. To each cell sample, 0.5 mL of propidium iodide staining solution was added, and the cell pellet was fully resuspended. The samples were incubated at 37°C in the dark for 30 min. A flow cytometer was used to detect red fluorescence at an excitation wavelength of 488 nm, while light scattering was simultaneously measured. Cells in the S phase were statistically analyzed.
Following the instructions of the Annexin V-FITC/PI Apoptosis Detection Kit (40302ES50, Yeasen, Shanghai, China), perform the following operations: Centrifuge to collect the cells, and wash them twice with precooled PBS to obtain a cell suspension containing 1 to 5 × 10⁵ cells. Discard the PBS and resuspend the cells in 100 μL of 1× binding buffer. Add 5 μL of Annexin V-FITC and 10 μL of PI staining solution, then gently mix them. Allow the mixture to react in the dark at room temperature for 10–15 min. Subsequently, add 400 μL of 1× binding buffer, mix well, and place the sample on ice. Conduct apoptosis detection using a flow cytometer (BeamCyte, Antpedia, Changzhou, China) within 1 h. Total apoptosis rate = late apoptosis rate + early apoptosis rate.
Statistical analysis
All analyses in this study were performed via R software (4.0.0, Lucent Technologies Inc.).
Results
Unsupervised clustering definition of the spatial distribution of expression in tumor tissues
We utilized complex LCNEC slices from the upper lobe of the right lung for HE staining, followed by subdivision of the tissue regions, as depicted in the figure. The red-circled area indicates cancer tissue, the green-circled area represents peri-cancerous tissue, and the purple-circled area denotes blood vessels (Fig. 1A). Space Ranger, which employs an imaging system, identified spots covered by tissue and obtained an expression matrix comprising 17,490 genes from 3398 spots. The violin plot illustrates the gene and UMI quantities within the Bin50 range captured by ST, with average values below 5000 and 10,000, respectively (Fig. 1B). By utilizing the UMI and gene counts for each spot, the results of t-Distributed Stochastic Neighbor Embedding (t-SNE) dimension reduction were shown (Fig. 1C and E), along with the mapping of the UMI and gene counts onto the spatial positions of the spots (Fig. 1D and F). Compared with nontumor regions, tumor tissue regions present a greater number of UMIs and genes. Unsupervised clustering was subsequently performed, successfully identifying four clusters (Fig. 2A), revealing a uniform distribution of unique transcripts. Mapping the clusters onto the slices, we observed distinct spatial separation between points belonging to specific aggregated areas (Fig. 2B). Cancer cells include neurons, epithelial cells, and B cells. To further characterize the identified clusters, we conducted differentially gene expression analysis and generated a heatmap illustrating the expression values of the top 10 variable genes in each gene cluster (Fig. 2C). In the heatmap, yellow represents high expression, whereas purple represents low expression. In cancer cells, STMN2, CACNA1A, IGFBP5, STMN1, CDH2, ENC1, GRP, CKB, SEC11C, and SOX4 are highly expressed.
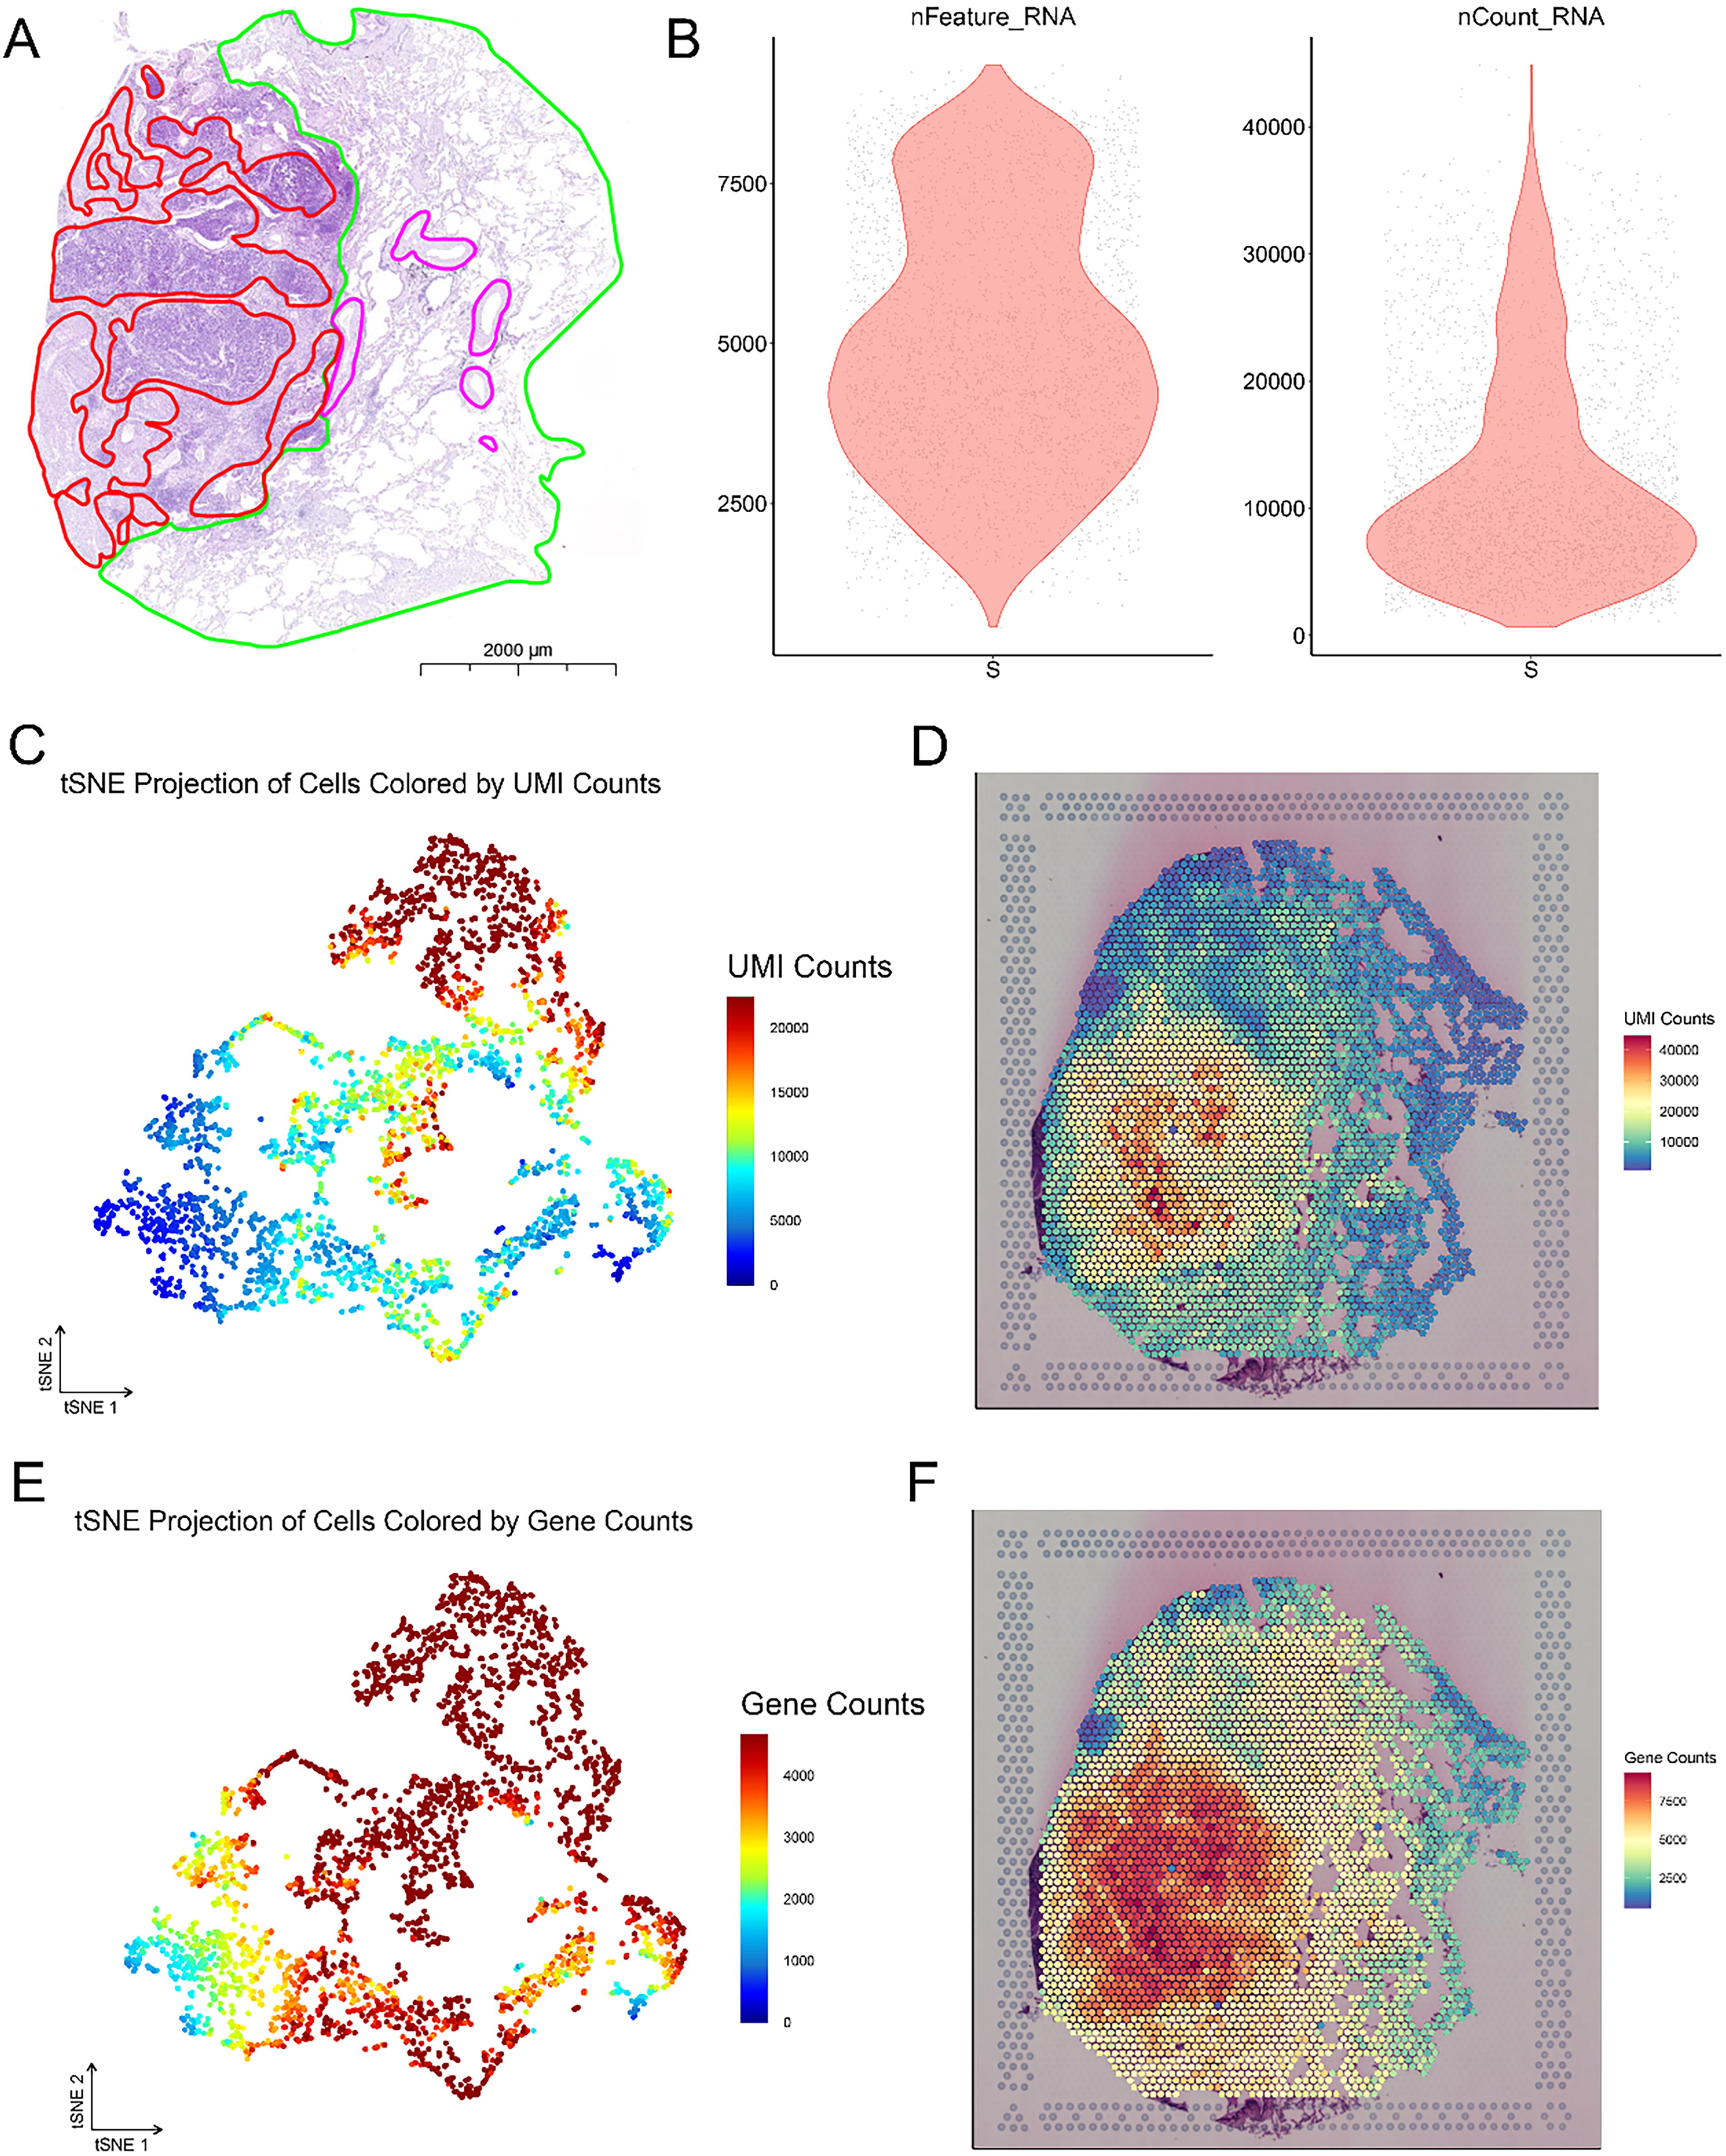
Space Ranger counting of spots based on gene expression levels.
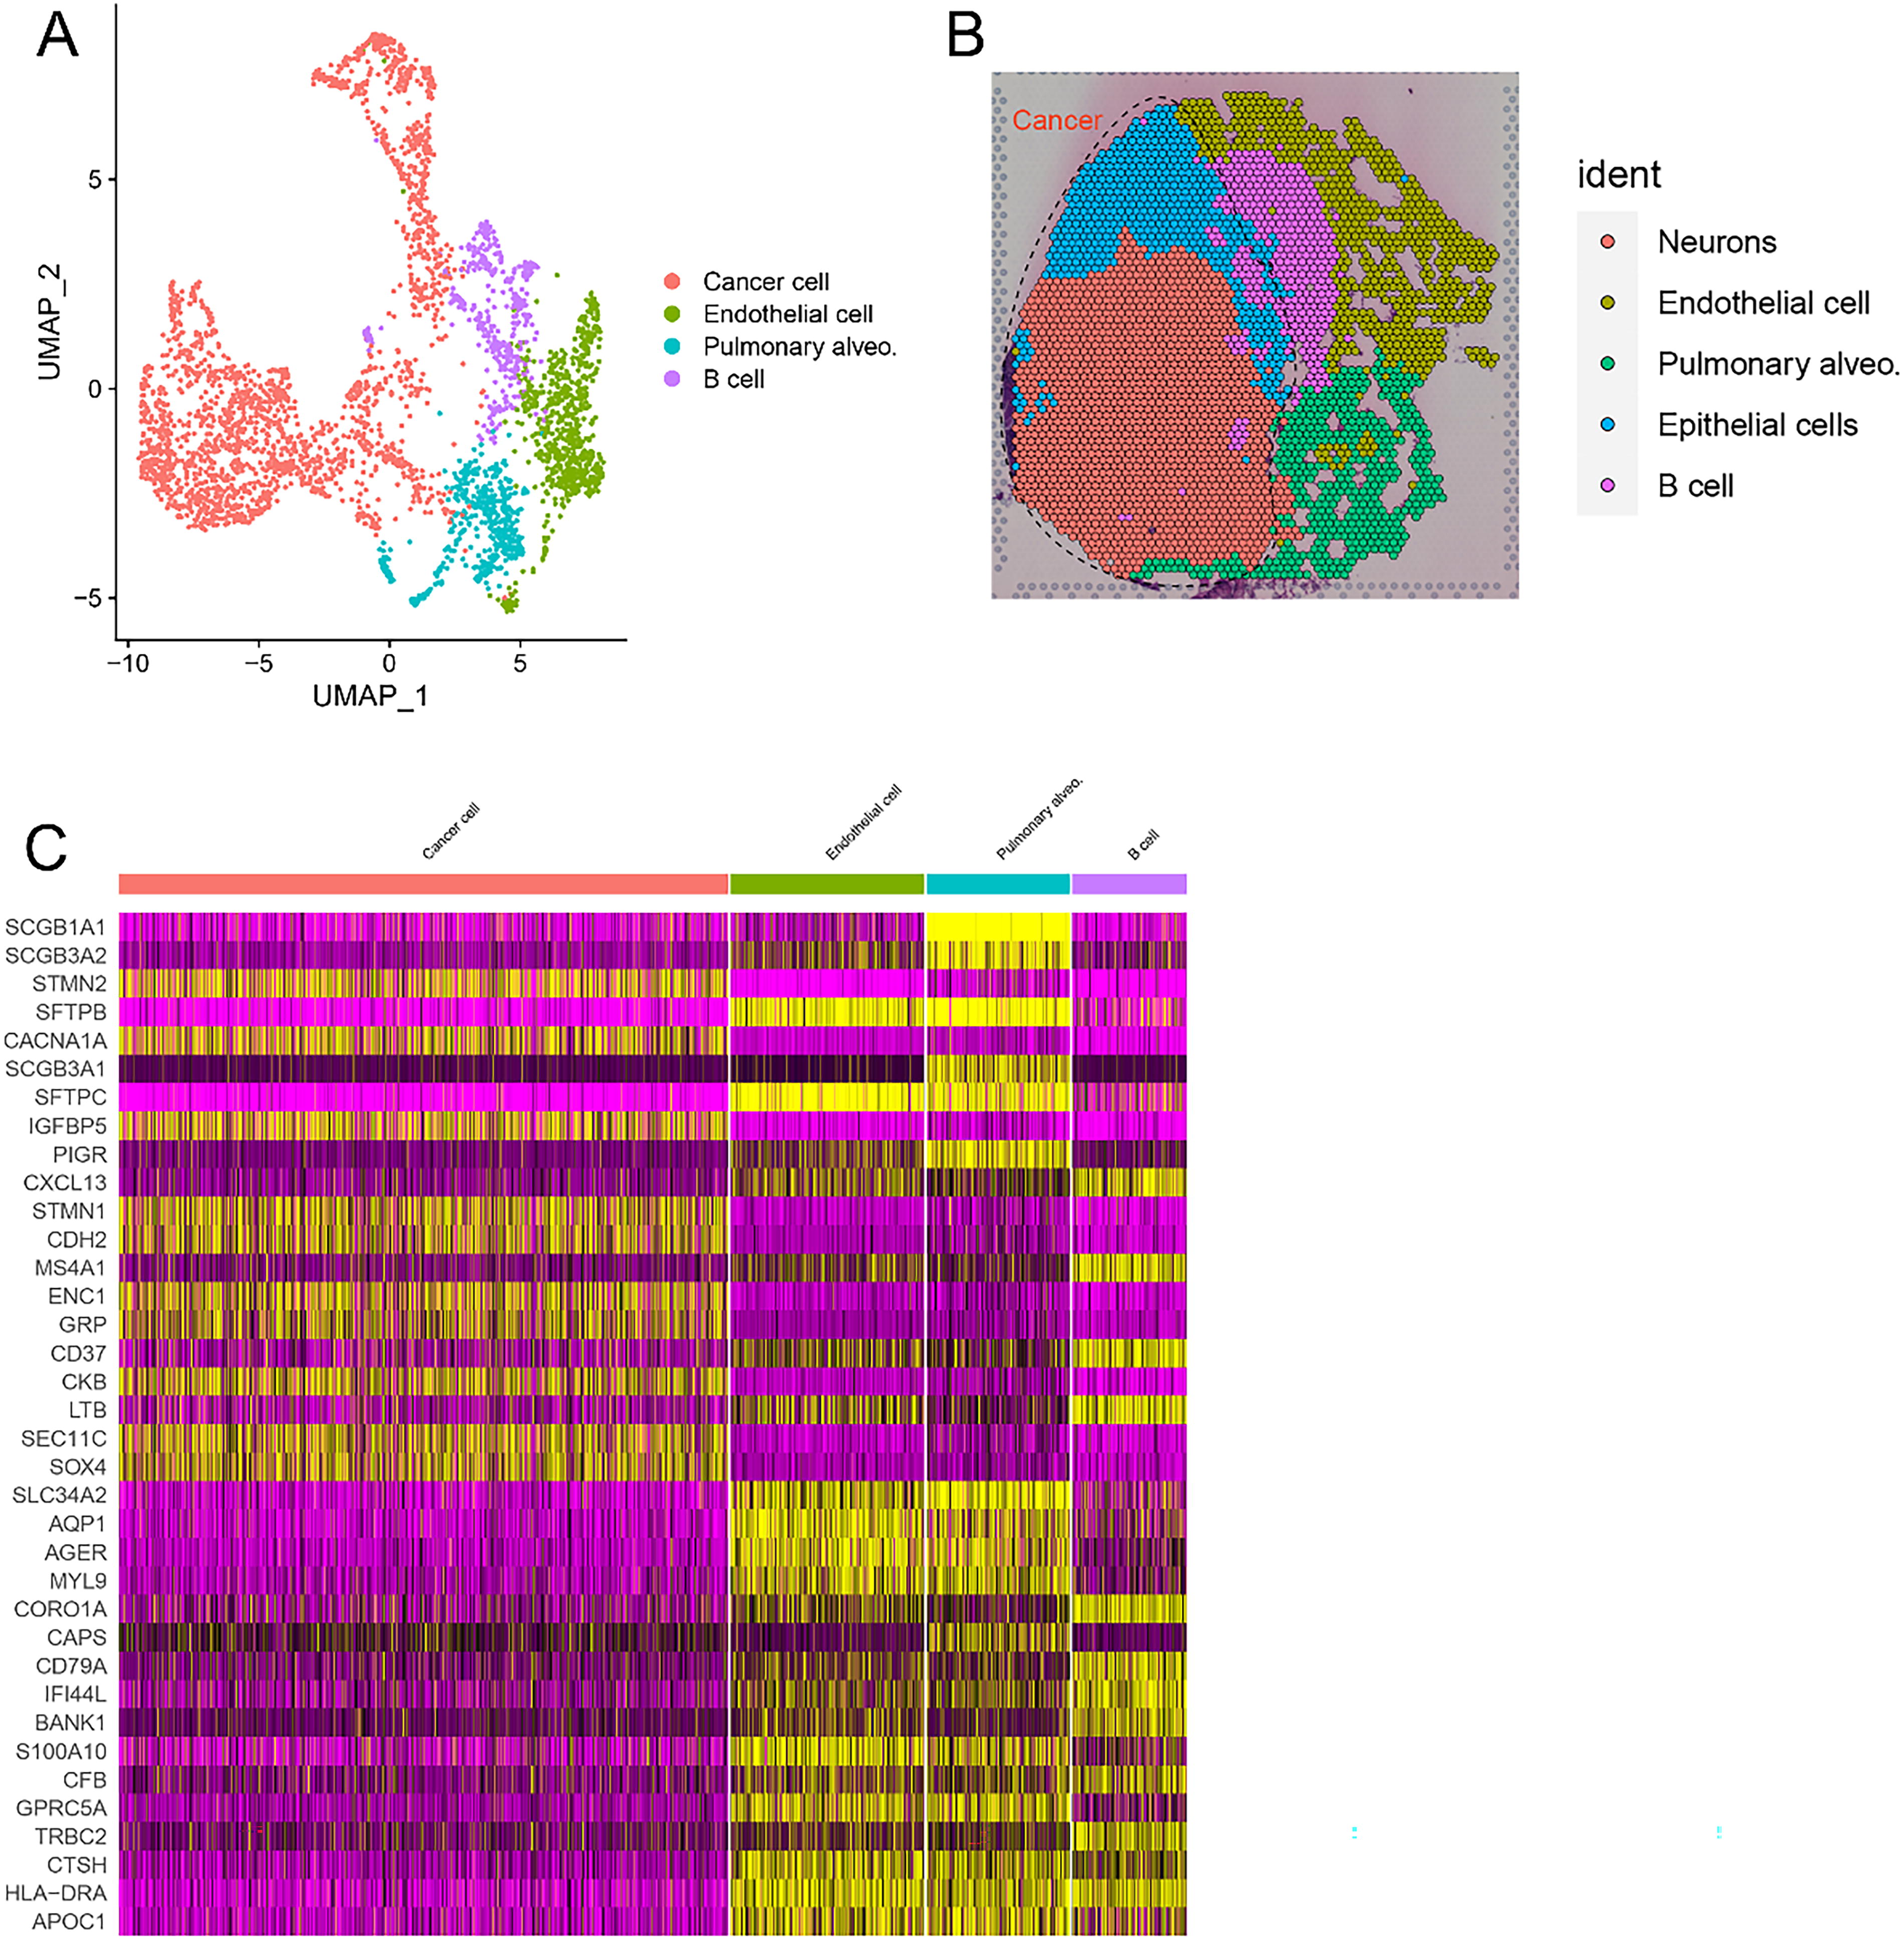
Unsupervised clustering.
Analyses of differentially gene expression in different regions
We conducted unsupervised clustering to identify distinct clusters in both the tumor and nontumor regions, mapping them onto slices (Fig. 3A–D). Our findings illustrated that cancerous tissue regions encompass three cell subtypes—B cells, epithelial cells, and neurons (Fig. 3A and B). In contrast, noncancerous tissue comprises three cell subtypes, including B cells, pulmonary alveolar cells, and endothelial cells (Fig. 3C and D). Differentially gene expression analyses were carried out for tumor and nontumor regions. The Gene Ontology (GO) enrichment results revealed significant enrichment of genes associated with BPs, such as chromosome segregation, nuclear division, and mitotic nuclear division, as well as other related processes (Fig. 3E). In terms of cellular component (CC), enrichment was observed in chromosomal regions and spindles. Molecular function (MF) analysis revealed enrichment in tubulin binding, microtubule binding, histone binding, etc. (Fig. 3E). Kyoto Encyclopedia of Genes and Genomes (KEGG) enrichment analysis revealed obvious enrichment of DEGs in pathways related to the cell cycle, DNA replication, nucleocytoplasmic transport, and mismatch repair (Fig. 3F). GSEA of hallmark gene sets revealed upregulation in pathways such as E2f targets, G2m checkpoint, pancreas β cells, UV response Dn, mitotic spindle, and estrogen response late (Fig. 3G).
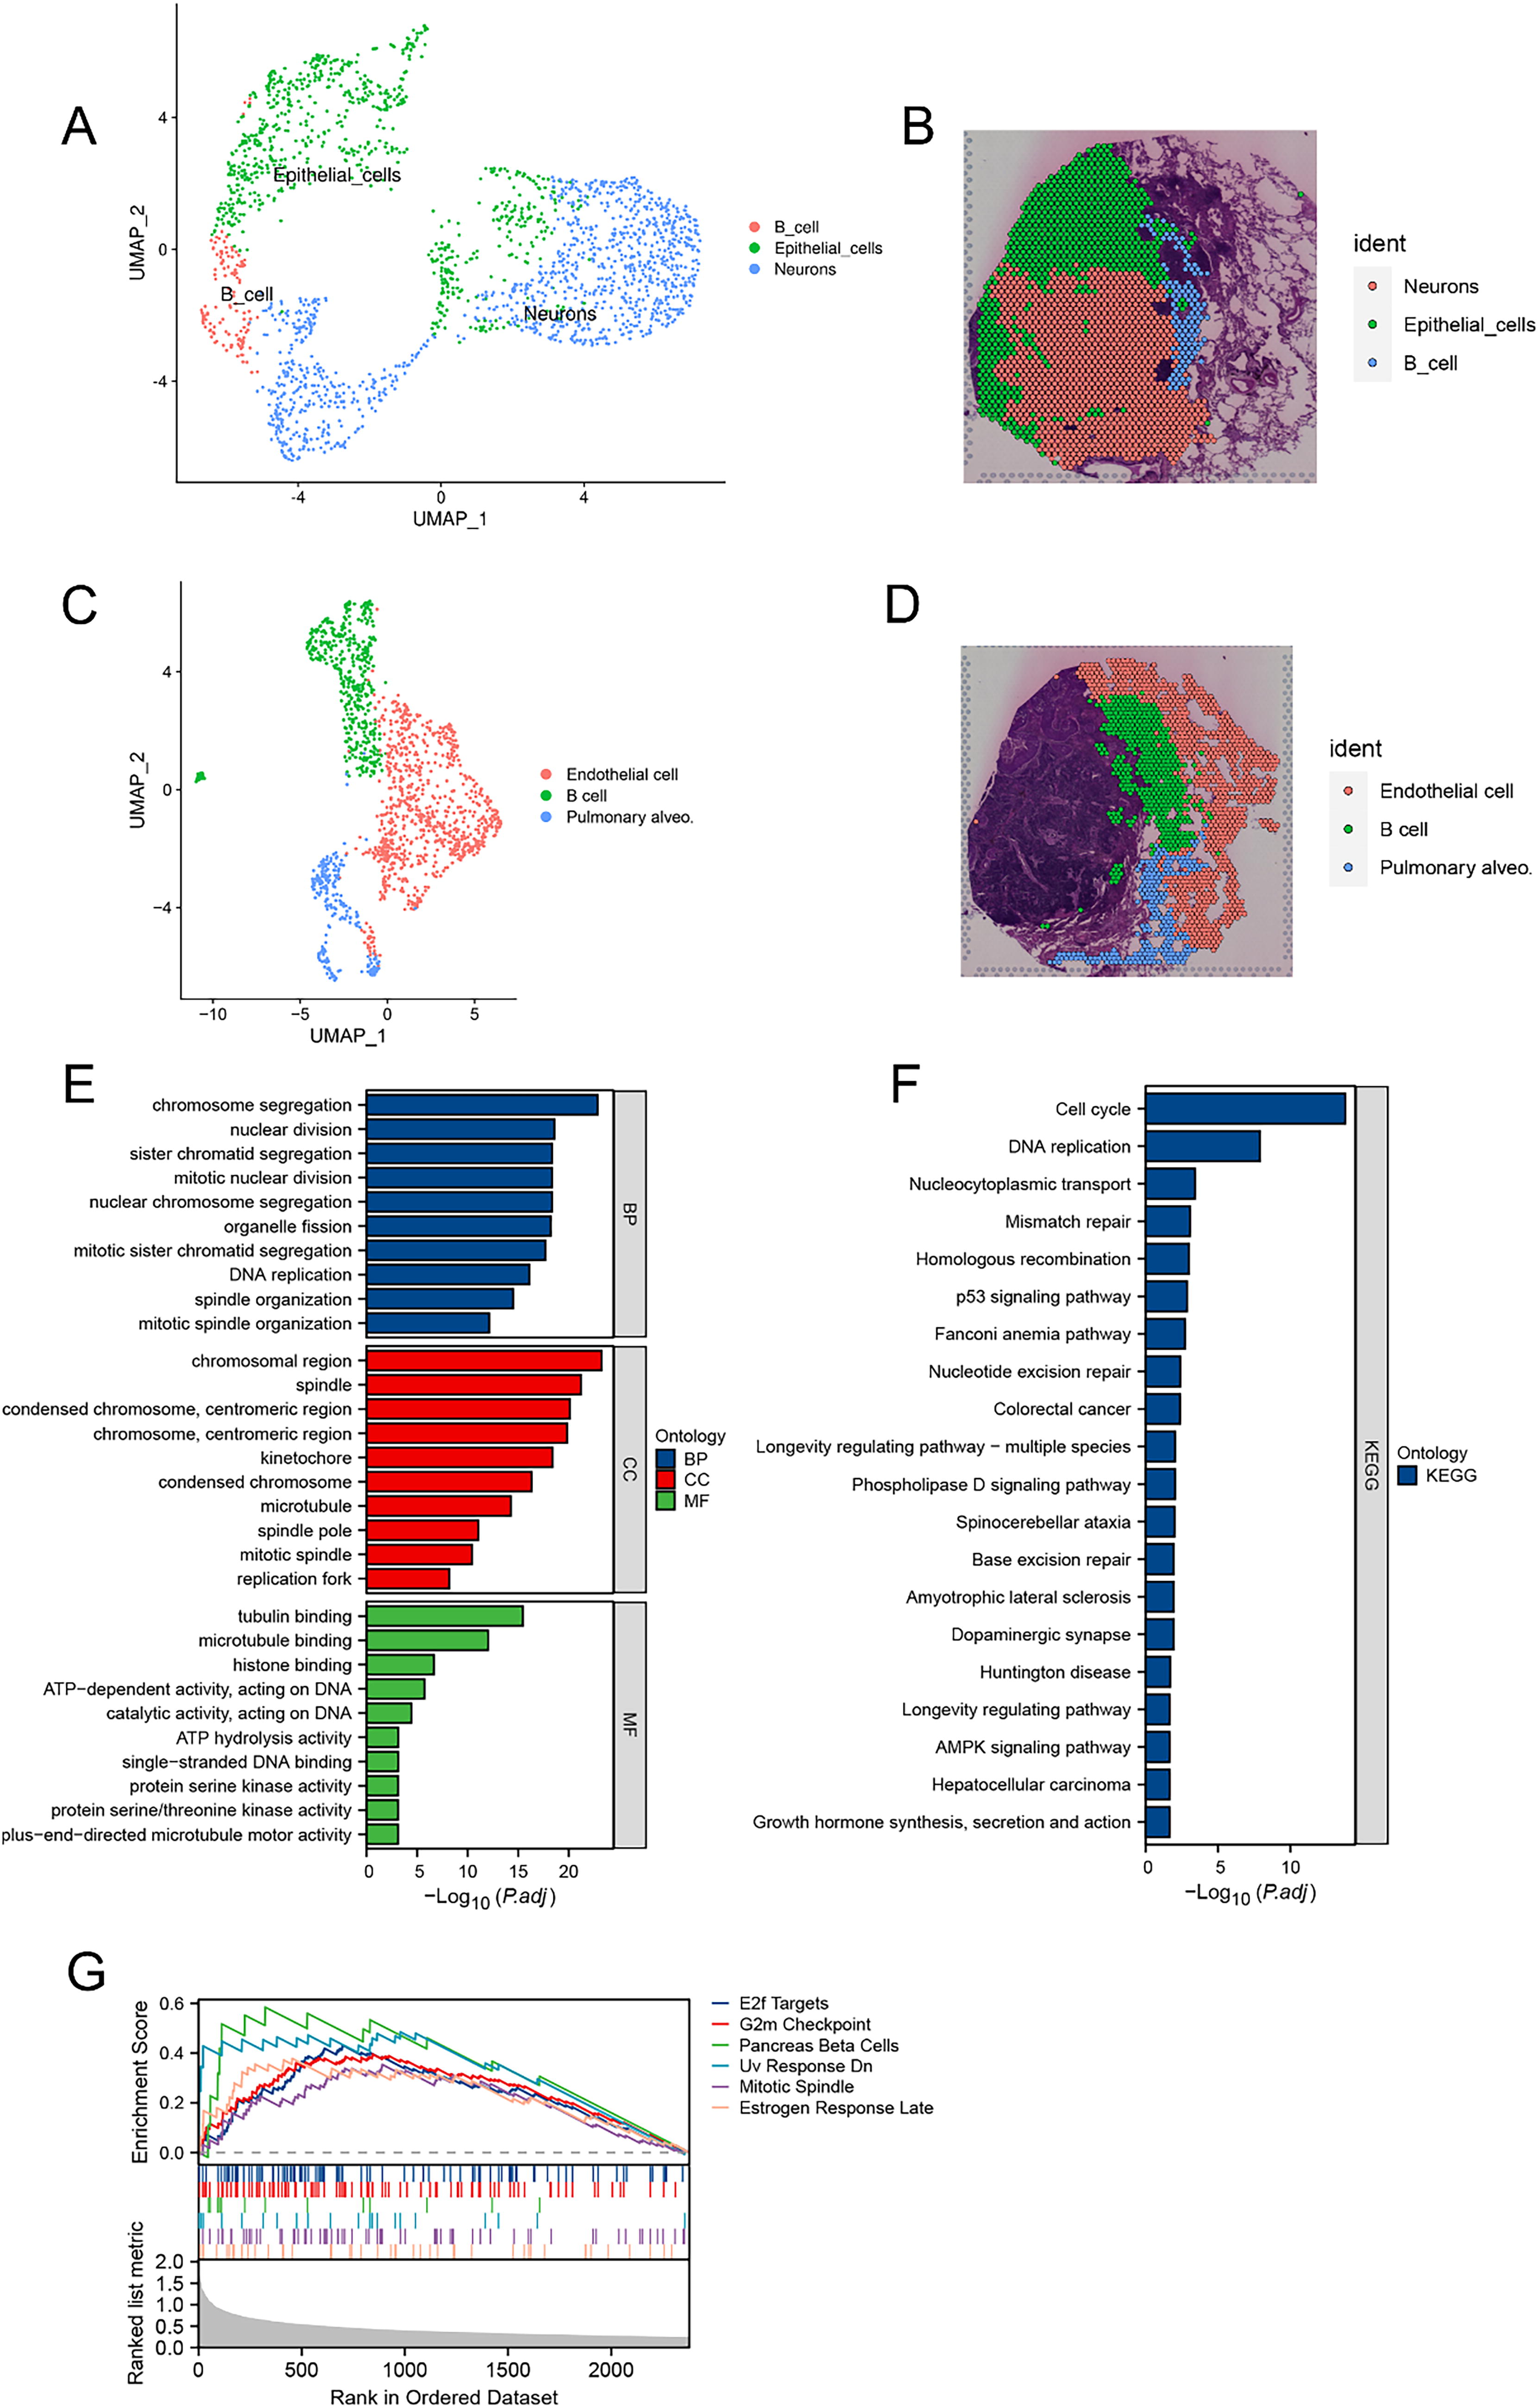
Unsupervised clustering and gene function enrichment analysis of tumor and nontumor regions.
Analyses of differentially gene expression in different cell subpopulations
Differential analysis of B cells inside and outside tumors involves comparisons of the gene expression of B cells in tumor and nontumor regions. We identified 44 genes whose expression significantly differed between the two groups (p < 0.05, log2FC > 1 or log2FC < −1), including 20 upregulated and 24 downregulated genes. Our GO enrichment results indicated that the upregulated genes are associated primarily with processes such as B-cell activation, B-cell receptor signaling, and the immune response. The enriched CCs included locations such as the outer side of the cell membrane, membrane microdomains, and membrane rafts. MF enrichment was observed in areas such as immunoglobulin binding (Fig. 4A). In addition, KEGG enrichment revealed that these DEGs were significantly enriched in pathways related to B-cell receptor signaling, the hematopoietic cell lineage, and primary immunodeficiency (Fig. 4B).
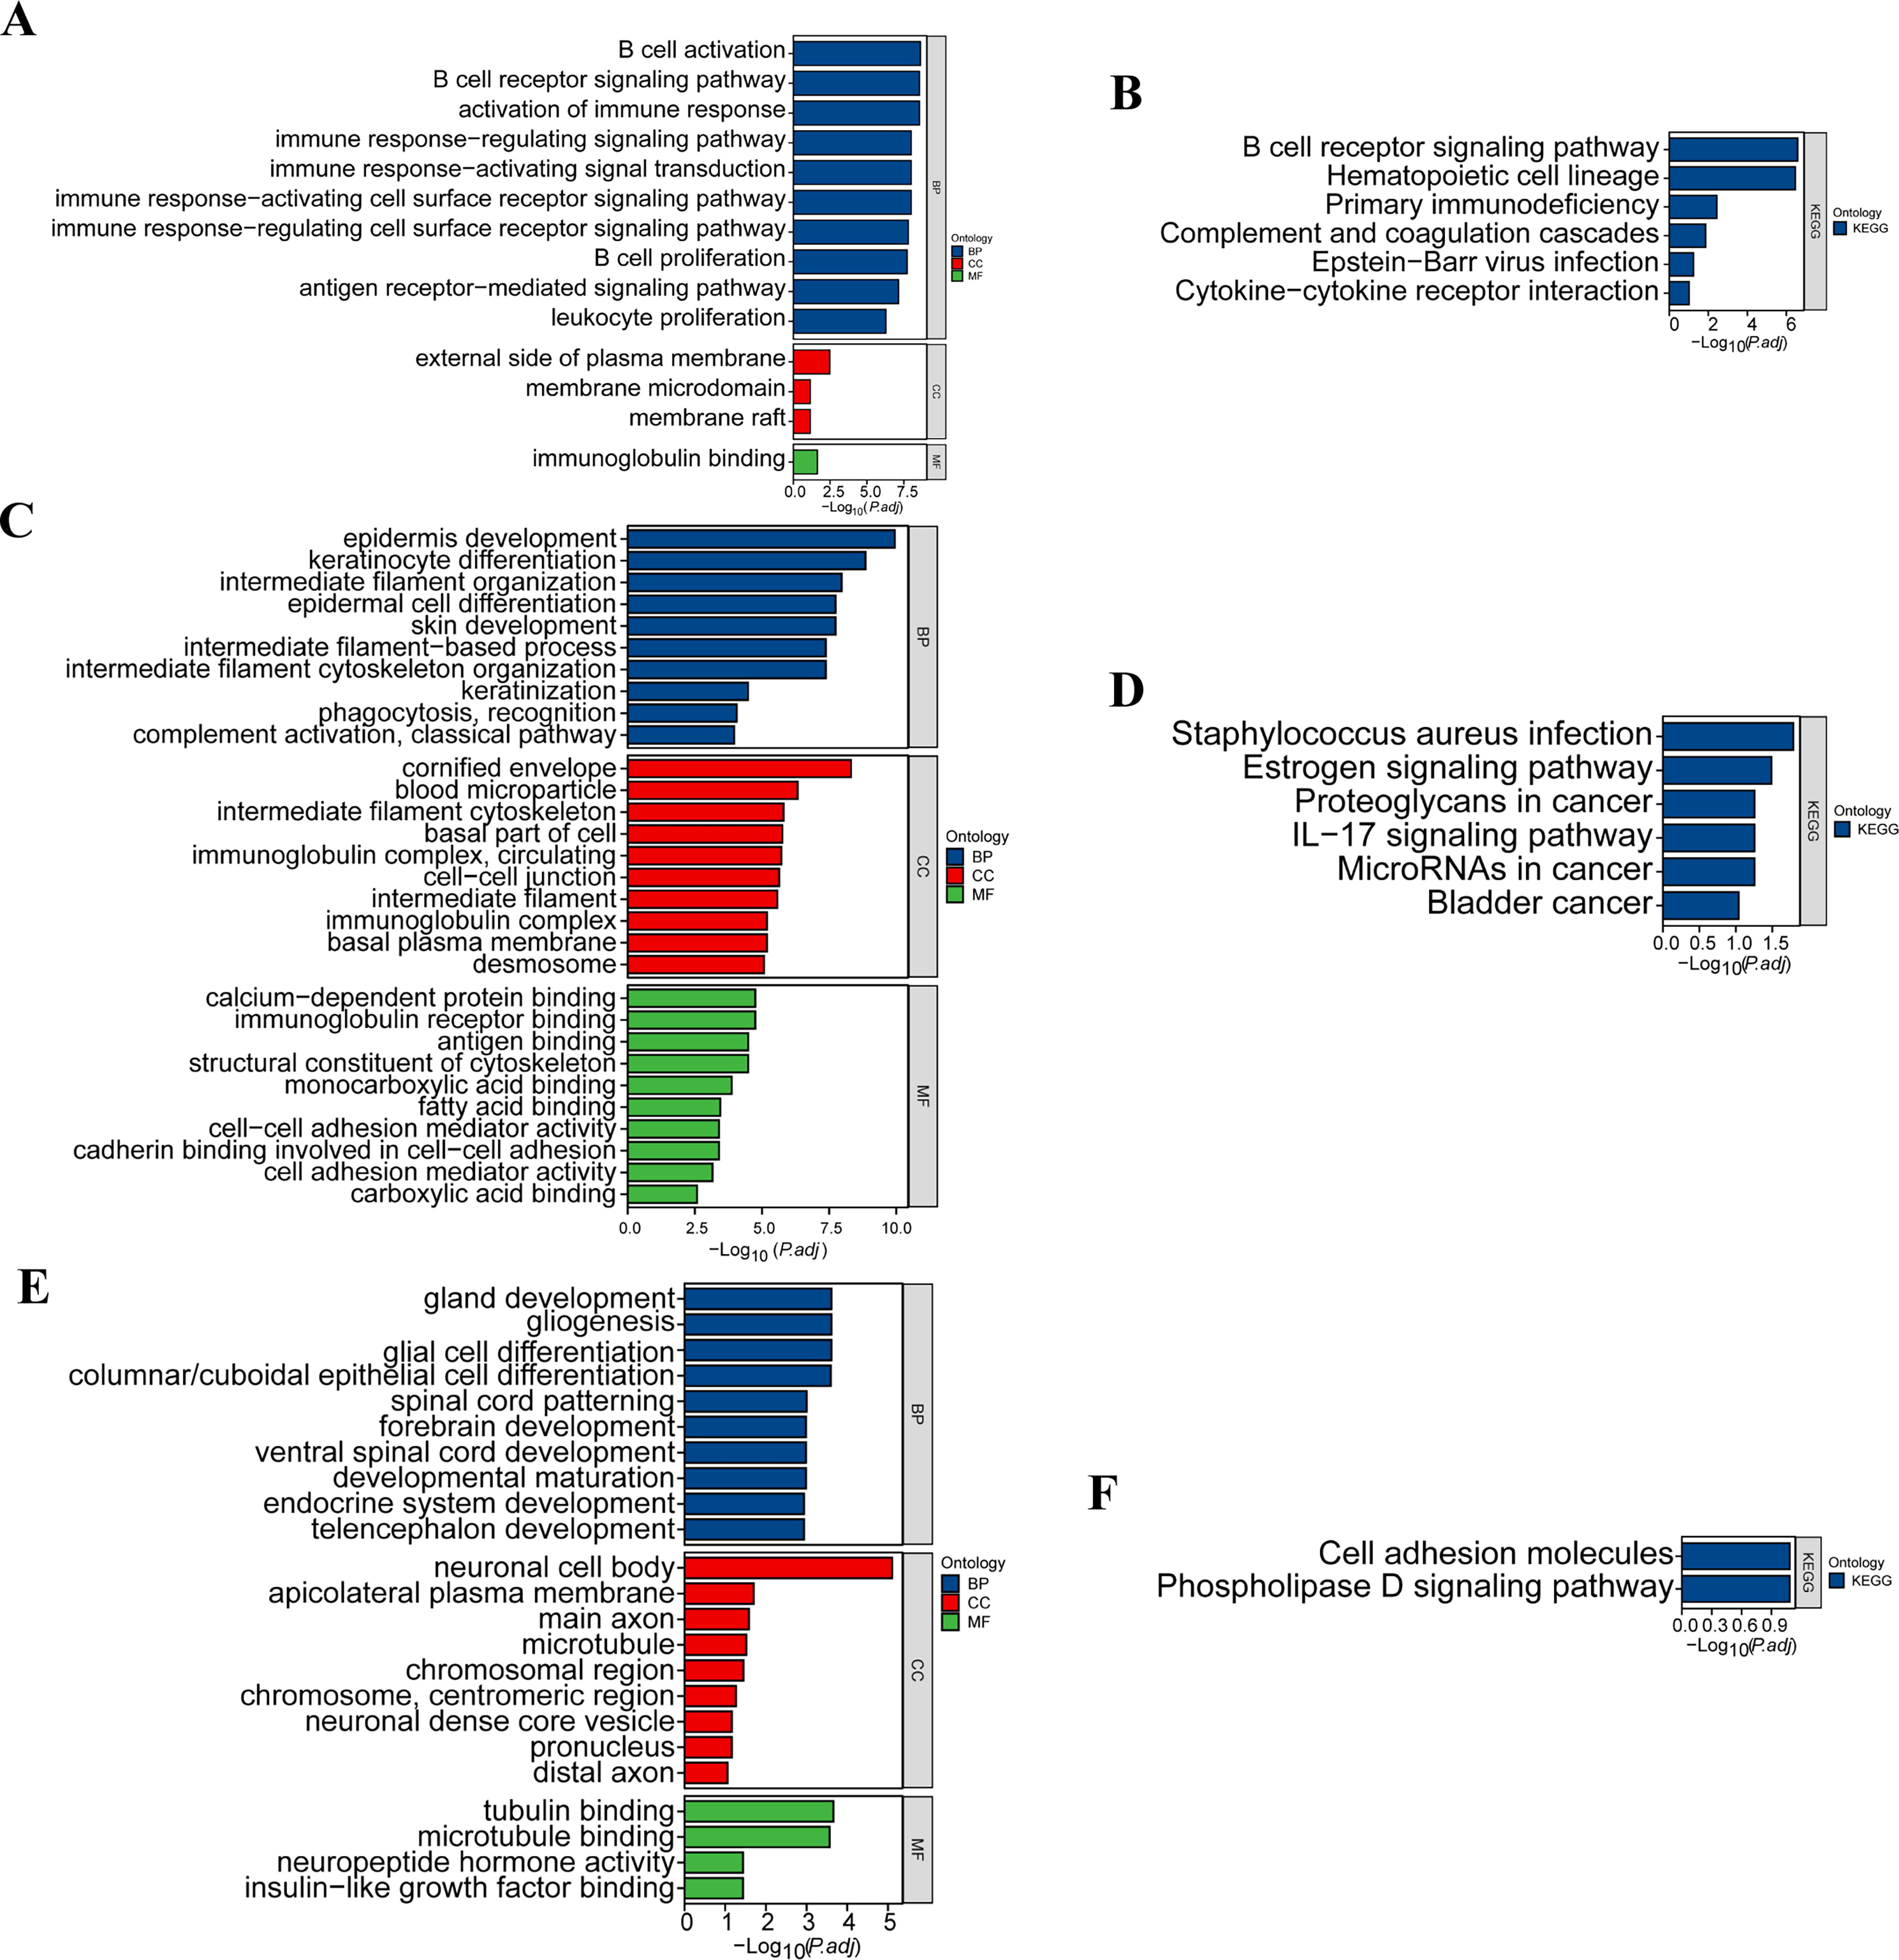
Differentially gene expression analysis between different cell clusters.
Our analysis of differences between the subgroups of epithelial cells and alveolar epithelial cells involved comparing the gene expression of epithelial cells in tumor regions with that in nontumor regions. We identified 139 DEGs, including 58 upregulated and 81 downregulated genes. The results of GO enrichment indicate that upregulated DEGs are significantly enriched in biological process (BP) terms such as epidermis development, keratinocyte differentiation, and intermediate filament organization. The CCs were enriched in terms such as the cornified envelope, blood microparticles, and intermediate filament cytoskeleton. The MF category was enriched in terms such as calcium-dependent protein binding, immunoglobulin receptor binding, and antigen binding (Fig. 4C). With respect to KEGG enrichment, the results revealed that the DEGs were significantly enriched in pathways such as Staphylococcus aureus infection, the estrogen signaling pathway, and proteoglycans in cancer (Fig. 4D).
Additionally, a comparison of gene expression between neuroendocrine cells in the tumor region and alveolar epithelial cells in nontumor regions identified 269 DEGs. Among these genes, 119 were upregulated, and 150 were downregulated. The results of GO enrichment indicate that the upregulated DEGs are significantly enriched in BP terms such as gland development, gliogenesis, and glial cell differentiation. The CC category was enriched in terms such as the neuronal cell body, the apicolateral plasma membrane, and the main axon. MF terms were enriched in the term tubulin binding (Fig. 4E). The results of the KEGG enrichment analysis revealed that the DEGs were significantly enriched in pathways such as the cell adhesion molecules and phospholipase D signaling pathways (Fig. 4F).
Candidate gene expression of SMC1A in tumor and nontumor regions
Differentially expressed genes amid tumor and nontumor regions are predominantly enriched in the cell cycle signaling pathway. Through a literature review, we identified a representative gene, SMC1A, associated with mitosis via the cell cycle signaling pathway. SMC1A was mapped onto tissue slices, revealing heightened expression in the tumor region (Fig. 5A). The immunohistochemistry results revealed significantly greater expression of SMC1A in the tumor region than in the nontumor region (Fig. 5B and C).
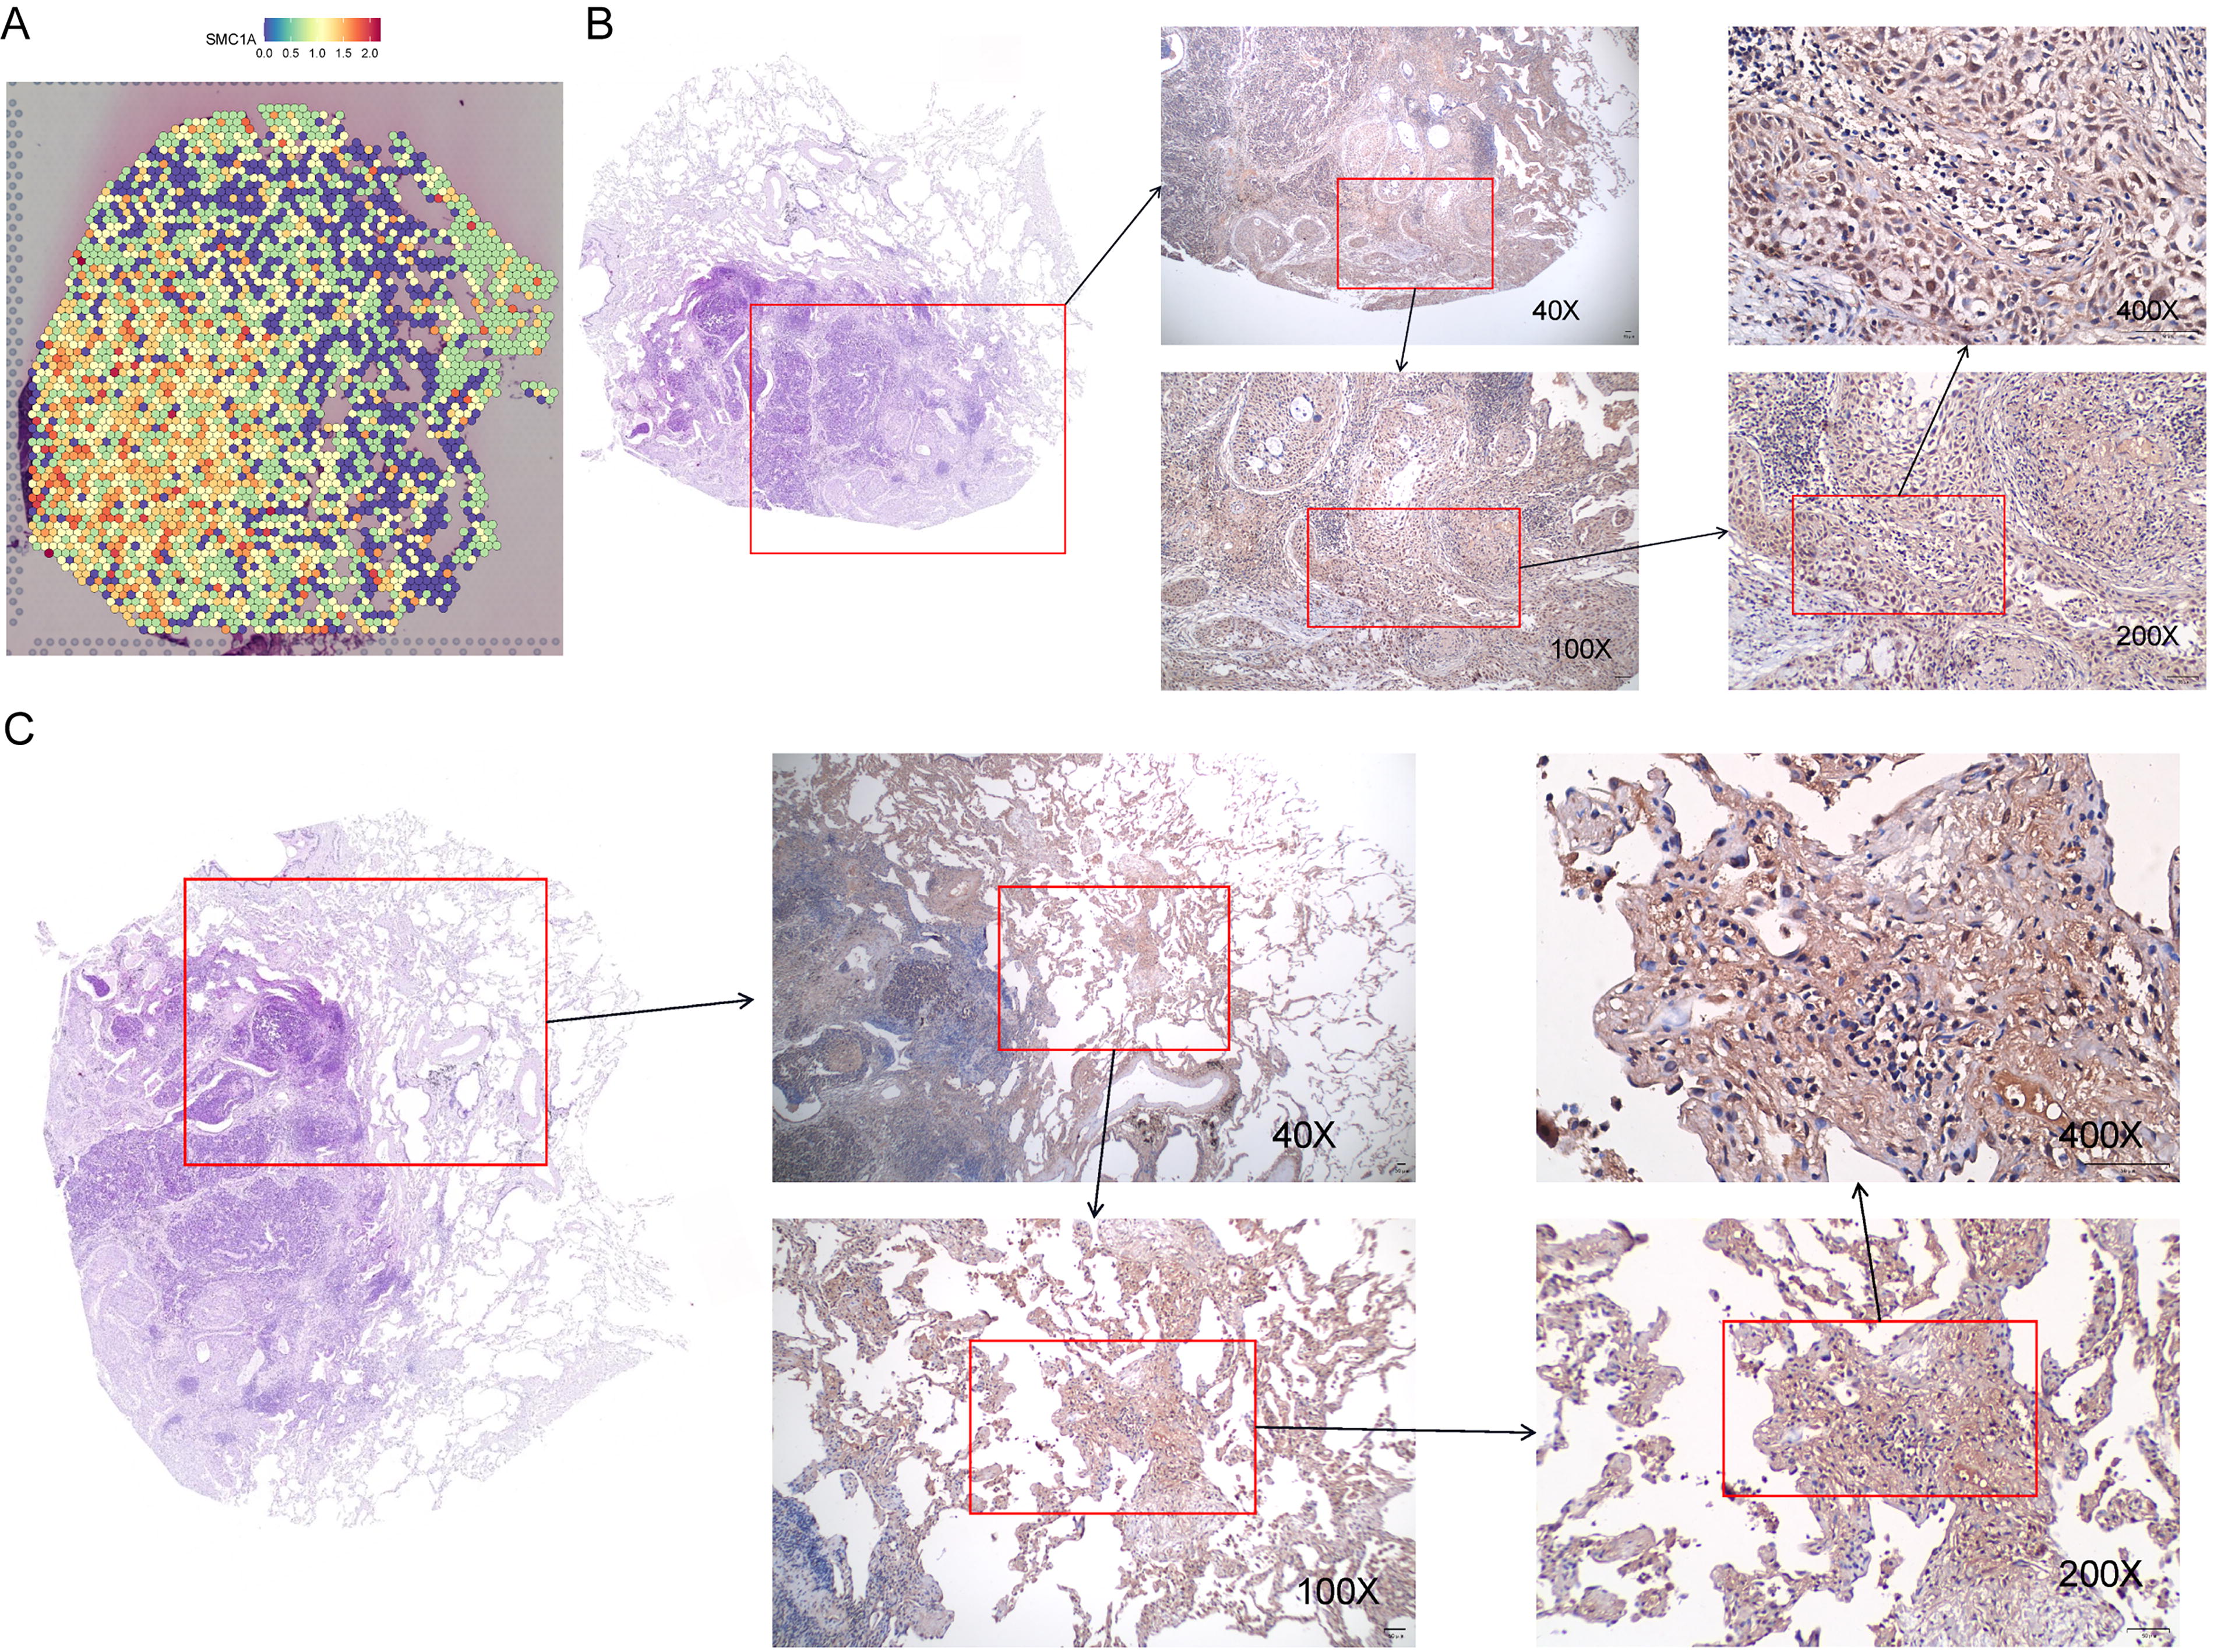
Expression of SMC1A in tumor and nontumor areas.
Promoting effect of SMC1A on invasion and migration of lung cancer cells
To further investigate the role of SMC1A in lung cancer, we overexpressed and silenced SMC1A in NCI-H661 and LTEP-a-2 cells. Cell scratch assay and Transwell experiments demonstrated that, compared with the NC group, overexpression of SMC1A significantly increased the 24-h migration rate of NCI-H661 and LTEP-a-2 cells, as well as the number of invasive cells. Conversely, sh-SMC1A remarkably reduced the migration and invasion capabilities of lung cancer cells (Figs. 6A–D and 7A–D). CDKN1A and CDKN2B inhibit the transition from G1 to S phase in the cell cycle, 19 q-PCR and Western blot results showed that silencing SMC1A significantly increased the expression of CDKN1A and CDKN2B in NCI-H661 and LTEP-a-2 cells (Figs. 6E, F and 7E, F). Further flow cytometry analysis of the proportion of cells in the S phase corresponded with the q-PCR and Western blot results, showing that silencing SMC1A noticeably decreased the proportion of lung cancer cells in the S phase (Figs. 6G and 7G). Additionally, compared with the oe-NC group, oe-SMC1A notably reduced apoptosis in lung cancer cells, consistent with the observation of high SMC1A expression in tumor tissues. In contrast, silencing SMC1A significantly increased the apoptosis rate of NCI-H661 and LTEP-a-2 cells (Figs. 6H and 7H). These results indicated that SMC1A had important effects on migration, invasion, G1/S transition, and apoptosis of NCI-H661 and LTEP-a-2 cells.
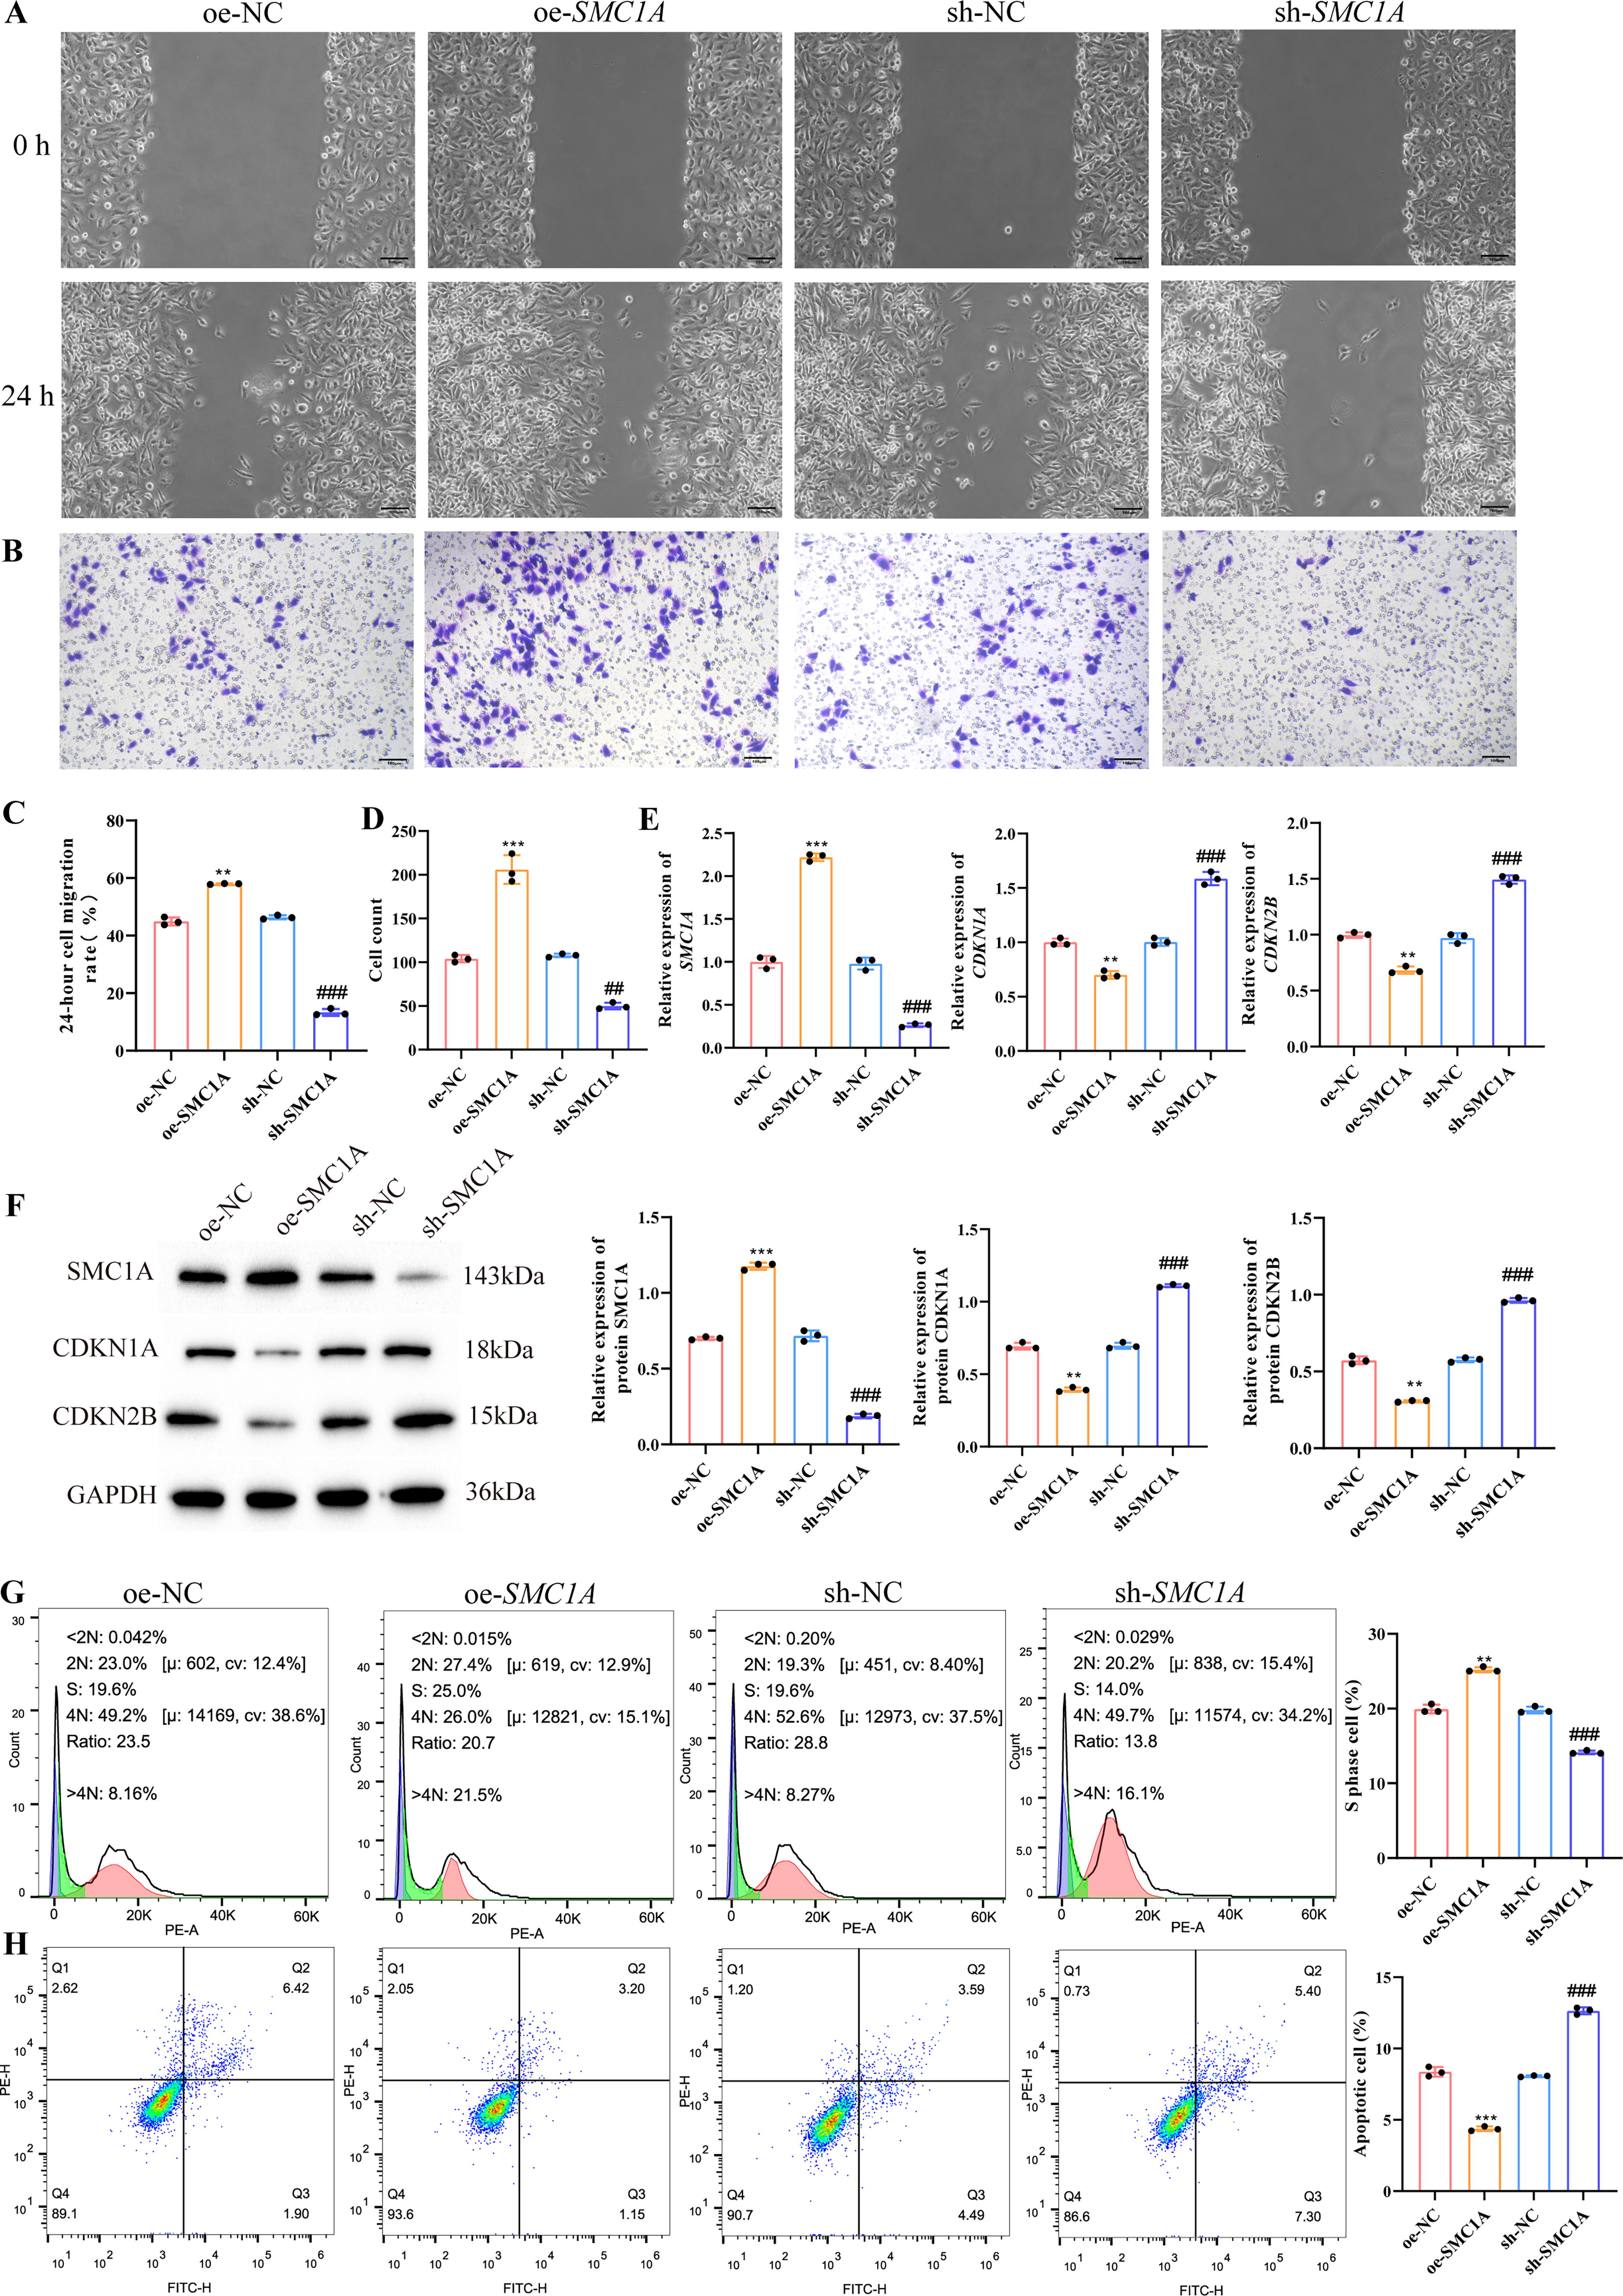
Promoting effect of SMC1A on invasion and migration of NCI-H661 cells.
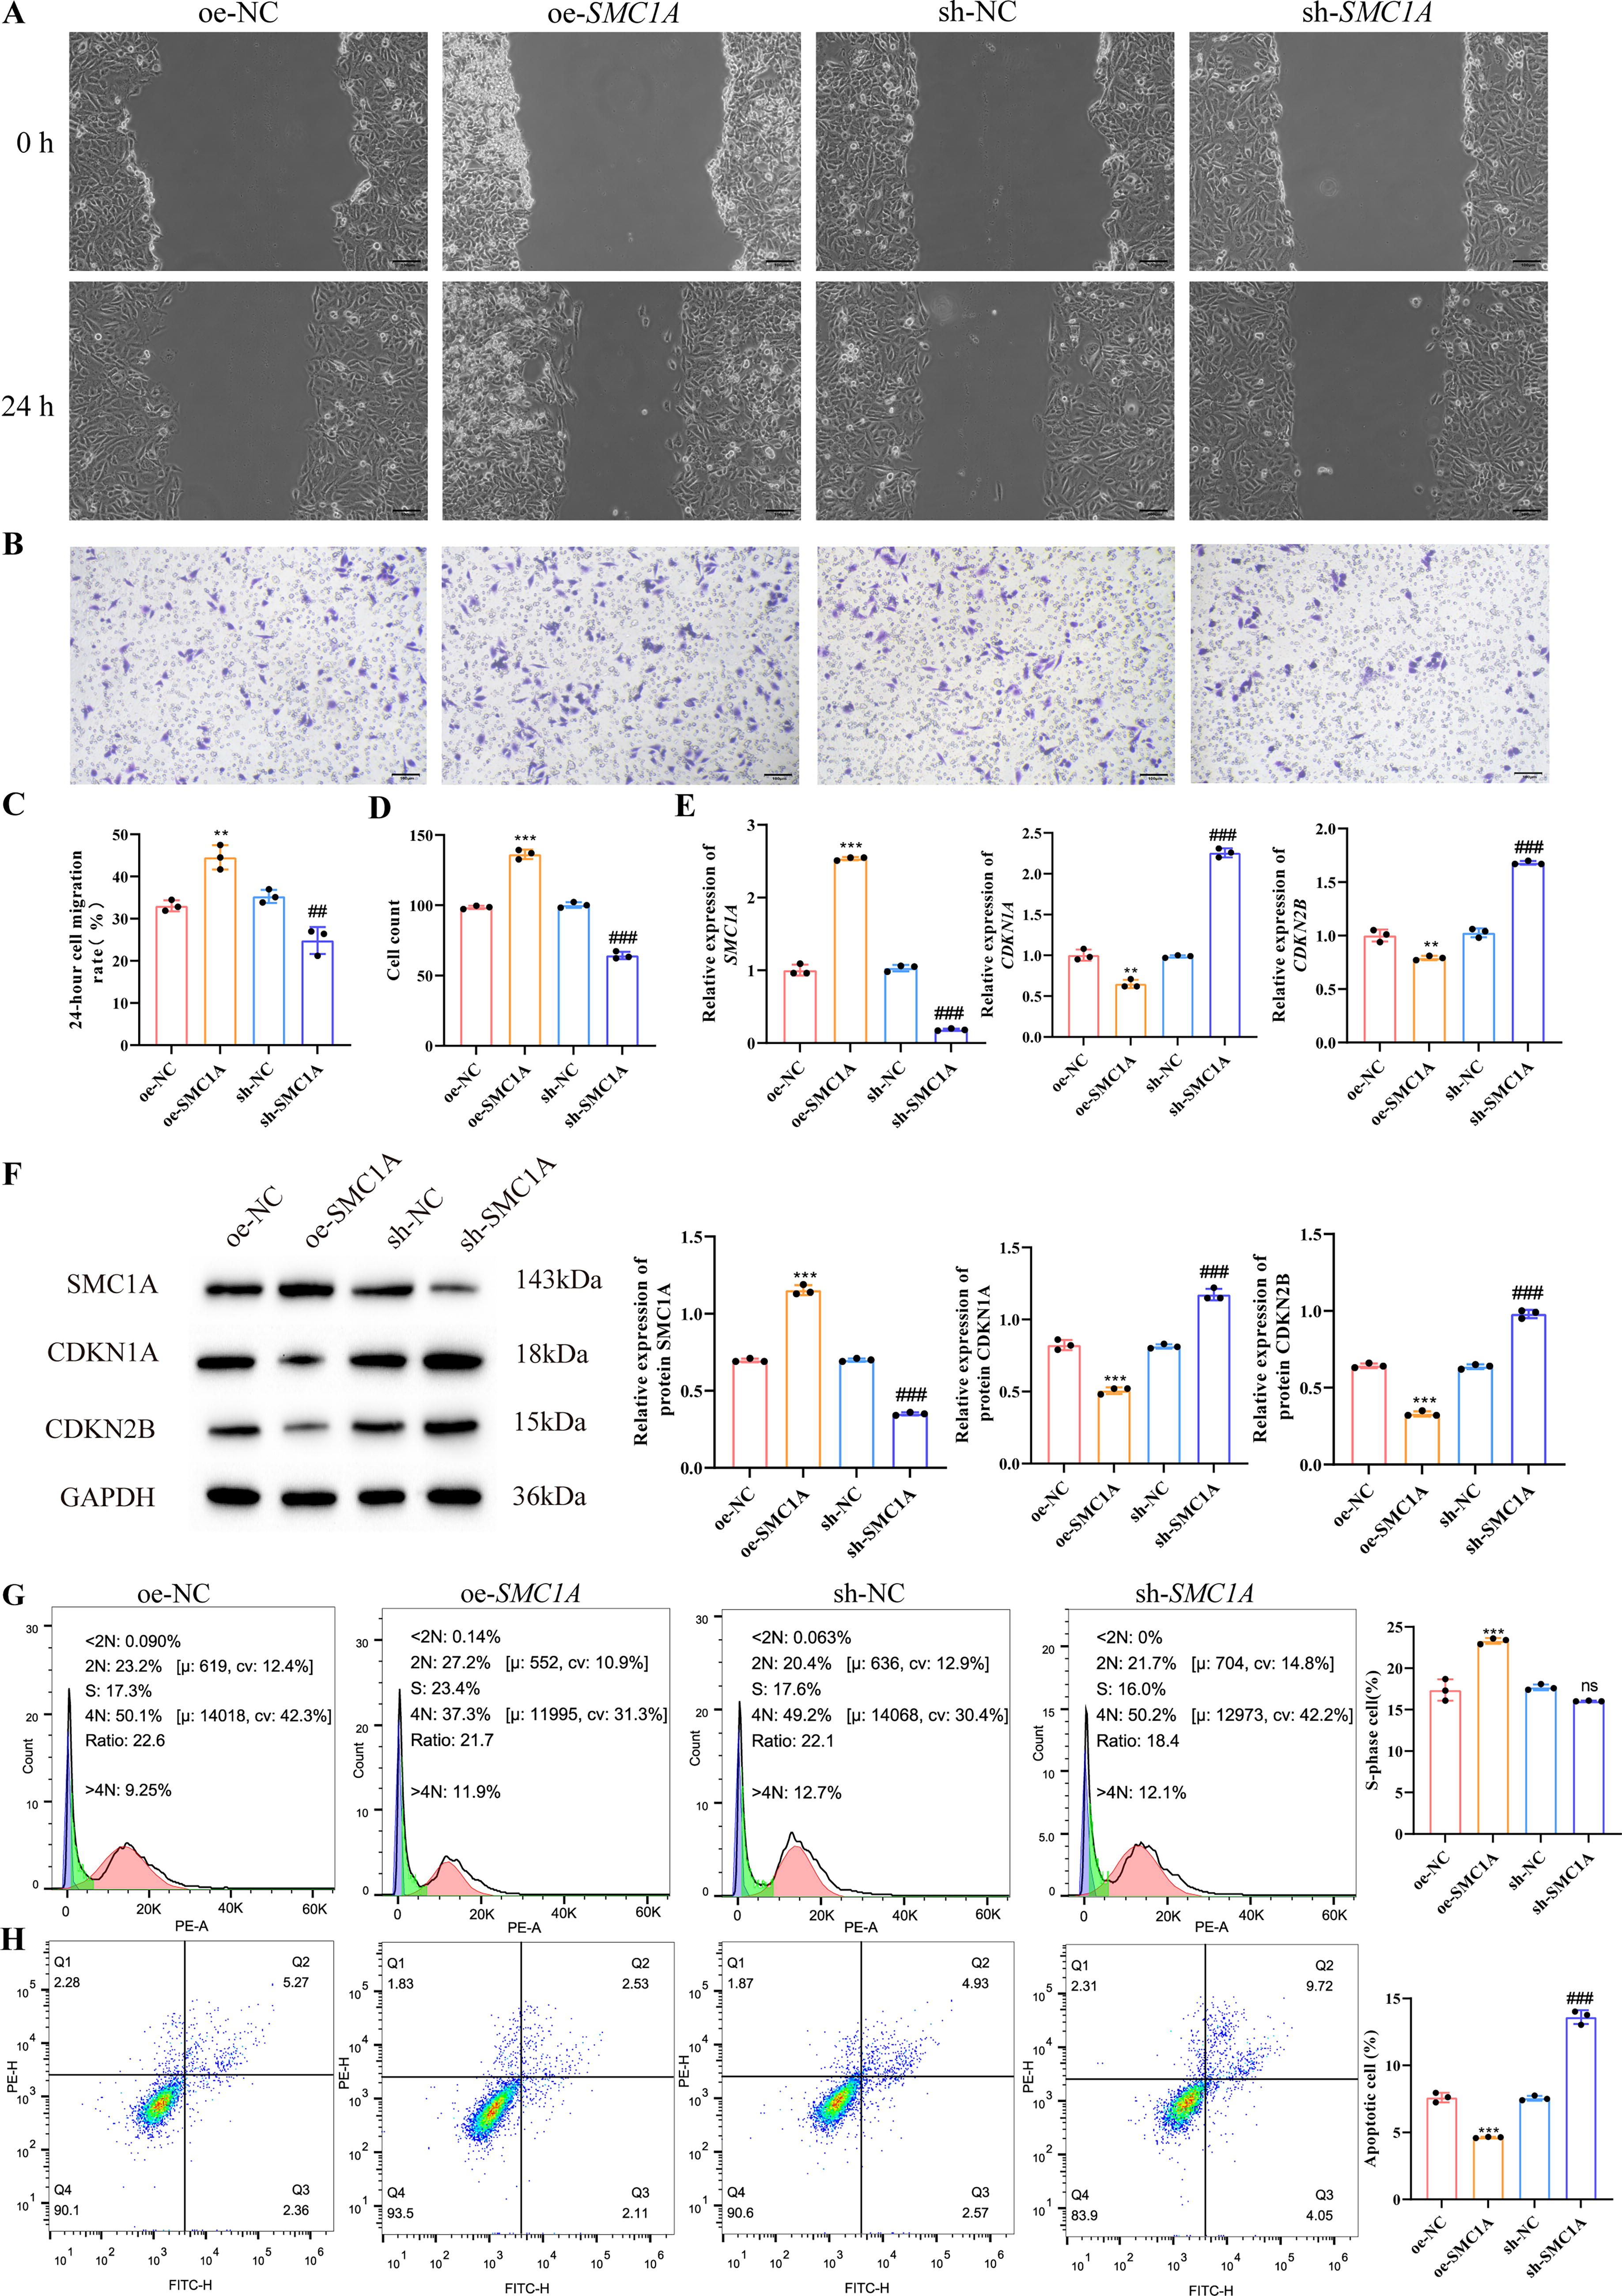
Promoting effect of SMC1A on invasion and migration of LTEP-a-2 cells.
Discussion
LCNEC, a pulmonary neuroendocrine tumor, shows morphological and differentiation features of neuroendocrine origin, along with frequent mitosis and characteristics associated with NSCLC. CoLCNEC is a rare but highly malignant subtype of pulmonary neuroendocrine tumor, accounting for approximately 2.1%–3.5% of malignant lung tumors. CoLCNEC lacks specific clinical symptoms and signs, and primary CoLCNEC often manifests peripherally rather than centrally. The diagnosis of CoLCNEC through needle aspiration or small biopsy specimens, which typically require post-tumor resection for confirmation, is challenging. Molecular spectrum analysis revealed similarities between CoLCNEC, SCLC, and NSCLC. 20,21 However, owing to its distinct histological category with specific genomic and transcriptomic characteristics, transcriptome analysis faces limitations related to tissue separation. To overcome this constraint, we conducted high-resolution spatial gene expression assessment of tissue slices through ST sequencing for CoLCNEC tumor tissues. This method allows spatial annotation of the internal composition of the tumor without compromising the tissue structure, offering the potential to discover novel structures and uniquely expressed genes that are distinct from SCLC and NSCLC. This finding holds significance for a more accurate understanding of CoLCNEC and precise diagnostic approaches.
We conducted spatial transcriptomic analysis on a distinct CoLCNEC with explicit features, starting from the perspective of overall RNA characteristics. With the help of STs, we identified features of both CoLCNEC and surrounding tissues. Initially, we partitioned the tissue regions, including cancerous tissue, adjacent tissue, and blood vessels. By employing an unsupervised approach for clustering, we identified four clusters: cancer cells (comprising neurons, epithelial cells, and B cells), endothelial cells, pulmonary alveolar cells, and B cells. CoLCNEC is a tumor type generated by different cell types, with these cell types profoundly influencing its evolution. The cancerous tissue regions contain three types of cellular subtypes: B cells, epithelial cells, and neuronal cells, while noncancerous tissue contains B cells, alveolar cells, and endothelial cells. The presence of a large number of epithelial cells in cancerous tissues likely reflects that the tumor originates from the malignant transformation of epithelial cells, 22 and the appearance of neurons indicates that CoLCNEC possesses neuroendocrine differentiation characteristics. Noncancerous tissues include alveolar cells and endothelial cells, indicating that their normal physiological structure depends on alveoli to maintain gas exchange functions, with endothelial cells forming a vascular network to support tissue metabolism. 23 In contrast, the absence of alveolar cells in cancerous tissues may be due to tumor cell proliferation replacing normal lung parenchyma, and the reduction in endothelial cells is possibly related to abnormal tumor angiogenesis. 24 B cells coexist in both types of tissues; however, B cells in noncancerous tissues may participate in basic immune functions, whereas B cells in cancerous tissues often show focal aggregation, reflecting the remodeling of the tumor microenvironment. 25 Additionally, compared to B cells in noncancerous tissues, the upregulated differential genes in B cells within cancerous tissues are significantly enriched in pathways such as B-cell activation and B-cell receptor signaling, suggesting that B cells in noncancerous tissues are in a steady state, whereas those in cancerous tissues may be activated due to chronic antigenic stimulation.
Studies have indicated that the loss of genes encoding four tumor suppressors in mouse lung epithelial cells leads to the development of LCNEC. 26 In neurons and epithelial cells, the expression or stimulation of certain genes (such as FPRs) contributes to tumor proliferation, invasion, and diffusion, indicating an unfavorable prognosis for cancers such as lung cancer. 27 Compared with that in SCLC, immune cell infiltration is more common in lung LCNEC (58% vs. 23%). 28 Infiltrating immune cells in lung tumors include T cells and B cells, with proliferating B cells observed in approximately 35% of lung cancers, suggesting that these cells play crucial roles in the progression of lung tumors. Compared with those in the other three cell groups, genes in cancer cells, such as STMN2, CACNA1A, IGFBP5, STMN1, CDH2, ENC1, GRP, CKB, SEC11C, and SOX4, were upregulated. STMN2 is primarily a neuronal protein involved in differentiation and microtubule instability. It is associated with platinum resistance in testicular embryonal carcinoma cells and has been shown to be upregulated in NSCLC due to the dysregulation of long noncoding RNAs. 29 Additionally, studies have revealed the upregulation of STMN2 in squamous cell carcinoma and lung adenocarcinoma tissues compared with nonlung cancer tissues, which is consistent with our research. 30 The upregulation of CACNA1A, STMN1, and ENC1 in lung cancer is associated with poor prognosis. 31 –33 Low levels of IGFBP5 might increase the survival rate of patients with NSCLC. Dysregulation of adhesion protein (CDH2) expression is associated with comedonecrosis in LCNEC. 34 GRP and SOX4 are upregulated in lung LCNEC. 35 SEC11C is differentially expressed between NSCLC tumors and normal tissues. 36,37 Among the genes upregulated in cancer tissue, IGFBP5 and SOX4 are strongly associated with the immune response. IGFBP5 is associated with the infiltration of B cells, T cells, macrophages, and NK cells in neuroglial tumors, 38 while SOX4 may influence the development of SCLC by inducing the secretion of TGF-β. 39 Therefore, the high expression of IGFBP5 and SOX4 in CoLCNEC cancerous tissues could provide a theoretical reference for selecting targets for immunotherapy in CoLCNEC.
We conducted differentially gene expression analysis in both the tumor and nontumor regions of CoLCNEC. The results of KEGG enrichment revealed significant enrichment of DEGs in pathways such as the cell cycle, DNA replication, nucleocytoplasmic transport, and mismatch repair. Additionally, the GSEA enrichment results indicated that the DEGs were enriched in pathways such as E2f targets, G2m checkpoint, and mitotic spindle. Researchers such as Ando, through gene set enrichment analysis, revealed the enrichment of cell cycle genes and mitosis-related factors (E2F transcription factors and checkpoint kinases) in LCNEC, which aligns with our research findings. 37 Furthermore, other studies have supported the association of LCNEC with cell cycle pathways. 40 We were the first to identify the enrichment of the cell cycle and mitotic pathways in CoLCNEC. Given the characteristic high mitotic rate of large LCNEC cells, we singled out a key gene, SMC1A, from pathways such as the cell cycle, E2f targets, the G2m checkpoint, and the mitotic spindle. ST measurements revealed high expression of SMC1A in the tumor region of CoLCNEC, which was confirmed by immunohistochemistry. Previous studies have implicated the upregulation of SMC1A in the progression of lung cancer, validating our findings. 41 SMC1A encodes a structural subunit of the cohesin protein complex, which is essential for sister chromatid cohesion during the cell cycle. 42
Our research further demonstrated that silencing SMC1A significantly reduced the proportion of NCI-H661 and LTEP-a-2 cells in the S phase, consistent with the findings reported by Zhang et al., which showed that the growth inhibition of A549 and H1299 cells was induced by G1/S cell cycle arrest and the apoptosis pathway. 43 However, the results from Ma et al. indicated that knockdown of SMC1A led to G2/M arrest in human glioma cells. 44 Overall, SMC1A may influence cancer development by regulating cell division. Moreover, overexpression of SMC1A significantly enhanced the proliferation and migration abilities of NCI-H661 and LTEP-a-2 cells, consistent with the findings reported by Zhang et al. 45 Another study showed that SMC1 promotes proliferation and inhibits apoptosis in colorectal cancer through the NF-κB signaling pathway, 46 while in gastric cancer, SMC1A facilitates the proliferation, migration, and invasion of gastric cancer cells by promoting SNAIL activation. 47 However, there is a limited exploration into how SMC1A affects lung cancer, particularly CoLCNEC. In the future, studies could utilize CRISPR-Cas9 knockout libraries in CoLCNEC cell lines to screen for SMC1A-interacting proteins, with a focus on analyzing dependencies of DNA repair-related molecules (e.g., RAD21, STAG2) 48 and transcription factors (e.g., NF-κB, SNAIL). 49 Inhibitors targeting the SMC1A ATPase domain could be designed, 50 leveraging preclinical data from cohesin complex inhibitors (e.g., SGO1 inhibitors) to optimize drug penetrability and tumor specificity. 51 Furthermore, in CoLCNEC patient populations, temporal changes in gene expression during tumor progression could be examined, and levels of SMC1A and its interacting factors could be assessed through IHC to identify patient subgroups that may benefit from SMC1A-targeted therapies.
Conclusions
We utilized STs to characterize CoLCNEC and adjacent tissues. Differentially gene expression analysis between the tumor and nontumor regions of CoLCNEC revealed, for the first time, enrichment of the cell cycle and mitotic pathways in CoLCNEC. Pathway screening revealed significant upregulation of the mitosis-associated gene SMC1A in the tumor region of CoLCNEC. It was further demonstrated that silencing SMC1A could inhibit the migration and invasion of NCI-H661 and LTEP-a-2 cells, as well as G1/S phase transition, and promote apoptosis. This study contributes to a deeper understanding of distinct cellular subpopulations and alterations in relevant signaling pathways within the tumor tissue of CoLCNEC. However, with the intention of ensuring the reliability of our findings, further expansion of the sample size is necessary. Additionally, the importance of SMC1A in CoLCNEC needs to be further validated through functional studies, laying a more robust foundation for the clinical prognostication of this disease.
Footnotes
Authors’ Contributions
M.Y.J. and D.M.F. performed the research and drafted the article. Y.Q.Y. and Jing W. provided help and advice for the HE staining experiments. X.D.F. and W.H.Y. interpreted the data. X.F.D. and Y.H.X. analyzed the data. Jun W. designed the research and reviewed the article. All the authors contributed to editorial changes in the article. All the authors read and approved the final article. All authors have participated sufficiently in the work and agreed to be accountable for all aspects of the work.
Availability of Data and Materials
The data that support the findings of this study are available from the corresponding author upon reasonable request.
Ethics Approval and Consent to Participate
This study was approved by the Research Ethics Committee of Central Hospital Affiliated with Shandong First Medical University (approval no. 20240424003, April 26, 2021) and complied with the Helsinki declaration. All patients provided written informed consent.
Disclosure Statement
The authors declare that they have no conflicts of interest.
Funding Information
This research was supported by the Shandong Medical and Health Science and Technology Development Fund (No. 2019WS078), the Technology Development Program of Jinan City (No. 2020-4-01), and the Science and Technology Development Program of the Jinan Municipal Health Commission (No. 202019117).