
Abstract
Abstract
Public perception of somatic cell nuclear transfer (SCNT) in the production of agricultural animals is surrounded by fear, which is exacerbated by the inability to differentiate animals generated by SCNT from those generated by natural mating or artificial insemination (AI). Unfortunately, the DNA sequence of animals produced by SCNT is indistinguishable from those generated by fertilization. With the current banning of all SCNT animal products from entering the food supply in some countries, the lack of a diagnostic test to identify SCNT animals may jeopardize market access for producers. The aim of this research was to exploit differences in epigenetic reprogramming that occur during SCNT and fertilization in the early embryo. The resulting differences in epigenetic signatures that persist to adulthood are proposed as the basis for a diagnostic test to identify animals generated by SCNT. Here we describe differences in DNA methylation at eight CpG sites in the retrotransposon-like 1 (Rtl1) promoter region in cattle blood and test whether these differences could be used as a diagnostic tool. For a definitive diagnosis, it is critical that no overlap in DNA methylation levels is observed between individuals produced by SCNT and fertilization. This was the case for the cohort of SCNT animals studied, their female half-siblings generated by AI, and a collection of unrelated cows also generated by AI. Further rigorous testing is required to determine what effects donor cell type, age, sex, genetic background, SCNT methods, and the environment have on the DNA methylation across this region, but the Rtl1 promoter is currently a promising candidate for the identification of SCNT generated cattle.
Introduction
S
There are several challenges in developing a test to identify animals generated by SCNT. First, although some physiological parameters have been reported to be abnormal in cloned animals (Wells et al., 2004), these differences are inconsistent. Second, although statistically significant differences may be observed for these traits, at the level of individual animals there is considerable overlap between animals generated by SCNT and fertilization. Third, at the genome level, SCNT-generated animals are no more likely to show abnormalities than animals generated by fertilization. While theoretically it could be possible to identify the presence of cloned animals if multiple animals were found to be genetically identical, such an assay would not be practical, and many SCNT animals would likely be missed given the sheer enormity of analysis required. Furthermore, false positives are possible in cases where animals are monozygotic twins.
Although animals produced by SCNT are not genetically distinct from animals generated by natural mating or AI, it is possible that an additional layer of heritable information, known as epigenetics, influenced by the environment may potentially be used for identification of animals generated using SCNT. DNA methylation is one epigenetic mechanism that may provide a useful biomarker for differentiating the reproductive origin of animals. The use of epigenetic biomarkers is not a novel concept; over the past decade, epigenetic markers have been of substantial interest in forensic sciences for the identification of monozygotic twins, source and age of tissue, parental origin of alleles, and authentication of DNA samples (Vidaki et al., 2013).
DNA methylation is a dynamic process, with changes in DNA methylation occurring both locally (Weaver et al., 2005) to regulate individual genes and globally (Santos and Dean, 2004) to allow complete reprogramming. In mammals, genome-wide reprogramming during early embryonic development has been studied most extensively in mice. In the mouse, epigenetic reprogramming is thought to begin immediately following fertilization via both active demethylation (paternal genome) and passive demethylation (maternal genome). Remethylation gives rise to a pluripotent embryonic state by the blastocyst stage of development (Santos and Dean, 2004).
In reproductive cloning by SCNT, the epigenetic signature of a differentiated somatic cell must be reset to a state resembling totipotency, capable of driving full development after fusion of the cell with an enucleated oocyte cytoplast. While the generation of viable SCNT animals indicates that this epigenetic reprogramming occurs, at least to some extent, some studies have identified regions of hypomethylation (Bourc'his et al., 2001; Cezar et al., 2003; Chen et al., 2005; Couldrey and Lee, 2010; Lucifero et al., 2006), hypermethylation (Couldrey and Wells, 2013; Dean et al., 2001; Dindot et al., 2004), or mosaic methylation states (Kang et al., 2002) in animals generated by SCNT. Rigorous comparison of these findings, even when limiting the species to cattle, is problematical because differing genomic regions, tissues, and ages were examined in each study, making it difficult to determine whether the epigenetic differences identified are consistent across SCNT-generated animals.
Until the development of next-generation sequencing, analysis of DNA methylation during nuclear reprogramming in SCNT was largely dependent on a candidate gene approach. Gene candidates were often chosen on the basis of phenotypic abnormalities or aberrant expression of genes in SCNT animals. One gene that is thought to play an important role in placental development (a developmental process often found to be perturbed in SCNT fetuses), and found to be inappropriately expressed in cloned mouse embryos, is retrotransposon-like 1 (Rtl1) (Cui et al., 2009). Further investigation identified that Rtl1 harbors at least two microRNAs (miRNAs) and was found to show aberrant DNA methylation at the CpG sites examined by bisulfite sequencing (Cui et al., 2009). Here we describe an analysis of DNA methylation across the bovine Rtl1 gene with a focus on producing a diagnostic test to distinguish cloned cattle from those generated by fertilization.
Materials and Methods
Animal studies
All animal manipulations were conducted in accordance with the regulations of the New Zealand Animal Welfare Act of 1999 and the Ruakura Animal Ethics Committee (AE Applications 10067, 11263, and 12652). Animal use was justified under the principles of the “three Rs”—i.e., reduction, refinement, and replacement. All animals were monitored visually on a daily basis for changes in behavior. Animals were cared for in accordance with the “Code of Recommendations and Minimum Standards for the Care and Use of Animals for Scientific Purposes” (www.biosecurity.govt.nz/regs/animal-welfare/research).
Primer design
Sequence comparison between murine, bovine, and ovine Rtl1 sequences was undertaken using ClustalW (v. 2.1) with the IUB cost matrix, a gap open cost of 15, and a gap extension cost of 6.66 to identify sequence similarity and determine Rtl1 and miRNA-127 promoter regions corresponding to those analyzed in the mouse (Cui et al., 2009).
Primers were designed to the bovine Rtl1 coding sequence and 2 kb upstream of the coding region using the EpiDesigner tool (Sequenom, CA, USA). Primer sequences for Sequenom MassARRAY assays are listed in Table 1, with each primer also containing the standard Sequenom tags (forward, AGGAAGAGAG, and reverse, CAGTAATACGACTCACTATAGGGAGAAGGCT).
SCNT animal generation and sample collection
SCNT embryos were generated as described previously (Couldrey and Lee, 2010) using donor cells obtained from a granulosa cell line derived from a high-producing Friesian cow. After in vitro culture for 7 days, SCNT embryos were transferred to synchronized recipients. Control pregnancies were generated by AI, using frozen semen from the sire of the cow from which the donor cells were derived to generate female half-siblings.
Blood from the tail vein was collected from SCNT animals (n=6) and half-sib (n=4) controls at 24 months of age into heparinized vacutainers. Similarly, blood was collected from 31 unrelated Friesian cows, generated by AI, as they began their second lactation.
DNA extraction
DNA was extracted using a previously described protocol (Montgomery and Sise, 1990). Red blood cells from 10 mL of blood were lysed in red blood cell lysing solution (150 mM NH4Cl, 19 mM KCl, and 0.1 mM EDTA) for at least 5 min. White blood cells were pelleted by centrifugation, and the resulting supernatant was removed before repeating red blood cell lysis. The remaining white cells were pelleted and washed in Tris-buffered saline (140 mM NaCl, 0.5 mM KCl, 0.25 mM Tris HCl, pH 7.4). The cells were pelleted, and the wash buffer was removed. White blood cells were resuspended in Tris-EDTA (10 mM Tris HCl, 0.1 mM EDTA, pH 8.0) before adding an equal volume of Proteinase K–EDTA–sodium dodecyl sulfate (SDS) solution (freshly made containing 0.15 mg/mL proteinase K, 0.05 M EDTA, 0.07% SDS) and digested at 50°C for between 2 and 18 h. Saturated NaCl (3 mL) was added, and samples were shaken for 1 min. An equal volume of 1:1 buffer-saturated phenol:choloroform was added, and samples were mixed by inversion. Phases were separated by centrifugation. The aqueous phase was transferred to a new tube, and the phenol chloroform extraction repeated. DNA was precipitated from the aqueous phase using 95% ethanol. The DNA pellet was collected on a glass hook, washed in 1 mL of 70% ethanol, and air dried before being resuspended in 1 mL of TE buffer.
DNA methylation analysis
DNA samples were analyzed using Sequenom MassARRAY (Sequenom, CA, USA) technology as previously described (Coolen et al., 2007; Couldrey and Lee, 2010; Couldrey et al., 2011). Briefly, using 1 μg of DNA, the EZ-DNA Methylation-Direct Kit was used to produce methylation-dependent sequence variations of C → T. Regions of interest were amplified using T7 tagged PCR primers in triplicate. Replicates were pooled for analysis to minimize bias and variation, as described by Coolen et al. (2007). In vitro amplification and transcription was performed on the reverse strand, with simultaneous U-specific cleavage by RNase A. Samples were subject to mass spectrometry to provide high-resolution DNA methylation analysis, quantitative to 5% methylation for informative CpG dinucleotides (Coolen et al., 2007). To ensure consistency of results from assay to assay, for each PCR and subsequent MassARRAY analysis, controls without DNA were included together with positive controls of known methylation levels.
Statistical analysis
Spectra were analyzed using the Sequenom peak picking and signal-to-noise ratio software. The relative methylation of the CpG site was then calculated (EpiTYPER, Sequenom, CA, USA) by dividing the peak intensity (area under the peak) of the fragment representing the original methylated DNA by the sum of the intensities of the peaks representing both methylated and nonmethylated DNA. Statistical significant differences between methylation in control versus SCNT samples were analyzed by t-test.
Results
Rtl1 sequence
The bovine, ovine, and mouse Rtl1 genes all consist of a single exon. Their respective lengths are 3996 bp, 4002 bp, and 5235 bp. The bovine Rtl1 genomic region (including the single exon and 2 kb upstream) was found to have 94.5% and 55.6% pairwise identity, respectively, with the ovine and mouse Rtl1 genomic regions. A CpG island of 3513 bp spanned 87.2% of the coding region (Fig. 1). No CpG islands were present in the 2-kb sequence analyzed upstream of the coding sequence. The 13 Sequenom MassARRAY amplicons covered 84.5% of the coding region and 2 kb upstream (Fig. 1).
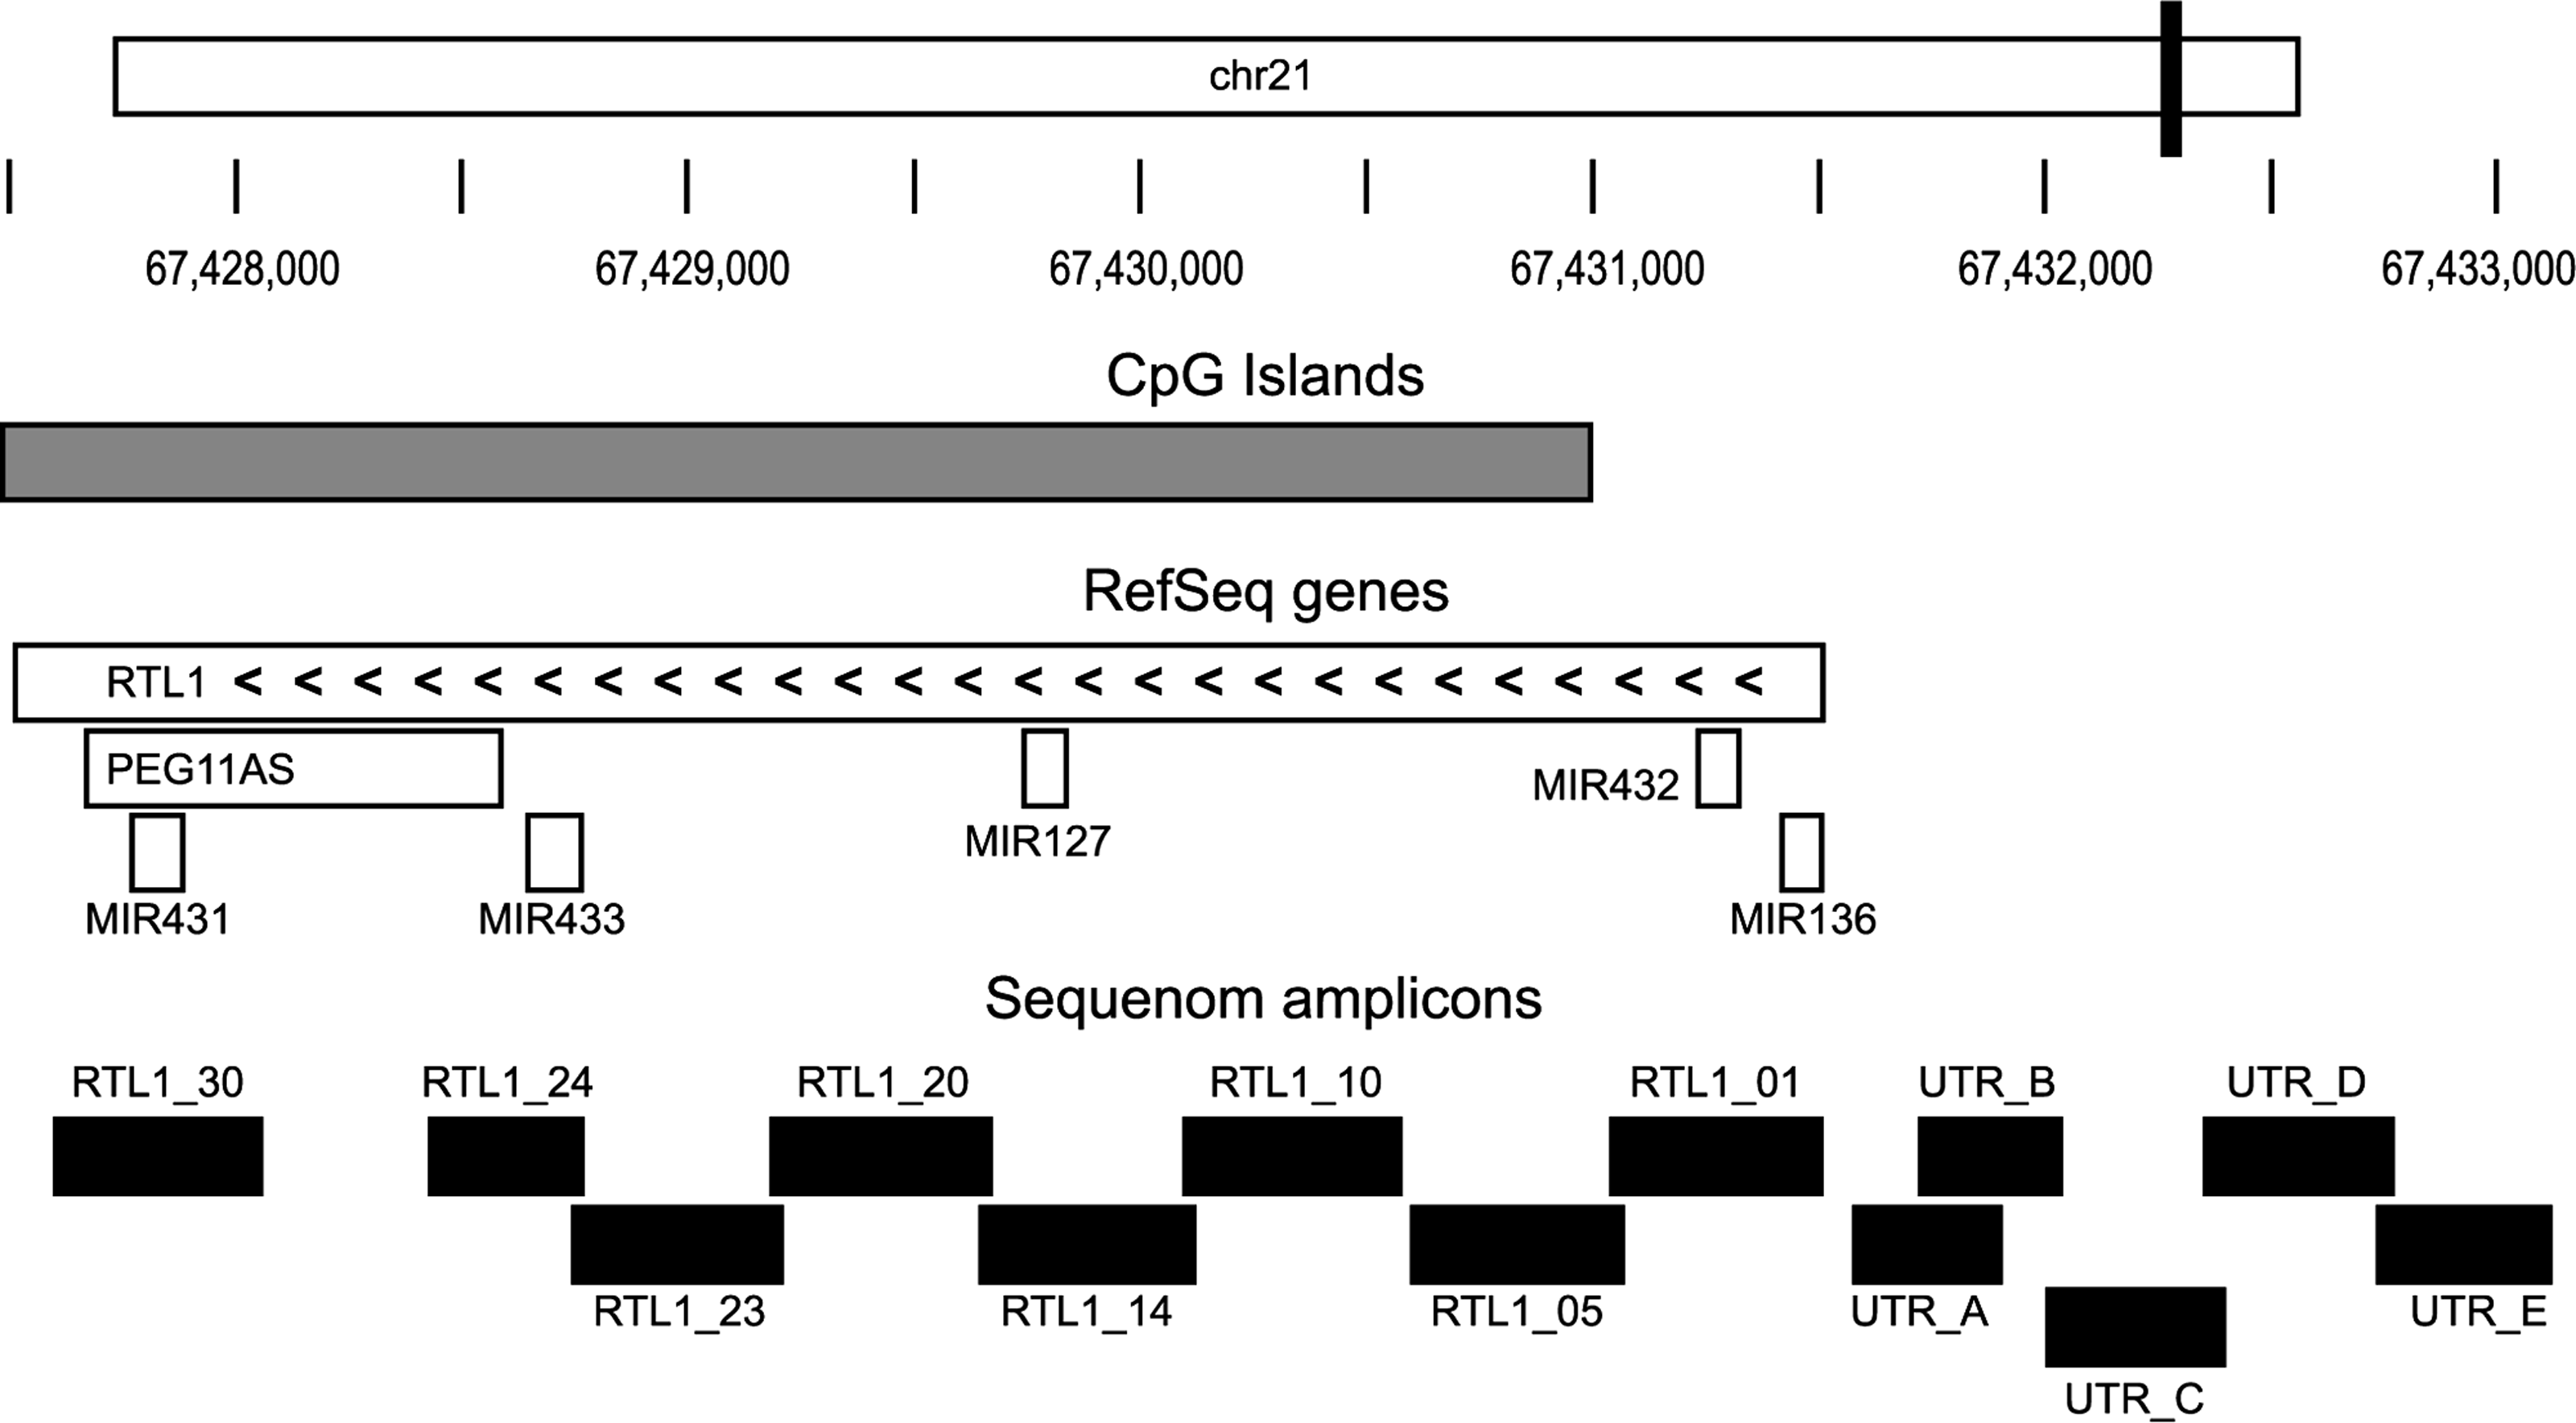
Structure of the Rtl1 gene in cattle. Positions of large CpG island and transcripts together with positions of MassARRAY assays are shown mapped to the Rtl1 locus.
DNA methylation across the Rtl1 gene
Of the five amplicons analyzed in the 2 kb upstream of the Rtl1 gene, two (UTR_D and UTR_E) did not result in high-quality data, with the majority of CpG sites being present in restriction fragments that were either too large or too small for accurate assessment of DNA methylation levels. The remaining 11 amplicons resulted in 104 fragments able to be analyzed and contained a total of 134 CpG sites analyzed either individually or in groups of up to four. Within the Rtl1 gene all amplicons analyzed produced analyzable data. Figure 2 illustrates DNA methylation levels across the Rtl1 gene and upstream promoter region in blood samples from cows produced by SCNT and half-sib controls concurrently produced by AI. CpG sites analyzed in overlapping amplicons resulted in the same levels of DNA methylation but have been removed from the analysis to avoid duplication.
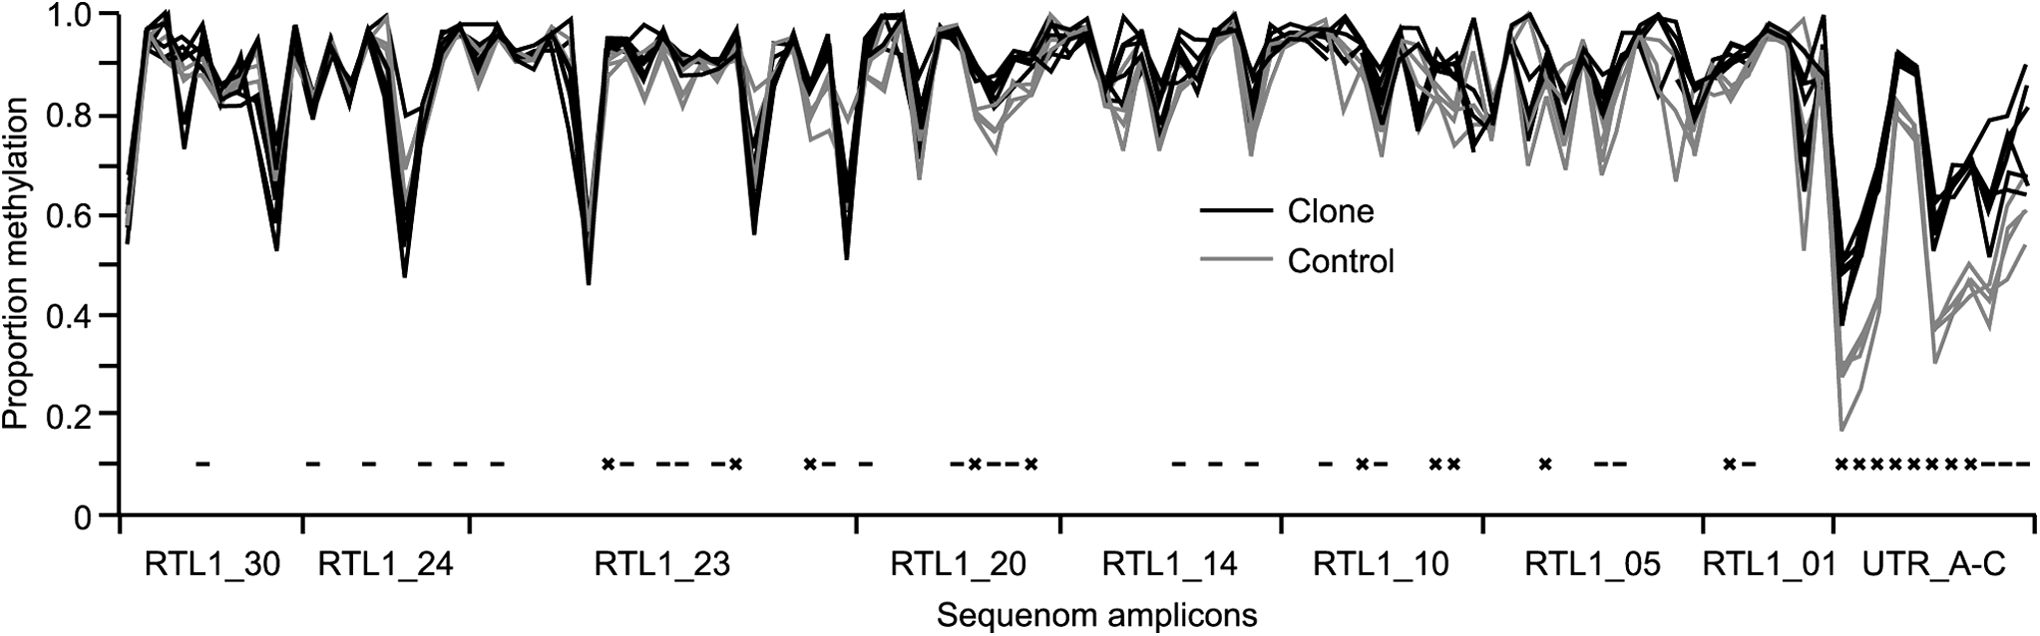
DNA methylation in cattle blood across the Rtl1 coding and promoter regions. Grey lines represent the individual half-sibling control cattle (n=4), and black lines represent cattle generated by SCNT (n=6). Significance of difference in mean methylation between the groups is indicated by – (p=0.05–0.001) and X (p<0.001). Due to assay constraints, CpG sites not able to be analyzed have not been included in the figure.
Within the Rtl1 coding region, levels of DNA methylation were high in both clone and half-sibling control samples. Out of the 93 CpG sites (or groups of sites) able to be analyzed within the coding region, 10 showed highly significant differences in average DNA methylation between the clones and half-sibling controls (p<0.001), with an additional 23 CpG sites (or groups of sites) showing significant differences between clones and half-sibling controls (p=0.05–0.001). In contrast, all of the CpG sites analyzed in the promoter region (UTR_A-C) showed significant differences (p<0.05), with eight of these sites being highly significant (p<0.001). In addition to the differences in DNA methylation appearing to be larger between cloned and half-sibling control animals in the promoter region compared with the coding region of the gene, little overlap in DNA methylation levels was observed at an individual animal level between samples from clone and half-sibling control groups in this untranslated region (UTR) of the Rtl1 gene.
Validation of test
Analysis of a further 31 blood samples, from cows of the same breed but genetically unrelated to the clones and their half-sibling controls, across the Rtl1 promoter region showed that DNA methylation levels in the cloned animals were significantly higher than in unrelated control animals at the eight closest CpG sites to the Rtl1 coding sequence. Figure 3 illustrates the methylation differences at the Rtl1 promoter sites identified as being highly significant (p<0.001) in the initial study. Notably, none of the unrelated control animals had DNA methylation levels as high as any of the clones at any of the sites.
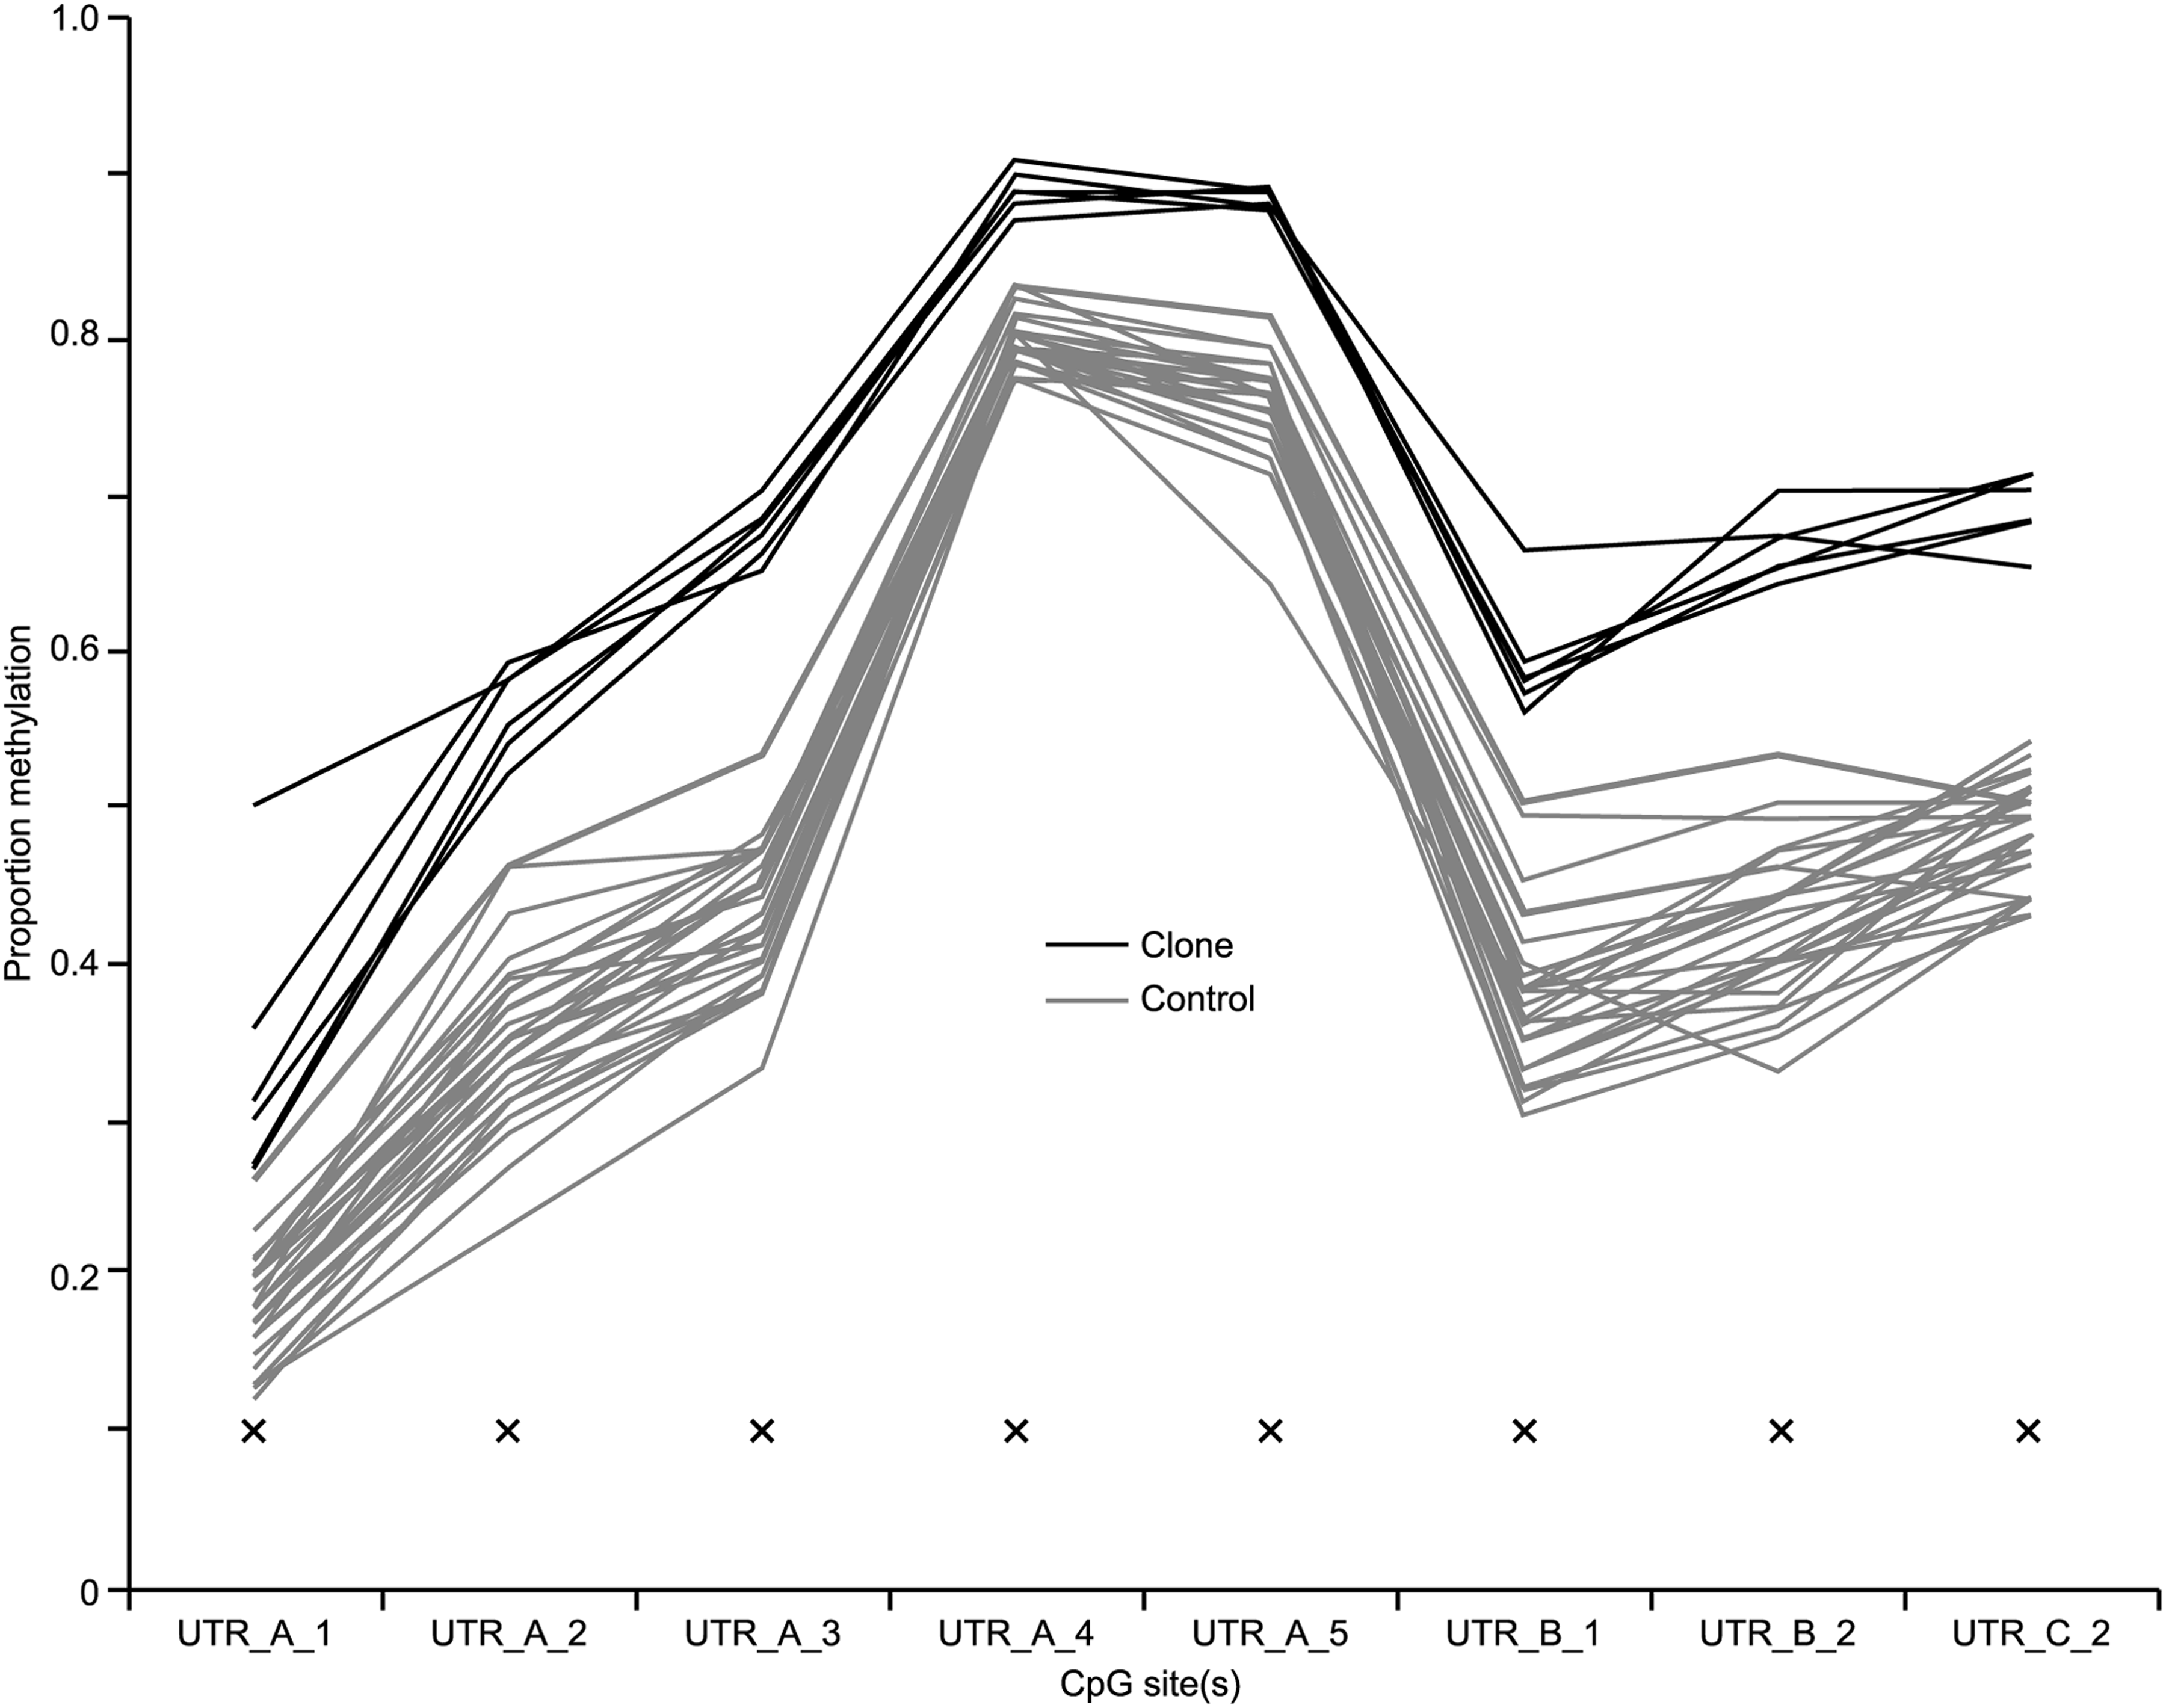
Validation of difference in cattle blood DNA methylation across the Rtl1 promoter region. Comparison of DNA methylation in 31 Friesian cattle genetically unrelated to SCNT cattle (n=6) across the CpG sites (all individual sites) in the promoter region of the Rtl1 gene to determine natural variation of DNA methylation in cattle blood. Significance of difference in mean methylation between the groups is indicated by X (p<0.001).
Discussion
As consumers become more demanding with regard to knowing the origin of their food, the ability to guarantee and demonstrate that animals destined for human consumption are not cloned from somatic cells will become a critical factor in maintaining access to specific markets for producers. Once thoroughly validated, the potential for epigenetic biomarkers to identify animals produced by SCNT would prove to be extremely valuable.
In mice, the Rtl1 gene is a key gene involved in placental formation expressed exclusively from the paternal allele (Cui et al., 2009). Although the single-exon structure of mouse Rtl1 is similar to that observed for the Rtl1 gene in cattle, and the species share reasonable sequence similarity, there is currently no literature to support or refute this gene being expressed in an imprinted manner in the cow. Sequence similarities between species were sufficiently high to allow Sequenom MassARRAY assay design for analysis of DNA methylation across the Rtl1 and miRNA-127 promoters, as has been reported in mice (Cui et al., 2009), as well as a more extensive analysis of DNA methylation of the promoter and the majority of the Rtl1 coding sequence.
The consistent hypermethylation observed in the 2-kb upstream promoter region in blood from SCNT-generated cows compared with their AI-generated half-siblings is different from the hypomethylation reported in this region in SCNT-generated mouse blastocysts. Although the differences may simply be due to the different species and tissues analyzed, it is also possible that the trichostatin A treatment designed to open chromatin in the SCNT methods used in mice (Cui et al., 2009) also contributed to these differences. SCNT mouse blastocysts exhibited hypermethylation around the miRNA-127 promoter, but there was little evidence that the same was true in cattle, with only a few sites surrounding the equivalent miRNA-127 sequence and across the entire Rtl1 coding region displaying moderately different DNA methylation levels between the two groups.
The reason why the Rtl1 promoter shows more inappropriate methylation patterns than the coding region is not explained in this study. Given the involvement of Rtl1 in placental formation, and the placental perturbations observed in cloned cattle (Lee et al., 2004), it is also possible that this genomic region is, at least in part, responsible for the inefficiencies of generating cattle by SCNT. Not only are the differences in DNA methylation levels between SCNT and control animals larger, more highly significant, and more consistent in the Rtl1 promoter region compared with the coding region, 10/11 of the CpG sites able to be analyzed in the promoter region showed no overlap in methylation levels between the two groups. In contrast, all of the CpG sites that showed significant differences in mean methylation levels within the coding region had some overlap in methylation levels between individuals from the two groups.
If DNA methylation is to be used as a diagnostic test for the identification of SCNT animals in herds of cattle, a complete separation of DNA methylation levels measured in a tissue that can easily be sampled from SCNT and control animals is required. If a SCNT animal displayed a DNA methylation level that was within the range observed in the control animals, it would not be identified as having been produced by SCNT, thereby resulting in a false negative. Similarly, an animal generated by fertilization whose DNA methylation level was sufficiently high to fall in the SCNT range would be incorrectly classified as a clone, hence a false positive. Given the current public perception of animal cloning, the generation of either false positives or false negatives would be unacceptable.
Although previous studies have often reported differences in DNA methylation following SCNT (Bourc'his et al., 2001; Liu et al., 2008; Lucifero et al., 2006), many of these have only presented group average values, which, on the basis of previous studies from our laboratory (Couldrey and Lee, 2010; Couldrey and Wells, 2013) clearly show an overlap in methylation levels between SCNT and control individuals even when average methylation differences are highly significantly different. Another important, and related, consideration in designing a diagnostic test that distinguishes cloned animals from those generated by fertilization is the natural variation across the population. Previous attempts in our lab to design a methylation-based assay for identifying SCNT-generated animals have been hampered by the large variation in DNA methylation levels between control animals at individual, and groups of, CpG sites. To date, this variation has resulted in overlapping levels of DNA methylation between the groups (data not shown). The identification of multiple (eight) CpG sites across three Sequenom amplicons, for which no overlap in DNA methylation levels were observed between SCNT cows, genetically related animals (half-siblings), or 31 unrelated cows of the same breed (Friesian), indicates that this region of the genome shows promise as a test for identifying cattle produced by somatic cell cloning rather than fertilization.
While this pilot study is encouraging, extensive testing is still required to determine the effects of donor cell type, genetics, age, SCNT methods, and other environmental factors that may influence the level of DNA methylation across the Rtl1 promoter. These hurdles in developing a test to identify SCNT animals are not unique. The field of forensics has faced similar challenges when introducing epigenetic testing in standard investigation practices. The successes, and progress made in forensics using DNA methylation as part of forensic testing, indicates that these initial hurdles can be overcome and valuable tests commercialized.
Footnotes
Acknowledgments
The authors thank Martin Berg for animal care and treatment; Debbie Berg for providing blood samples from Friesian cows; Pru Renshaw, Jeremy Bracegirdle, and Beth Signal for the Sequenom MassARRAY analysis; Harold Henderson for statistical assistance; Megan Symes for proofreading; and Pauline Hunt for graphics assistance. This work was funded through the AgResearch Curiosity fund.
Author Disclosure Statement
The authors declare that no conflicting financial interests exist.