
Abstract
Abstract
Background:
Adolescents who are obese are at high risk of developing obstructive sleep apnea (OSA). Although there is clear evidence associating OSA with metabolic dysfunction in adults, the evidence is less clear cut with adolescents. The purpose of this review was determine the association of sleep apnea with dyslipidemia, insulin resistance, cardiovascular disease risk, nonalcoholic fatty liver disease, and difficulty with weight loss in adolescents.
Methods:
A systematic literature review using PubMed, Scopus, CINAHL, Google Scholar, and PsycINFO was performed and articles were screened and reviewed with an a priori protocol.
Results:
Sixteen articles were included in qualitative synthesis and 10 were included in meta-analysis. Results from the meta-analysis indicate that OSA in adolescents is associated with greater risk of dyslipidemia, insulin resistance, and hypertension.
Conclusions:
Although obesity leads to increased metabolic risk, OSA appears to independently increase metabolic impairment. Adolescents with obesity should be frequently screened for OSA to determine need for treatment and reduce this metabolic burden.
Introduction
Obesity has become one of the largest healthcare issues in the United States, with over one-third of adolescents classified as overweight and one-fifth as obese. 1 Obesity contributes to increased prevalence in several chronic health conditions, such as hypertension, type 2 diabetes, cardiovascular disease (CVD), and obstructive sleep apnea (OSA). 2 High BMI is considered to be one of the greatest risk factors of OSA, and sleep apnea is seen at rates as high as 56% in adolescents with severe obesity. 3 Although most research focuses on the role obesity plays on the development of OSA and the effectiveness of weight reduction on resolving sleep-disordered breathing (SDB), 4 less attention is given to the effect of sleep apnea on metabolism and weight management. To best serve adolescent patients with sleep apnea, it is important to understand this relationship when considering treatment options.
Most of the research on the metabolic consequences of OSA is performed in adult samples. Evidence in adults points toward SDB contributing to weight gain and leading to multiple metabolic deficits. 5 Lifestyle weight-loss interventions were less successful in both men and women with sleep apnea or poor sleep quality,6,7 indicating metabolic disruption in individuals with OSA. Further evidence of this disruption is that OSA was related to higher levels of triglycerides and reduced adiponectin and insulin sensitivity. 6 Obesity and OSA independently contribute to systematic oxidative stress and inflammation, and when paired together, may lead to greater metabolic dysfunction. 8 Therefore, it is reasonable that repeated apneic and hypopneic events would negatively affect metabolic variables in adolescents, just as it does in adults.
Although the evidence on the role of sleep apnea on weight management and metabolism is well described in adults, the same cannot be said for adolescents. Studies have been inconsistent with the association between OSA and metabolic variables in adolescents.9,10 One reason for these inconsistencies may be that these studies do not control for puberty. Adolescence is a period of insulin resistance, 11 and therefore, metabolism during this time is not comparable to the prepubertal population. In addition, although obesity is not considered to be a great risk factor for sleep apnea in early childhood, the risk drastically increases in adolescence. 12
The purpose of this review is to parse out the effects of OSA on metabolic risk and weight management. Given the emphasis on early obesity prevention and treatment, understanding the role of OSA in adolescent metabolic dysfunction provides clinicians with an additional perspective when considering treatment plans.
Methods
Data Sources and Searches
A systematic literature review was conducted with a predetermined search strategy, using PubMed, Scopus, CINAHL, Google Scholar, and PsycINFO, covering all publications through June 2016. Search terms for OSA were “obstructive sleep apnea” and “sleep-disordered breathing.” Outcome search terms were “metabolic diseases,” “glucose metabolism,” “insulin resistance,” “hypertension,” “dyslipidemia,” “inflammation/metabolism,” “weight loss,” “weight gain,” “weight management,” and “weight reduction programs.” For the population, search terms were “overweight” and “obesity,” as well as “adolescents,” “children,” and “pediatrics.” In addition to database searches, references of articles that met all selection criteria were searched by hand to identify relevant resources, which were then subject to the same selection criteria.
The search was conducted by one reviewer (Z.W.P.). The reviewer first assessed the title and abstract for inclusion criteria, and then examined the full text to ensure that all selection criteria were met. Inclusion criteria included English language, reporting of outcomes that were metabolic variables and/or weight loss or gain, study populations that included overweight and/or obese participants, and ages 10–19, in accordance to the WHO definition of adolescence. 13 Two exceptions were made for the age range after careful consideration. In one study, all participants were above Tanner Stage I 14 and therefore defined as adolescents. In the other study, participants were stratified between pubertal and nonpubertal. 15 In this case, only data from the pubertal children were extracted. Studies were excluded if they did not contain original data or if they reported sleep apnea as an outcome instead of a factor that may contribute to metabolic risk and/or weight management.
Data Extraction
After screening, data for qualitative synthesis were extracted from each article pertaining to author names, publication date, geographic origin, study design, age range, sample size, follow-up period, and key findings on metabolic and weight-loss outcomes. Based on key findings, articles were organized to determine consensus on individual metabolic risks.
For the meta-analysis, articles went through an additional round of screening and were excluded if they did not group subjects by OSA/SDB and non-OSA/non-SDB, or if they did not include mean and standard deviation for at least one variable of interest. One study divided participants into four groups based on the Apnea–Hypopnea Index (AHI) 16 and were regrouped, and weighted means and standard deviations were calculated to fit the OSA definition of AHI ≥5. For four articles that did not provide mean and standard deviation,15,17–19 median was used as an estimate of the mean and standard deviation was estimated as range/4 (n < 70) or range/6 (n ≥ 70) as per Hozo et al. 20 For three studies17,18,21 including longitudinal results of interventions, baseline data were extracted only. Data were extracted for homeostasis model assessment–estimated insulin resistance (HOMA-IR), triglycerides, total cholesterol, high-density lipoprotein cholesterol (HDL-C), systolic blood pressure (SBP), diastolic blood pressure (DBP), aspartate transaminase (AST), alanine transaminase (ALT), and definition for diagnosis of OSA/SDB.
Statistical Analysis
For each outcome from each study, a standardized mean difference effect size was calculated. Because most studies consisted of small samples, Hedges' g was calculated instead of Cohen's d, since the former removes the small-sample bias of the latter. 22 The results from the random-effects models are reported for all outcomes even when the chi-square tests of heterogeneity of effects were not significant. This is reported rather than reporting fixed effects for some outcomes and random effects for others, since the outcomes come from the set of studies and the test for heterogeneity has low power when the number of studies is small. Moreover, the random-effects model reduces to the fixed effects when there is no heterogeneity. The I2 statistic was used as a measure of the proportion of variance attributed to study heterogeneity. Forest plots display the individual studies and weighted aggregate effects from the random-effects model.
For estimating an overall effect size across outcomes, a three-level meta-analysis of dependent effect sizes was used with inverse weighting of outcomes and random effects for study and outcome nested within study. 23 To test if study characteristics could explain differences in effect sizes between studies, a mixed-effects meta-regression was performed. All analyses were conducted in SAS v9.4.
Results
Six hundred and sixty-six unique abstracts were reviewed, from which 16 articles were deemed to fit all selection criteria (Fig. 1). Descriptions of each study are provided in Table 1. Based on the key findings, results from studies were organized into the following categories: dyslipidemia (9 studies), insulin resistance (13 studies), CVD risk (6 studies), nonalcoholic fatty liver disease (NAFLD, 3 studies), and difficulty with weight loss (4 studies). Ten studies were included in the meta-analysis based on criteria described above.
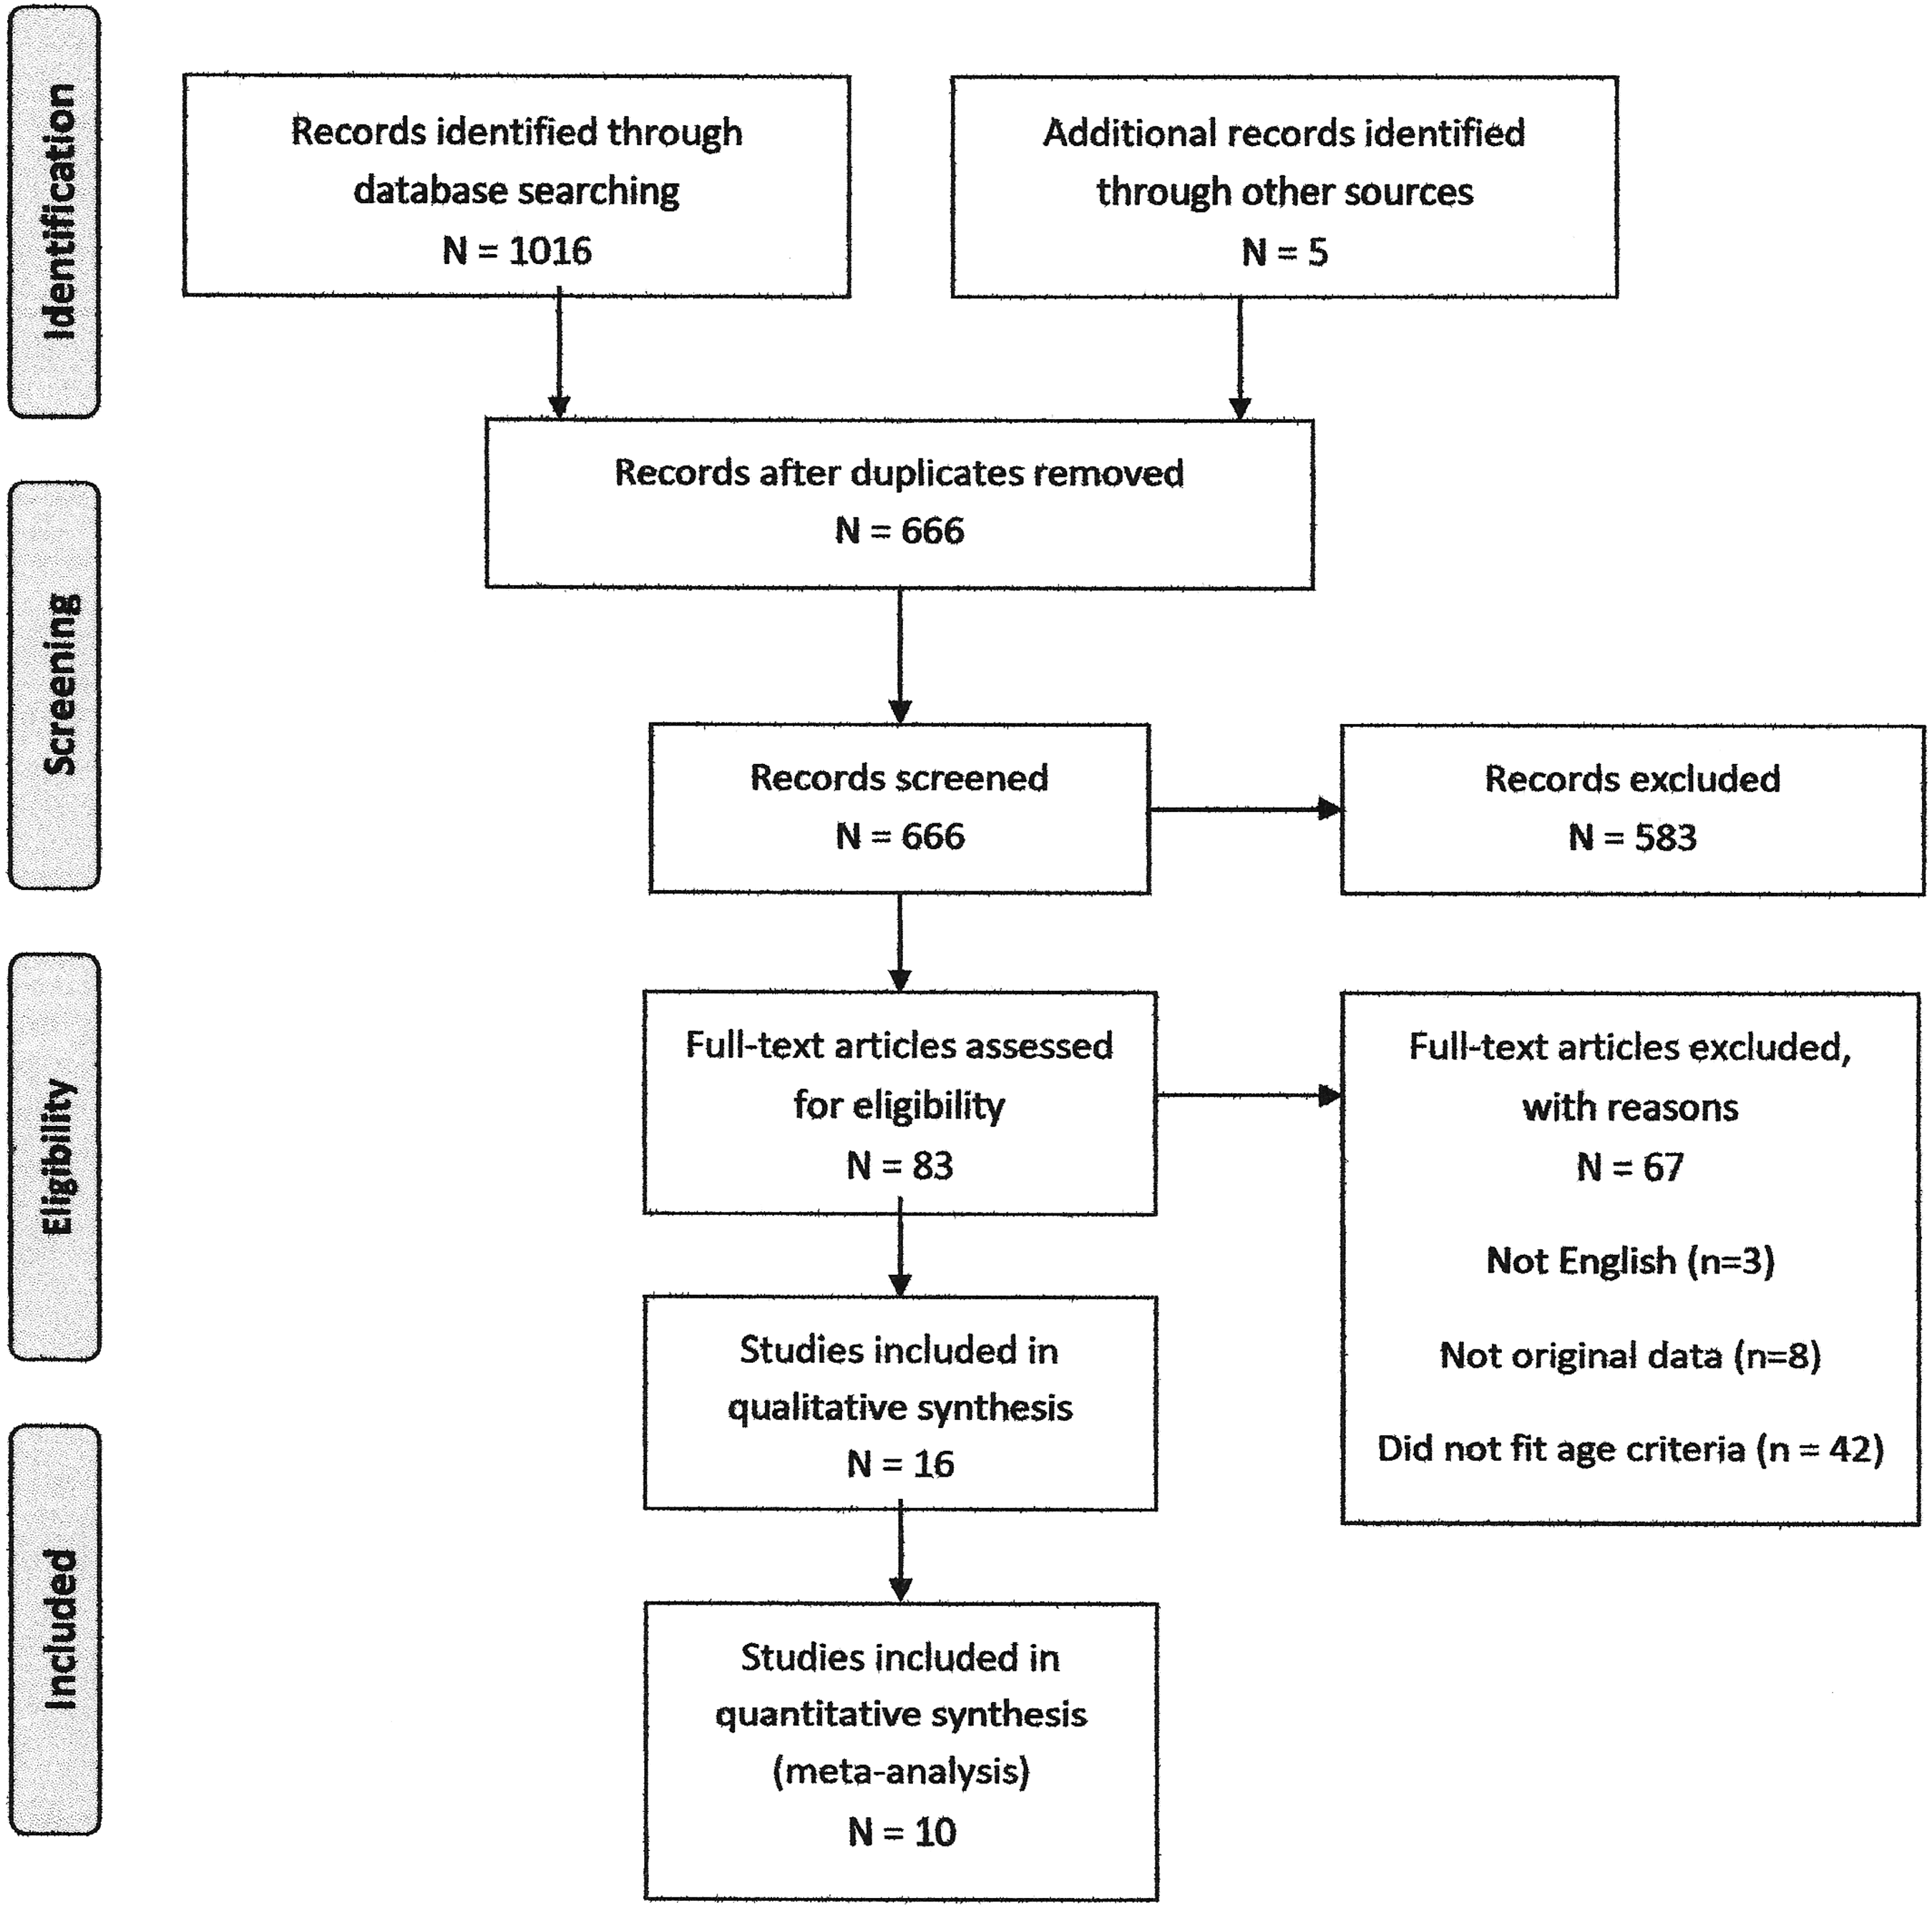
PRISMA flowchart of study screening and eligibility.
Studies Assessing the Associations between Sleep Disordered Breathing and Metabolic Risk and/or Weight Loss
Included in meta-analysis.
AH; AHI, Apnea–Hypopnea Index; CVD, cardiovascular disease; NAFLD, nonalcoholic fatty liver disease; OAHI, obstructive apnea-hypopnea index; ODI, oxygen desaturation index; OSA, obstructive sleep apnea; SDB, sleep-disordered breathing.
Dyslipidemia and OSA
Nine articles examined the relationship of OSA and triglycerides. Three studies found an association between OSA and higher triglycerides.16,24,25 All three of these studies controlled for BMI in their analyses. Since obesity is known to increase triglyceride levels, the findings that this relationship remains after controlling for BMI implicate OSA as being associated with dyslipidemia independently of obesity. In addition, one study found a trend for increased triglycerides in adolescents with OSA. 9 The other five studies found no association with OSA and triglycerides.
The same nine articles also included results of OSA and cholesterol measures. One study reported significantly lower HDL-C with OSA, 24 while another study reported a trend for this relationship. 17 One study found an association between OSA and elevated total cholesterol, 26 despite no differences in HDL-C. The other six articles found no associations between OSA and any measure of cholesterol.
Dyslipidemia and OSA Meta-Analysis
Figures 2–4 show forest plots for three dyslipidemia outcomes. There were eight studies included in the meta-analysis that examined the relationship between OSA and triglycerides and as Figure 2 shows, five studies found OSA patients with higher levels of TGs and three studies where the controls were higher. When combined, there was a small but nonsignificant greater level of TGs in OSA compared to controls (g = 0.22, 95% CI = −0.15–0.58, p = 0.11, I2 = 73.4%). There were seven studies that examined total cholesterol and the forest plot for these studies is shown in Figure 3. Six of the seven studies found higher levels in OSA patients and combined there was a small and statistically significant effect (g = 0.28, 95% CI = 0.01–0.55, p = 0.05, I2 = 45.5%). There were eight studies that measured HDL-C and Figure 4 shows the forest plot. Most studies found lower HDL-C in OSA patients and when combined OSA patients had significantly lower HDL-C (g = 0.37, 95% CI = 0.05–0.70, p = 0.03, I2 = 67.3%). The overall effect from the three-level meta-analysis of the three dyslipidemia outcomes analyzed simultaneously resulted in a significant difference between groups (g = 0.29, 95% CI = 0.07–0.52, p = 0.02).
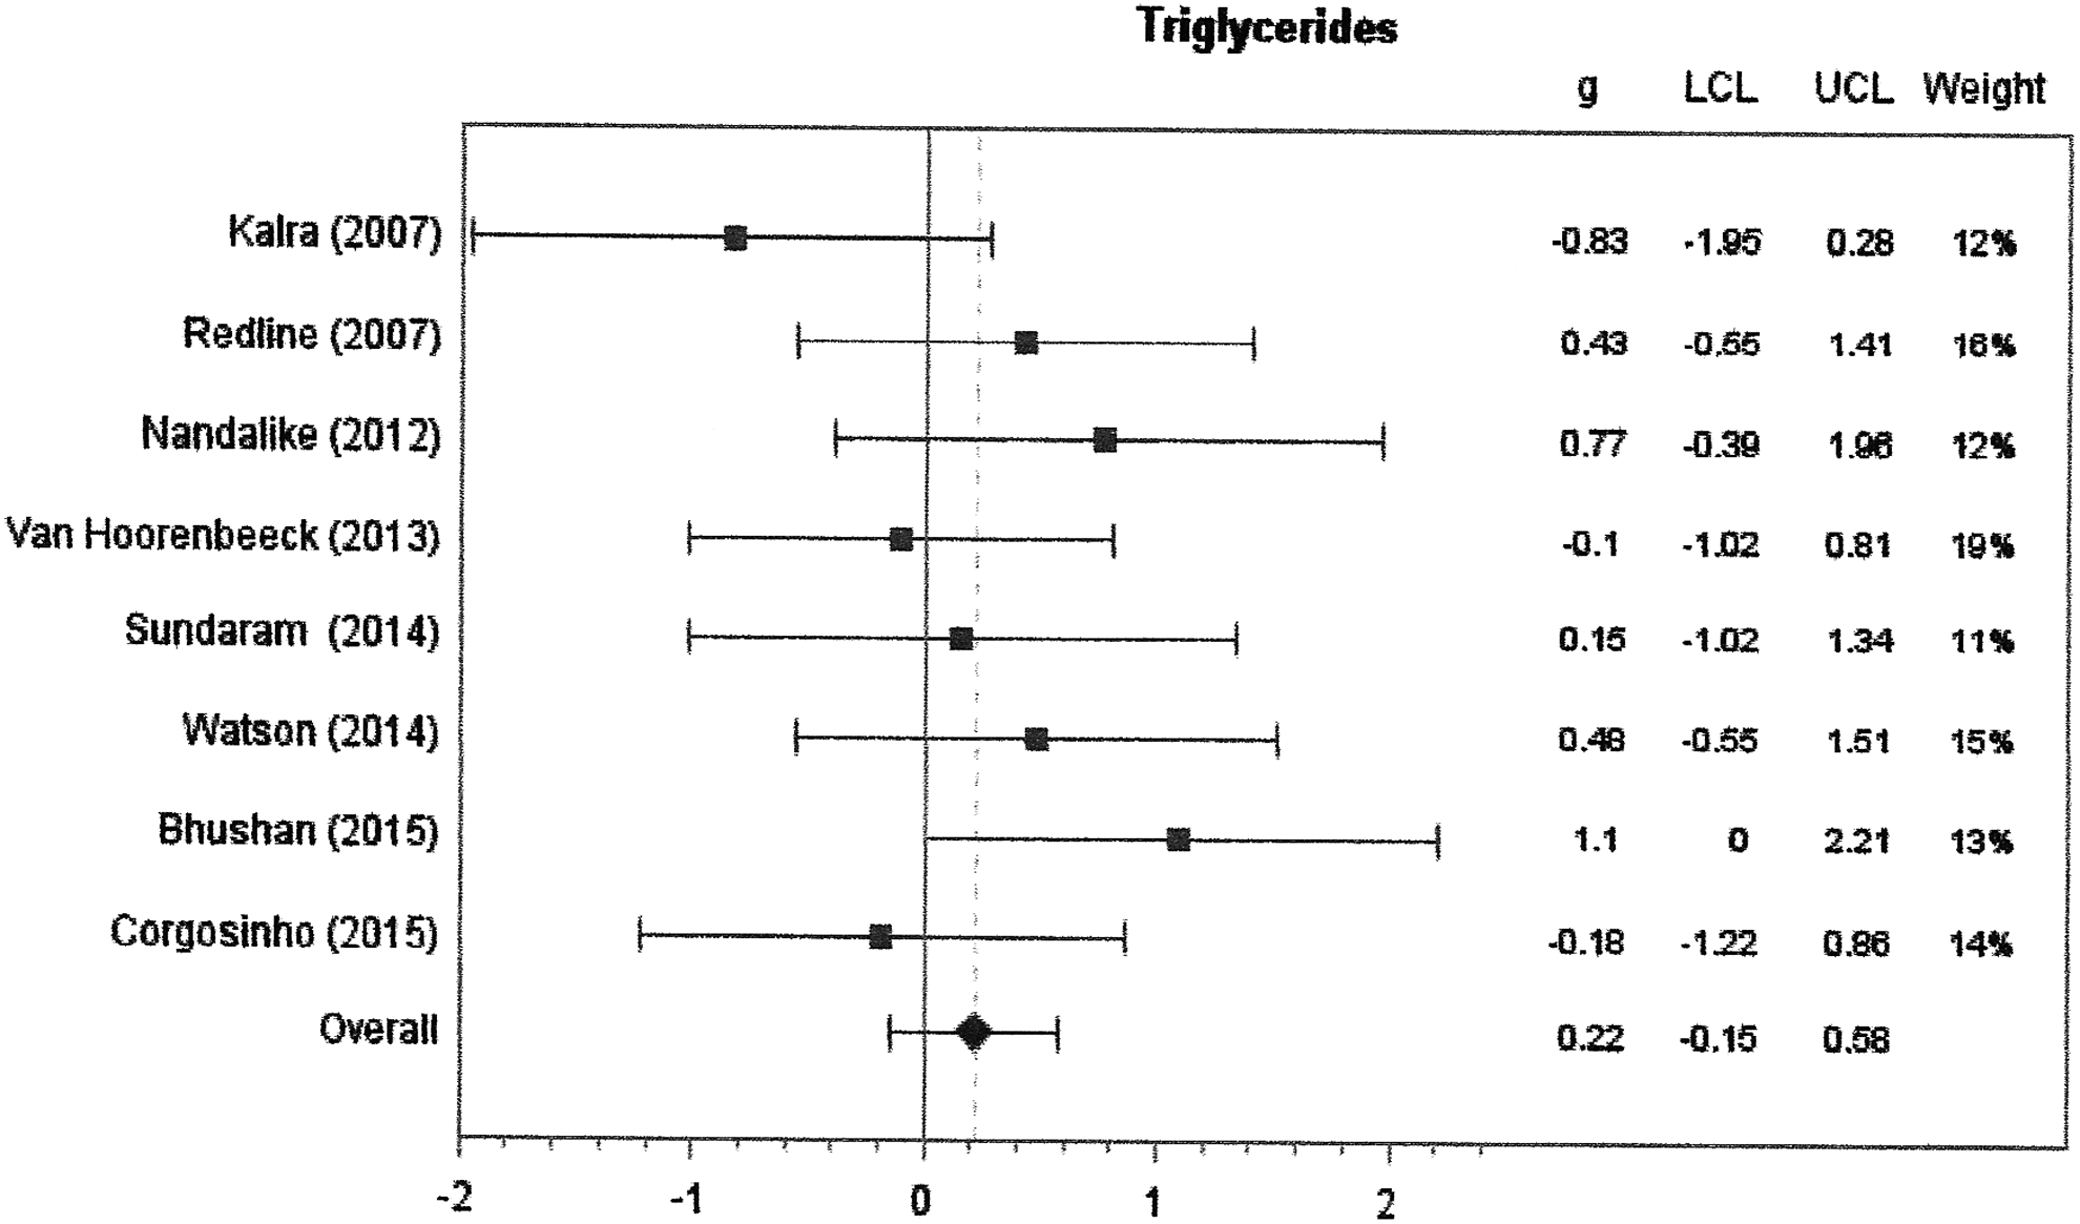
Forest plot for triglycerides. Random-effects model. The effects size statistic is Hedges' g. Values below and above 0 represent lower and higher weight scores, respectively, for OSA vs. non-OSA group. LCL, lower confidence limit; OSA, obstructive sleep apnea; UCL, upper confidence limit.
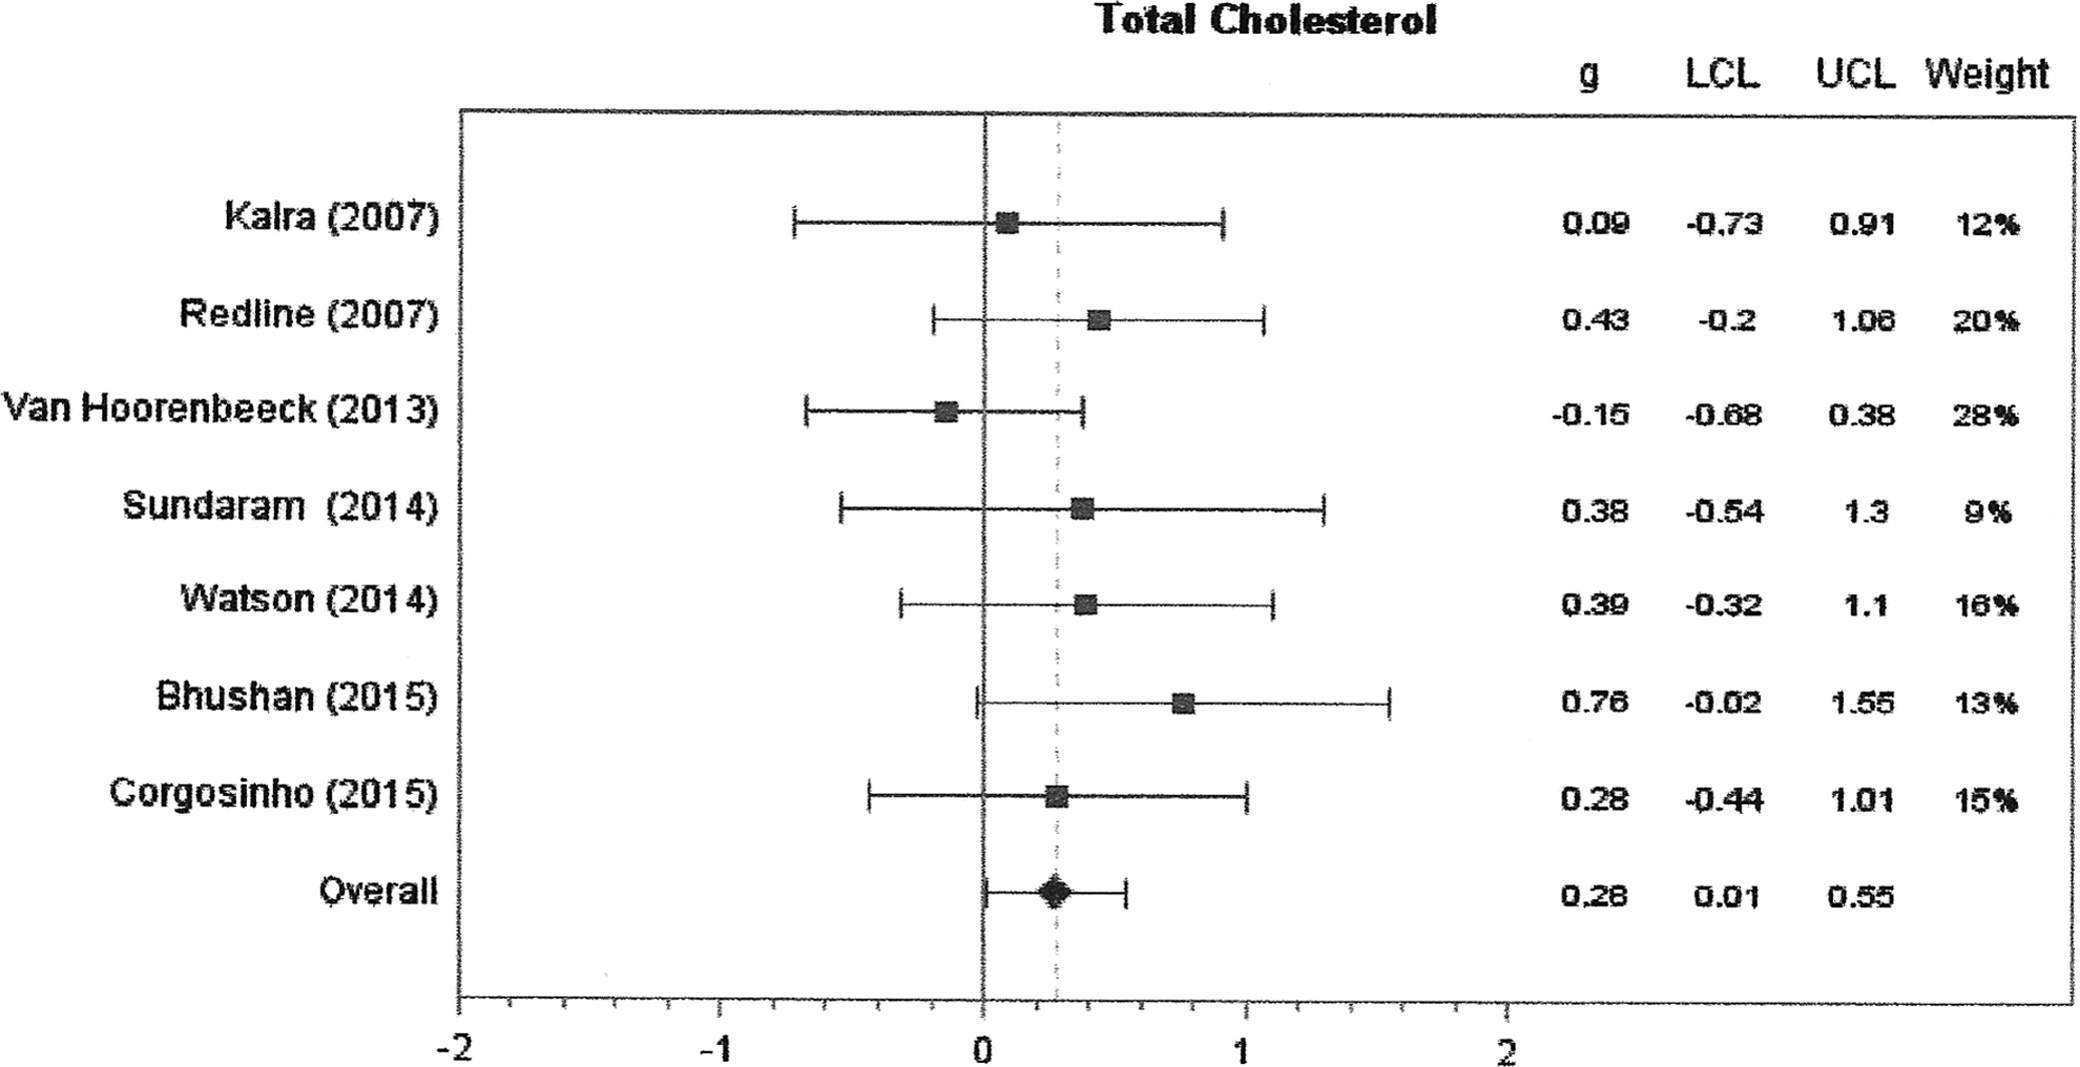
Forest plot for total cholesterol. Random-effects model. The effects size statistic is Hedges' g. Values below and above 0 represent lower and higher weight scores, respectively, for OSA vs. non-OSA group.
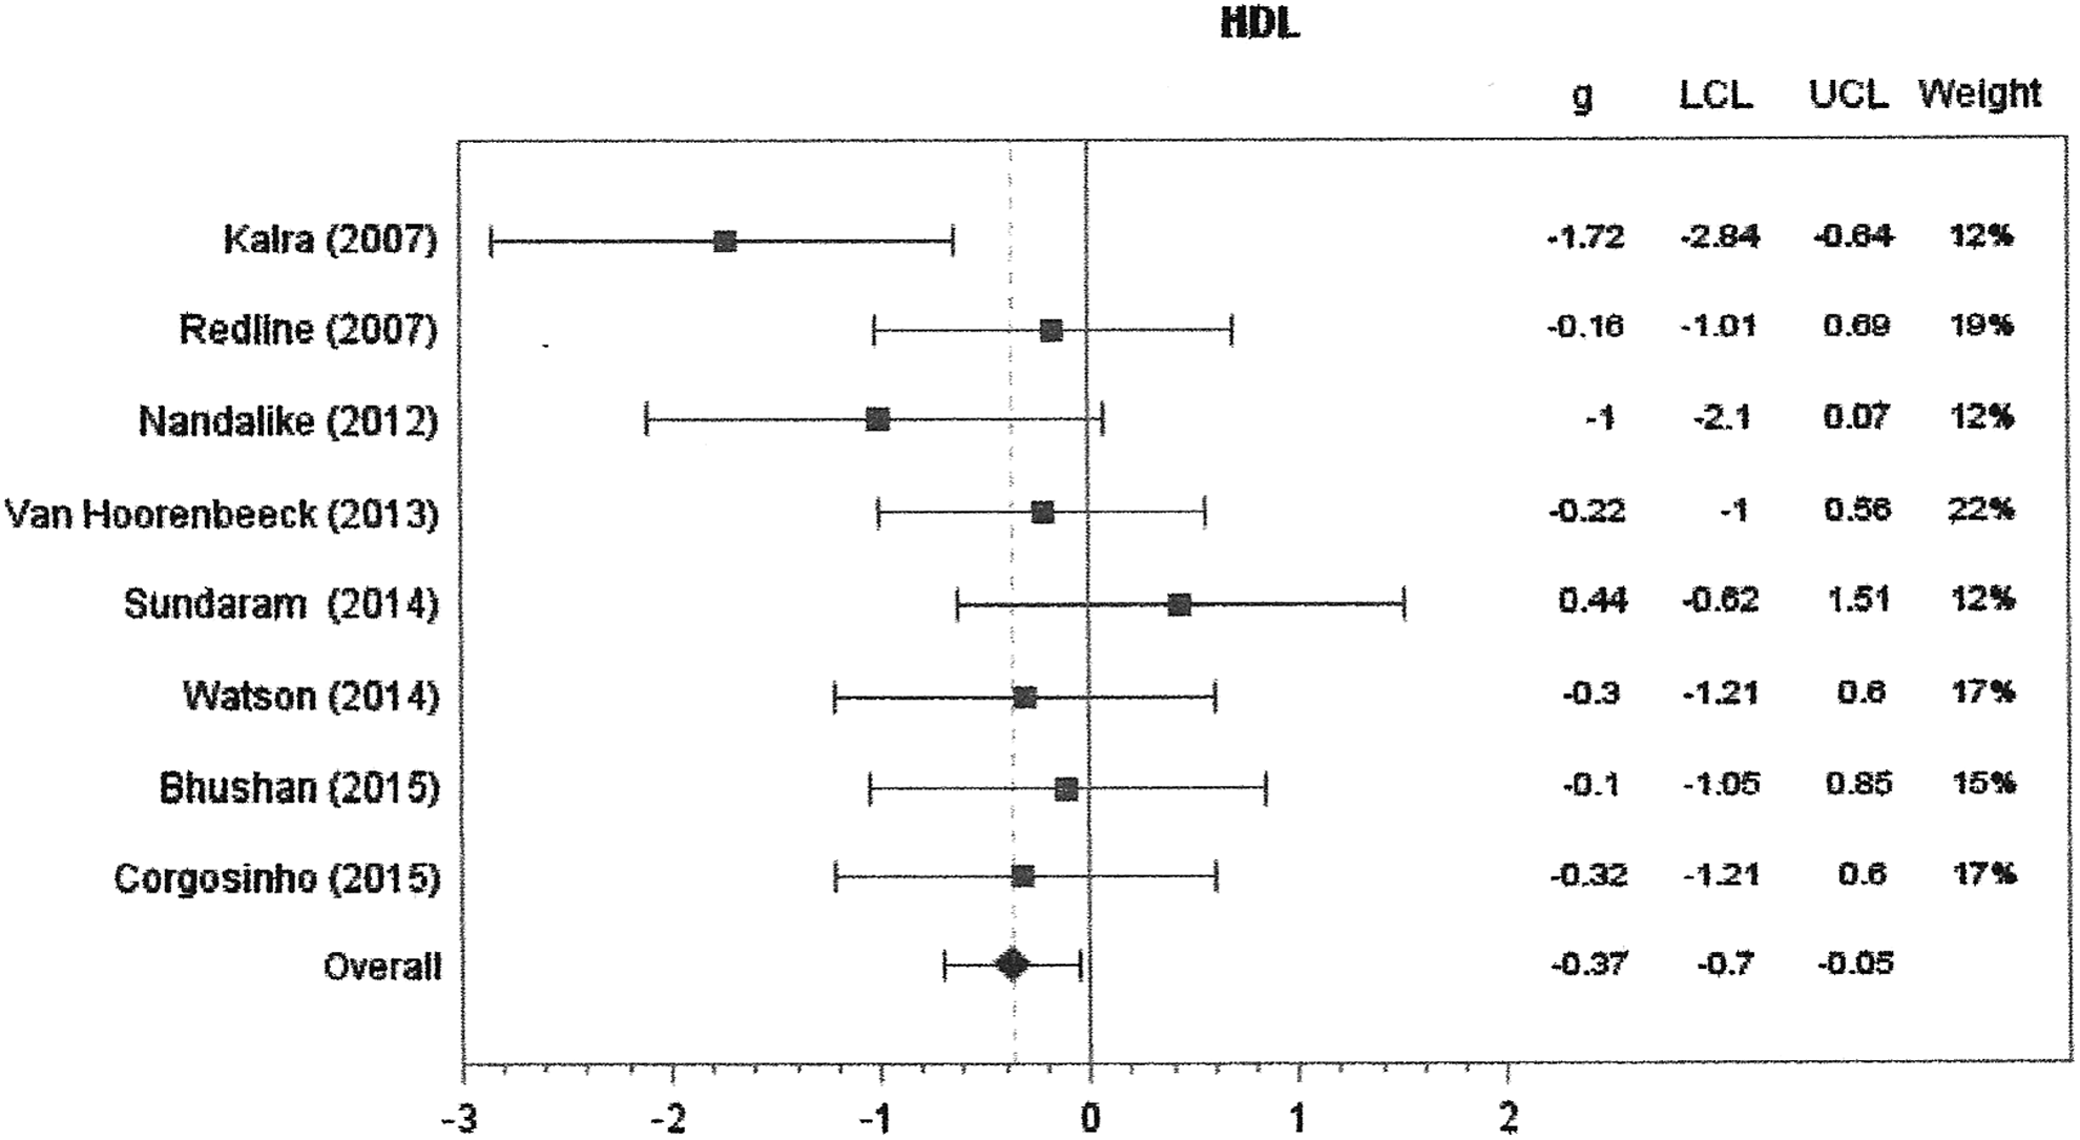
Forest plot for HDL cholesterol. Random-effects model. The effects size statistic is Hedges' g. Values below and above 0 represent lower and higher weight scores, respectively, for OSA vs. non-OSA group. HDL, high-density lipoprotein.
Insulin Resistance and OSA
Thirteen of the reviewed articles reported outcomes of insulin resistance in association with OSA. Six of these studies found an association between OSA and insulin resistance, as measured by HOMA-IR.9,16,18,24,25,27 Three of these studies performed multivariate analyses and found an association between AHI and HOMA-IR, after controlling for BMI and gender.9,16,25 In addition, in a cross-sectional study of obese, adolescent, Hispanic males, total arousal index was associated with HOMA-IR, when controlling for gender and percent body fat. However, when adiposity was controlled for with BMI instead of body fat, the relationship did not retain significance. 27 Although there was one other study that found a positive association between HOMA-IR and AHI, as well as negative association with overnight oxygen saturation (SaO2), the effect disappeared once controlling for BMI. 15 Again, the results after controlling for BMI and adiposity are important in determining the independent association of OSA and insulin resistance, since increased obesity is independently associated with insulin resistance. In addition to the cross-sectional findings of insulin resistance and OSA, in a year-long weight-loss intervention of 24 patients, there were no baseline differences in HOMA-IR between patients with and without OSA; however, at the end of the intervention, only patients without OSA had significant improvements in the measure of insulin resistance. 18 Besides the studies that reported on HOMA-IR, one study found OSA to be associated with higher fasting insulin in adolescents with obesity undergoing bariatric surgery. 19 Hannon et al. 28 also found a trend toward higher insulin resistance in their OSA group, however, the remaining four studies found no association between insulin resistance and SDB.17,26,29,30
Insulin Resistance and OSA Meta-Analysis
Insulin resistance, measured by HOMA-IR, was examined in eight studies and Figure 5 shows the forest plot. Seven of the eight studies found higher IR in OSA compared to non-OSA patients and the combined effect was large and statistically significant (g = 0.78, 95% CI = 0.25–1.31, p = 0.02, I2 = 87.8%).
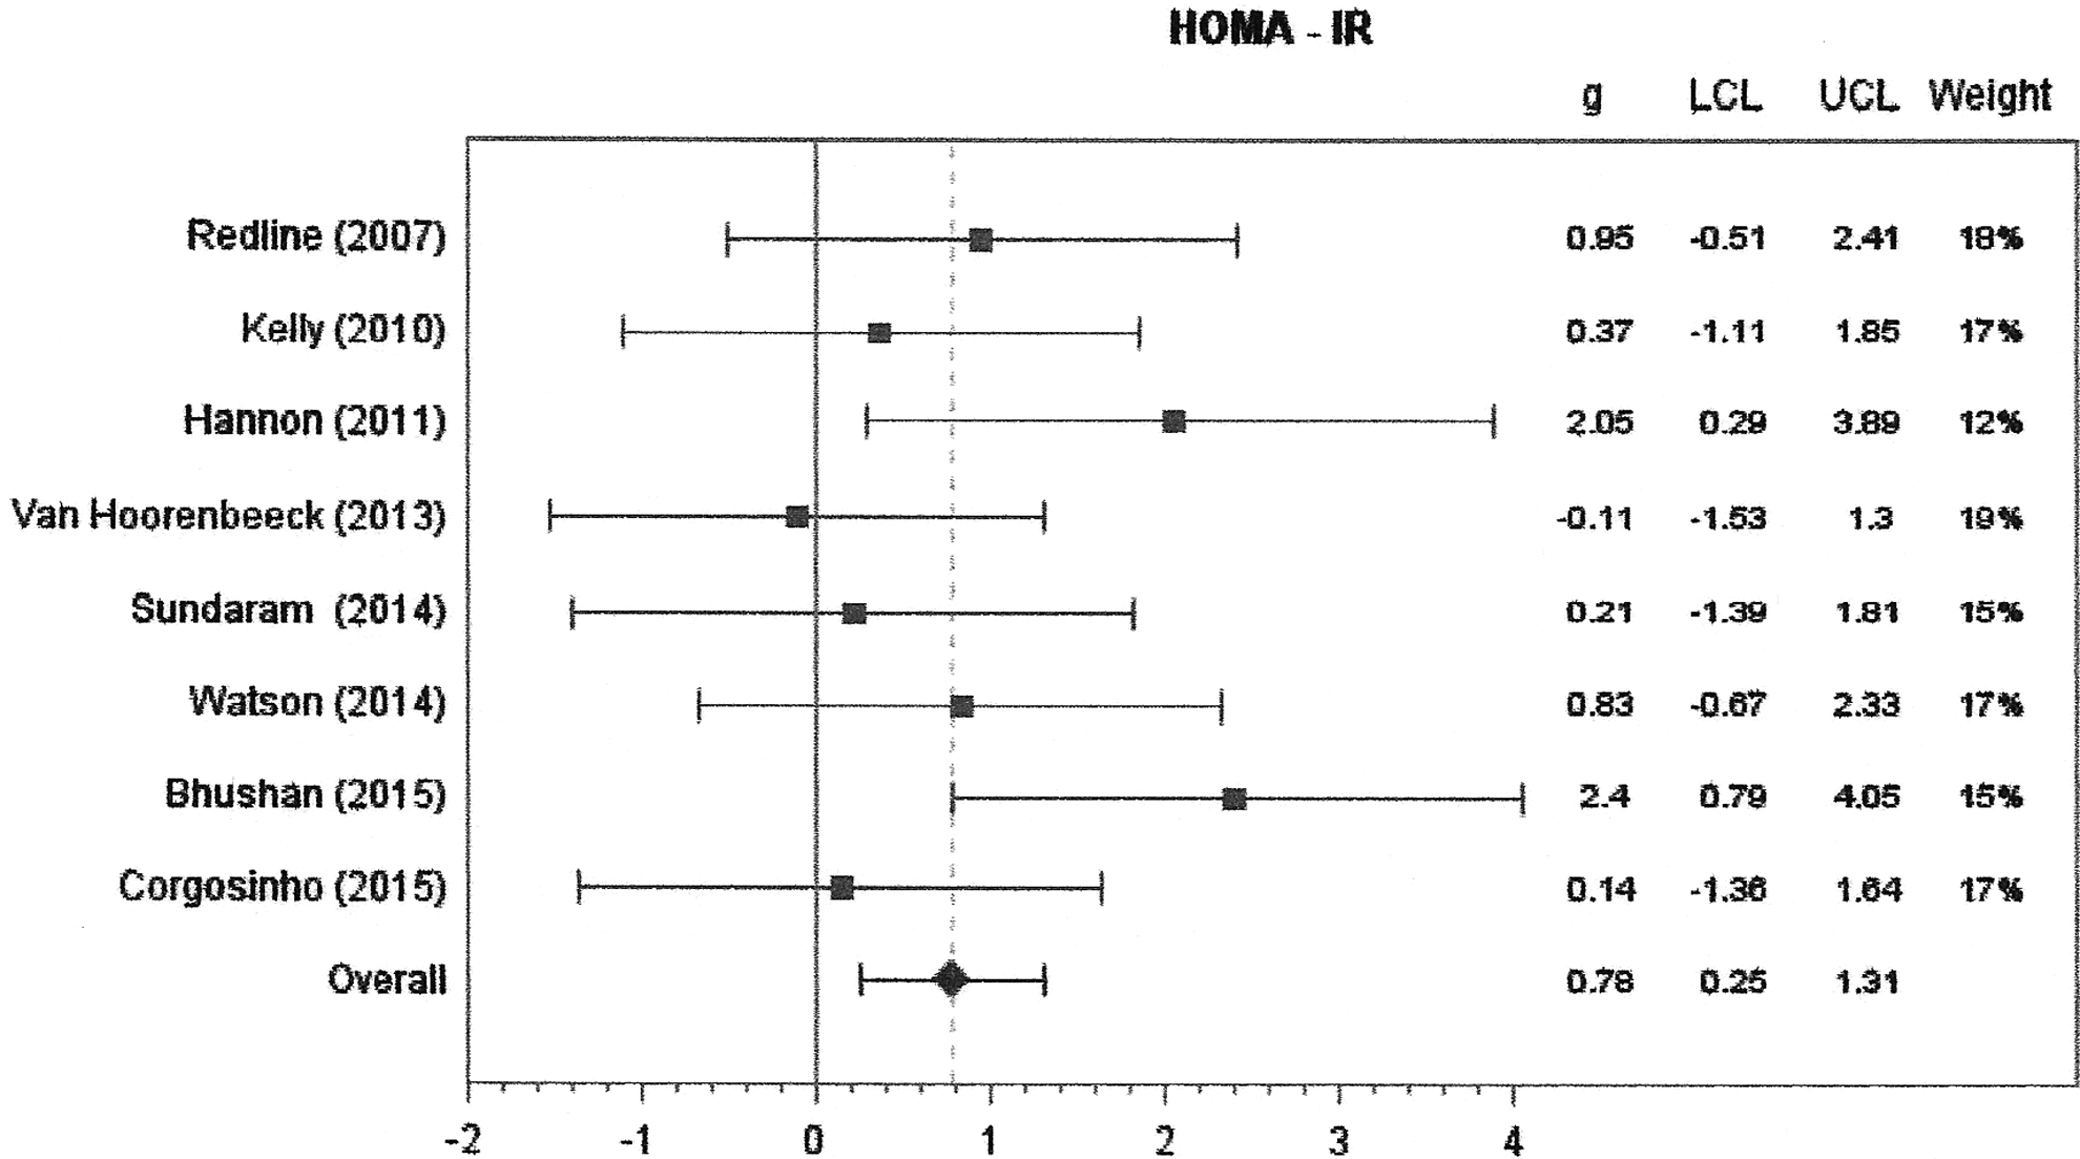
Forest plot for insulin resistance. Random-effects model. The effects size statistic is Hedges' g. Values below and above 0 represent lower and higher weight scores, respectively, for OSA vs. non-OSA group. HOMA-IR, homeostasis model assessment–estimated insulin resistance.
CVD Risk and OSA
Five of the six studies in the CVD risk category reported differences in blood pressure between adolescents with and without OSA. Two reported significantly greater blood pressure with OSA.9,24 One did not report values for blood pressure, but found a higher prevalence of hypertension in adolescents with OSA, however, they did not control for BMI, which was significantly greater in the OSA group. 29 Two studies reported no significant differences in blood pressure in adolescents with OSA.25,28 The last study did not report differences between groups for blood pressure, but rather investigated associations of OSA measures with risk of atherosclerosis and found no association. 31
CVD Risk and OSA Meta-Analysis
SBP and DBP were measured in three studies and the forest plots are shown in Figures 6 and 7. When combined, the effects were about of medium size and while the effect was larger for SBP than DBP, the former was not statistically significant (g = 0.53, 95% CI = −0.02–1.08, p = 0.10, I2 = 67.8%), whereas the latter was (g = 0.35, 95% CI = 0.04–0.66, p = 0.02, I2 = 0%) due to the greater variability in SBP. When SBP and DBP were analyzed simultaneously in a three-level meta-analysis, there was a significant medium size effect (g = 0.44, 95% CI = 0.04–0.84, p = 0.03).
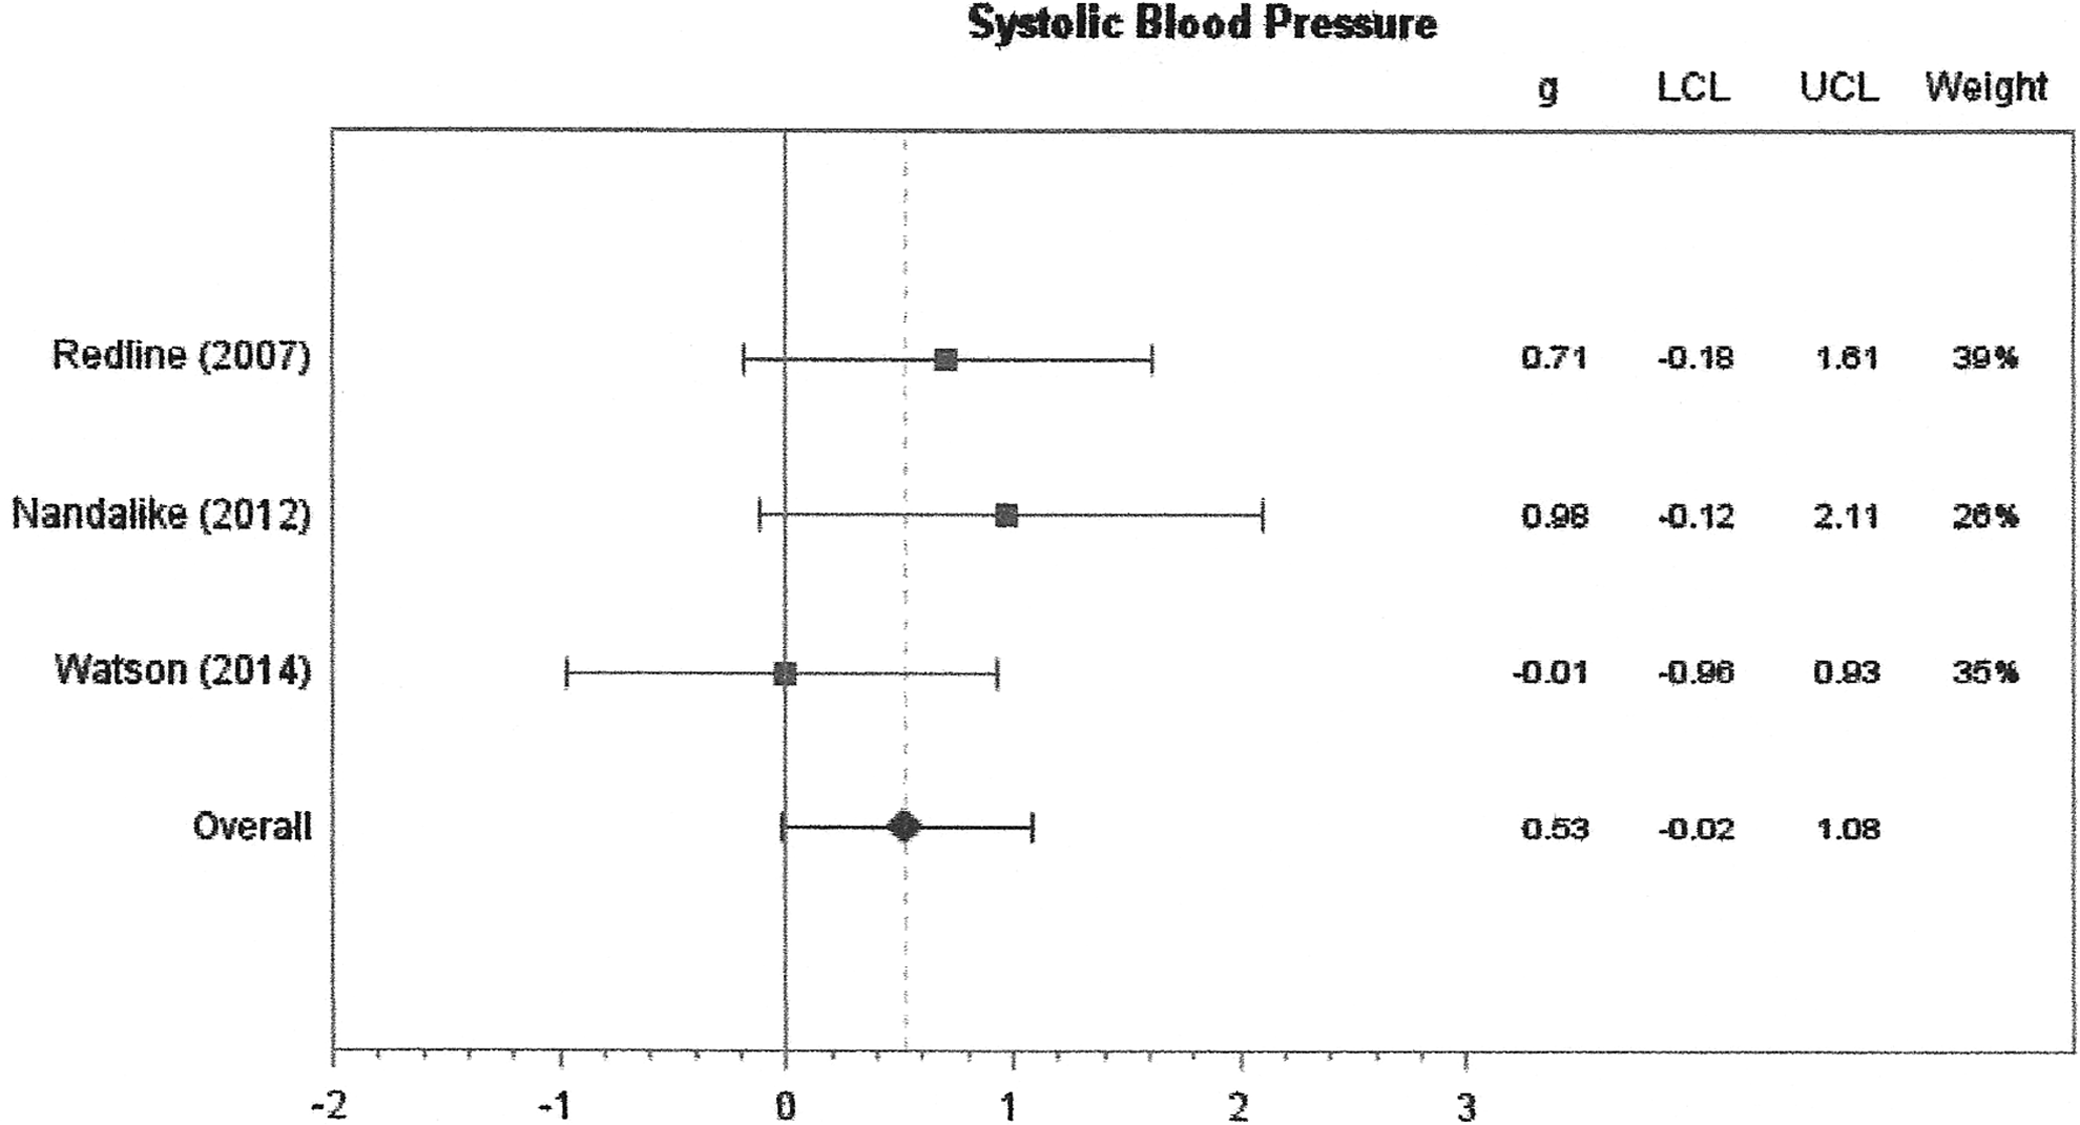
Forest plot for systolic blood pressure. Random-effects model. The effects size statistic is Hedges' g. Values below and above 0 represent lower and higher weight scores, respectively, for OSA vs. non-OSA group.
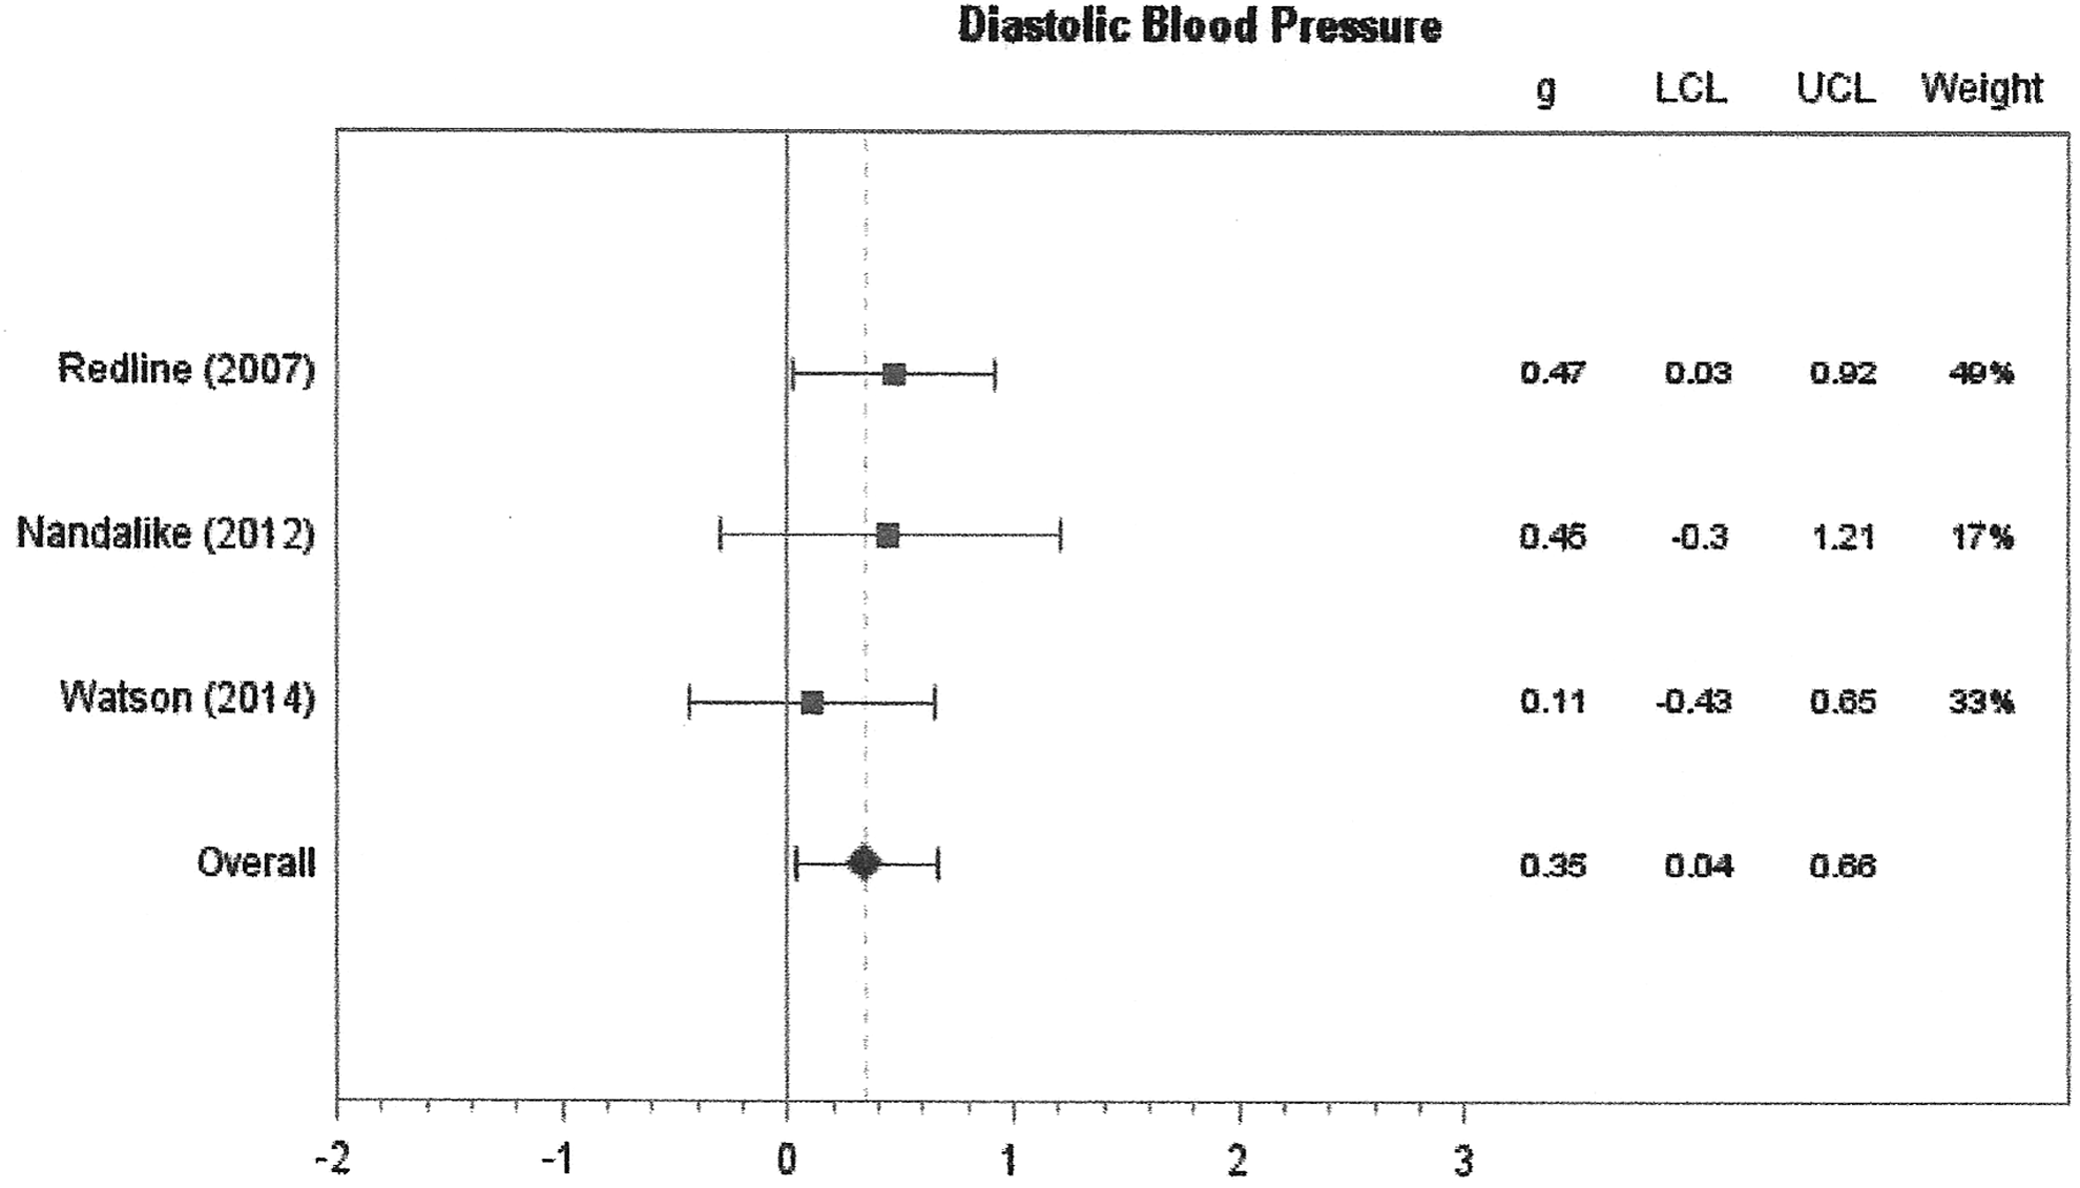
Forest plot for diastolic blood pressure. Random-effects model. The effects size statistic is Hedges' g. Values below and above 0 represent lower and higher weight scores, respectively, for OSA vs. non-OSA group.
NAFLD Risk and OSA
Three studies reported on the association between OSA and liver enzyme AST and ALT. Only one of the three studies found higher levels of AST and ALT in adolescents with obesity with OSA, 17 and AST and ALT were also correlated with oxygen desaturation index and SaO2. However, once adjusting for sex, these associations between the liver enzymes and OSA were no longer statistically significant. 17 In a study of adolescents with NAFLD, although patients with OSA did not have higher AST or ALT than those without OSA, low SaO2 during sleep was correlated with higher AST and ALT, as well as greater fibrosis in liver histology. 26 Although there were no differences in AST and ALT between groups, those with OSA did have a greater degree of liver fibrosis. 26
NAFLD Risk and OSA Meta-Analysis
Three studies compared liver enzymes AST and ALT between OSA and non-OSA patients and the forest plots are shown in Figures 8 and 9. The sizes of the effects across studies were consistent and small. For AST, the levels were similar between groups (g = 0.09, 95% CI = −0.15–0.33, p = 0.55, I2 = 0%), and also for ALT, the levels were similar between groups (g = 0.10, 95% CI = −0.14–0.33, p = 0.51, I2 = 0%). Likewise, when analyzed simultaneously in a three-level model, there was no difference between groups (g = 0.09, 95% CI = −0.08–0.26, p = 0.40).
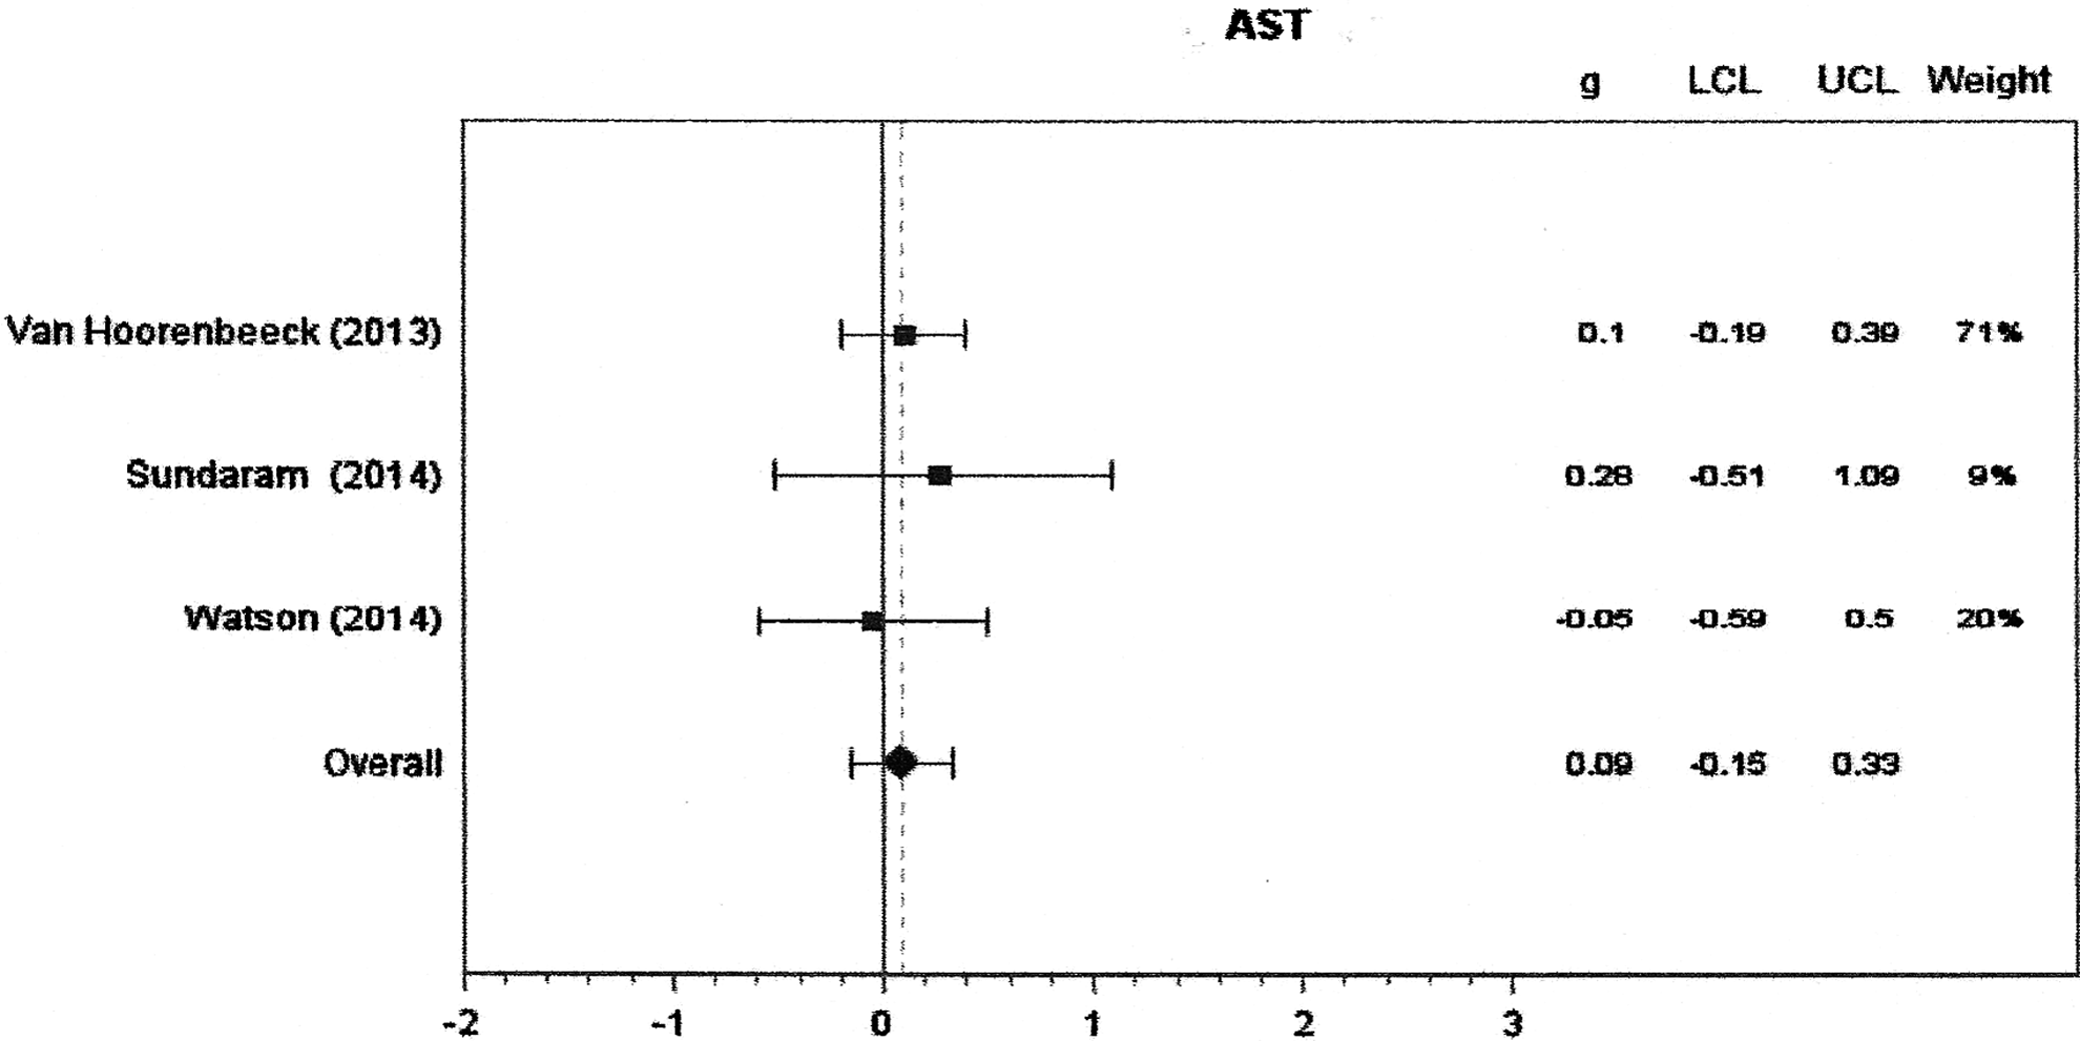
Forest plot for AST liver enzymes. Random-effects model. The effects size statistic is Hedges' g. Values below and above 0 represent lower and higher weight scores, respectively, for OSA vs. non-OSA group. AST, aspartate transaminase.

Forest plot for ALT liver enzymes. Random-effects model. The effects size statistic is Hedges' g. Values below and above 0 represent lower and higher weight scores, respectively, for OSA vs. non-OSA group. ALT, alanine transaminase.
Difficulty with Weight Loss and OSA
Four studies reported on multidisciplinary weight-loss interventions for follow-up of 3 months, 21 4–6 months,17,32 and 1 year. 18 Two of these interventions were inpatient 17,32 and two were outpatient.18,21 None of these studies found that OSA was associated with more difficulty in weight loss. However, Verhulst et al. 32 reported that baseline OSA diagnosis was associated with greater weight loss during intervention, and that severity of OSA (AHI and SaO2) was positively associated with greater weight loss and remained significant after controlling for gender, age, and initial BMI.
Other Meta-Analyses
A three-level meta-analysis was performed that compared OSA to non-OSA across all eight outcomes (triglycerides, total cholesterol, HDL-C, HOMA-IR, SBP, DBP, ALT, and AST) simultaneously. Overall, there was a statistically significant medium size effect (g = 0.44, 95% CI = 0.15–0.73, p < 0.01). A mixed meta-regression model was run to compare if the effect sizes differed by type of risk outcomes. The omnibus test comparing the four risk types (insulin resistance, dyslipidemia, hypertension, and NAFLD) was not significant (p = 0.13) and none of the six pairwise Tukey adjusted comparisons was significant. Six studies defined OSA as equal to or above 5 and the remaining four used a cutoff that was below 5 (i.e., 1, 1.5, or 2). A meta-regression on all outcomes that resulted in the studies using a cutoff of 5 had a nonsignificant higher effects size (b = 0.09, p = 0.73). Further analysis by risk type resulted in one significant difference for dyslipidemia where studies using a cutoff of 5 had a much larger effect (b = 0.39, p = 0.01), but this should be interpreted cautiously considering the multiple testing. One other moderator investigated was the difference in the percentage of patients who were male between groups. Across all outcomes, the percentage difference male, between OSA and non-OSA groups, was not a significant predictor (b = −0.01, p = 0.56) and neither was it a significant predictor for any of the specific risk type effect sizes.
Discussion
This systematic literature review and meta-analysis show that in adolescents, OSA is associated with higher levels of triglycerides, insulin, and blood pressure, and lower levels of HDL-C. In addition, the combination of all variables showed increased total metabolic risk with OSA. Dyslipidemia, insulin resistance, and hypertension are three conditions that are hallmarks of metabolic syndrome, associated with OSA in adults. 33 Increased oxidative stress, which occurs during apneic and hypopneic events, mediates adipokines and inflammatory signaling, which then disrupts normal metabolism. 34 Metabolic syndrome is associated with increased cardiovascular morbidity and mortality, 35 so it is likely that early development of this symptomology, such as in adolescence, is associated with increased risk for overall morbidity and mortality.
The two areas where evidence still remains mixed are the associations between OSA and NAFLD and weight loss. Although the qualitative analysis indicates associations between liver enzymes and degree of fibrosis with OSA, the meta-analysis did not detect a difference between groups. This may be due to a small sample of studies, as well as the sensitivity of liver enzymes in determining NAFLD status. ALT and AST are beneficial in determining the presence of advanced fibrosis that occurs in NAFLD, but are not as beneficial in determining risk of NAFLD progression. 36 In addition, NAFLD is more prevalent in males and Hispanics. 37 Since many of the included studies had very homogeneous samples, the meta-analysis may not have provided an accurate representation for these variables. Although the results for OSA and weight loss show no relationship between OSA and weight loss in adolescents with obesity, the finding of increased weight loss by one of the studies 32 warrants further investigation. Evidence shows that sleep apnea may be associated with increased energy expenditure, 38 which may then lead to greater weight loss in these individuals if placed in identical weight-loss interventions. If this is the case, treatment with continuous positive airway pressure may decrease energy expenditure once started on the therapy, and therefore should be considered when determining energy requirements for these individuals.
Although previous studies have found conflicting results of OSA with metabolic disorder, this is likely due to mixing of pubertal and prepubertal children within individual studies, as well as small sample sizes. The combination of adolescent-only samples in this review and meta-analysis provides a more definitive conclusion on the associations of OSA with metabolic variables than the individual studies. Also, since OSA is closely associated with obesity in adolescents, 12 and obesity is a risk factor for metabolic syndrome, it can be difficult to show independent association between OSA and metabolic risk. Although a limitation of this analysis is that we were unable to control for the individual group differences in BMI, the majority of included studies found no significant difference in BMI of the OSA and non-OSA groups. Although there were two exceptions,9,16 these studies did find that metabolic risk of dyslipidemia and insulin resistance held up after multivariate analysis controlling for BMI. Therefore, by supplementing the results of the meta-analysis with the qualitative analysis, there is more evidence to support the conclusions for the association of OSA and increased metabolic risk in adolescents. Another limitation to our analysis is the variation in methodology and cutoffs for measuring OSA. Although polysomnography and polygraphy are both accepted techniques, and there is no universal cutoff for OSA diagnosis in the pediatric population, differences in both technique and cutoff may explain inconsistencies between studies. Although our analysis showed no differences between studies that used cutoff of AHI >5 and those that used lower cutoffs, we did not control for different techniques used, and therefore, differences in methodology must still be considered.
Obesity in adolescence is a known risk factor for early development of type 2 diabetes and atherosclerosis. 39 Since metabolic syndrome increases risk of CVD and diabetes independently of obesity, 40 adolescents with OSA may be more vulnerable to developing these chronic diseases. Future studies are needed to look at long-term outcomes of OSA on chronic disease risk in adolescents as they progress through adulthood. Currently, OSA is underrecognized and underdiagnosed in primary care settings. 41 Evidence of the relationship between severity of OSA, developed in childhood or adolescence, and long-term health outcomes is essential for increasing attention to pediatric OSA.
Footnotes
Acknowledgment
This project was supported by the Netter SOM at Quinnipiac Univ. Summer Research Fellowship (Z.W.P.).
Author Disclosure Statement
No competing financial interests exist.