
Abstract
Abstract
Background:
Childhood obesity-related metabolic derangements are increasing among South Asian populations. Dietary and physical activity plans have limited effect. This study aims to assess the effectiveness of metformin in the management of obesity among 8- to 16-year-old children in Gampaha District of Sri Lanka.
Materials and Methods:
A triple-blinded controlled trial was conducted on 150 obese school children. After 12-hour overnight fast, blood was drawn for fasting blood glucose (FBG) and lipid profile. Anthropometry, fat mass (FM), and blood pressure were measured. BMI and insulin resistance were calculated. Children randomly received either metformin (8–10 years—500 mg 12 hourly; 11–16 years—1 g 12 hourly) or placebo. Anthropometry and blood investigations were repeated at 6 and 12 months. Mean difference in outcome measures, adjusted for baseline values, was compared using ANCOVA.
Results:
There were 84/150 boys. Metabolic syndrome was present in 25 (16.7%). A statistically significant adjusted mean reduction was observed in the metformin group compared with placebo, in weight (−0.991 vs. 1.394, p = 0.000), BMI/Age-standard deviation score (SDS; −0.287 vs. −0.116, p = 0.000), %FM/Age-SDS (−0.092 vs. 0.016, p = 0.04), systolic blood pressure (SBP; −0.415 vs. 0.015, p = 0.015), total cholesterol (−0.95 vs. −0.7, p = 0.001), low-density lipoprotein (−0.67 vs. −0.45, p = 0.001), and highly sensitive C-reactive protein (−1.36 vs. 0.08, p = 0.013) at 6 months, and in BMI/Age-SDS (−370 vs. −0.222, p = 0.001), WC/Age-SDS (−0.473 vs. −0.337, p = 0.018), SBP (−0.834 vs. −0.477, p = 0.023), and triglycerides (−0.33 vs. −0.14, p = 0.019) at 12 months.
Conclusions:
Metformin compared with placebo has beneficial effects on anthropometric and metabolic indicators in the management of childhood obesity.
Introduction
Obesity, one of the primary risk factors for noncommunicable diseases (NCDs), is spreading in epidemic proportions all over the world and fast penetrating into the pediatric population. Globally, it was estimated that a total of 107.7 million children were obese in 2015. Since 1980, the prevalence of obesity has doubled in many countries. Although absolute numbers of childhood obesity is low compared with adults, the rate of increase is alarmingly high among children than adults. 1
In most countries, the prevalence of obesity is seen to be high among 2–4-year olds and declines to the lowest among 10 and 14 years before it rises again. Between 1980 and 2015, there was a significant relative increase of 20% in the prevalence of obesity in countries with low sociodemographic index. During that period, the highest rates of increase were observed in countries with a middle sociodemographic index. 1 Globally, 18% of children and adolescents aged 5–19 were overweight or obese in 2016 and the prevalence of obesity in Sri Lankan children of this age group was 4.8% in 2016. 2 Although the national rates of childhood obesity are still low in Sri Lanka, there are certain areas that show increased prevalence. Data from the Colombo municipal area showed overweight and obesity to be about 14% among 8- to 12-year-old school children 3 and in the Colombo district to be about 13% among 5- to 15-year-old children. 4
Childhood obesity is a major risk factor for the development of adult obesity and many NCDs such as diabetes, hypertension, dyslipidemia, and some forms of cancer later in life. 5 Pathophysiology of these metabolic derangements is found to be driven by excess body fat. 6 The body fat mass (FM) of Sri Lankan children (South Asian origin) is high compared with children of other parts of the world and the present BMI cutoff values underestimate the prevalence. 7 Insulin resistance among Sri Lankan children is also high. 8 Consequently, both these factors could be the reason for high prevalence of obesity-related metabolic complications among 5- to 15-year-old Sri Lankan children. 4
The mainstay of management of childhood obesity is based on lifestyle modification. Although dietary modification and increased physical activity are the main components, long-term compliance to them remains very poor. While some of these programs have shown to be effective in improving anthropometric parameters, their effectiveness in improving the body composition and reversing the insulin resistance and metabolic derangements remain unclear. Therefore, different pharmacological agents have been used to treat childhood obesity and its complications as adjunct mode of therapy. Metformin is presently being used in the management of diabetes mellitus in children 9 and shown to be safe. 10 Metformin a biguanide derivative acts at different stages of glucose metabolism. 11 Furthermore, it has been observed to reduce lipogenesis and food intake by increasing glucogen-like peptide. 12 Although the FDA and World Health Organization (WHO) have approved metformin to treat type 2 diabetes mellitus in children, it is not licensed to be used in the management of childhood obesity. 13 However, it is one of the commonly used off-label medications in the management of childhood obesity. 14
Park et al. 15 in a meta-analysis showed that metformin reduces BMI and insulin resistance in children and adolescents in the short term, and recommended to carry out long-term studies. Another meta-analysis of 11 trials showed that metformin had an effect on reducing the BMI and insulin resistance. 16 Pharmacotherapy has a place as an adjunct to lifestyle modification in the management of obesity. 17 However, most of the data are available from small studies and no data have emerged from South Asian populations where insulin resistance is high. Several studies have also shown the beneficial effects of metformin on body weight, body composition, glucose homeostasis, and metabolic parameters at 3 and 6 months after treatment.10,18–21 However, the small sample size and shorter duration of treatment have been major factors limiting the usefulness of their findings. Therefore, studies of longer treatment period and on diverse populations are needed to establish its effect.
Empirical evidence shows that Sri Lankan children develop obesity-related metabolic complications with insulin resistance at a younger age and metformin could be a useful adjunct therapy in this population. Therefore, we designed this study to assess the usefulness of metformin in the management of obesity in a group of Sri Lankan children and adolescents. The primary objective was to assess the effectiveness of metformin treatment for 6 and 12 months in reducing the BMI/age standard deviation score (BMI/Age-SDS) and percentage fat mass for age SDS (%FM/Age-SDS) in 8- to 16-year-old obese children and adolescents. Secondary outcome measures assessed were improving the waist circumference/Age-SDS (WC/Age-SDS), waist circumference to height ratio (WHtR), height/Age-SDS, fasting and 2-hour blood glucose and serum insulin, insulin resistance, systolic and diastolic blood pressure SDS (SBP/Age-SDS and DBP/Age-SDS), and cardiovascular risk.
Materials and Methods
Study Design and Setting
Study methods are reported according to the Consolidated Standards of Reporting Trials (CONSORT) statement. A triple-blinded placebo-controlled clinical trial was conducted in the Negombo educational zone in the Gampaha District of Sri Lanka.
Study Population
Obese (BMI/Age-SDS ≥+2SD, WHO 2007) 22 8- to 16-year-old children were identified through a separate screening program carried out in schools in the Negombo educational zone and invited to participate. Children of non-Sri Lankan origin, planning to migrate within a year, or having a secondary cause for obesity were excluded.
Sample Size
Sample size was calculated to detect a between-group difference of 0.1 BMI/Age-SDS (SD = 0.21), as reported by Kendall et al. 18 with 80% power and 95% confidence among obese children. Calculated sample size of 60 participants in each group was adequate to detect this estimated difference with a power of 80%.
Data Collection Method
The study was conducted at the Diabetes Screening and Vocational Training Centre of the Lions Club of Negombo Host, Negombo, by appointment. Informed written consent was obtained from the parents and assent from children. After obtaining consent, participants were stratified according to age groups, 8–10.99 years and 11–16 years, and were registered and assigned a stratum-specific registration number sequentially by one research assistant. Stratification was done for dosing purposes.
Baseline assessment was done after a 12-hour overnight fast. Height, weight, and WC were measured using a standardized protocol. The FM was assessed by bioelectrical impedance assay (BIA) using a platform-type InBody 230® instrument (InBody®; Biospace, South Korea), and %FM was expressed as a fraction of total body weight. The measurement obtained by the InBody 230 machine had been validated against locally developed BIA prediction equation. 23 Blood pressure was measured using a mercury sphygmomanometer in seated position after 10–15-minute rest.
Blood was drawn to assess fasting blood glucose (FBG), serum total cholesterol, low-density lipoprotein cholesterol (LDL-C), high-density lipoprotein cholesterol (HDL-C), triglyceride, insulin, alanine transaminase (ALT), aspartate transaminase (AST), and highly sensitive C-reactive protein (hs-CRP). The Oral Glucose Tolerance Test (OGTT) test was performed after administering anhydrous glucose 1.75 g/kg body weight to a maximum of 75 g and blood was drawn 2 hours later for random blood glucose (RBG) and serum insulin. Serum was separated immediately and stored at −20°C and analysis was conducted at the biochemical laboratory of the same center in batches. Blood was drawn after applying lignocaine (Emla®) anesthetic cream. Insulin resistance was calculated using the homeostatic model [HOMA-IR = fasting blood sugar (mU/mL) × fasting insulin (mmol/L) ÷22.5]. 24
Pubertal staging was assessed using visual charts. 25 Girls were shown a diagram depicting stages of growth of breasts and pubic hair and were asked to match it with their own. Similarly, boys were shown diagrams of external genitalia and pubic hair and were requested to match. The size of the testis was measured by the examiner using the Prader orchidometer. Wherever subject and parents were not sure of the staging, with consent, the examiner assessed to identify the correct pubertal stage. Female and male investigators carried out measurements and examinations in girls and boys, respectively, and in most of the instances, the investigators verified the results on the request of parents.
Randomization
Following the baseline assessment, participants in each age stratum were separately randomized into two parallel treatment arms to receive one of the two management protocols on a 1:1 basis using random numbers generated by the principal investigator using Microsoft Excel 2010. Management protocol I comprised structured diet+physical activity+metformin and protocol II comprised structured diet+physical activity+placebo. Participants received the treatment allocated to them, packaged by the dispenser, according to their trial registration number. Except for the dispenser and principal investigator, the whole study team, children, and their caregivers were blinded to the treatment protocol.
Dietary and Physical Activity Advice
A trained nutritionist gave dietary advice based on food-based dietary guidelines published by the Ministry of Health, Government of Sri Lanka. 26 Age-based portion size guide was provided to parents and children to guide them on the variety and volume they should be eating. Physical activity training was conducted by a qualified physical activity instructor. A daily physical activity routine of 20–30 minutes was given to each child. The workout program was changed to one of four workout plans every month to break the monotony. Weekly physical activity sessions of 1-hour duration were conducted for the participants of both groups. Participants were given a physical activity diary to maintain and to ensure adherence to the physical activity plan at home. During the weekly sessions, the adherence to physical activity plan was assessed and ensured.
Prescribing Medication
Children, 8–10.99 years, received metformin 250 mg daily for a week and increased to 250 mg twice daily for a week and thereafter 500 mg twice daily. Eleven- to 16-year-old children received 500 mg of metformin daily for 1 week and increased to 500 mg twice daily for a week and thereafter 1 g twice daily. Children were asked to take metformin with their morning and evening meals to reduce gastrointestinal side effects and risk of hypoglycemia. The State Pharmaceutical Manufacturing Corporation, Sri Lanka, manufactured metformin and placebo and both tablets look similar except for the active pharmacological compound in one.
The children were reviewed 2 weeks after commencement of therapy. Thereafter, they were reviewed monthly to ensure compliance and identify and address any adverse events, and medication was dispensed. In addition, they were contacted via telephone, weekly during the first month and fortnightly afterward to address concerns/issues and also to motivate them to maintain compliance at the highest level. Participants maintained a medication diary and recorded the medication intake there. They were reviewed at the clinic monthly, during which the compliance was assessed and reinforced. At each monthly visits, anthropometry and body composition were assessed, while blood investigations were repeated at 6 and 12 months.
Assessment of Dietary Intake
Dietary intakes of macronutrients and selected micronutrients of the children were assessed using a self-administered, validated, semiquantitative food frequency questionnaire (SQFFQ). The questionnaire contained 87 food items of 11 food groups commonly consumed by the study population.
All subjects, with the help of their parents, completed the SQFFQ at 0, 6, and 12 months of the study. The nutritionist provided instructions how to fill the questionnaire with some examples, using common household measures.
Food intakes of the individual subjects were converted to energy, macro- and micronutrients using food composition analyzing software FoodBase 2000 (Institute of Brain Chemistry, United Kingdom), which contained the nutrient composition of common Sri Lankan foods and mixed dishes.
Statistical Analysis
The statistician was blinded to the type of treatment received, and code breaking was done after completion of the analysis. Data were analyzed using SPSS version 20 software. Initially, the baseline characteristics were compared between the two groups. Clinical and biochemical outcomes at baseline, 6, and 12 months were presented using means and SDs. Parameters that showed a non-normal distribution were presented using median and interquartile range. Baseline sociodemographic, anthropometric, and metabolic characteristics between the two groups were compared using independent-samples t-test and Standard Normal Deviate (SND) test for proportions. Each primary and secondary outcome measure at 6 and 12 months was analyzed by calculating the difference from baseline and comparing the differences in the two treatment groups adjusting for the baseline value using ANCOVA. Stratified randomization was used to ensure the sex and age balance between the two groups. Furthermore, any potential confounding due to any chance imbalance in age, sex, and pubertal status was countered by inclusion of these in a secondary analysis, using these variables as covariates in ANCOVA. In this secondary analysis, whenever age, sex, or pubertal status was identified as a significant predictor on the ANCOVA model, further analysis was conducted by stratifying the data by the significant predictor variable to identify any effect modification by the predictor variable.
Definition of Metabolic Derangements
Metabolic derangements were identified as follows: WC/Age-SDS ≥+2 27 ; abnormal glucose homeostasis, if FBG >100 mg/dL or 2-hour OGTT >140 mg/dL; HDL <40 mg/dL (<1.03 mmol/L); triglyceride ≥150 mg/dL (≥1.7 mmol/L) 28 for age for both SBP SDS ≥+2SD and DBP SDS ≥+2SD. 29 Metabolic syndrome (MetS) was diagnosed in the presence of a high WC, with 2/4 other criteria being elevated (modified IDF criteria). 28
The study commenced in July 2014 and ended in November 2015. Ethical approval was obtained from the Ethics Review Committee of Faculty of Medicine, University of Colombo (EC-13-143). The Subcommittee on Clinical Trials of the Ministry of Health, Government of Sri Lanka, approved the protocol. The study protocol was registered at ClincalTrials.gov (NCT02274948).
Results
Participant Follow-Up and Adherence to Therapy
A total of 500 children, identified as obese, were invited to participate in the study. Of them, 339 fulfilled the eligibility criteria and consented to participate and were registered and randomized. Of them, 189 withdrew from the study at different stages (98 in the metformin group and 91 in the placebo group). One hundred fifty participants completed the trial and were included in the final analysis (Fig. 1). Analysis of the dropouts revealed that they were not significantly different from those who completed the trial with regard to baseline anthropometric and metabolic characteristics.
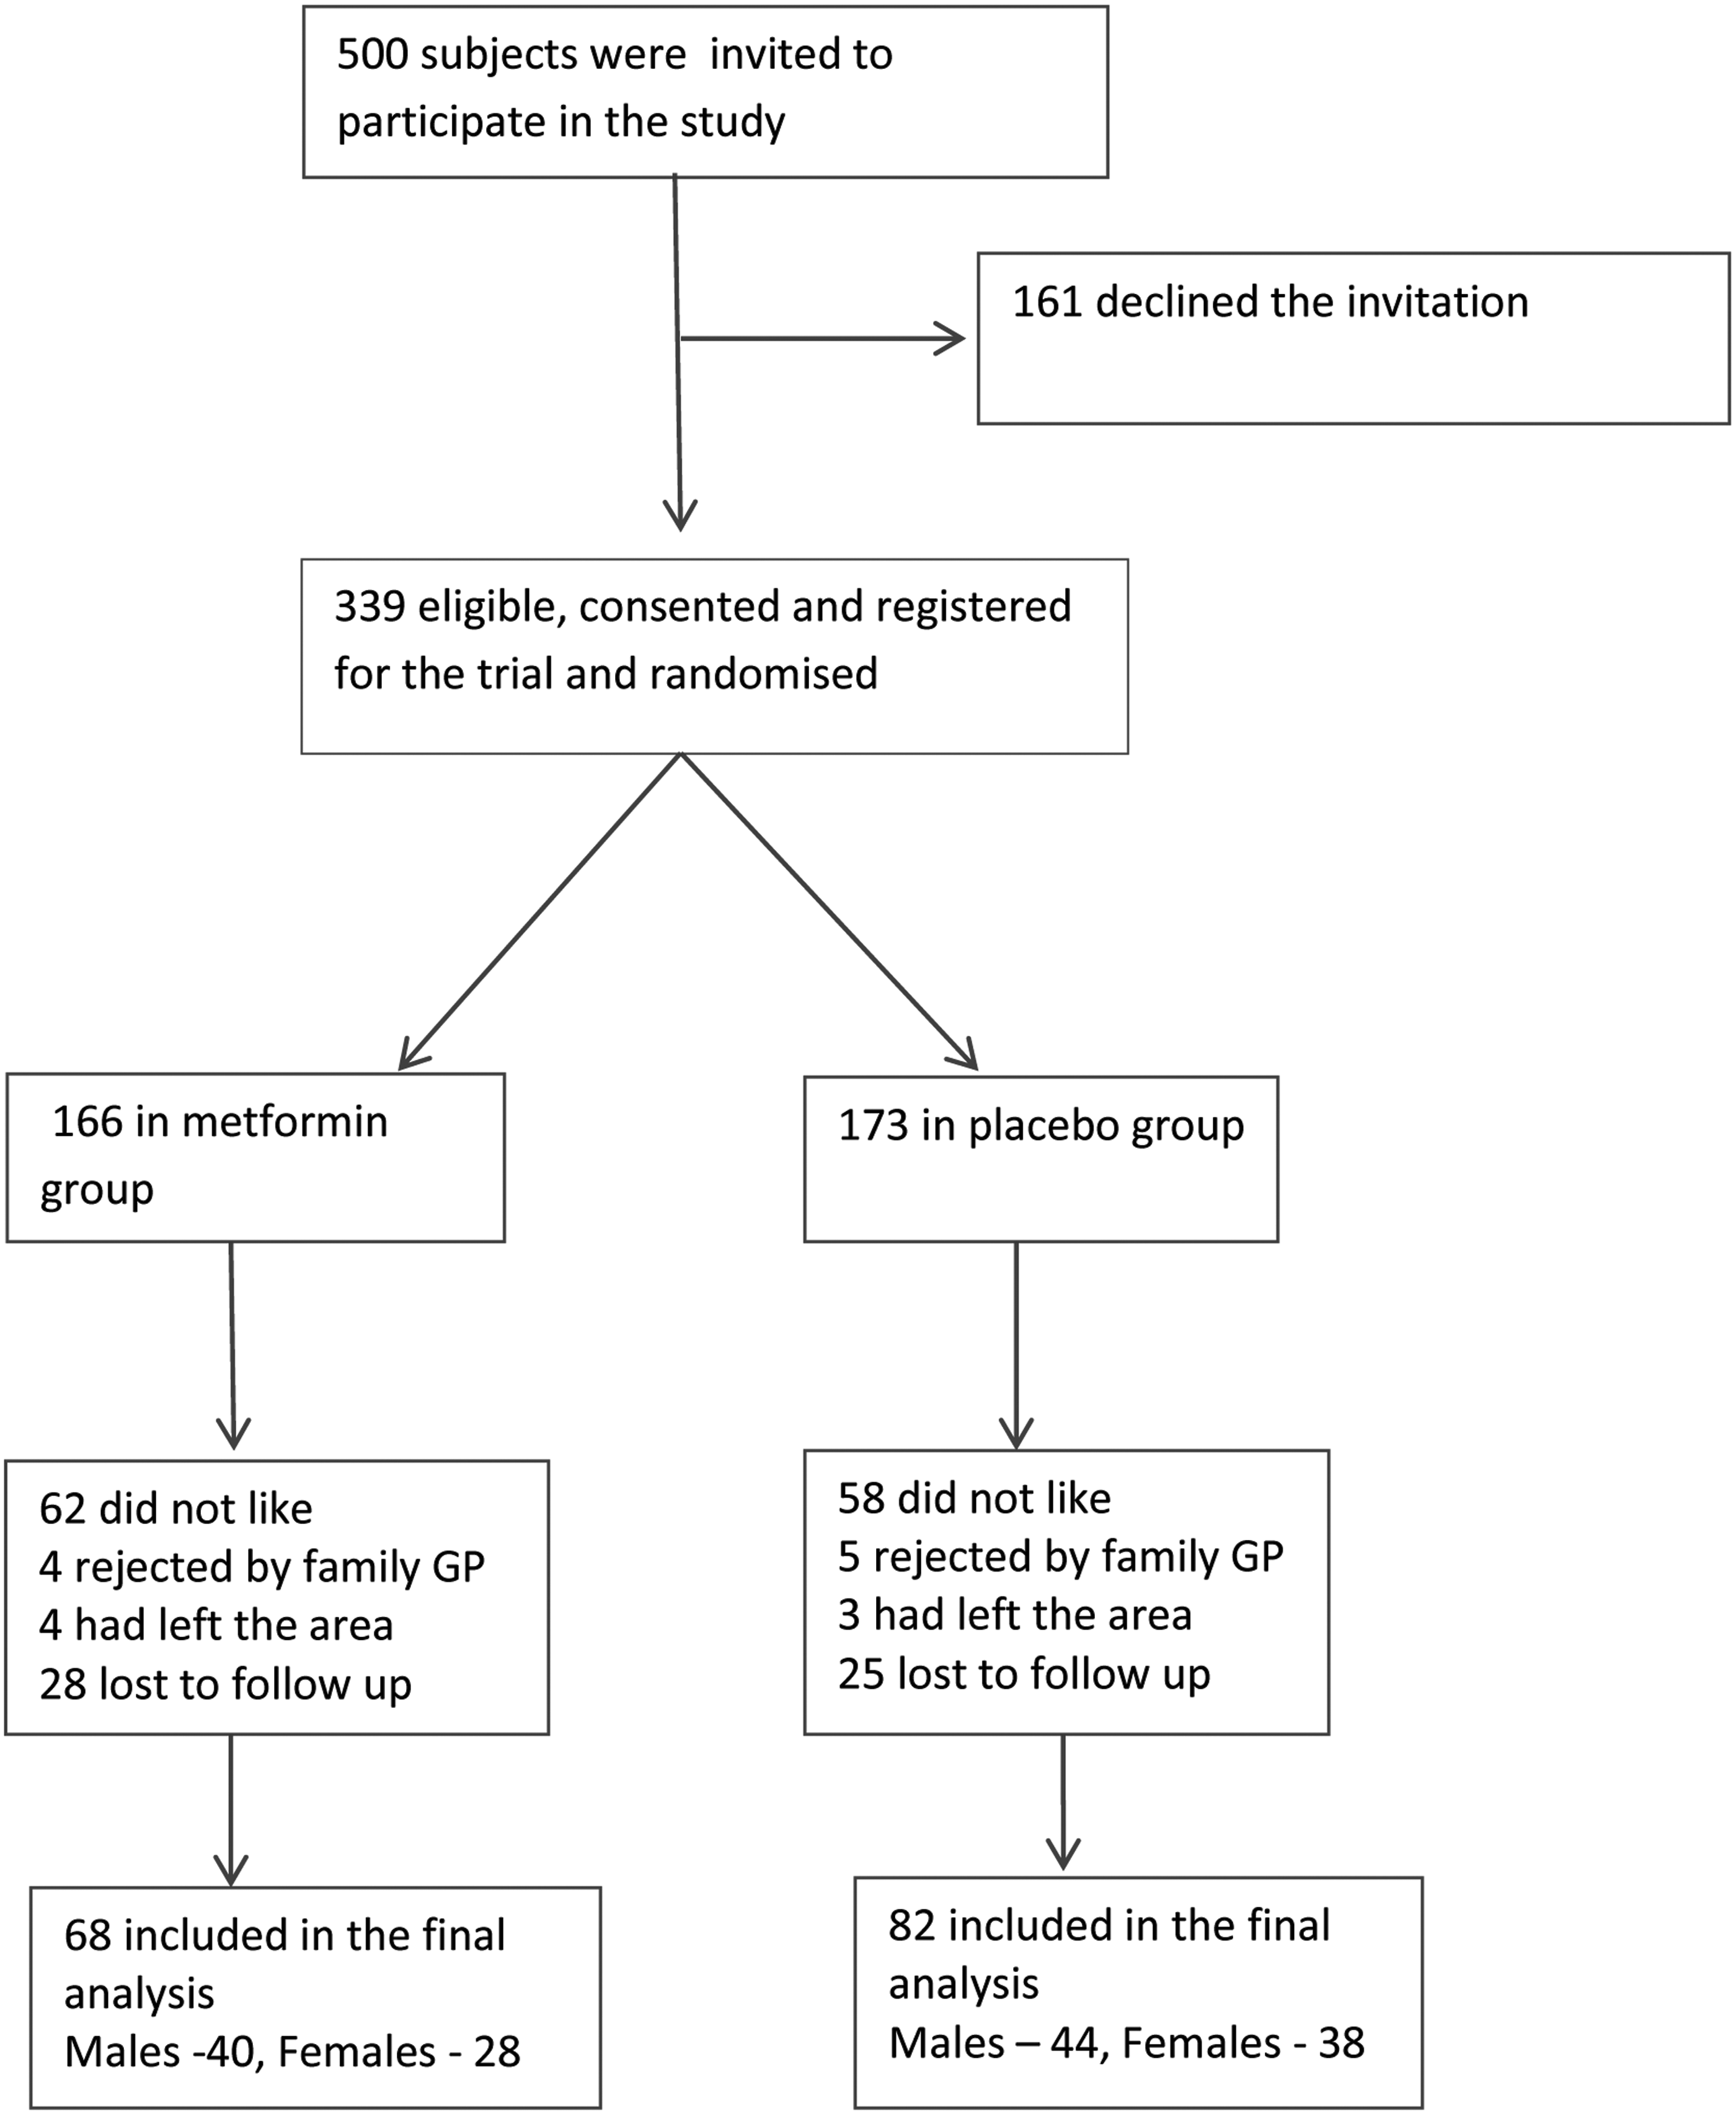
Participant flow diagram. Final analysis included 150 participants, 68 in metformin and 82 in placebo.
Baseline Characteristics
Age of the participants ranged from 8.1 to 16.0 with a mean of 12.12 (SD 2.28). Mean BMI/Age-SDS was 2.56 (SD 0.4) with values ranging from 2.0 to 4.36. There were 84 (56%) boys in the sample and 25 (16.7%) had MetS. Table 1 summarizes the baseline characteristics of the two groups and there was no significant difference between the two groups.
Baseline Characteristics of the Study Population (n = 150)
Comparison of the baseline characteristics of the metformin and placebo groups are shown. Mean and SD given for continuous variables and the number and percentage given for dichotomous variables. Statistical significance of the difference between the two groups is tested using independent-samples t-test or SND test for proportions.
Number and percentages are reported.
Median and interquartile range are reported. Statistical significance using Mann–Whitney U test.
ALT, alanine transaminase; AST, aspartate transaminase; DBP, diastolic blood pressure; FBS, fasting blood sugar; %FM, percentage fat mass; HDL, high-density lipoprotein; HOMA-IR, insulin resistance (using homeostatic model); hs-CRP, highly sensitive C-reactive protein; LDL, low-density lipoprotein; NS, nonsignificant; RBS, random blood sugar; SBP, systolic blood pressure; SDS, standard deviation score; WC, waist circumference.
Primary Outcome Measures
BMI/Age-SDS and %FM/Age-SDS
Metformin was associated with a significant reduction in BMI/Age-SDS at 6 and 12 months compared with placebo. In the metformin group, mean BMI/Age-SDS reduced from 2.58 (SD 0.39) to 2.39 (SD 0.46) compared with 2.54 (SD 0.41) to 2.42 (SD 0.41) in the placebo group (Table 2). Adjusted mean reduction of BMI/Age-SDS was −0.287 in the metformin group compared with −0.116 in the placebo group (p = 0.000) at 6 months (Table 3). Reduction in BMI/Age-SDS was sustained at 12 months with a mean of 2.21 (SD 0.52) in the metformin group and 2.32 (SD 0.46) in the placebo group. Adjusted mean reduction was −0.370 in the metformin group compared with −0.222 in the placebo group (p = 0.002).
Anthropometric and Biochemical Characteristics of the Two Groups at Baseline, 6, and 12 Months
Mean and SD of anthropometric and metabolic characteristics of the metformin and placebo groups at baseline, 6, and 12 months are shown.
Changes in Anthropometric and Biochemical Outcomes at 6 and 12 Months
Mean reduction (95% CI) of outcome measurements at 6 and 12 months, after adjusting for the baseline values, is shown for the metformin and placebo groups. Statistical significance is tested using ANCOVA.
Mean difference from baseline to 6/12 months adjusted for the corresponding baseline value.
CI, confidence interval.
Statistically significant differences between treatment and control groups are shown in bold (p < 0.05).
The %FM/Age-SDS reduced from 2.73 (SD 0.43) to 2.64 (SD 0.47) in the metformin group and from 2.81 (SD 0.43) to 2.79 (SD 0.46) in the placebo group at 6 months (Table 2). Adjusted mean reduction of %FM/Age-SDS was −0.092 in the metformin group compared with −0.016 in the placebo group (p = 0.04, Table 3). Reduction in %FM/Age-SDS was sustained at 12 months with an adjusted mean reduction of −0.139 in the metformin group compared with −0.068 in the placebo group, but this difference was not statistically significant (p = 0.131) (Table 3).
Secondary Outcome Measures
Anthropometric parameters
Weight showed a significant reduction in the metformin group compared with weight gain in the placebo group (−0.991 vs. 1.394 kg, p = 0.000) at 6 months. At 12 months, both groups showed a weight gain compared with baseline, which could be due to the growth of the children, and the weight gain was significantly less in the metformin group (0.603 vs. 3.044 kg, p = 0.001).
The metformin group showed a statistically significant reduction in WC compared with placebo at 6 months (−2.330 vs. −1.107 cm, p = 0.023) and at 12 months (−3.436 vs. −1.51 cm, p = 0.003). WHtR also showed a significant reduction at 6 months (−0.021 vs. −0.014, p = 0.045) and at 12 months (−0.035 vs. −0.025, p = 0.017).
WC/Age-SDS showed a greater reduction in the metformin group compared with the placebo at 6 months (−0.303 vs. −0.221, p = 0.093), which was not significant, but showed a significant reduction at 12 months (−0.473 vs. 0.337, p = 0.018). Height/Age-SDS failed to show a significant reduction in the metformin group compared with the placebo (−0.141 vs. −0.114, p = 0.217) at 6 months, or at 12 months (−0.213 vs. −0.147, p = 0.071) (Table 3).
Systolic and diastolic blood pressure
The metformin group showed a greater reduction in SBP/Age-SDS at 6 months (−0.415 vs. −0.015, p = 0.015) and was sustained at 12 months (−0.834 vs. 0.477, p = 0.023). However, DBP failed to show a significant reduction in either group at either point.
Blood glucose and serum insulin
Metformin was not associated with any significant reduction in the FBG or 2-hour RBG compared with the placebo either at 6 or 12 months. Similarly, fasting insulin and 2-hour insulin also failed to show any significant reduction in the metformin group compared with placebo, both at 6 and 12 months. HOMA-IR showed a nonsignificant reduction in the metformin group compared with placebo at 12 months (−1.779 vs. −0.792, p = 0.078) (Table 3).
Metabolic parameters
Both serum total cholesterol (−0.95 vs. −0.7, p = 0.001) and LDL-C (−0.67 vs. −0.45, p = 0.001) showed a significantly greater reduction in the metformin group at 6 months. However, this significant reduction was not sustained at 12 months. The metformin group compared with placebo showed a significant reduction in serum triglycerides at 12 months (−0.33 vs. −0.14, p = 0.019). Serum HDL-C levels failed to show any significant improvement in both groups.
Although the metformin group showed a significant reduction in hs-CRP compared with placebo at 6 months (−1.36 vs. −0.08, p = 0.013), the significance was not sustained at 12 months (−8.38 vs. −8.72, p = 0.469).
Serum ALT and serum AST failed to show any significant reduction in the metformin group either at 6 or 12 months.
Secondary Analysis
A secondary analysis was carried out adjusting for age, sex, and pubertal status, and did not show any result substantially different from those reported above (results shown in Supplementary Table S1; Supplementary Data are available online at www.liebertpub.com/chi). Age was identified as a significant predictor in the secondary analysis of several outcome variables, and these outcomes were further analyzed stratifying by age (8–10 and 11–16 years). A statistically significant negative effect of the treatment was seen on the height and height SDS at 12 months in the younger age group but not in the older age group. Conversely, the effect of metformin on BMI SDS, %FM SDS, and WC SDS was seen in the older age group but not in the younger age group. These results show that age acts as a significant effect modifier on the effect of metformin on these outcome variables.
Similarly, stratified analysis by sex showed that the effect of metformin on WC SDS, waist/height ratio, and SBP SDS was significantly seen in females but not in males. When stratified analysis was performed by pubertal status, the effect of metformin on %FM, %FM SDS, WC, WC SDS, and waist/height ratio was seen in pubertal children and not in prepubertal children (Table 4).
Comparison of Adjusted Mean Difference of Selected Outcome Variables between the Two Treatment Arms, Stratified by Age, Sex, and Pubertal Status
Mean difference adjusted for sex and pubertal status.
Mean difference adjusted for age and pubertal status.
Mean difference adjusted for age and sex.
Statistically significant differences between treatment and control groups are shown in bold (p < 0.05).
Dietary Intake
Dietary intake at baseline, 6, and 12 months was analyzed. The mean intake of macronutrients was similar in both groups (Table 2). Both metformin and placebo groups showed reduction in intake of all components of macronutrients, but there was no statistically significant difference in the two groups.
Adverse Events
There were no significant adverse events noted during the study period. Most common side effects were gastrointestinal and anorexia in the metformin group (37%) and placebo group (27%). Similarly, the placebo group also showed a similar pattern of side effects with lesser frequency prompting whether the nonactive ingredients in the medication were responsible for these side effects.
Compliance to Treatment
Compliance was monitored using a medication diary and was reviewed at monthly follow-up sessions. All study subjects adhered at a satisfactory level to the treatment given. No participant needed to be excluded from the analysis due to poor adherence.
Discussion
Obesity in majority is an illness caused by energy imbalance, where there is excess energy intake and low energy expenditure leading to energy surplus, which is deposited as fat for later use. It leads to the development of obesity when deposition occurs beyond a critical point. Therefore, lifestyle intervention through diet modification and exercise improvement can reduce the risk of development of obesity and its related complications. In the management of obesity, weight reduction could be achieved through adopting rigorous diet and exercise programs. However, sustainability of such is questionable and may lead to disappointing results with increasing rates of obesity and type 2 diabetes mellitus in children and adults. 30 This has led to the use of pharmacological agents in the management of childhood obesity. Metformin has gained popularity due to its effectiveness, safety, and metabolic and cardiovascular benefits.31.32 It has been extensively used in the treatment of obesity-associated polycystic ovarian disease in girls as an off-label medication and in the United Kingdom its use has significantly increased. 14 There have been many trials, of course with small sample sizes.15,16 Park et al. conducted a meta-analysis of five randomized control trials and showed a moderate efficacy of metformin in the management of childhood obesity by reducing BMI by 1.42 kg/m2 and insulin resistance (HOMA-IR) by 2.01. 15
Brufani et al. did a systematic review on 11 randomized controlled trials. Except for 3 studies, all had a sample size of less than 100 and only 1 study had a follow-up of 12 months. 16 Of these, the largest has been the Metformin Obese Children and Adolescents (MOCA) trial. 18 This systematic review showed a reduction of BMI from 1.1 to 1.7 kg/m2 compared with placebo or lifestyle intervention. Also, there was an improvement in insulin sensitivity where fasting insulin reduction varied between 3.24 and 22 μU/mL. Authors have appreciated that metformin brings only a small reduction in weight, and recommend studies of larger sample size and longer duration to determine its effects on reducing cardiometabolic risk.
In our study, the total sample had been 150 and it is the largest that had been followed up for an entire 12-month period. Although of the published, the MOCA trial had 151 at the beginning there were only 110 at the 6-month follow-up. 18
In this study, we looked at the BMI SDS and %FM SDS as the outcomes since children are a growing population and the included age range was diverse. BMI SDS and %FM SDS were used to overcome the effect of diverse age range in the sample and the confounding effect of growth. FM is the important biological factor that needs to be reduced, while BMI is the corresponding anthropometric measure that represents the change in FM. BMI and BMI/Age-SDS showed marked reduction at 6 and 12 months of follow-up compared with baseline and placebo. Compared with many other studies, we have looked at many different anthropometric markers that have shown substantial improvement. BMI/Age-SD reduction in the MOCA trial was −0.1 SD units (95% CI −0.18 to −0.02, p = 0.02) at 6 months of follow-up. Our trial showed a −0.287 SD (95% CI −0.34 to −0.235, p < 0.001) at 6 months and at 12 months −0.370 SD (95% CI −0.440 to −0.303, p = 0.002). The present study reported a reduction of −0.96 (95% CI −0.637 to −1.237) in BMI, and a similar reduction of −1.1 to −2.715 and −0.83 to −2.0216 in BMI in metformin-treated subjects was reported in previous systematic reviews. Our stratified analysis by age showed that the effect of metformin on BMI SDS was seen in the 11–16-year age group and not in 8–10-year olds. Hence, age can be considered an effect modifier on the effect of metformin on BMI SDS.
WC and WHtR, considered to be anthropometric measures closely related to metabolic risk, showed a significant reduction at both 6 and 12 months from baseline in the treatment group compared with placebo. According to the stratified analysis, the effect of metformin on WC SDS was modified by age, where a significant effect was seen at 12 months only in the 11–16-year age group and not in the 8–10-year age group. Similarly, sex had a modifying effect on the effect of metformin on WC SDS and waist/height ratio at 6 months. At both 6 and 12 months, pubertal status showed a modifying influence on the effect of metformin on WC, WC SDS, and waist/height ratio, where a significant effect was seen only in the pubertal group.
In addition to anthropometry, our study looked at body composition as an outcome. Although statistically not significant in the overall population, there was a reduction in the %FM from baseline, which was more pronounced in the metformin group. The %FM SDS showed a significant reduction in the metformin group compared with placebo at 6 months. The effect of metformin on %FM and FM SDS was significantly modified by the pubertal status, where significant effect both at 6 and 12 months was seen in the pubertal group and not in the prepubertal groups. In several previous studies,33–36 there was no significant reduction in the %FM with metformin treatment, however, significant improvements in subcutaneous fat 33 and FM 35 have been reported.
The present study showed significant effect modification by pubertal status on the effect of metformin on the %FM, %FM SDS, WC, WC SDS, and waist to height ratio, where significant effect was seen only in the pubertal age group. This is in contrary to the findings of Pastor-villaescusa et al. 36 who have reported a reduction in BMI SDS and insulin sensitivity in prepubertal but not in pubertal children. However, a single dose of 500 mg 12 hourly used in their study could be a reason for this lack of effect in the older, pubertal age group. The present study used a higher dose of 1 g bd in the 11–16-year age group, which included most pubertal children. The differential effect seen could be due to this higher dose, however, the fact that there were more subjects in the pubertal group as opposed to the prepubertal group could have also contributed to the higher statistical significance observed.
Apart from the anthropometric and body composition parameters, the cardiometabolic benefits seen were the significant improvement in total cholesterol and LDL-C and triglycerides seen in the metformin group. SBP SDS improved significantly with metformin both at 6 and 12 months. The lifestyle modifications that were brought through structured diet had provided benefits to both groups, which were similar. Therefore, this study has shown that metformin has a superior effect in modifying the metabolic profile and cardiovascular risk in obese children. Furthermore, the minimum side effects are encouraging and show its safety in children.
Height and height-SDS failed to show a significant improvement with metformin in the total sample. However, stratified analysis showed a significantly lower gain in height in the 8–10-year olds with metformin treatment at 12 months. Height-SDS also significantly reduced with metformin in 8–10-year olds at 12 months. A meta-analysis by Kuzik et al. 37 showed an increase of 1.0 cm in children given metformin. The probable explanation that could be given for the reduction in rate of growth in height in our study is due to the reduction in growth velocity. Obese children are known to have a higher growth velocity with advance bone age and early puberty. 38 The reduction in height/age SDS could be due to the reduction in the insulin levels, which promotes growth in the lower age group, whereas in the older age group, the effect of pubertal hormones would have masked that effect. However, there have been other postulated mechanisms as well and need further evaluation. 37
The main limitation of the present study was the high dropout rate. Although high dropouts can be expected in a study with a long follow-up period, in this study, the majority of the dropouts occurred during the initial period. However, when reasons were explored, it was noted that many participants were discouraged due to misinformation received from their family physicians regarding the study. This issue was addressed by informing the family physicians in the area about the study as well as the clearance that had been sought (from the Ethics Committee, Ministry of Health, and registration in clinical trials registry), and the dropout rate improved thereafter. During the rest of the study duration, small numbers of dropouts occurred in both groups gradually. These reasons and pattern of dropout showed that they were not related to the drug metformin. Analysis of the dropouts in both groups showed that they were not significantly different from those who remained in the study, with regard to baseline characteristics.
The present study explored the effect modification on metformin by some selected variables, that is, age, sex, and pubertal status using stratified analysis. However, the sample size was not powered for this subgroup analysis.
Physical activity was not assessed quantitatively as an outcome of the study, however, several precautions were taken to ensure adherence to a uniform physical activity plan in both treatment arms.
Conclusions
This study has shown that metformin showed a positive effect in the treatment of obesity over placebo. Metformin improved the anthropometric parameters both at 6 and 12 months of follow-up. Body composition improved in the metformin group compared with placebo and it was marked in the pubertal age group both at 6 and 12 months of follow-up. Metabolic parameters showed more marked improvement at 6 months than at 12 months. Metformin has shown to bring overall improvement as well as to be safe in use in obese children. Therefore, metformin would be a good adjunct to lifestyle modifications and would help in achieving some control in the management of childhood obesity. It would be interesting to assess the outcome after stopping metformin as well as design studies to determine the optimum duration of treatment that would be safe and bring maximum benefits.
Footnotes
Acknowledgments
The authors thank all the children and their parents/guardians for participating in this study. They also thank Dr. B.K.T.P. Dayanath, Consultant Chemical Pathologist, for supervising the function of the laboratory, Dr. Sumudu Palihawadana, Consultant Radiologist, for carrying out the ultrasound examination of the abdomen for hepatic steatosis, and Mr. M. Sheran Weerasinghe for managing the entire project. They also thank the following members of the research team in conducting the study: Dr. T.M.C.L.B. Thennakoon, Dr. C. Jayalath, Dr. G.L.D.L. Pradeepani, Dr. A.V.N.C. Adikaram, Dr. L.D.A.C. Arawwawala, Dr. N.S. Jayasinghe, Ms. S.A.N.M. Fernando, Ms. R.R.M.S. Sewwandhi, Ms. H.A.I. Sandamali, Ms. W.C. Kumari, Ms. B.L.S. Prasadini, Mr. R.S.R. Ranathunga, Mr. T.L. Kanth, Ms. N.Y. Watawala, Ms. K.B.G.S. Sankalpani, Ms. S. Silva Antonypulle, Ms. S.N.I. Fernando, Mr. W.G. Thusith, and Ms. S.U.S. Fernando. The study was funded by an educational grant from the Swedish Radiohjälpen “Children of the World” to Lions Club Negombo Host, Negombo, Sri Lanka.
Author Disclosure Statement
No competing financial interests exist.
References
Supplementary Material
Please find the following supplemental material available below.
For Open Access articles published under a Creative Commons License, all supplemental material carries the same license as the article it is associated with.
For non-Open Access articles published, all supplemental material carries a non-exclusive license, and permission requests for re-use of supplemental material or any part of supplemental material shall be sent directly to the copyright owner as specified in the copyright notice associated with the article.