
Abstract
Introduction:
Obesity is a major health burden in children and adolescents. One influential factor is the choice of food, which is partly determined by gustatory perception. Cross-sectional studies have provided evidence that gustatory function is reduced in patients with obesity compared to individuals with normal weight. This longitudinal study was aimed at investigating potential effects of a multimodal lifestyle intervention program on gustatory function in pediatric patients with obesity.
Methods:
Gustatory perception of five different taste qualities (sweet, sour, salty, bitter, and umami) was assessed in n = 102 patients (age 6–18) with obesity (BMI >97th percentile). Testing was performed before (T0) and after (T1) a residential multimodal weight reduction program between June and December 2015 using well-established taste strips.
Results:
Overall, identification performance increased between T0 and T1. Patients were most successful at identifying the taste quality sweet at both time points and reached higher scores at identifying umami and bitter at T1 compared to T0. Moreover, patients rated the highest concentration of sweet significantly sweeter at T1 compared to T0.
Conclusion:
Gustatory function can improve after a multimodal lifestyle intervention program in pediatric patients with obesity. This may lead to a modified choice of food, possibly resulting in a long-term therapeutic success. Therefore, these findings underline the importance of professional nutritional counseling as part of treatment for obesity.
Introduction
The prevalence of overweight and obesity has significantly increased over the last decades. In 2016, it has been estimated that worldwide, 124 million boys and girls 5–19 years of age were obese and an additional 213 million have been overweight. 1 In recent years, many factors have been identified to affect the imbalance between consumed and expended calories. 2 One of them is the choice of food, which is also determined by gustatory function 3 and has been suggested to be already influenced in utero.4,5 Human beings are able to distinguish between five fundamental innate tastes: sweet, sour, salty, bitter, and umami. 6
Evolutionarily, these different tastes helped to evaluate food quality 6 : while sweet and umami taste suggest high-calorie food, 7 sour and bitter taste help to recognize contaminated or toxic food. 8 In addition, salty taste is useful to maintain balanced salt levels. 9 Sweet, bitter, and umami sensations are mediated by metabotropic G-protein coupled receptors (GPCRs). 10 Sour and salty taste impressions are presumably conveyed by ionotropic receptors; however, their exact signal transduction mechanisms remain to be elucidated.11,12 It is known that there are interindividual differences in taste perception, 13 which may be due to genetic factors like the number of taste buds or the ability to taste the bitter compound propylthiouracil and the taste quality umami.14–16
Also, genetic variations of taste receptors have been identified to contribute to individual taste perception.17–19 In addition, several environmental factors like individual dietary pattern 19 or smoking 20 play an important role, as well as aging. 21 Previous studies suggested that gustatory function also varies between individuals with obesity and normal weight due to dietary, hormonal, and inflammatory factors.22–24 In addition, Overberg et al. could show that taste sensitivity is reduced in children and adolescents with obesity compared to those with normal weight. 25
Studies examining potential changes of taste perception in patients with obesity after weight loss are controversial and highly differ in terms of study settings and methods used26,27: Sauer et al. 26 showed an improvement of the taste quality sour and a worsening of the taste quality sweet in children with obesity after a structured weight reduction program. However, the study significantly differed in sample size (n = 53), methods used (no testing of the taste quality umami), and time between the two measurements (mean 26 days). In addition, they included patients with a BMI >90th percentile.
Another study was conducted in an outpatient setting. 27 Although patients who participated in a 1-year treatment program for patients with obesity were able to significantly lose weight, they did not show any improvement regarding gustatory function. This may be due to the small sample size of 44 patients, the used method, which was not validated externally, and potential confounding factors resulting from the outpatient setting.
Therefore, the aim of this study was to examine potential influences of weight reduction due to lifestyle intervention, including professional nutrition counseling on gustatory function in a large pediatric patient cohort (n = 102) in an inpatient setting.
Patients and Methods
Patients and Study Design
One hundred two children and adolescents between age 6 and 18 years (12.8 ± 2.9), who participated in a residential weight reduction program, were recruited between June and December 2015. The study protocol was based on the guidelines of the Declaration of Helsinki and approved by the institutional review board (EA2/049/15). Inclusion criteria were as follows: obesity (BMI >97th percentile); age 6 to 18 years; age-appropriate growth and neurological development; and informed consent obtained from parents or guardians. Exclusion criteria were as follows: acute or chronic disease related to disorders of smell or taste (e.g., upper airway infections and nerve lesions), acute or chronic disease influencing body weight (e.g., hypothyroidism/hyperthyroidism and M. Cushing), and medication that might influence body weight (e.g., corticosteroids and neuroleptics).
A complete medical history, including family history, previous illnesses, and medication history, was obtained from all subjects. For height measurements, a stadiometer (Seca, Hamburg, Germany) and for weight measurements, a digital scale (Kern, Ballingen-Frommern, Germany) were used. Patients were measured only wearing light underwear at T0 and T1 (each time before breakfast). BMI was calculated as weight in kilograms divided by the square of the height in meters. Obesity was defined as BMI >97th percentile according to German reference data. 28 To assess minor changes in weight reduction, the standard deviation score of BMI (BMI-SDS) was additionally calculated. This calculation was based on Cole's method, which normalizes the BMI skewed distribution and expresses BMI as BMI-SDS. 29 Physical examination and taste tests were conducted at the beginning (T0) and at the end (T1) of the interventional weight reduction program.
Taste Test
The first test was designed to assess the ability to detect a taste and identify the specific taste quality. For that, taste strips impregnated with different concentrations of different taste solutions were used as shown in Table 1. Concentrations were validated in a healthy control group as previously described. 30 Subjects were asked not to eat (incl. chewing gums) or drink anything, except for water, 1 hour before testing. Before the experiment started, different taste qualities (e.g., sour like a lemon and umami like meat or chips) and answer options were explained to the participants.
Overview of Used Taste Solutions and Their Concentrations
For the first test, taste strips (incl. blank negative control) were presented in increasing concentrations using a pseudo-randomized order (Supplementary Table S1) to prevent potential learning effects. In a second experiment, taste sensitivity and perceived taste intensity of the evolutionary leading taste quality sweet were evaluated. Participants were asked to rate different concentrations of sweet on a five-point rating scale according to the perceived intensities.25,31 The rating scale, ranging from 1 representing no taste to 5 representing very strong taste, was explained in detail and clarified with an example. Again, the sweet taste strips were presented in a pseudo-randomized order (Supplementary Table S2). Between each taste strip, participants rinsed their mouth with water.
During the whole experiment, subjects did not receive any feedback. Both experiments were conducted at T0 and T1. The interval of the two time points differed interindividually (details are given in the result part).
Lifestyle Modification and Nutritional Counseling
Between T0 and T1, patients were part of an intensive weight reduction program with multimodal lifestyle intervention. This program included a structured daily schedule with physical treatment and endurance training like swimming, aqua jogging, muscle-strengthening exercise, ergometer training, tissue massage techniques, and walking and jogging techniques, as well as orthopedic gymnastics instructed by professional physical and sports therapists as it was described in a previous publication. 32
Regular meals, balanced nutrition, and professional nutritional counseling were based on the on the recommendations of the German Nutrition Society (DGE) and the Working Group for Childhood Obesity (AGA) 33 : a negative energy balance of −300 to −500 kcal resulting in a daily energy intake of 1200 to 1800 kcal, depending on age, size, and energy expenditure, an “Optimized Mixed Diet,” including plenty of water and plant-based food, moderate intake of animal-based products, and little amounts of high-fat and high-sugar products. The overall energy intake consisted of about 15% proteins, 30% fat, and 55% carbohydrates distributed over 6 daily meals [2 fruit meals, 2 bread meals (cold), 1 main meal (warm), and one coffee/tea meal].
Statistical Analyses
Statistical analyses were performed using SPSS V.26.0 (SPSS, Inc., Chicago, IL). Data are presented as mean ± standard deviation or median and first and third quartile (Q1 and Q3). Frequency is given in percentage. For the first experiment, a total score (maximum of 20 points) of all correctly identified taste qualities was calculated. The total score as well as an individual score for each taste quality (maximum of four points) was compared between T0 and T1. Testing for normal distribution was performed using the Shapiro-Wilk method.
To analyze the influence of different variables on the final score at T0 and T1, a linear regression analysis was conducted. For continuous and ordinary variables, statistical analysis was performed using the nonparametric Mann–Whitney U test or—for paired samples—the Wilcoxon test. For categorical variables, significance was tested using the Chi-Quadrat Test. A probability value of less than 0.05 was considered statistically significant.
Results
Patients' Characteristics
Overall, 98 of originally 102 recruited patients were included in the analysis. Four patients were excluded due to false rating of both negative controls in one or more test sessions. The median age was 13.7 years [range: 6.1–18.3], 54.1% (n = 53) were girls and 45.9% (n = 45) were boys. The median length of stay was 37 days [range: 18–55], while 55.1% of all patients stayed for 31–40 days. BMI-SDS significantly (Wilcoxon test; p < 0.001) decreased from 2.56 [range: 1.59–4.36] at T0 to 2.31 [range: 1.23–4.23] at T1. Ethnically, the cohort was relatively homogenous: only eight patients had a non-Caucasian parent. Overall, 60 patients (61.2%) exhibited a higher taste score (“improvers”) of at least one point at T1, while 38 patients (38.8%) did not (“nonimprovers”). Further characteristics of these two groups are outlined in Table 2.
Patient Characteristics Stratified to the Group with Improved Taste Sensation (“Improvers”) and without Improved Taste Sensation (“Nonimprovers”) at T1
Higher score of ≥1 point on total score.
Gustatory Function: Alterations of the Total Score
Gustatory test strips with five possible taste solutions in four different concentrations as well as two blank strips (negative control) were presented in a pseudo-randomized order. For each correctly identified taste quality, patients could receive one point, resulting in a maximum score of 20. The two blank strips were not included in the score. The total score of the patient cohort ranged from 3 to 18 points. Sixty patients reached a higher score of at least one point at the end of the intervention program (T1) compared to baseline (T0), resulting in a significant increase of the total score (p < 0.001; Fig. 1).
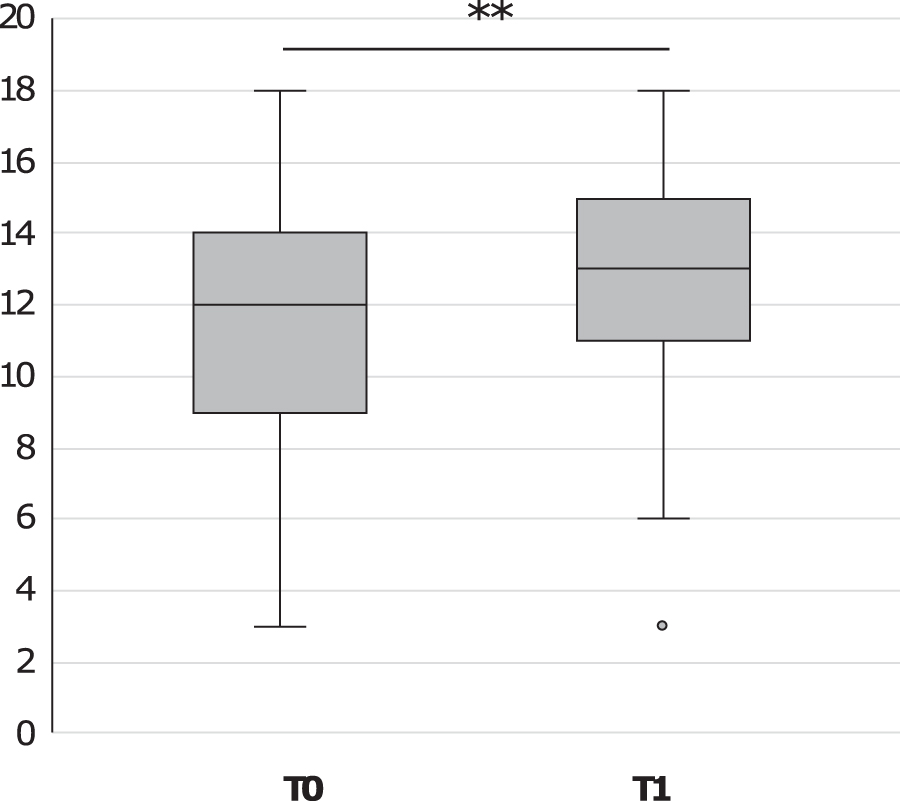
Comparison of total score at T0 and T1. Data are shown as box plot. For statistical analysis, Wilcoxon test was performed. **p < 0.001.
Gustatory Function: Alterations of Individual Taste Qualities
In a next step, sum scores for each individual taste quality were determined. For each correctly identified taste strip, patients received one point, resulting in a maximum score of 4 for each taste quality. Overall, patients performed significantly better at identifying sweet compared to the other taste qualities sour, salty, umami, and bitter at both time points (p < 0.001).
At T0, 87.8% of the patients were able to correctly identify at least three concentrations of sweet. After the intervention program, the percentage of patients even increased to 94.9%, however, not reaching significance (p = 0.052; Fig. 2). In addition, only 21.4% of the patients successfully (score ≥3) identified the taste quality umami at T0, but were able to significantly improve (39.8%) at T1 (p < 0.001; Fig. 2). A similar increase was found for the taste quality bitter: percentage of patients significantly increased from 49.0% at T0 to 63.3% at T1 (p = 0.016; Fig. 2). In addition, the number of patients who successfully identified sour did not significantly improve from T0 (35.7%) to T1 (41.8%; p = 0.303), while patients even showed a tendency to perform worse at successfully identifying salty at T1 (43.9%) compared to T0 (50.0%) (p = 0.303; Fig. 2).
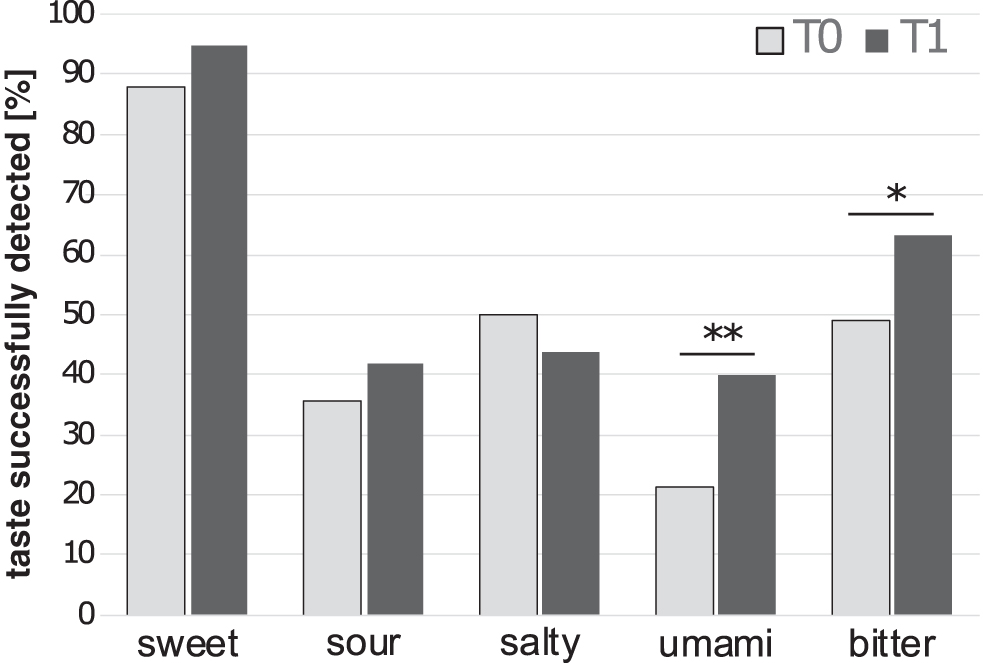
Successful identification of individual taste qualities at T0 and T1. Data are expressed as percentage of patients who successfully (score ≥3) identified taste qualities. For statistical analysis, Wilcoxon test was performed. *p < 0.05. **p < 0.001.
Confounding Factors on Global Taste Score
A linear regression analysis was performed to determine potential impacts of age, sex, lengths of stay, alteration of BMI-SDS, and total score at T0 on development of taste sensitivity (Table 3). Interestingly, only the total score at T0 had a significant impact on the development of the total score (Table 3), meaning that patients who already had a high score at T0 were less likely to improve their gustatory function at T1.
Influential Factors on the Development of the Total Score
Linear regression analysis of the dependent variable “development of total score” (R = 0.17). For statistical analysis of the regression model, a one-way ANOVA was performed. To analyze the effects of the different independent variables on the dependent variable, multiple t-tests were performed.
BMI-SDS, standard deviation score of BMI.
Intensity Rating for the Taste Quality Sweet
For the sweetness intensity rating, sweet taste strips with four different concentrations (level 1 to 4) were presented to the patients at T0 and T1. Patients were asked to rate them on an intensity scale ranging from 1 to 5. Here, the highest concentration (level 4) was rated significantly higher (p = 0.015) on the sweetness rating scale at the end of the program (T1) compared to T0 in the group of all patients (Table 4), as well as in the subgroup of “improvers” (p = 0.034).
Intensity Rating for the Taste Quality Sweet
Comparison of the different concentrations of “sweet” at T0 and T1. For statistical analysis, Wilcoxon test was performed.
SD, standard deviation.
Discussion
The aim of this study was to investigate potential alterations of gustatory function in children and adolescents before and after a structured multimodal lifestyle intervention, including professional nutritional counseling.
First, we found that patients performed significantly better at identifying the taste quality sweet compared to the other studied taste qualities. Even though most patients are used to high levels of sugar in their typical food, the good performance at identifying sweet was not an unexpected finding. It is known that the taste perception for sweet is already highly distinctive in neonates and helped evolutionarily to select food high in energy.34,35 In addition, overweight and obesity are associated with high intake of processed food and sweet beverages. 36 Therefore, it can be assumed that patients are highly familiar with the distinct taste quality sweet, while the taste qualities sour, umami, and salty are often combined in processed food like chips or salad dressings and therefore more likely to confuse.30,37
Furthermore, we found that overall, gustatory function significantly improved after the weight reduction program, which included regular meals and less sugar (including no soft drinks), as well as practical teaching of a healthy food choice and preparation of it. Moreover, patients participated in a daily physical treatment and endurance training (90–120 min/day). These modifications were reflected by an increase of the total score at T1. By examining individual taste qualities, lifestyle intervention seemed to have a significant impact on the taste qualities bitter and umami, while the identification performance for sweet also improved, however, not reaching significance.
Regarding the taste qualities sour and salty, patients were not able to improve between the two test sessions. Different underlying signaling pathways could play an important role in that: while the taste qualities umami, bitter, and sweet are mediated by GPCRs, the taste qualities sour and salty act by ionotropic receptors. 12 It is possible that different receptor types respond differently to dietary changes. It could be further hypothesized that these changes have to be more permanent to induce an altered signaling pattern in ionotropic receptors compared to GPCRs and should be investigated further on a ligand-receptor level. Furthermore, an altered gene expression of taste buds was observed in patients with obesity compared to normal-weight controls, which may affect various types of taste buds differently. 38
Although in line with other studies, it was remarkable that only 21.4% of the patients were able to correctly identify umami at T0.25,39 It is conceivable that patients were unfamiliar with the taste quality umami in the beginning and confused it with the taste quality salty at T0, but improved at T1, as it was described before. 40 It could also be speculated that patients preferred food high in glutamate before the intervention program, possibly resulting in a downregulation of T1R1/T1R3 GPCRs by internalization as it was observed in an experimental study. 41 Modified nutrition with low amounts of glutamate during the weight reduction program may have led to an upregulation of T1R1/T1R3 GCPRs and therefore an improved identification performance of umami at T1.
In addition, hormonal and inflammatory processes seem to play an important role in taste perception. For example, a study of Kaufman et al. showed that taste dysfunctions, which are most likely due to obesity-related inflammation, result in an impaired renewal of taste buds in mice. 42 Furthermore, cholecystokinin and vasoactive intestinal peptide (VIP), which are also located in taste cells, may act as local signaling modulators of taste perception. 43 Supporting this theory, a study of Martin et al. showed that VIP knockout mice had an increased sensitivity for sweet and bitter, but a decreased sensitivity for sour compared to healthy control mice. 44
Furthermore, it could be shown that leptin, which is primarily produced in adipose tissue, has a particular impact on the taste quality sweet. 45 Other hormones like glucagon-like-peptide (GLP-1), oxytocin, and insulin also seem to affect taste buds and therefore gustatory function. 18 Since taste receptors are also expressed in other tissues like the stomach and intestine, a modified nutrition may also have a direct impact on gustatory function by the brain-gut axis.46,47 However, this network seems to be very complex and the exact interactions need to be further elucidated. 3
Besides nutritional changes, exercise may also have had an impact on the overall changes of gustatory function in our cohort. 48 In line with our results, several studies suggested that sweet taste sensitivity and intensity increased with physical exercise.49–51 Furthermore, a study of Feeney et al. observed an increase of umami taste sensitivity and intensity, 49 while taste sensitivity for sourness rather decreased after exercise and no effects were observed for bitter taste sensitivity. 48 Physical exercise further seemed to decrease salty taste sensitivity and intensity, while salty taste preference rather increased during and after exercise. 48 The authors suggested that sweat loss may at least partly be responsible for that. However, to assess particular effects of nutrition and exercise on gustatory function, further studies with a different experimental setup are needed.
In our study, we also examined the intensity rating for the taste quality sweet. We saw that the taste intensity for sweet increased, expressed as a significantly higher rating of the maximum concentration on the “sweetness scale” at T1. This was also true for the subgroup of “improvers.” These results suggest that the weight reduction program, including a diet low in sugar and sweeteners, had an influence on perceived sweet taste intensity in our cohort as it was described before.52,53
In a further step, we examined potential influential impacts on the gustatory function of all patients as well as on the group that improved their total score and the group that did not improve. The analysis revealed that the total score at T0 had a significant impact on the development of the total score, meaning that patients who already had a high score in the beginning were less likely to further improve their gustatory function. However, patients with a low total score at T0 were more likely to benefit from the professional nutritional counseling and improve their gustatory function at T1.
Noticeable was also the overall large range of the total score, which may be—at least in parts—due to genetic variation of taste sensitivity. It is known that taste receptors17,18 and the density of taste buds 14 differ interindividually and that the taste quality bitter is perceived differently among individuals, which has again an influence on the food selection. 54
Strengths and Limitations
This longitudinal intervention study was aimed at examining potential effects of a lifestyle intervention program on taste perception. A strength of this study was the sample size of 102 patients and the fact that all patients participated in the same structured weight reduction program under identical inpatient conditions. The taste tests were based on a well-established, easy-to-use method with a short test period, reducing potential test errors to a minimum. 30 However, the relatively little gradations of different concentrations may have reduced the power to detect further minor alterations of gustatory function after dietary changes.
Furthermore, the correlation of therapeutic outcomes (e.g., weight loss) and changes of taste sensitivity was not expedient. This may be due to the standardized setting, the relatively short intervention period resulting in a similar magnitude regarding weight loss. Furthermore, the relatively homogenous patient cohort makes it difficult to draw conclusions to genetic and cultural influences on the taste perception. In addition, a control group could have helped to assess potential learning effects between T0 and T1. Repetitive follow-up studies are therefore needed to test the persistence of observed effects and further evaluate associations of therapeutic outcome parameters and alterations of taste sensitivity.
Taken together, this longitudinal study was able to show an improvement of overall gustatory function after multimodal lifestyle intervention, including professional nutritional counseling in children and adolescents with obesity. These findings may have a long-term impact on food selection and dietary behavior. Addressing taste sensation as part of nutritional counseling may therefore represent a suitable tool in the therapy of these patients.
Footnotes
Acknowledgments
We thank Prof. Thomas Hummel for introducing the taste strip method and providing the used tests strips, as well as for critically revising the article. In addition, we would like to thank Dr. Theresa Keller for statistical advice. We further thank all subjects who participated in this study and their parents, as well as all health professionals in the clinic.
Ethics Approval
The study protocol conformed to the guidelines of the Declaration of Helsinki and was approved by the institutional review board (EA2/049/15).
Author Disclosure Statement
No competing financial interests exist.
Funding Information
No funding was received for this article.
References
Supplementary Material
Please find the following supplemental material available below.
For Open Access articles published under a Creative Commons License, all supplemental material carries the same license as the article it is associated with.
For non-Open Access articles published, all supplemental material carries a non-exclusive license, and permission requests for re-use of supplemental material or any part of supplemental material shall be sent directly to the copyright owner as specified in the copyright notice associated with the article.