
Abstract
Introduction:
Individual variability in weight-related outcomes from obesity intervention is widely acknowledged, yet infrequently addressed. This study takes a first step to address individual variation by determining characteristics that distinguish responsive (improvements in BMI) from unresponsive individuals.
Methods:
Classification regression tree (CRT) analysis grouped 185 low-income, Hispanic American middle school students who received a school-based obesity intervention. Predictors included baseline age, gender, standardized BMI, health-related quality of life (PedsQL), minutes of moderate-vigorous physical activity (MVPA; accelerometry), energy consumption, and dietary quality (Block Kids 2004 Food Frequency Questionnaire). Response regarding weight-related outcomes to the intervention was defined according to the American Academy of Pediatrics (AAP) guidelines. Six trees were produced, one for 3- and one for 6-month outcomes among all participants, participants with healthy weight status, and participants with overweight/obesity at baseline.
Results:
The AAP criteria for response were met by 57.3% and 35.1% of participants at 3 and 6 months, respectively. CRT produced six unique trees. Notably, minutes of MVPA appeared twice (the first time at the top of the tree) in most 3-month models. In addition, response at 3 months consistently appeared as the first variable in all the 6-month models.
Conclusions:
Overall, the number of distinct pathways and the repeated appearance of the same variable within a pathway illustrate the complex, interactive nature of factors predicting an intervention response. Initially unresponsive individuals were unlikely to respond later in the intervention. More complex modeling is needed to better understand how to best predict who will be responsive to interventions.
Introduction
The wide range of individual variability in how youth's weight status changes in response to intervention is one of the greatest challenges to obesity prevention and treatment. While individual variation in weight-related response is well recognized, it is only beginning to be addressed. 1 In a clinical setting where treatment is administered at the individual level, treatment is modified or escalated when an individual is responding suboptimally. 2 In a school-based intervention, in which intervention is provided at a group level, those who do respond suboptimally (i.e., do not have improvements in weight outcomes) are often overlooked. Identifying individuals who are unresponsive to school-based or other public health interventions and modifying interventions may improve the overall effect of obesity interventions, especially among marginalized communities who often face greater barriers.
Understanding which characteristics separate individuals who are responsive to an intervention from individuals who respond suboptimally enables treatment to be offered to those who are most likely to respond and help resources be prioritized appropriately.
The majority of research on characteristics predictive of response comes from clinically based obesity interventions, primarily among samples of middle-upper class, non-Hispanic White families. Initial or early response to the intervention is one of the most consistent predictors of response at a later time point.3–6 However, ideally it would be possible to predict if an individual was likely to be responsive to a given intervention before intervention initiation. However, research on the utility of baseline factors, including demographic and anthropometric characteristics, quality of life, and dietary and physical activity behaviors as predictors of intervention response, has been mixed. For example, it is typical for response to differ by sex, although the sex that is more likely to respond more optimally varies across interventions.7,8
Some studies have suggested that pretreatment quality of life may predict intervention outcomes, but others found no association.9,10 Similarly, some interventions found no association between baseline dietary consumption and treatment response11,12; whereas others found only specific dietary components to be related to the intervention response.13,14 Lastly, baseline physical activity has been found to be unrelated to weight outcomes 15 as well as associated with both improved 6 and worsened weight outcomes. 11
A school-based, physical activity-focused obesity intervention 16 provides a homogenous sample of low-income, Hispanic American middle school students to investigate characteristics that may be indicative of participants' response to the physical activity-based obesity intervention program. Compared with the physical education class as usual, this program resulted in superior improvements in moderate-vigorous physical activity (MVPA) overall and in standardized BMI (zBMI) among participants with obesity. 16 The purpose of the present exploratory study was to identify profiles of demographic characteristics, health indicators, and behavioral characteristics (e.g., sex, age, baseline zBMI, physical activity, dietary consumption, health-related quality of life) that distinguished individuals who responded or did not respond to physical activity programming at 3 and 6 months, stratified by baseline weight status.
Methods
Study Design and Participants
This study is a secondary analysis of a randomized controlled trial that examined MVPA and zBMI over time between individuals receiving a physical activity intervention compared with physical education class as usual. The details of the physical activity programming and results are described elsewhere. 16 Briefly, the physical activity intervention consisted of circuit-based lessons that included aerobic and strength training exercises. College students were trained to model and do the activities with participants and to provide positive reinforcement. Heart rate monitors provided biofeedback, and students were graded based on the number of minutes they were in their target heart rate zone each class. The intervention did not include any nutrition education. The physical education class as usual included sports-based instruction in which students learned the rules to various sports and then practiced playing them. Both conditions occurred as participants' physical education class and did not include any parental component.
Middle school students were recruited from a charter school district in Houston, Texas, to participate in the study (n = 222). The school district actively recruits students from low socioeconomic status, racial/ethnic minority families who are at risk of not graduating from high school. More than 85% of students across the district qualify for free/reduced school meals. All students who participated in the study self-identified as Hispanic American. The original study was approved by the Institutional Review Board at Baylor College of Medicine. Only participants with complete data were included in this analysis. Specifically, those without complete anthropometric data at baseline, 3, and 6 months (n = 6), baseline quality-of-life data (n = 8), and baseline dietary data (n = 23) were excluded. This left a final analytical sample of 185 participants.
Outcome Variables
Height and weight were measured to the nearest 0.1 centimeter and kilogram, respectively, by trained research staff at baseline, 3, and 6 months. Participants wore minimal clothing and no shoes. These measures were used to calculate BMI (kg/m2). BMI percentile was calculated according to the CDC guidelines. 17
Intervention response was defined as making changes in BMI in the desired direction based on the participant's starting weight status and age. Specifically, response was defined using the algorithm adapted from the American Academy of Pediatrics (AAP) guidelines for childhood obesity prevention and treatment for school-based obesity interventions (Table 1). The staged treatment algorithm described by the AAP indicates the short-term response to be 3 to 6 months. 2 As such, two separate models were developed, one for 3 and one for 6 months. The same criteria for response and nonresponse classification were used at 3 and 6 months from baseline. Response was analyzed as a dichotomous variable (responsive or unresponsive) and was the dependent variable in this study.
Guidelines are adapted from the American Academy of Pediatrics guidelines for childhood obesity treatment. 2
Predictor Variables
Baseline demographic characteristics and health indicators
Demographic variables (sex, age) were assessed through a self-report demographic questionnaire completed by the study participants at baseline. Baseline standardized BMI (zBMI) was calculated from anthropometric measurements described above for the dependent variable. The Pediatric Quality of Life Scale 4.0 (PedsQL) was used to assess health-related quality of life at baseline. PedsQL is a 23-item self-report measure that assesses quality of life in children and adolescents (Cronbach's α reliability coefficient of 0.72). 18
Baseline physical activity and dietary consumption
Weekday minutes of MVPA were assessed using accelerometry (Actigraph AG, model GT1M). Protocol details are described elsewhere. 16 Five dietary variables were included as predictor variables: total energy (kcal), “green foods,” “yellow foods,” “red foods,” and sugar-sweetened beverages consumed per day at baseline. Dietary consumption was assessed using the Kids 2004 Block Food Frequency Questionnaire (FFQ) at baseline. 19 Any energy consumption levels greater than 5000 kcal/day or <500 kcal/day were considered implausible and were excluded. Food items included in the Block FFQ were coded to classify foods according to a modified stoplight diet.
Specifically, foods were classified into four groups: “green” foods included fruits/nonstarchy vegetables; “yellow” foods were dairy/protein/starch/grains with <5 g of fat or 15 g of sugar, and “red” foods were any food with >5 g of fat or 15 g of sugar; and “sugar-sweetened beverages” were beverages with added sugar. Fruit juice with no added sugar (100% juice) was considered a green food. Fruit-flavored beverages were considered sugar-sweetened beverages. The number of servings consumed in each category was calculated.
Study characteristics
Randomization assignment to participate in circuit-based physical activity or Physical Education (PE) class as usual has been previously shown to impact weight-related outcomes. 16 Specifically, among those with obesity, zBMI significantly decreased more among those randomized to circuit-based physical activity compared with those in PE class as usual. Response at 3 months was also included in the 6-month models as the initial response is an established predictor of later response.3–6
Statistical Analysis
Statistical analysis was completed using SPSS 25. Descriptive characteristics were calculated. Chi-square and t-tests were also used to assess differences in predictor variables between those responsive and unresponsive. Six classification regression trees (CRT) were developed: one predicting response at 3 months and one predicting response at 6 months among all participants (i.e., overall models), participants with healthy weight status (i.e., prevention models), and participants with overweight status or obesity (i.e., treatment models). The following baseline predictor variables were used in each of the models: age in years, sex (male or female), zBMI, PedsQL health-related quality-of-life subscale score, average minutes/day of weekday MVPA, energy consumption (kilocalories), servings of “green” foods, servings of “yellow” foods, servings of “red” foods, servings of sugar-sweetened beverages, and intervention randomization group.
In addition to these variables, the 6-month models also included response at 3 months as a predictor variable. CRT analysis uses recursive partitioning to create homogenous subgroups and is far less sensitive to sample size for detecting effects compared with using linear or logistic models and p-values. Variables can appear multiple times within the same tree (with different cutoff points), which increases the robustness of the profiles created. Furthermore, compared with logistic regression, which identifies groups that have the same outcome but can differ substantially on the predictors' values, CRT identifies groups that match on both predictors and outcome values. This distinction is useful for the development of tailored interventions. Another distinction between CRT and logistic regression is that CRT is intended as a descriptive analysis as a first step to inform intervention, whereas logistic regression tests hypotheses.
The Gini index was used to split nodes. Growth limits were set such that each tree could not have a depth greater than five levels, parent nodes had to have a minimum of 25 cases, and child nodes had to have a minimum of 5 cases. Each tree was cross-validated using 10 sample folds, and then pruned to avoid overfitting.
Results
Descriptive statistics and the results of chi-square and t-tests examining differences between weight status categories are reported in Table 2. The only statistical difference between those with complete data who were included in the analysis and those who were excluded from analysis due to incomplete data was that those excluded from the analysis were more likely to be in the treatment as usual group than the intervention group (χ 2 = 4.67, p = 0.03). Due to this, differences in characteristics by randomization group were investigated.
Significantly different from healthy weight status at *p < 0.05, **p < 0.01, ***p < 0.001.
MVPA, moderate-vigorous physical activity.
Overall and among those with healthy weight status, those randomized to the intervention group were more likely to be responsive than treatment as usual at 3 months, but not at 6 months (χ 2 = 5.09, p = 0.03; χ 2 = 2.43, p = 0.12 and χ 2 = 4.89, p = 0.03; χ 2 = 1.09, p = 0.30, respectively). Among those with overweight status or obesity, there were no differences in response by randomization group at either 3 or 6 months (χ 2 = 0.89, p = 0.34 and χ 2 = 1.89, p = 0.17, respectively).
Overall Models
Response at 3 months
Overall, 57.3% of participants were responsive at 3 months. Figure 1A shows the resulting CRT decision tree for the 3-month outcomes with six terminal nodes as well as the values of predictors distinguishing those as responsive and unresponsive at each node. The risk estimate for this tree was 0.27. Weekday MVPA appeared twice in the tree and servings of “red” foods, age, and kilocalories each appeared once in the tree. No other predictor variables appeared in the tree. Two pathways distinguished participants who were unresponsive and four pathways through the tree distinguished participants who were responsive.
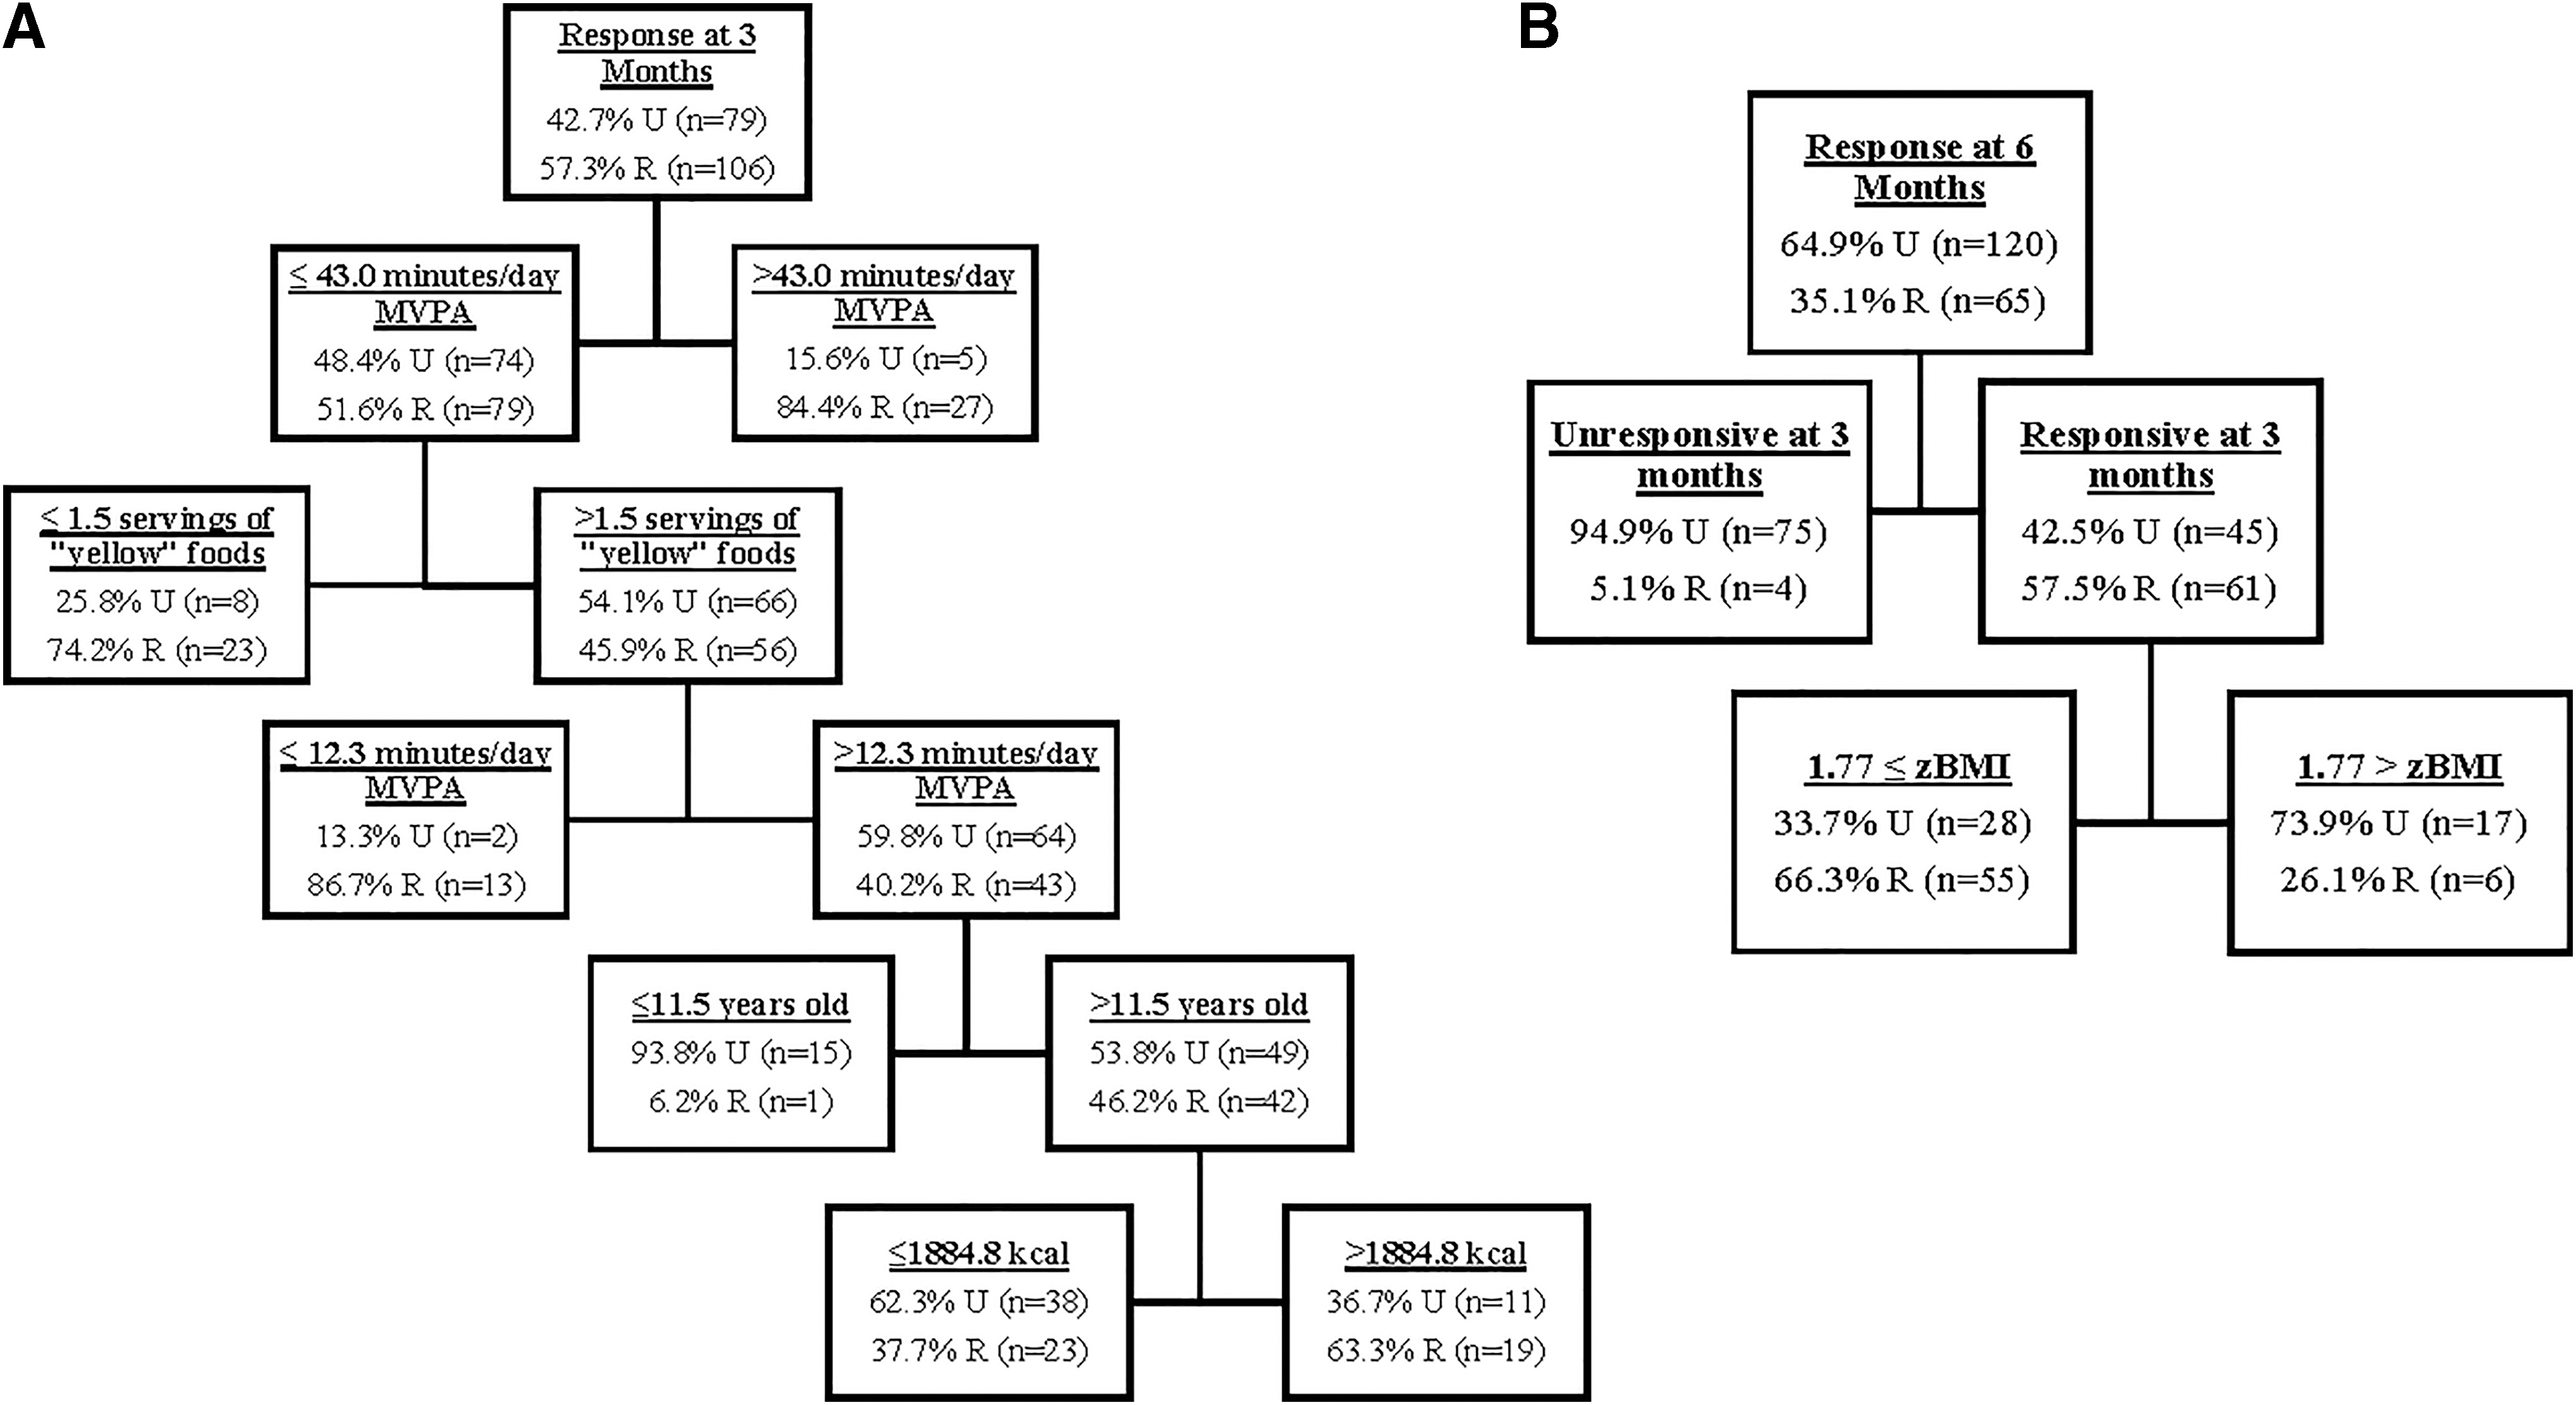
Decision tree analysis results among all participants at
Response at 6 months
Overall, 35.1% of participants were responsive at 6 months. Figure 1B shows the resulting CRT decision tree for 6-month outcomes with three terminal nodes as well as the values of predictors distinguishing those as responsive and unresponsive at each node. The risk estimate for this tree was 0.21. The only variables appearing in the tree included response at 3 months (appeared first in the tree) and baseline zBMI. Two pathways distinguished participants who were unresponsive and one pathway through the tree distinguished participants who were responsive.
Prevention Models
Response at 3 months
Among those with a healthy weight status, 60.2% were responsive at 3 months. Figure 2A shows the resulting CRT decision tree for 3-month outcomes with two terminal nodes. One pathway distinguished participants who were unresponsive and one pathway through the tree distinguished participants who were responsive. The risk estimate for this tree was 0.34. The only variable appearing in this tree was baseline zBMI. Those with a higher zBMI (>−0.60) were more likely to be responsive.
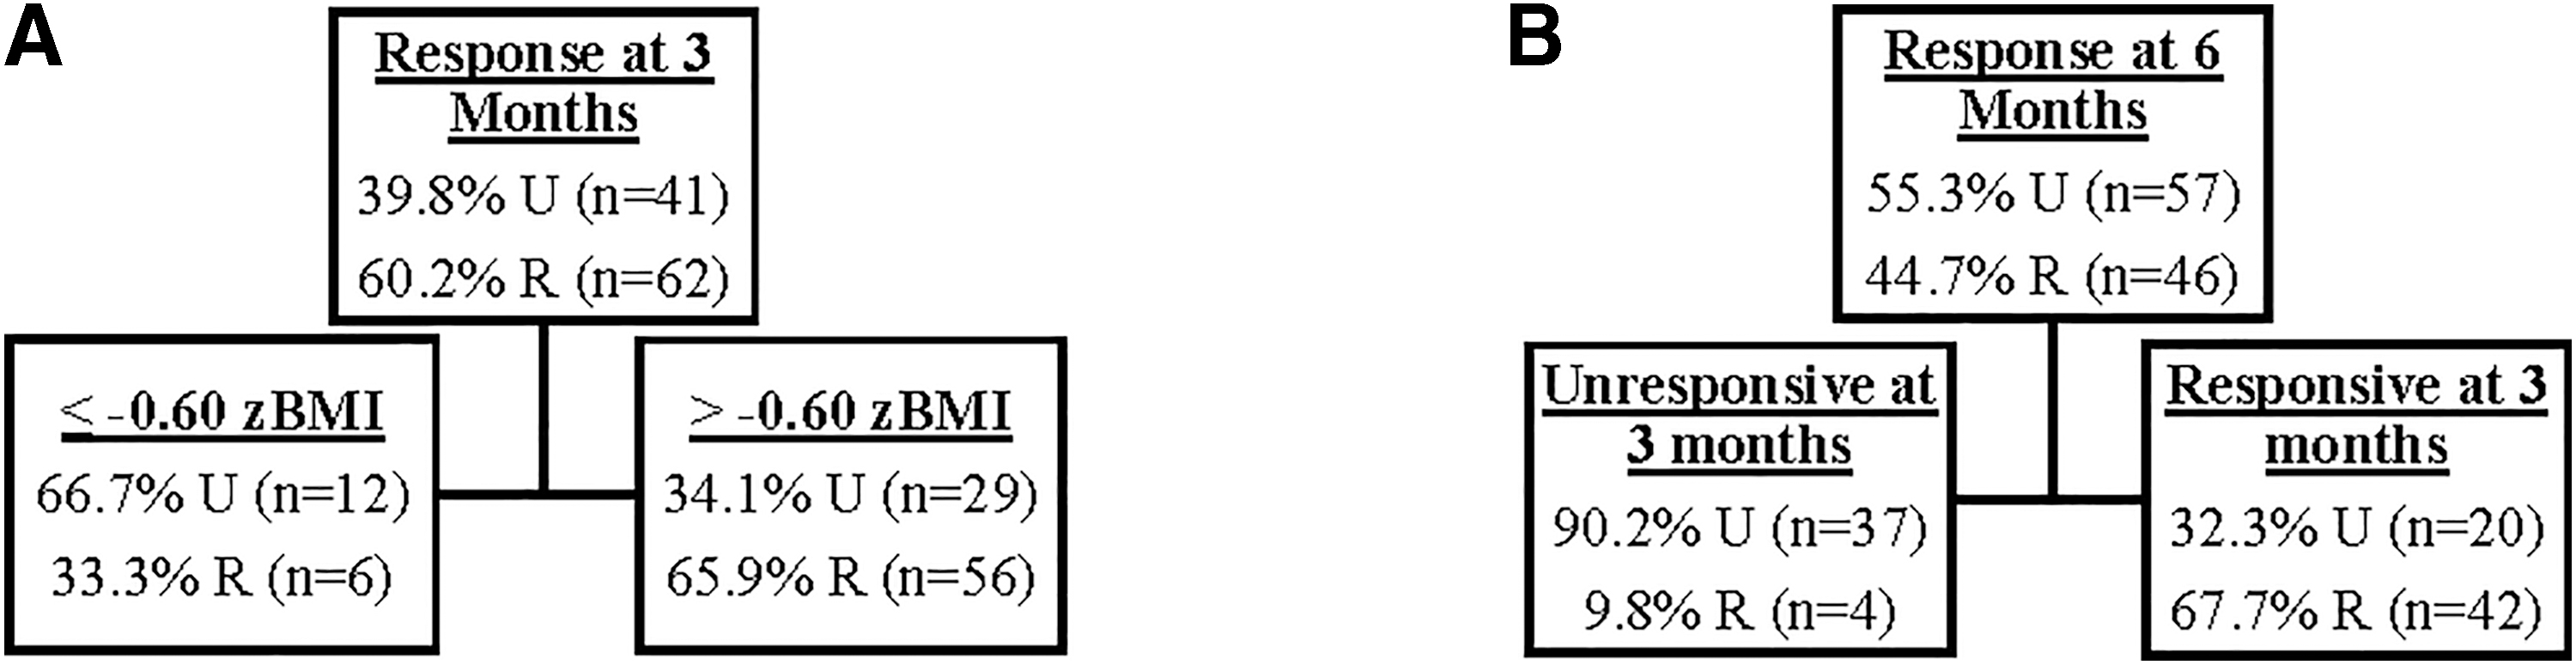
Decision tree analysis results among participants with healthy weight at
Response at 6 months
Among those with a healthy weight status, 44.7% were responsive at 6 months. Figure 2B shows the resulting CRT decision tree for 6-month outcomes with two terminal nodes. One pathway distinguished participants who were unresponsive and one pathway through the tree distinguished participants who were responsive. The risk estimate for this tree was 0.23. The only variable appearing in the tree was response at 3 months. Those who were unresponsive the first 3 months were unlikely to become responsive at 6 months.
Treatment Models
Response at 3 months
Among those with overweight status or obesity, 53.7% were responsive at 3 months. Figure 3A shows the resulting CRT decision tree for 3-month outcomes with five terminal nodes as well as the values of predictors distinguishing those as responsive and unresponsive at each node. The risk estimate for this tree was 0.171. The only variables appearing in this tree were average daily weekday minutes of MVPA, servings of sugar-sweetened beverages, and physical health-related quality of life. Each of these variables appear once in the tree, except for average daily weekday minutes of MVPA, which appeared as both the first and last variable in the tree. Three pathways distinguished participants who were unresponsive and two pathways through the tree distinguished participants who were responsive. One pathway identified 100% of participants as unresponsive.
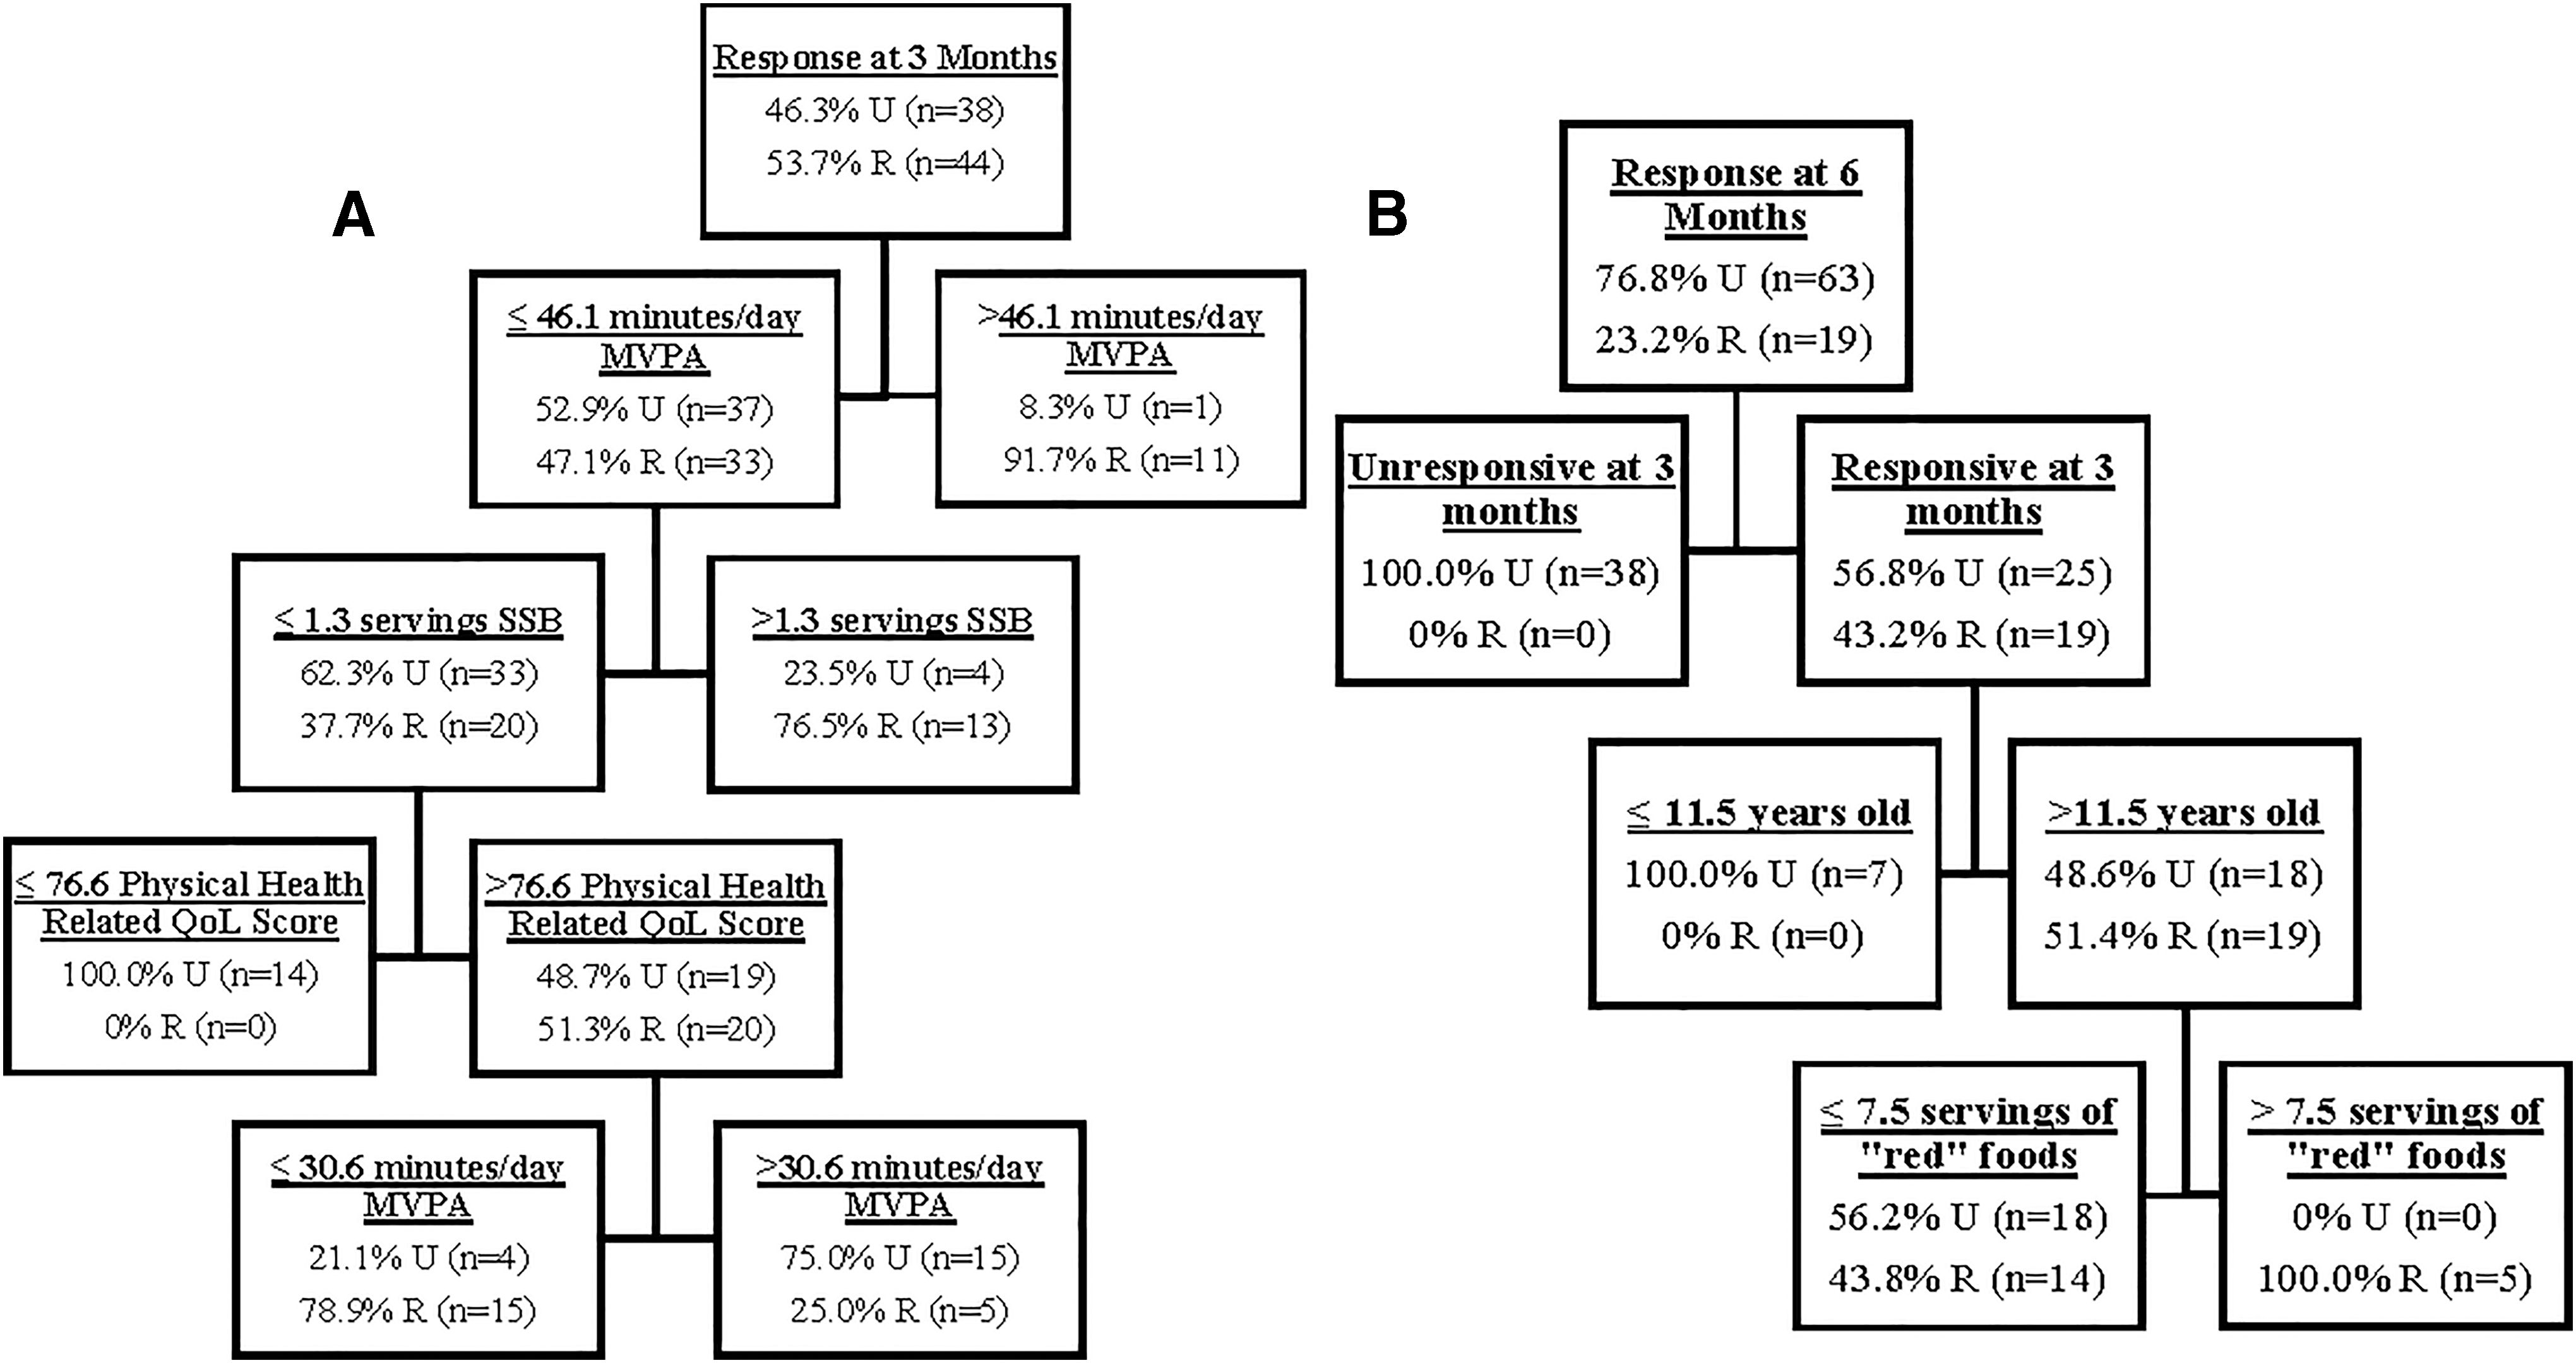
Decision tree analysis results among participants with overweight status or obesity at
One hundred percent of participants who had lower levels of weekday MVPA (≤46.12 min/day), lower consumption of sugar-sweetened beverages (≤1.30 servings/day), and a lower physical health-related quality-of-life subscale score (≤76.56) were unresponsive.
Response at 6 months
Among those with overweight status or obesity, 23.2% were responsive at 6 months. Figure 3B shows the resulting CRT decision tree for 6-month outcomes with four terminal nodes as well as the values of predictors distinguishing those as responsive and unresponsive at each node. The risk estimate for this tree was 0.17. The only variables appearing in this tree were response at 3 months, age, and consumption of “red” foods. Three pathways distinguished participants who were unresponsive and one pathway through the tree distinguished participants who were responsive.
Two pathways identified 100% of participants as unresponsive and one pathway identified 100% of participants as responsive. One hundred percent of participants who were unresponsive at 3 months were unresponsive at 6 months. One hundred percent of younger participants (≤11.55 years old) who were responsive at 3 months were unresponsive at 6 months. One hundred percent of older participants (>11.55 years old) were responsive at 3 months and consumed a greater amount (>7.54 servings) of “red” foods.
Discussion
The exploratory regression tree analyses conducted in this study resulted in distinct trees for each weight status classification and outcome time point. While the trees had some commonalities, the uniqueness of each tree illustrates the complex, variable nature of individual response to intervention. The results of each tree offers some direction for future research by identifying “profiles” of factors that intersect to distinguish between those who make improvements in weight-related outcomes and those who do not. Most prominently, consistent with prior literature indicating initial weight loss to be a primary predictor of later weight loss,3–6 response at 3 months was the primary indicator of response at 6 months.
Specifically, in the 6-month treatment model, not a single participant who was unresponsive at 3 months became responsive at 6 months. This indicates how critical it is to identify individuals who are not responding to intervention as soon as possible because they are very unlikely to respond later.
While the rate of response is lower at 6 months than at 3 months in all models, the decrease was particularly dramatic between the treatment models (i.e., 53.7% to 23.2%). This observation makes it important to identify characteristics distinguishing between response and nonresponse at 6 months among those who were responsive at 3 months. Those who remained responsive ate more “red” foods and were older at baseline. Age has been a consistent predictor of intervention response in prior research. However, the direction (i.e., older or younger) associated with response is mixed.3,6,20–23 It is particularly striking that age appeared as a predictor variable in the tree given the homogenous sample (mean age was 12.02 ± 0.59 years).
It is possible that age appears in the trees as a distinguishing factor between students in their first year in middle school compared with their second (i.e., youth younger than the 11.5-year-old cutoff point in the tree were adapting to an entirely new school environment, whereas older youth were only adapting to the physical activity program.) However, an exploratory inclusion of grade into the model did not alter the results.
Another possibility is that age corresponds to maturation. Among both sexes, physical maturation is related to a decline in physical activity and weight gain.24,25 Unfortunately, no measure of physical maturation was available for inclusion in the present study. Older youth may also have greater social and cognitive maturation, which could provide them a greater capability to maintain behavior changes. This is consistent with prior studies that indicate older youth (middle school age) to sustain improvements in weight-related outcomes longer than younger children (elementary school age). 3
This study enhances the mixed literature regarding the relationship between age and intervention response by identifying it was the older youth who also ate a high number of “red” foods at baseline that has a sustained response. It may be that in addition to having the cognitive ability to make behavior changes that could come from age, youth also need to have ample room for improvement with their diet. Students who ate a lot of red food at baseline could make small improvements in diet that may contribute to improvements in weight. Conversely, changes to diet may be more difficult if youth were already eating few “red” foods.
One of the strengths of the decision tree approach is that factors can appear multiple times in a tree to further refine the characteristics that distinguish response from nonresponse. This attribute of the models is important for informing future directions in understanding the role of MVPA and intervention response. Specifically, every time MVPA was present in a tree, it appeared more than once, indicating a nonlinear relationship and/or a potential interaction. Across trees, the highest and lowest amount of MVPA time was associated with response; whereas the middle range of MVPA time was associated with nonresponse or depended on another variable. Less MVPA time may provide the opportunity for an intervention to improve MVPA. Greater amounts of MVPA time may indicate that the individual enjoys physical activity. Enjoyment is a primary predictor of physical activity level. 26 Therefore, a high amount of MVPA time at baseline may be indicative of engagement and adherence to intervention activities. A higher MVPA at baseline being the primary factor describing response at 3 months illustrates the importance of not solely identifying areas for improvement but identifying areas of strength to build upon. Conversely, middle levels of MVPA may be associated with nonresponse because middle ranges of MVPA time do not provide as much space for improvement or may indicate less enjoyment for MVPA. Importantly, when middle ranges of MVPA were associated with response it was under the context of another factor (e.g., older age and greater baseline energy intake).
It may be that among slightly older youth, a distinguishing factor for response is that youth have to start with room to improve in either a physical activity or diet behavior, but not necessarily both. For example, in this instance, older youth with middle ranges of MVPA at baseline who also had higher energy intake were more likely to be responsive than older youth with middle ranges of baseline MVPA who had lower baseline energy intake. This explanation is consistent with the energy balance theories of needing to either increase energy expenditure or decrease energy intake to lose weight.
A strength of this study was its homogenous, low-income, Hispanic American middle school population, which enabled investigation into factors pertaining to response among a high-risk population. While physical activity was able to be assessed objectively, dietary intake was self-reported. Given the lower reliability of self-reported data, dietary data may have been less likely to appear in the models compared with the objectively measured physical activity data. The unique trees that were created in this study indicate the great amount of variability of profiles associated with response to intervention. Further investigation and more complex modeling are needed to better understand individual variability to be able to develop population-specific interventions.
Conclusions
The exploratory regression tree analysis conducted in this study is an important first step in understanding how baseline characteristics may relate to the intervention response. Understanding how baseline characteristics can predict response is critical to being able to provide tailored interventions as early as possible. This study highlights the importance of early identification of those who are unlikely to respond to an intervention because those who respond suboptimally initially in an intervention are unlikely to respond later. While this is not necessarily a surprising finding, this study is one of the first to document it among a school-based intervention.
Not only is it important to provide interventions that are most likely to be beneficial to an individual initially, this study also demonstrates the importance for outcomes to be assessed early on during intervention and for alternative interventions to be made available to those who respond suboptimally initially. While there are options in a one-on-one clinical treatment environment to adjust course, escalated intervention options for those who respond suboptimally to school- or community-based interventions are rare. Addressing those who initially respond suboptimally to community-based intervention is an important area for future research.
Footnotes
Authors' Contributions
All authors contributed to the study conception and design. Material preparation and data collection were performed by C.A.J. Analyses were performed by K.R.A. and D.P.O. The first draft of the article was written by K.R.A. and all authors commented on the previous versions of the article. All authors read and approved the final article.
Funding Information
This work was funded by the United States Department of Agriculture, Grant No. ARS 2533759358.
Author Disclosure Statement
No competing financial interests exist.