
Abstract
Factors associated with change in percent body fat (%BF) of children in pediatric weight management (PWM) care may differ from those associated with change in weight status.
Objective:
To describe %BF and weight status at initial visits to 14 PWM sites, identify differences by sex, and evaluate factors associated with change over 6 months.
Methods:
Initial visits of 2496 males and 2821 females aged 5–18 years were evaluated. %BF was measured using bioelectrical impedance analysis.
Results:
Sex-specific logistic regressions [806 males (32.3%), 837 females (29.7%)] identified associations with primary outcomes: lower %BF and metabolically impactful ≥5-point drop in percent of the 95th BMI percentile (%BMIp95) over 6 months. At the initial visit, males had lower %BF and higher %BMIp95 than females. Over 6 months, males had significantly (p < 0.001) greater median drop in %BF (−1.4% vs. −0.4%) and %BMIp95 (−3.0% vs. −1.9%) and a higher frequency of decreased %BF (68.9% vs. 57.8%), but similar percentage with ≥5-point %BMIp95 drop (36.5% vs. 32.4%; p = 0.080). For males, factors significantly associated with decreased %BF (older age, ≥6 visits, lack of developmental or depression/anxiety concerns) were not related to having a ≥5-point %BMIp95 drop. For females, lack of depression/anxiety concern was significantly associated with decreased %BF but was not associated with ≥5-point %BMIp95 drop.
Conclusions:
There are differences by sex in initial visit %BF and %BMIp95 and in characteristics associated with changes in these measures. PWM interventions should consider evaluating body composition and sex-stratifying outcomes.
Introduction
Multicomponent pediatric weight management (PWM) programs provide specialized care to youth with obesity (≥95th percentile for BMI). PWM care at these programs includes a thorough medical and psychosocial assessment. Such programs may include family-based lifestyle modification recommendations and other management strategies, including the use of a wider array of medications and bariatric surgery.1–3
PWM programs use an array of metrics to track patient progress over time, including BMI, BMI percentile, BMI z-score, and percentage of the 95th BMI percentile (%BMIp95). However, youth seen for PWM care often present with severe obesity (≥120% of %BMIp95) 4 so are in a narrow range of high BMI percentiles. BMI z-score does not track well for youth with severe obesity. 5 Instead, the preferred method to evaluate weight status is %BMIp95, which avoids these issues. 6 Recently some PWM programs have added bioelectrical impedance analysis (BIA) to their evaluation. BIA is a measure of body composition that estimates percent body fat (%BF). In general, the relationship between BMI and adiposity trends in a similar direction across weight status category (youth with higher BMI generally have higher %BF). 7
Due to metabolic accommodations that occur after weight loss, patients in PWM programs who have lost weight are at high risk for weight regain. 8 Building/maintaining muscle mass may be an important mitigating factor in preventing weight regain. 9
Body composition changes as children mature, and %BF for youth differs by age and sex. As compared to males, females have a higher %BF at any BMI percentile. 10 Youth experience a slight increase in %BF during the preteen years, but with puberty, sex hormonal differences lead to lowering %BF for males and sustained or increased %BF for females.11,12
Evaluation of changes over time in %BF measured during clinical care of youth in PWM programs has not previously been reported. To fill this gap, data from multicomponent PWM programs across the United States that routinely measure %BF during care and participate in the Pediatric Obesity Weight Evaluation Registry (POWER) were evaluated. POWER is the first U.S.-based multicenter registry of treatment-seeking youth with obesity. 13 POWER programs prospectively enrolled participants seeking obesity management care and maintained an aggregate database to evaluate management strategies and health outcomes. 13 This report evaluated POWER data to: (1) describe %BF and weight status at the initial PWM visit and identify differences by participant characteristics; (2) describe changes in %BF and weight status over 6 and 12 months by sex; and (3) identify factors associated with changes in %BF and weight status over 6 and 12 months by sex.
Methods
Data for this study are from POWER participants recruited from May 2014 through December 2020 and were limited to the 15 PWM sites (of 42 sites enrolled) that routinely reported %BF. Information about POWER, established in 2014, has been described. 13 Data were entered by participating sites into an aggregate database maintained by the POWER Data Coordinating Center at Cincinnati Children’s Hospital Medical Center. The Cincinnati Children’s Hospital Institutional Review Board (IRB) and additional IRBs at each site approved this study. The POWER study is registered with Clinical.Trials.gov (NCT02121132).
Data used included participant demographics (race, ethnicity, insurance type) and characteristics (sex, age, weight, height, %BF and/or fat mass). Information on medical diagnoses/conditions at the initial visit, including depression, anxiety, autism, developmental delay/cognitive impairment, Down syndrome, and “other genetic conditions” were evaluated. These diagnoses/conditions were selected due to potential influence on %BF at baseline as well as response to PWM care.14–16 Tanner stages were also used when documented.
Values of %BF or fat mass (kg) were obtained from participants at clinical visits using BIA technology. BIA measures the resistance to an electrical current as it travels through water in muscle and fat, generally from limb to limb, for example foot to foot, and reports values based on proprietary predictive models. 17 BIA is valid, reliable and correlates with %BF as measured by dual-energy X-ray absorptiometry (DEXA), a more precise technology to measure %BF.18,19 BIA measurements are used in PWM clinical settings as they are logistically easier to obtain than other methods such as DEXA or air displacement plethysmography, as measured by BOD POD©. BIA use is limited by child age (<5 years for most devices). Data were not available regarding the exact models of BIA equipment used at each site. Sites applied their own measurement protocol for BIA measurements following manufacturer-specified instructions for the type of equipment used.
Data of participants ages 5–18 years with BMI for age ≥95th percentile at the initial visit were evaluated. We excluded participants if weight, height, or %BF were missing. A data flowchart is shown in Supplementary Figure S1. Reasons for exclusion of follow-up visits included missing or excluded baseline visit data; missing weight, height, or %BF at visit; follow-up visit >15 months after baseline visit; and age 20 years at a follow-up visit. Remaining data from initial and follow-up visits were evaluated for consistency of weight and %BF or fat mass measures [e.g., inconsistencies of weight, %BF and fat mass values, such as fat mass exceeding body weight, or fat mass computed from %BF (i.e., %BF × weight) >1 kg different from fat mass reported], and implausible weight or height changes between sequential visits (weight change ≥10 kg/month or height change ≥5 cm/month).
Next, visual plots of %BMIp95 and %BF by age group by sex for each site were evaluated. At one site points plotted from %BF measurements were consistently lower than in plots for all other sites. Data from this site (50 initial visits, nine 6-month visits, and one 12-month visit) were excluded from analyses.
Data Management
Race and ethnicity were grouped as Black, Hispanic, Other or Multiracial, White, and unknown. Diagnoses/conditions were grouped to identify those with and without anxiety or depression and those with and without a developmental concern (DC). The Tanner stage was identified as the highest stage entered for each participant and grouped (Tanner stage 1, Tanner stage 2 or 3, and Tanner stage 4 or 5).
Data were used to compute %BMIp95 based on CDC 2000 references. 20 Changes in %BMIp95 and %BF over 6- and 12-month follow-ups were assessed by comparing data at the baseline visit to the visit closest to and within ±3 months of the desired follow-up period.
The concept of obesity class defines three groups used to describe the severity of obesity. 4 Similar to the obesity class construct, %BF level group was defined to describe %BF severity. This new construct of %BF level group was developed by applying the 25th and 62.5th percentile values (chosen to approximate the distribution of participants in obesity class groups in this sample) to identify cut points to define three %BF level groups within each sex group. Sex-specific cut points were defined due to established differences in %BF by sex. 12 The %BF level groups defined were: Level 1: females <41%, males <37%; Level 2: females ≥41% to <48%, males ≥37% to <45%; Level 3: females ≥48%, males ≥45%.
To establish age groups for analyses, we evaluated data from the 975 male and 1046 female participants who had Tanner staging reported at their initial visit. To identify age-in-years cut points to define three age groups for each sex, the relationship between age and Tanner stage was evaluated with the goal to optimize the percent of participants having Tanner stage 1 in the lowest age group, Tanner stages 2–3 in the middle age group, and Tanner stages 4–5 in the oldest age group. To do this, using 6-month segment age intervals, we identified the age cut points having the highest total percent agreement overall between Tanner stage and age group (Supplementary Fig. S2). The highest level of agreement (73.8%) between Tanner stage grouping and age groups for males was achieved when grouping ages as 5–10, 11–13, and 14–18 years. Similarly, the highest level of agreement between Tanner stage group and age group for females (73.1%) was achieved when grouping ages as 5–9, 10–12, and 13–18 years. Further analyses used these sex-specific age groupings.
Analyses
The first evaluations consider information from initial visits. Visits of participants lacking follow-up or missing participant characteristic data were included, when possible, in these analyses. The number of participants by site is reported.
The frequency and percentage of participant characteristics at the initial visits were analyzed and then grouped by sex to evaluate differences for categorical variables (age group, race and ethnicity group, insurance group, obesity class group, %BF level group, Tanner stage group, and diagnoses/conditions) and continuous variables (age, %BF, and %BMIp95). As appropriate, Pearson’s chi-square test was used to compare binary or nominal categorical variables, and the Kruskal–Wallis test was used to compare continuous variables or ordinal categorical variables across sex groups. We present initial %BF and initial %BMIp95 by age for each sex using scatterplots, including Tanner stage group, when available. For each scatterplot, we identified and reported a model (among three options: linear, quadratic, and cubic) with the highest adjusted R2, for which all terms in the model were significant at p < 0.05. Spearman’s correlation was used to evaluate the strength of the relationship between %BF and %BMIp95.
The next evaluations focused on changes in %BF (lower vs. stable/gain) over 6 and 12 months and changes in %BMIp95 (drop by ≥5-points vs. <5-point drop) over 6 and 12 months. Since a prior study using the POWER aggregate data set showed metabolic improvement was associated with a ≥5-point drop in %BMIp95, 21 that cut point was used in the analysis. We applied multivariate logistic regression (LR) modeling for each sex group individually. These analyses included participant characteristics, medical conditions/diagnoses (i.e., anxiety/depression or DC), and number of visit groups. To adjust for baseline status, initial %BF level group was included as a factor in the models considering change in %BF; similarly, initial obesity class group was included as a factor in the models considering change in %BMIp95. All models included the site as a random effect to account for multisite sampling.
A series of scatterplots of changes in %BF by changes in %BMIp95 are presented to visualize the relationship at both 6- and 12-month follow-ups. Four directions of change groups in %BF and %BMIp95 were identified: increased/no change—increased, decreased—decreased), increased/no change—decreased, decreased—increased. Frequency of directions of change groups by sex is reported, and chi-square applied to evaluate differences by sex.
Most analyses were performed using IBM SPSS version 28.0. STATA 14.0 was used for LR models.
Results
Participant Characteristics
There were data from 14 PWM programs in the final data set (median 198 participants by site; interquartile range 182–389; minimum 17, maximum 1701). Among the 5317 participants evaluated 53.1% were females (Table 1). Males and females were of similar age (mean 12.1 years, standard deviation 3.1 years), and most (74.6%) had severe obesity. There were 70.2% with public insurance, most were either Hispanic (39.9%) or White (35.0%), and a DC was reported for 5.1% and depression/anxiety for 5.7%. Males more often had Class 3 (most severe) obesity and more often had a DC. Males had lower %BF as compared to females, but higher %BMIp95 at the initial visit. Among those with Tanner stage reported (males 39.1%, females 37.1%), a higher proportion of females as compared to males were in Tanner Stage 4–5 group (36.0% vs. 21.7%) and fewer in Tanner Stage 1 group (31.1% vs. 44.4%).
Baseline Demographics and Anthropometrics by Sex
May not add to 100% due to rounding.
Age groups: males (youngest 5–10 years, middle 11–13 years, oldest 14–18 years); females (youngest 5–9 years, middle 10–12 years, oldest 13–18 years).
Body fat % level: Level 1: females <41%, males <37%; Level 2: females ≥41% to <48%, males ≥37% to <45%; Level 3: females ≥48%, males ≥45%.
Obesity class: Class 1, 100% to <120% %BMIp95; Class 2, 120% to <140% %BMIp95 or ≥35 kg/m2; Class 3, ≥ 140% %BMIp95 or ≥40 kg/m2.
p values are based on Pearson’s chi-square tests for all categorical row variables.
p values for comparing continuous variables are based on Mann–Whitney U test.
%BMIp95, body mass index percent of the 95th percentile; n/a, not applicable. Bolded p values reached statistical significance.
Body Fat Percentage and %BMIp95 at Initial Visit
Figure 1a and c displays %BF at the initial visit for males and females by age. Models were fit to evaluate this (males, adjusted R2 for quadratic = 0.003; females, adjusted R2 for linear = 0.096); for males, the %BF had a slight rise in middle ages, while for females there was a steady rise in %BF with age. Figure 1b and d displays %BMIp95 at the initial visit for males and females by age. For both males and females, there was a slight downward shift in %BMIp95 at younger ages (males, adjusted R2 for cubic = 0.023; females, adjusted R2 for cubic = 0.009). Spearman’s correlation between %BF and %BMIp95 at the initial visit is 0.737 (p < 0.001) and 0.775 (p < 0.001) for males and females, respectively.
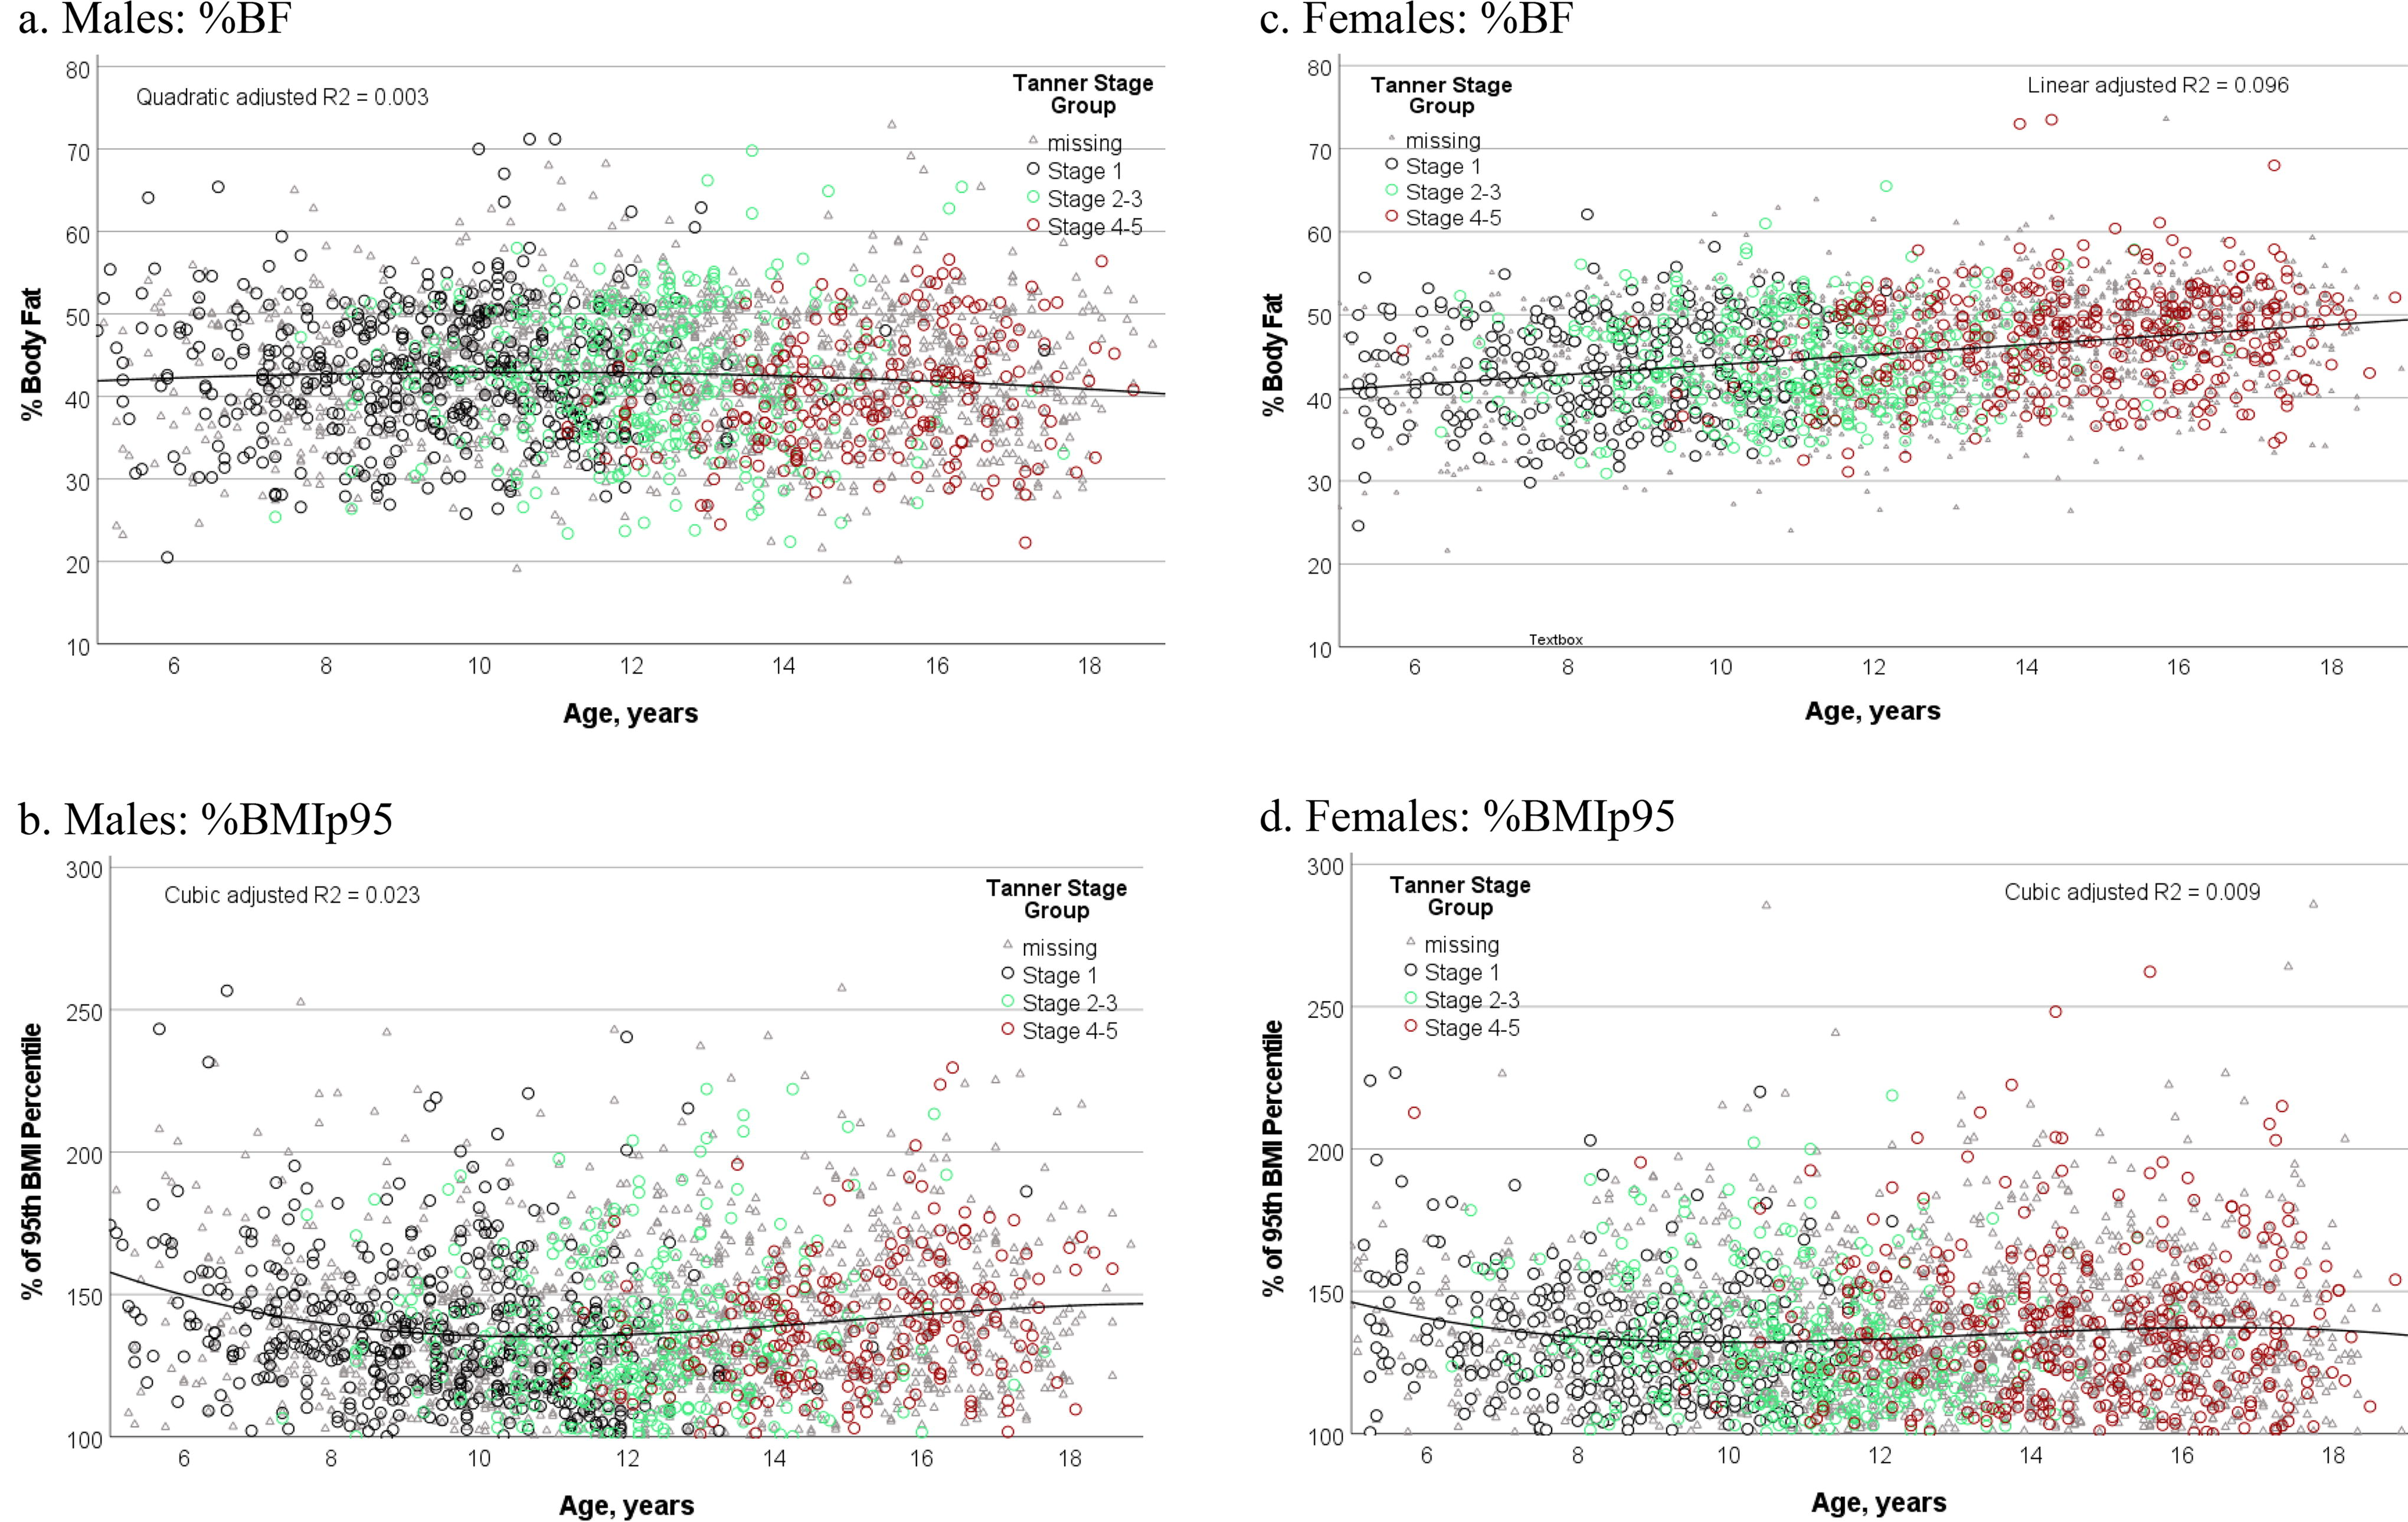
Initial %BF and %BMIp95 by age for males and females. Tanner stage group is indicated for information purposes, when available. Model formulas: %BF male, Y = 39.073 + 0.743*X − 0.036*X2; %BMIp95 male, Y = 235.573 − 22.929*X + 1.660*X2 − 0.037*X3; %BF female, Y = 38.014 + 0.600*X; and %BMIp95 female, Y = 206.911 −19.646 *X + 1.491 * X2 − 0.037 *X3. %B, percent body fat; %BMIp95, 95th BMI percentile.
Change over Time
Six-month follow-up results are reviewed below; 6- and 12-month follow-up results are presented in Tables 2–4 and Figure 2. Evaluation of bias in follow-up is shown in Supplementary Table S1.
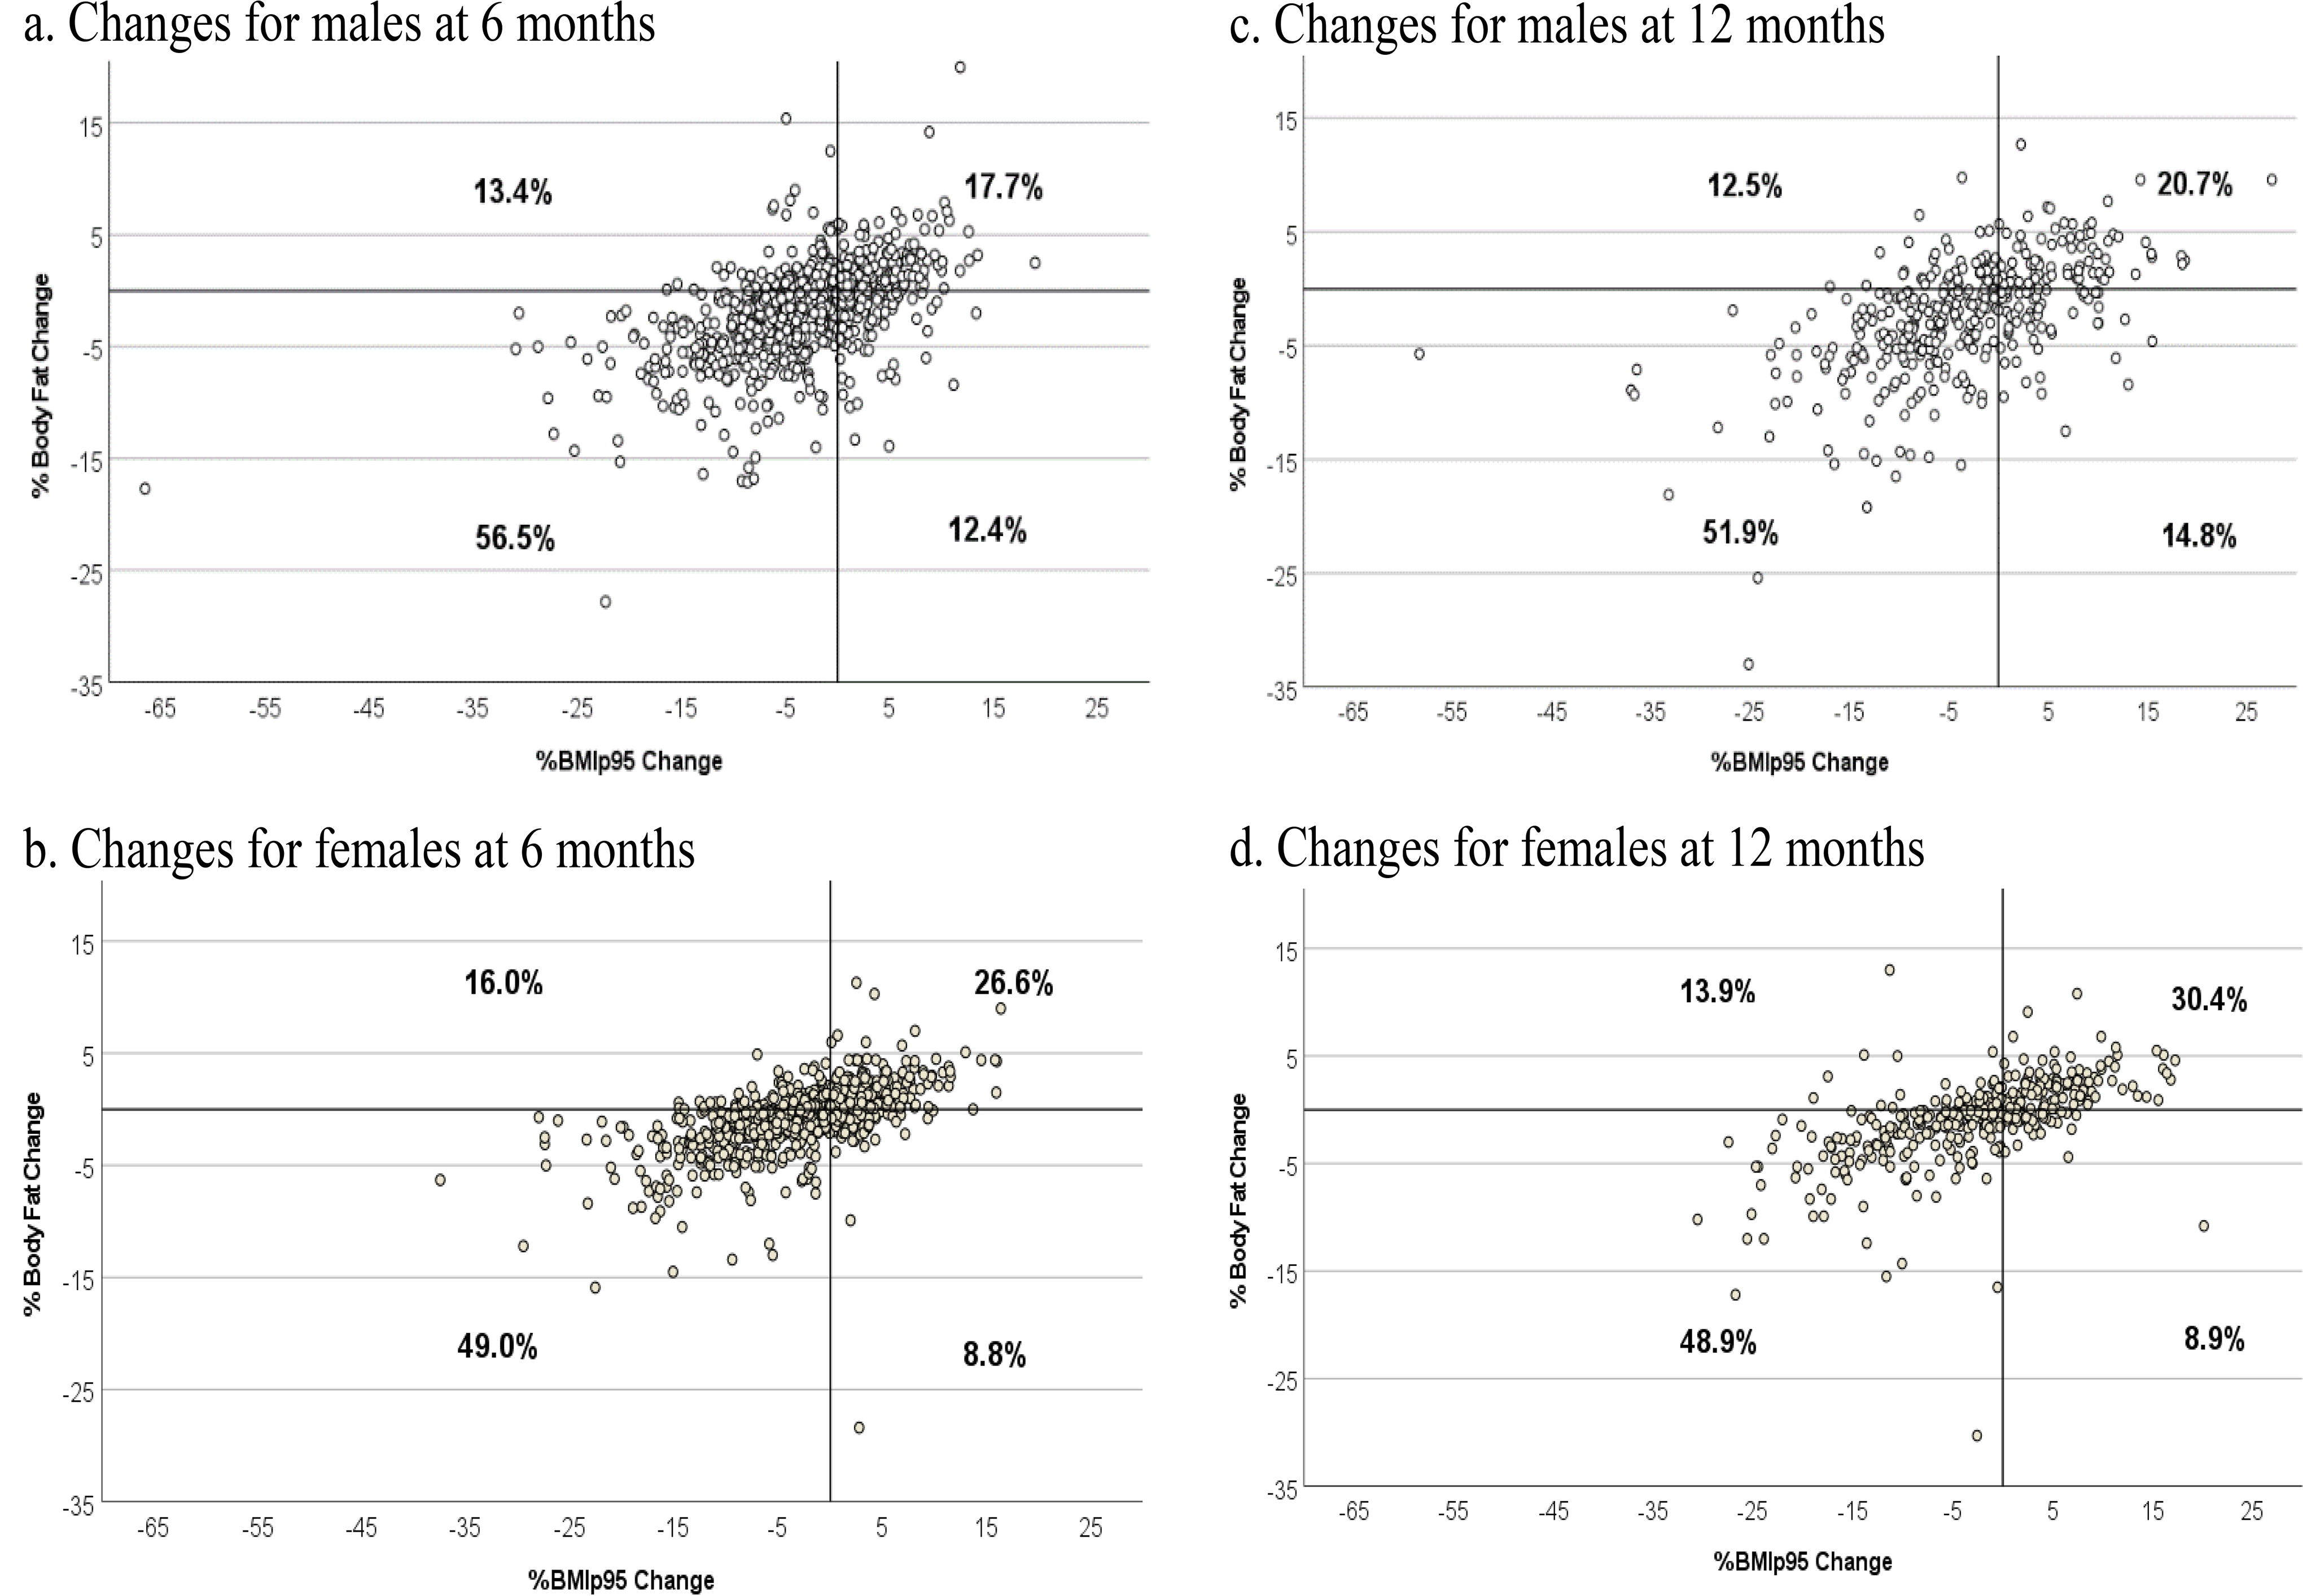
Scatterplots of % body fat change by %BMIp95 change at 6 and 12 months for males and females.
Change in %BF and %BMIp95
Table 2 shows change over 6- and 12-month follow-up and number of visits for males and females. Males (68.9%) more often had a decrease in %BF as compared with females (57.8%) (p < 0.001); with a median difference of 1% greater drop in %BF (−1.4% vs. −0.4%, p < 0.001). The percentage of youth having a ≥5-point drop in %BMIp95 was similar for males (36.5%) and females (32.4%, p = 0.080), but males had a median ∼1-point greater drop in %BMIp95 as compared with females (−3.0% vs. −1.9%, respectively, p = 0.023).
Factors to Examine Changes in % BF and %BMIp95 over 6 and 12 Months by Sex
p values are based on Pearson’s chi-square tests for categorical row variables.
p values for comparing continuous variables are based on Mann–Whitney U test.
Bolded p values reached statistical significance.
Multivariate LRs Evaluating Associations with Changes in %BF
Table 3 presents the multivariate LR for males and females evaluating associations with changes in %BF. For males, five characteristics significantly increased the odds of having a decrease in %BF (older age, higher initial %BF level, completing ≥6 visits, lack of DC, and lack of a depression/anxiety concern). For females, three characteristics significantly increased the odds of having a decrease in %BF (younger age, higher initial %BF level, and lack of a depression/anxiety concern).
Logistic Regression: % Body Fat Change (Decrease vs. Stable/Increase) over 6 and 12 Months for Males and Females
% Body fat level: Level 1: females <41%, males <37%; Level 2: females ≥41% to <48%, males ≥37% to <45%; Level 3: females ≥48%, males ≥45%.
Includes site as a random effect (n = 13 for males and n = 14 for females).
Includes site as a random effect and other characteristics in the model.
CI, confidence interval; OR, odds ratio; Ref, reference. Bolded p values reached statistical significance.
Multivariate LRs Evaluating Associations with Changes in %BMIp95
Table 4 presents the multivariate LR for males and females evaluating associations with changes in %BMIp95. For males, two characteristics significantly increased the odds of having a ≥5-point drop (higher initial obesity class and identifying as White, as compared with “Other or Multiracial”). For females, four characteristics significantly increased the odds of having a ≥5-point drop (younger age, identifying as White as compared to “Other or Multiracial,” higher initial obesity class, and having a DC).
Logistic Regression to Examine Associations with ≥5-Point Drop of %BMIp95 over 6 and 12 Months for Males and Females
Obesity class: Class 1, 100% to <120% %BMIp95; Class 2, 120% to <140% %BMIp95 or ≥35 kg/m2; Class 3, ≥ 140% %BMIp95 or ≥40 kg/m2.
Includes site as a random effect (n = 13 for males and n = 14 for females).
Includes site as a random effect and other characteristics in the model.
Bolded p values reached statistical significance.
Relationship Between Changes in %BF and %BMIp95
The relationships between changes in %BF and changes in %BMIp95 at 6- and 12-month follow-ups are shown in Figure 2. Males (56.5%) more frequently had reductions of both %BF and %BMIp95 as compared to females (49.0%) (chi-square, p < 0.001).
Discussion
This is the first study to report on %BF measurements obtained as part of clinical care across ages 5–18 years in a sample of youth presenting for PWM. Approximately 75% had severe obesity, which is similar to other reports.21,22 The %BF values found for both males and females were generally higher than previously reported reference curves.11,23 For males, the %BF across ages was relatively flat with minimal postpubertal drop, in contrast to what has been reported.11,23 Females had increasing %BF with age, as previously described.11,23
To improve understanding of %BF and adjust for %BF level severity at initial visit in analyses, we developed a new metric, %BF Level group. Measuring %BF and interpreting it using %BF level group may prove to be a helpful clinical tool. A better understanding of %BF in relation to %BMIp95 change during clinical visits may provide an opportunity to celebrate success and identify areas for targeted counseling in physical activity or nutrition.
Factors associated with lowering of %BF varied by sex. Older males more often had lowering of %BF, whereas older females less often had lowering. These differences are influenced by pubertal changes24,25 and potentially by differences in activity levels with age. 26 For males, but not for females, at 6-month follow-up those with a DC less frequently had lowering of %BF; this may be related to males with a disability spending less time participating in moderate to vigorous physical activity. 27 Both males and females who reported depression/anxiety at the initial visit less often had lowering of %BF; one possible explanation is lower levels of physical activity, as previously described in the literature.26,28 These findings highlight the need for specialized PWM care for youth with a DC or depression/anxiety.
Factors associated with a 5-point drop in %BMIp95 also varied by sex and differed from factors associated with a drop in %BF. For males, age-related differences were not found; possibly pubertal-related muscle mass gains for the older males 29 may be lowering %BMIp95 drop. Future research to evaluate the role of antiobesity medication use may improve the understanding of factors related to a drop in %BMIp95. The influence of having depression/anxiety or a DC also varied by sex and by outcome evaluated. Additional work is needed to ensure that PWM programs are addressing the needs of all youth, including those with these concerns.
Limitations
While BIA is a convenient clinical tool, confidence in the results of the findings related to %BF change herein should be interpreted in light of studies exploring the use of BIA measurement.18,30–32 Nevertheless, when used to track %BF changes in adolescents with obesity, DEXA and BIA have a significant concordance and similarly track %BF change, but tracking ability diminishes with higher weight and higher changes in body composition. 33 An additional limitation of our data includes a lack of standardization of BIA equipment across sites. This heterogeneity represents the reality of PWM care across programs.
Several other limitations warrant consideration. While there were over 5000 participants with an initial visit, only about 1/3 were included in the evaluations of changes over 6 months and <20% at 12-month follow-up. These patterns have previously been reported for POWER. 34 Although Tanner stage data were lacking for many participants, we adjusted ranges for age groups by sex to best approximate Tanner stage groupings. The analyses did not include information on medications; those data were not collected by POWER during the study period. Body composition can be impacted by antiobesity medications that lower %BF,35–38 and a variety of other drugs that increase %BF, particularly antipsychotic and antiretroviral medications.39,40
Conclusions
This study found differences between males and females in initial visit %BF and %BMIp95, as well as differences in changes in these metrics over time and characteristics associated with changes. PWM care programs should consider evaluating body composition. Future research is needed on optimal ways to apply this metric in the clinical setting. These data demonstrate the need to stratify outcome evaluations by sex; this will be particularly important for studies evaluating body composition.
Impact Statement
This multisite study is the first to describe percent body fat (%BF) measurements obtained in youth presenting for weight management care. Findings demonstrate changes over time in %BF and weight status and identify sex-specific factors associated with changes to each. These factors may be important to consider when aiming to improve clinical care delivery.
Footnotes
Acknowledgments
The authors are grateful to the many patients and family members who participate in POWER and for the many care providers who have contributed data to POWER. Abraham-Pratt I., Fals A. Florida Hospital for Children (Orlando, FL); Armstrong S. Duke Children’s Hospital and Health Center (Durham, NC); Binns H., Ariza A. Ann & Robert H. Lurie Children’s Hospital of Chicago (Chicago, IL); Christison A. University of Illinois College of Medicine (Peoria, IL); Cuda S., Children’s Hospital of San Antonio (San Antonio, TX); de Heer D. Fit Kids of Arizona at Northern Arizona Healthcare (Flagstaff, AZ); de la Torre A., Cook Children’s Medical Center (Fort Worth, TX); Fox C, Kelly A. University of Minnesota Masonic Children’s Hospital (Minneapolis, MN); Gaddis M., Mutchie J., Peterson S. St. Luke’s Children’s Hospital (Boise, ID); Gordan C., Dedekian M. Barbara Bush Children’s Hospital at Maine Medical Center (Portland, ME); Hendrix S., Ward W. Arkansas Children’s Hospital (Little Rock, AR); Herring W. University of Mississippi Medical Center (Jackson, MS); Hes D. Gramercy Pediatrics (New York City, NY); Iqbal A. Marshfield Clinic Health Systems (Marshfield, WI); Jenkins L. Dell Children’s Medical Center (Austin, TX); Joseph M. University of Florida Health at Wolfson Children’s Hospital (Jacksonville, FL); Kim R. Cleveland Clinic Children’s (Cleveland, OH); Kirk S. Cincinnati Children’s Hospital Medical Center (Cincinnati, OH); Kumar S. Mayo Clinic Rochester (Rochester, MN); Lamiaa A, Hendrix A. University of Oklahoma, Early Lifestyle Intervention Clinic (Tulsa, OK); Liu L., Grow M. Seattle Children’s Hospital (Seattle, WA); McClure A., Hofley M. Children’s Hospital at Dartmouth-Hitchcock (Lebanon, NH); Naramore S. Riley Hospital for Children at UI Health (Indianapolis, IN); Negrete S, Dalen J. University of New Mexico Children’s Hospital (Albuquerque, NM); Novick M., Williams R. Penn State Children’s Hospital (Hershey, PA); Oden J., Kim R., Gupta O. Children’s Medical Center—UT Southwestern Medical Center (Dallas, TX); Ohara V. Eastern Maine Medical Center (Bangor, ME); Radulescu A. Kentucky Children’s Hospital, UK Health Care (Lexington, KY); Safder S., Ross M. Arnold Palmer Hospital Center for Digestive Health and Nutrition (Orlando, FL); Santos M., Trapp C., Boyle K. Connecticut Children’s Medical Center (Hartford, CT); Stoll J.M. St. Louis Children’s Hospital (St. Louis, MO); Stratbucker W., Tucker J. Helen DeVos Children’s Hospital (Grand Rapids, MI); Sweeney B. Children’s Mercy Kansas City (Kansas City, MO); Tester J. Children’s Hospital Oakland (Oakland, CA); Turner L. Children’s Hospital and Medical Center, Omaha (Omaha, NE); Vidmar A., Borzutzky C., Fink C.—Children’s Hospital of Los Angeles (Los Angeles, CA); Wallace S. UAB Pediatrics/Children’s of Alabama (Birmingham, AL); Walsh S. Children’s Hospital of Atlanta (Atlanta, GA); Weedn A. University of Oklahoma Health Sciences Center (Oklahoma City, OK); Wittcopp C. Baystate Children’s Hospital (Springfield, MA); Woolford S. C.S. Mott Children’s Hospital (Ann Arbor, MI); and Yee J., Perez De La Garza G., Grace B. Harbor UCLA Medical Center (Torrance, CA).
Authors’ Contributions
M.Q.: Conceptualization (equal), formal analysis (equal), methodology (equal), project administration (lead), writing—original draft (equal), and writing—reviewing and editing (equal). A.A.: Conceptualization (supporting), formal analysis (equal), writing—original draft (equal), and writing—reviewing and editing (supporting). J.T.: Conceptualization (supporting), methodology (supporting), and writing—review and editing (supporting). J.B.: Methodology (supporting) and writing—reviewing and editing (supporting). E.K.: Data curation (equal), formal analysis (supporting), and writing—reviewing and editing (supporting). S.K.: Data curation (supporting), formal analysis (supporting), supervision (lead), and writing—reviewing and editing (supporting). B.S.: Methodology (supporting) and writing—review and editing (supporting). M.S.: Methodology (supporting) and writing—reviewing and editing (supporting). L.S.: Methodology (supporting) and writing—review and editing (supporting). K.R.: Methodology (supporting) and writing—reviewing and editing (supporting). H.B.: Conceptualization (equal), data curation (equal), formal analysis (equal), methodology (equal), project administration (supporting), writing—original draft (equal), and writing—reviewing and editing (equal).
Funding Information
POWER is supported by participation fees from pediatric weight management programs in POWER.
Author Disclosure Statement
No competing financial interests exist.
References
Supplementary Material
Please find the following supplemental material available below.
For Open Access articles published under a Creative Commons License, all supplemental material carries the same license as the article it is associated with.
For non-Open Access articles published, all supplemental material carries a non-exclusive license, and permission requests for re-use of supplemental material or any part of supplemental material shall be sent directly to the copyright owner as specified in the copyright notice associated with the article.