
Abstract
Abstract
Research in systems biology has made available large amounts of data about interactions among cell building blocks (e.g., proteins, genes). To properly look up these data and mine useful information, the design and development of automatic tools has become crucial. These tools leverage Biological Networks as a formal model to encode molecular interactions. Biological networks can be fed as input to graph-based techniques useful to infer new information about cellular activity and evolutive processes of the species. In this context, a rather interesting family of techniques is that of network querying. Network querying tools search a whole biological network to identify conserved occurrences of a given query module for transferring biological knowledge. Indeed, inasmuch as the query network generally encodes a well-characterized functional module, its occurrences in the queried network suggest that the latter (and, as such, the corresponding organism) features the function encoded by the former. The aim of this paper is that of analyzing and comparing tools devised to query biological networks. This analysis is intended to help in understanding problems and research issues, state of the art and opportunities for researchers working in this area.
1. Introduction
Generally speaking, there are several ways to compare biological networks, but network alignment, network integration and network querying, are regarded as the most significant ones (Sharan and Ideker, 2006).
Network alignment is the process of globally comparing two or more networks of the same type belonging to different species in order to identify similarity and dissimilarity regions. Network alignment is commonly applied to detect conserved sub-networks, which are likely to represent common functional modules (Singh et al., 2007).
On the other hand, Network integration is the process of combining several networks of the same species, representing different kinds of interactions (e.g., protein-protein, metabolic), to study their interrelations. For instance, network integration techniques have been used to predict protein-protein interactions and identify protein modules (Kelley and Ideker, 2005; Zhang et al., 2005).
Finally, network querying techniques search a whole biological network to identify conserved occurrences of a given query module, which can be used for transferring biological knowledge from one species to another (or possibly within the same species). Indeed, since the query generally encodes a well-characterized functional module (e.g., the MAPK cascade in yeast), its occurrences in the queried network (which will correspond to the MAPK cascade, for instance, in human) suggest that the latter (and then the corresponding organism) features the function encoded by the former.
This article focuses on those techniques devised to query biological networks. In this respect, two important issues must be taken into account: (i) that sub-graph isomorphism checking, which is a sub-problem of network querying, is well-known to be NP-complete (Garey and Johnson, 1979), thus limiting the applicability of exact techniques; (ii) that any effective approach should look for approximated, rather than exact, occurrences of the query sub-network, the latter being necessary to take into the right account the possible modifications of functional modules determined by evolutive processes (Berg et al., 2004).
In the last few years, the problem of querying biological networks has been studied by several researchers (Dost et al., 2008; Durand et al., 2006; Ferro et al., 2007; Fionda et al., 2008; Kelley et al., 2003; Pinter et al., 2005; Shlomi et al., 2006; Tian et al., 2007; Wernicke and Rasche, 2007; Yang and Sze, 2007; Bruckner et al., 2009; Qian et al., 2009). However, computational techniques for network querying are still at an early stage, thus making this research area still open and worth investigating.
In this context, the goal of this article is to analyze and compare various facets of available network querying algorithms. In particular, the following specific aspects will be considered: (a) adopted network model; (b) biological information exploited (e.g., sequence similarity, interaction reliabilities); (c) delivery of exact versus approximate results; (d) types of approximation supported (e.g., node insertions and deletions); (e) handling of general versus specific types of network; (f ) supported query structures; (g) adoption of exact versus heuristic algorithms; (h) computational complexity; (i) software availability and modifiability, (j) user interface; (k) data used for the evaluation and (l) biological results obtained. Some relevant data pertaining the comparisons carried out in this paper are listed in Table 2 (concerning points (b)–(h)), Table 3 (concerning points (i) and (j)), and Table 4 (concerning point (k)).
The analysis performed in this work is meant to provide a comparative overview on the network querying techniques developed in the last few years. This will be hopefully useful to understand problems and research issues, state of the art and opportunities for researchers working in this area.
The remainder of this article is organized as follows. The next section starts by providing some background information. Moreover, a basic comparison of the network querying techniques, focusing on points (a)–(d), is developed. Section 3 briefly describes the methods and systems and compares them with respect to point (e). In Section 4, a coarse-grain comparison is carried out with respect to points (f )–(k). Section 5 compares the biological results obtained by running the tools on real interaction data. Finally, Section 6 discusses the strengths and weaknesses of the considered approaches and draws some conclusions.
2. Preliminaries
This section starts by providing some background information about the network querying problem. Hence, network querying algorithms will be compared along the following directions:
(a) adopted network model; (b) biological information exploited (e.g., sequence similarity, interaction reliabilities, etc.); (c) delivery of exact versus approximate results; (d) types of approximation supported (e.g., node insertions and deletions);
Some relevant data pertaining the comparison carried out in this section are listed in Table 2.
2.1. Biological network modeling
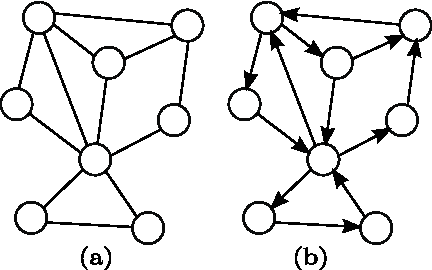
Biological networks, which store information about molecular relationships and interactions, can be conveniently represented as graphs. A graph is built from of a set of nodes or vertices, representing cellular building blocks (e.g, proteins or genes), and a set of edges (directed or undirected), representing interactions (Fig. 1). In an undirected graph, an edge linking nodes A and B represents a mutual interaction. Conversely, in a directed graph, each edge represents the flow of material or information from a source node to a target node.
Different types of graphs are used to represent different types of biological networks, each of which stores information about interactions related to specific entities or molecules (Albert, 2005). Relevant kinds of networks include: transcriptional regulatory networks, signal transduction networks, metabolic networks and protein-protein interaction (PPI) networks.
Graphs used to model transcriptional regulatory networks (Lee et al., 2002) have two types of nodes, representing the transcriptional factors and the mRNAs of the target genes, respectively, and two types of directed edges, representing transcriptional regulation and translation, respectively. Sometimes a simpler graph model is adopted, which combines genes with transcriptional factors they encode to obtain a graph all the nodes of which represent genes. In this latter representation, an edge connects a source gene to a target gene if the source gene produces RNA or a protein acting as a transcriptional activator or inhibitor of the target gene. If the gene is an activator, then it is the source of a positive regulatory connection; if it is an inhibitor, then it is the source of a negative regulatory connection.
In signal transduction networks (Janes and Yaffe, 2008), graph vertices represent proteins and edges are directed. This type of networks stores information about the processes through which a cell converts one kind of signal or stimulus into another. In particular, the signal transduction corresponds to the propagation of molecular or physical signals (for example, sensory stimuli) from a cell's exterior to its intracellular response mechanisms.
Metabolic networks, storing the set of metabolic and physical processes of the cell, consist of weighted tripartite graphs with three types of nodes, that are, metabolites, reactions and enzymes, and two types of edges representing mass flow and catalytic regulation, respectively. The first type of edge connects reactants to reactions and reactions to products. The second type connects enzymes to the reactions they catalyze. Also in this context, simpler graph models have been proposed. In particular, in some metabolic network querying techniques (Pinter et al., 2005; Tian et al., 2007), nodes represent enzymes and directed edges connect pairs of enzymes for which the product of the source enzyme is a substrate of the sink enzyme. In another simplified model, used in some of the reviewed techniques (Wernicke and Rasche, 2007), nodes represent metabolites and directed edges represent enzymes that catalyze a reaction having the source metabolite as the reactant and the sink metabolite as the product. A slightly more complicated model (Yang and Sze, 2007) considers two types of nodes, chemical compounds and enzymes. For each enzyme node, an incoming edge occurs with each of its substrate nodes and an outgoing edge occurs with each of its product nodes.
In graphs modeling protein-protein interaction (PPI) networks, the nodes represent proteins and the edges are undirected and possibly weighted, with two proteins connected by an edge if they bind. This formalism has been adopted in all the approaches considered in this paper, but only some of them incorporate reliability information encoded as edge weights (Shlomi et al., 2006; Dost et al., 2008; Fionda et al., 2008; Qian et al., 2009; Bruckner et al., 2009). Since protein interactions are often obtained from protein complex detection and not really as binary interactions, hyper-graphs might be usefully adopted as the reference representation model as well.
On the more formal side, a biological network N is commonly represented by a (possibly directed) graph GN = 〈VN,EN〉 (Fig. 2), in which the set of nodes (or vertices) VN denotes a set of cell building blocks (proteins, enzymes, metabolites, genes, etc.) and the set of edges EN encodes the interactions between pairs of nodes.
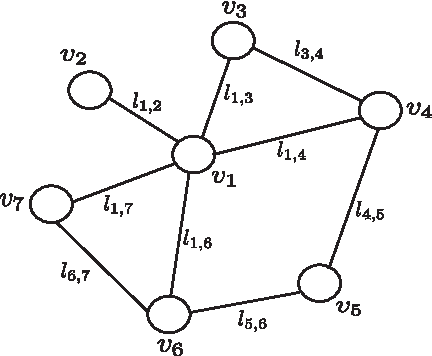
An example of biological network graph GN.
In the most general definition, each edge
Biological networks can be queried in order to extract useful biological information. Let GQ = 〈VQ,EQ〉 and GT 〈VT, ET〉 be a pair of biological networks, corresponding to the sub-network used as query and the network to be queried, respectively. The goal of a network querying algorithm is to retrieve the sub-networks of GT similar to GQ.
2.2. Node similarity computation
Usually, a similarity score between the nodes of the query network and the nodes of the target network is exploited by network querying algorithms. In our analysis we noted that only two techniques (Durand et al., 2006; Ferro et al., 2007) do not take any advantage of the similarity between nodes. Similarity values, if exploited, are computed in different ways depending on the kind of the biological networks under inspection.
For example, in PPI networks, similarity between proteins is often computed by exploiting the score obtained by aligning their amino acid sequences. The alignment of two amino acid sequences is a way of arranging the two sequences in order to maximize their (either local or global) similarity. This way, similarity regions (deriving from functional, structural, or evolutionary relationships between the sequences) can be identified. In this context, BLAST (Basic Local Alignment Search Tool) (Tatusova and Madden, 1999) is one of the most widely used software to align protein sequences. An alternative is the PRSS routine of the FASTA package (Pearson and Lipman, 1988). The output of a BLAST or PRSS alignment is accompanied by an expectation value (the so called E-value): the lower the E-value, the more significant the resultant alignment.
Among the analyzed techniques, only one (Qian et al., 2009) exploits the PRSS routine, whereas all the others (Kelley et al., 2003; Shlomi et al., 2006; Dost et al., 2008; Yang and Sze, 2007; Fionda et al., 2008; Bruckner et al., 2009) use BLAST. Another interesting point is that the analyzed techniques differ from one another in the threshold value used to assess if two proteins are similar. As an example, PATHBLAST (Kelley et al., 2003) considers two proteins similar if they are characterized by a BLAST E-value smaller than or equal to 10−2, whereas Torque (Bruckner et al., 2009) considers two proteins similar if their E-value is less than 10−7. Another way to assess protein similarity is by exploiting some databases like COG (Clusters of Orthologous Groups) (Tatusov et al., 1997) or KEGG (Kyoto Encyclopedia of Genes and Genomes) (Kanehisa and Goto, 2000). These databases organize proteins into orthologous groups, so that two proteins are deemed similar if they belong to the same group.
On the other hand, in dealing with metabolic networks, the similarity between pairs of enzymes is measured according to the EC (Enzyme Commission) classification, that is, a numbering system, consisting of four sets of numbers, that categorize the type of the catalyzed chemical reaction (Tohsato et al., 2000). Note that the EC numbers give a functional classification that does not necessarily reflect sequence similarity. All the techniques for metabolic networks analyzed in this article (Pinter et al., 2005; Wernicke and Rasche, 2007; Yang and Sze, 2007; Tian et al., 2007) exploit EC-numbers to deal with enzyme similarity.
2.3. Approximation handling
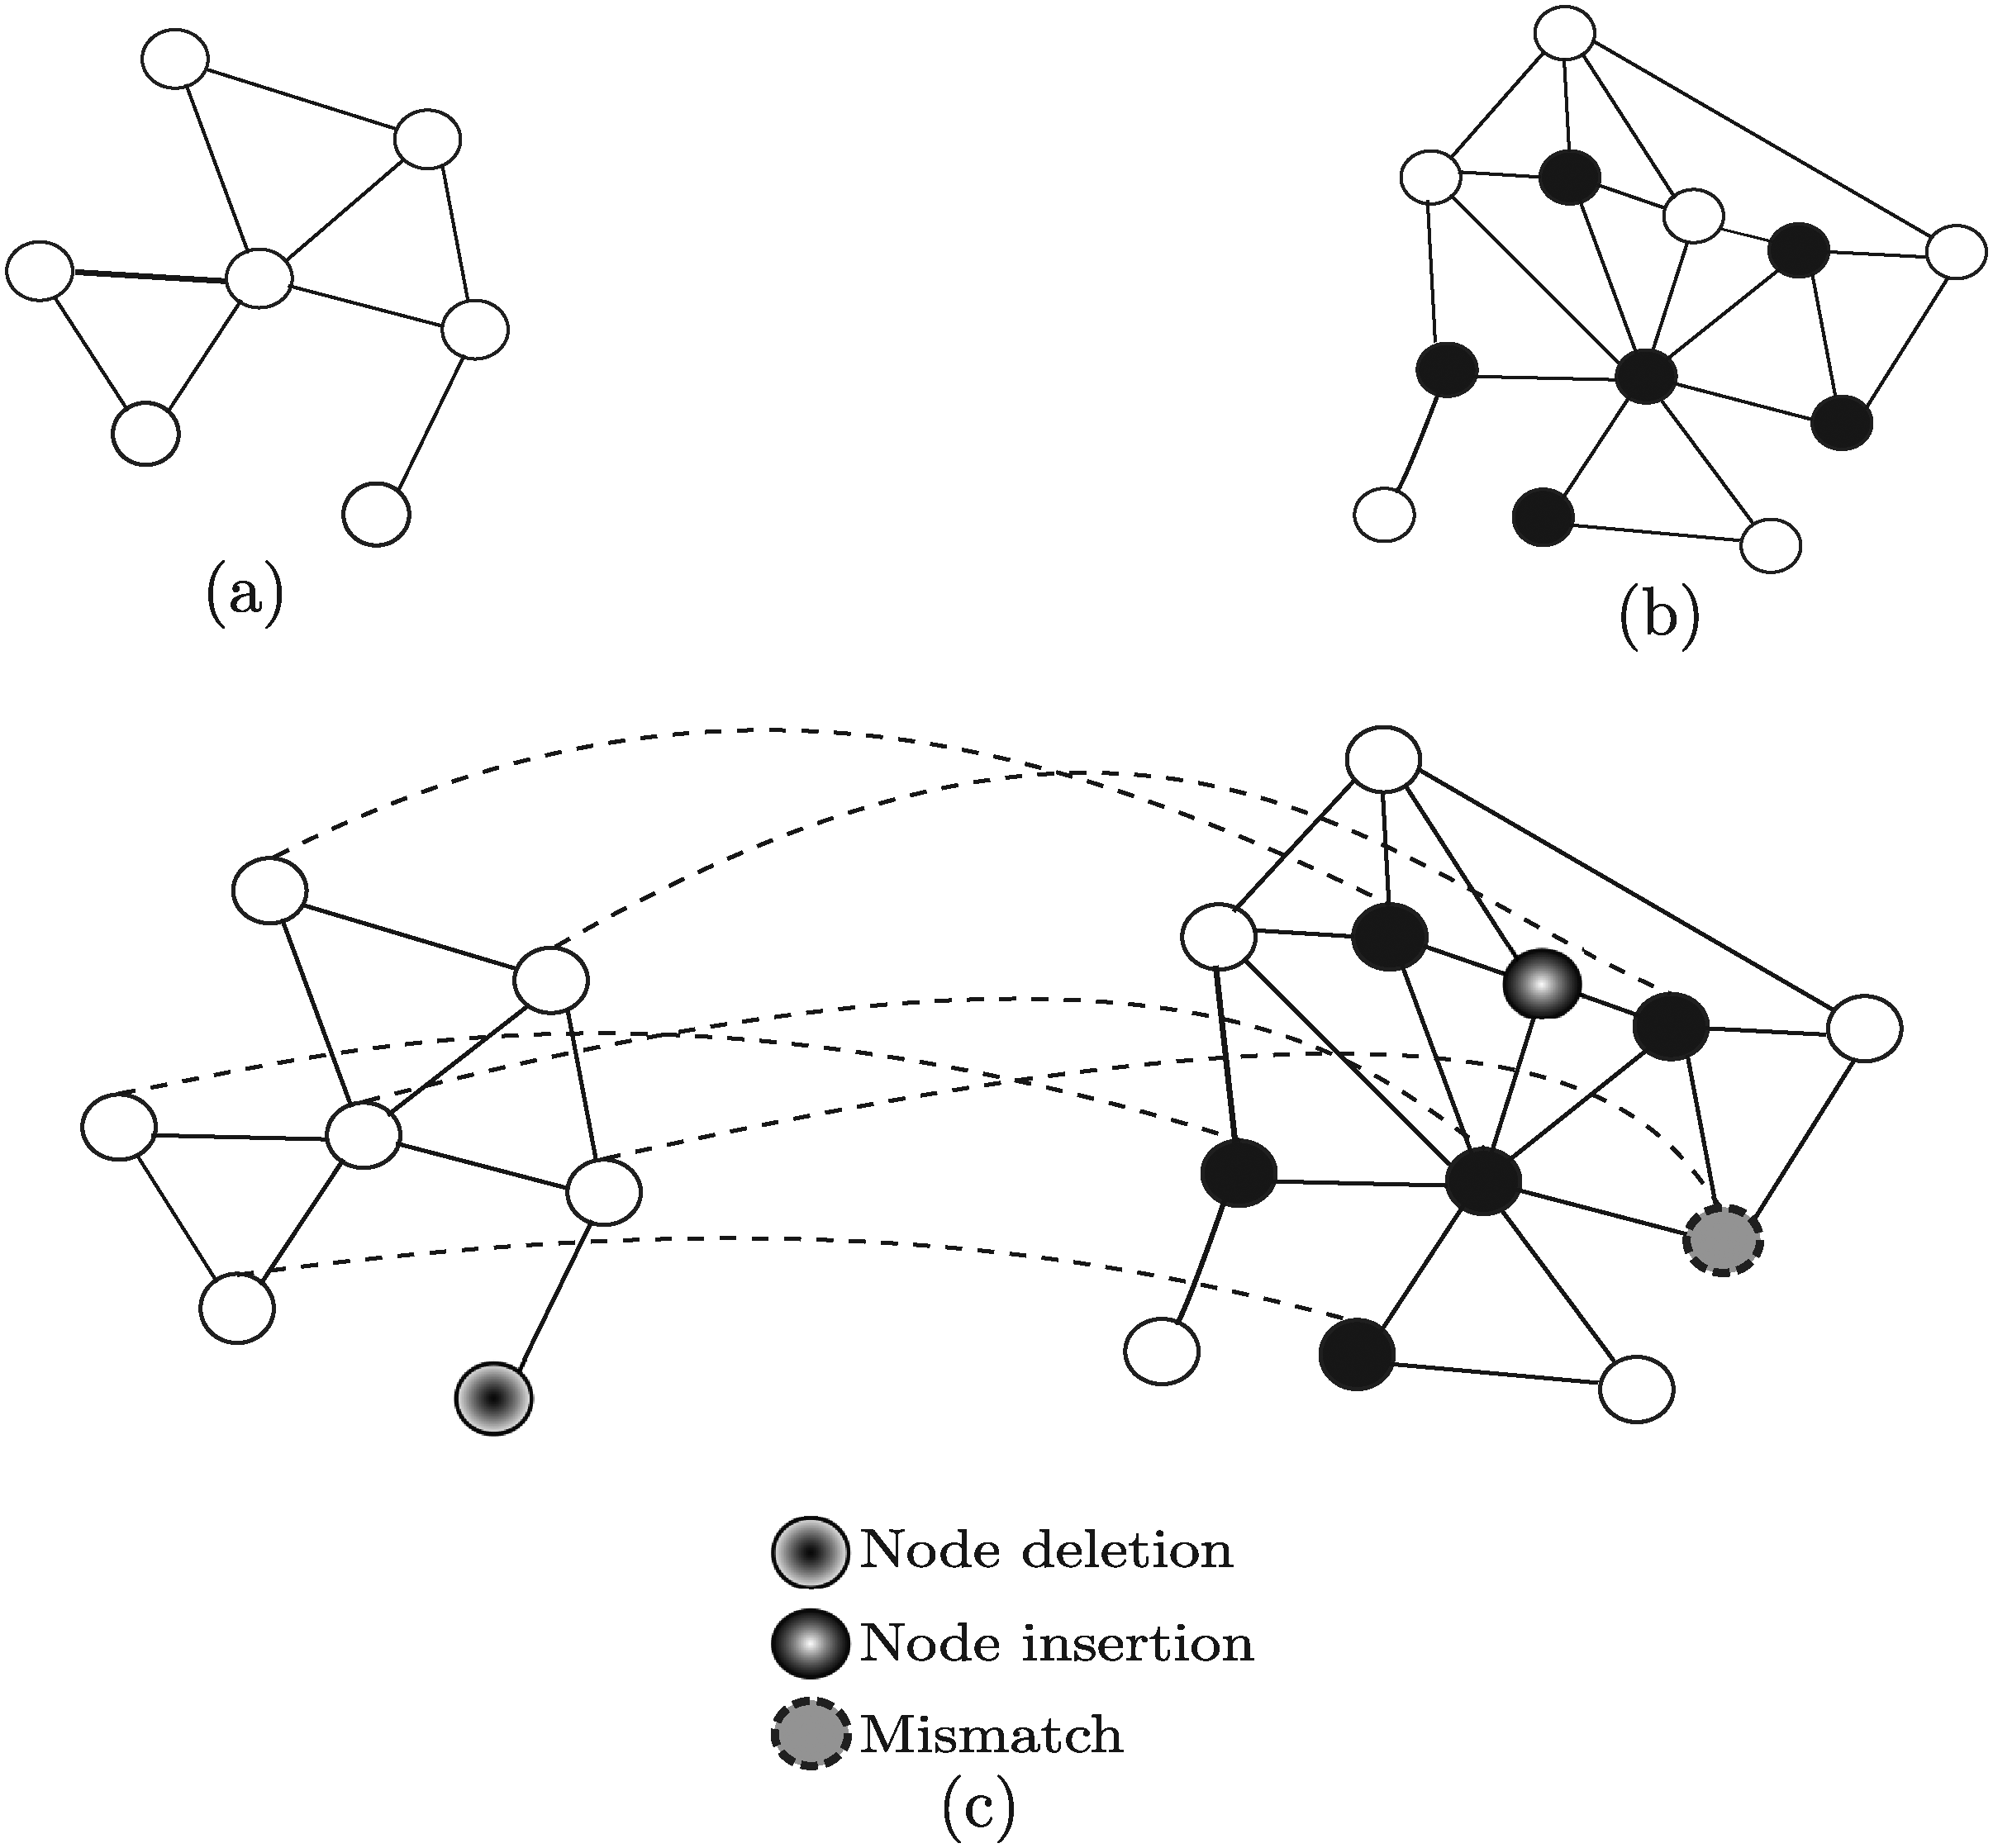
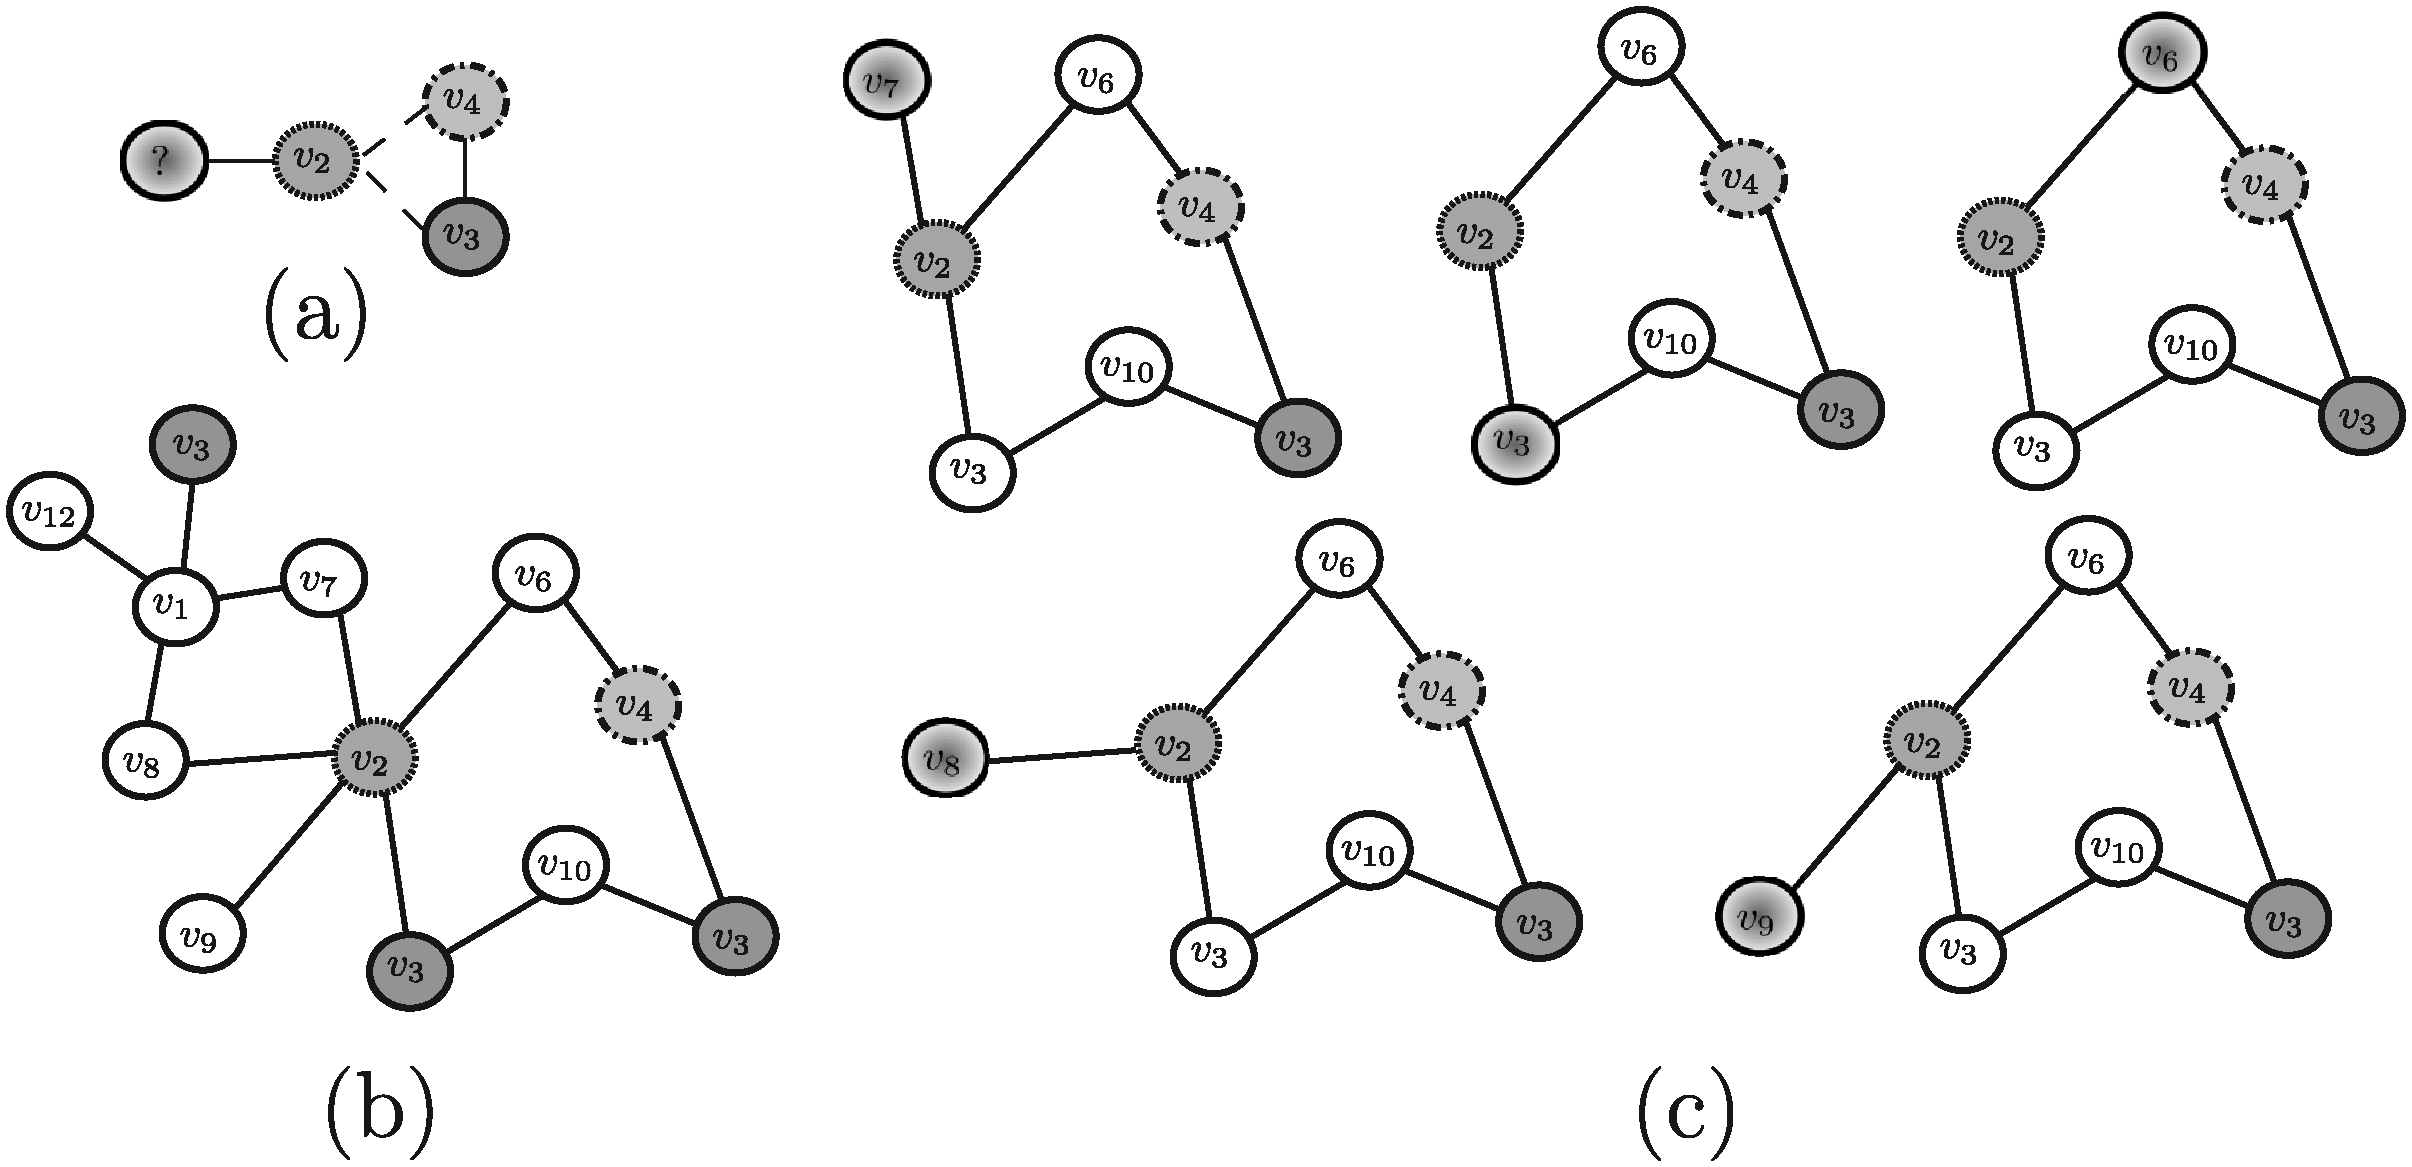
Given a query network GQ = 〈VQ,EQ〉 and a target network GT = 〈VT, ET〉, a potential solution of the querying problem is a sub-graph of GT, hereafter denoted by σ, which represents a (possibly approximated) occurrence of GQ in GT (for a summary of the notation used in this article, see Table 1). Approximation handling is needed for dealing with possible occurrences of evolution events modifying a network structure. This also allows to appropriately consider the significant number of both false negative and false positive interactions found when looking up existing databases. Overall, different types of approximation should be taken into account: (i) node insertions, corresponding to the addition of nodes in the target network; (ii) node deletions, corresponding to the additions of nodes in the query network; and (iii) node mismatches, corresponding to pairs of nodes characterized by a low similarity, but sharing similar biological characteristics (e.g., proteins performing the same function). Examples of evolution events that may affect protein-protein interaction networks are: gene duplication, that causes the addition of new nodes (proteins), and link dynamics, corresponding to gain or loss of interactions through mutations in proteins (Berg et al., 2004). Using approximate matching allows to obtain a solution σ in which: (i) some nodes belonging to GQ may not correspond to any node of σ (node deletions); (ii) some nodes belonging to σ may not correspond to any node of GQ (node insertions), and (iii) some corresponding pairs of nodes 〈vQ,vT 〉 may have low similarity (mismatches), but the retrieved (approximated) occurrence σ of GQ within GT is still biologically meaningful. Figure 3 shows an example of a query network GQ (Fig. 3a) and a target network GT (Fig. 3b). A potential solution of the querying problem σ is shown in Figure 3c. Note that σ is an approximate solution since it contains node insertions, node mismatches and node deletions.
Not all the approaches developed for network querying take into account the same types of approximations (Table 2). Rather, some of them (Durand et al., 2006; Ferro et al., 2007) search for sub-graphs that satisfy all the structural constraints imposed by the query. Surely, approximation occurrences should penalize the ranking of a given potential solution within the overall set of solutions. Indeed, the analyzed network querying techniques use a scoring schema to rank the potential solutions and, for instance, many PPI networks querying techniques (Shlomi et al., 2006; Dost et al., 2008; Yang and Sze, 2007; Tian et al., 2007; Fionda et al., 2008; Qian et al., 2009; Bruckner et al., 2009) rank solutions according to the sequence similarity of matching nodes with penalties introduced for approximations—(only for node insertions and deletions (Shlomi et al., 2006; Yang and Sze, 2007; Dost et al., 2008; Fionda et al., 2008; Bruckner et al., 2009) or also for mismatches (Kelley et al., 2003; Yang and Sze, 2007; Tian et al., 2007; Qian et al., 2009)). Besides, when applicable (Kelley et al., 2003; Shlomi et al., 2006; Dost et al., 2008; Fionda et al., 2008; Qian et al., 2009; Bruckner et al., 2009), the ranking scores also depend on edge reliabilities.
On the other hand, all the techniques developed to query metabolic networks (Pinter et al., 2005; Wernicke and Rasche, 2007; Tian et al., 2007; Yang and Sze, 2007) rank the potential solutions on the basis of matched enzyme similarities with penalties introduced for approximations (either for node insertions only (Pinter et al., 2005) or for both node insertions and deletions (Wernicke and Rasche, 2007; Yang and Sze, 2007; Tian et al., 2007)). Finally, one of the proposed technique (Tian et al., 2007) also takes into account graph structural differences, that is, differences in node connectivity relationships.
2.4. Problem statement
Before proceeding, the biological network querying problem is worth explicitly stated, as follows:
Given a query sub-network GQ and a target network GT, the biological network querying problem consists in finding the solutions σ corresponding to matching GQ onto GT attaining the maximum scores, according to a given scoring schema.
3. Methods
In the last few years, the problem of querying biological networks has been studied by several researchers. Hence, several tools (Dost et al., 2008; Durand et al., 2006; Ferro et al., 2007; Fionda et al., 2008; Kelley et al., 2003; Pinter et al., 2005; Shlomi et al., 2006; Tian et al., 2007; Wernicke and Rasche, 2007; Yang and Sze, 2007; Bruckner et al., 2009; Qian et al., 2009) have been made available. Some of these tools were developed with particular focus on specific types of networks (e.g., protein-protein interaction networks (Dost et al., 2008; Fionda et al., 2008; Kelley et al., 2003; Shlomi et al., 2006; Yang and Sze, 2007; Bruckner et al., 2009; Qian et al., 2009), or metabolic networks (Pinter et al., 2005; Tian et al., 2007; Yang and Sze, 2007; Wernicke and Rasche, 2007)), while others were designed to be generally applicable, being those able to query any type of biological graph (Durand et al., 2006; Ferro et al., 2007).
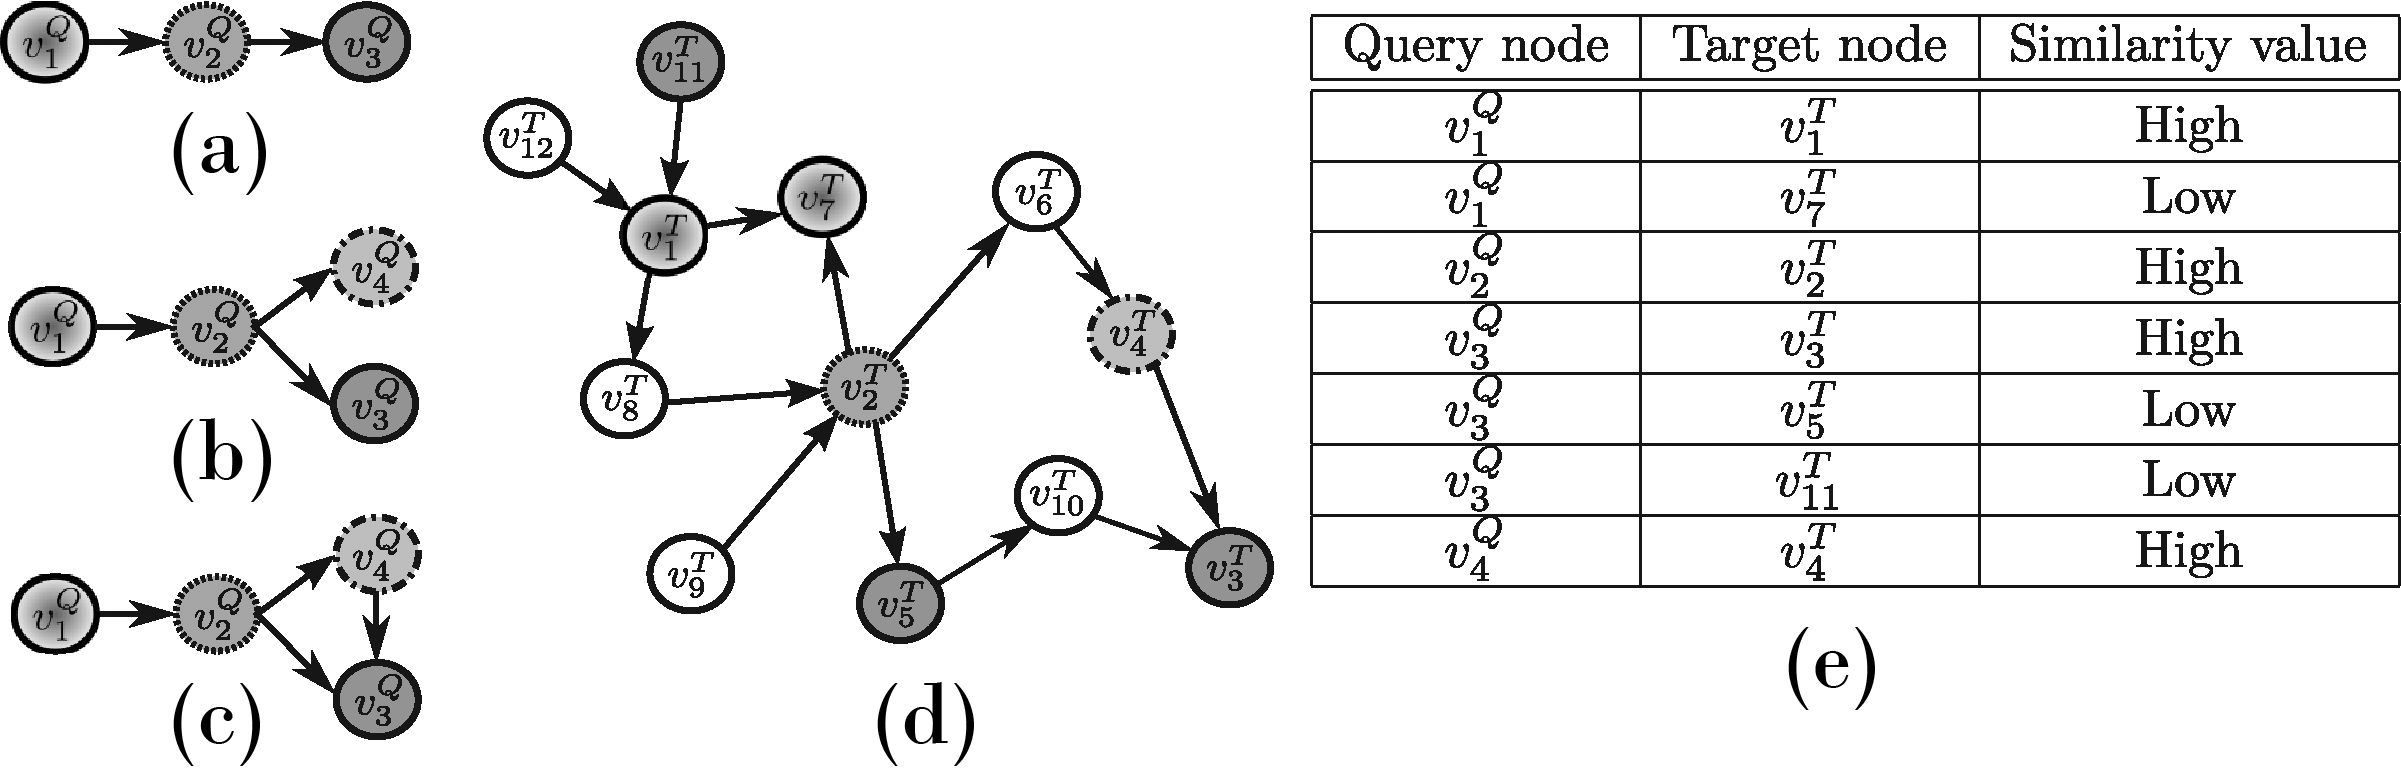
In order to evaluate the above mentioned tools, a synthetic example shown in Figure 4 (and repeated, for the sake of clarity, in Figures 5–13) will be used throughout. Note that, in this example, all edge weights are assumed to be equal to one. Moreover, we do not use numerical similarity values, but we use ”high” or ”low” to denote high or low node similarity, respectively. If no similarity value is indicated, no relevant similarity is assumed to hold between the corresponding nodes. For techniques dealing with undirected graphs, undirected graphs underlying those shown in Figure 4 are considered. Note that, in all the following figures, similar filling tones denote similar nodes.
3.1. Methods developed to query on protein-protein interaction (PPI) networks
Some of the approaches developed in the last few years to deal with the network query problem are mainly devoted to protein-protein interaction network analysis.
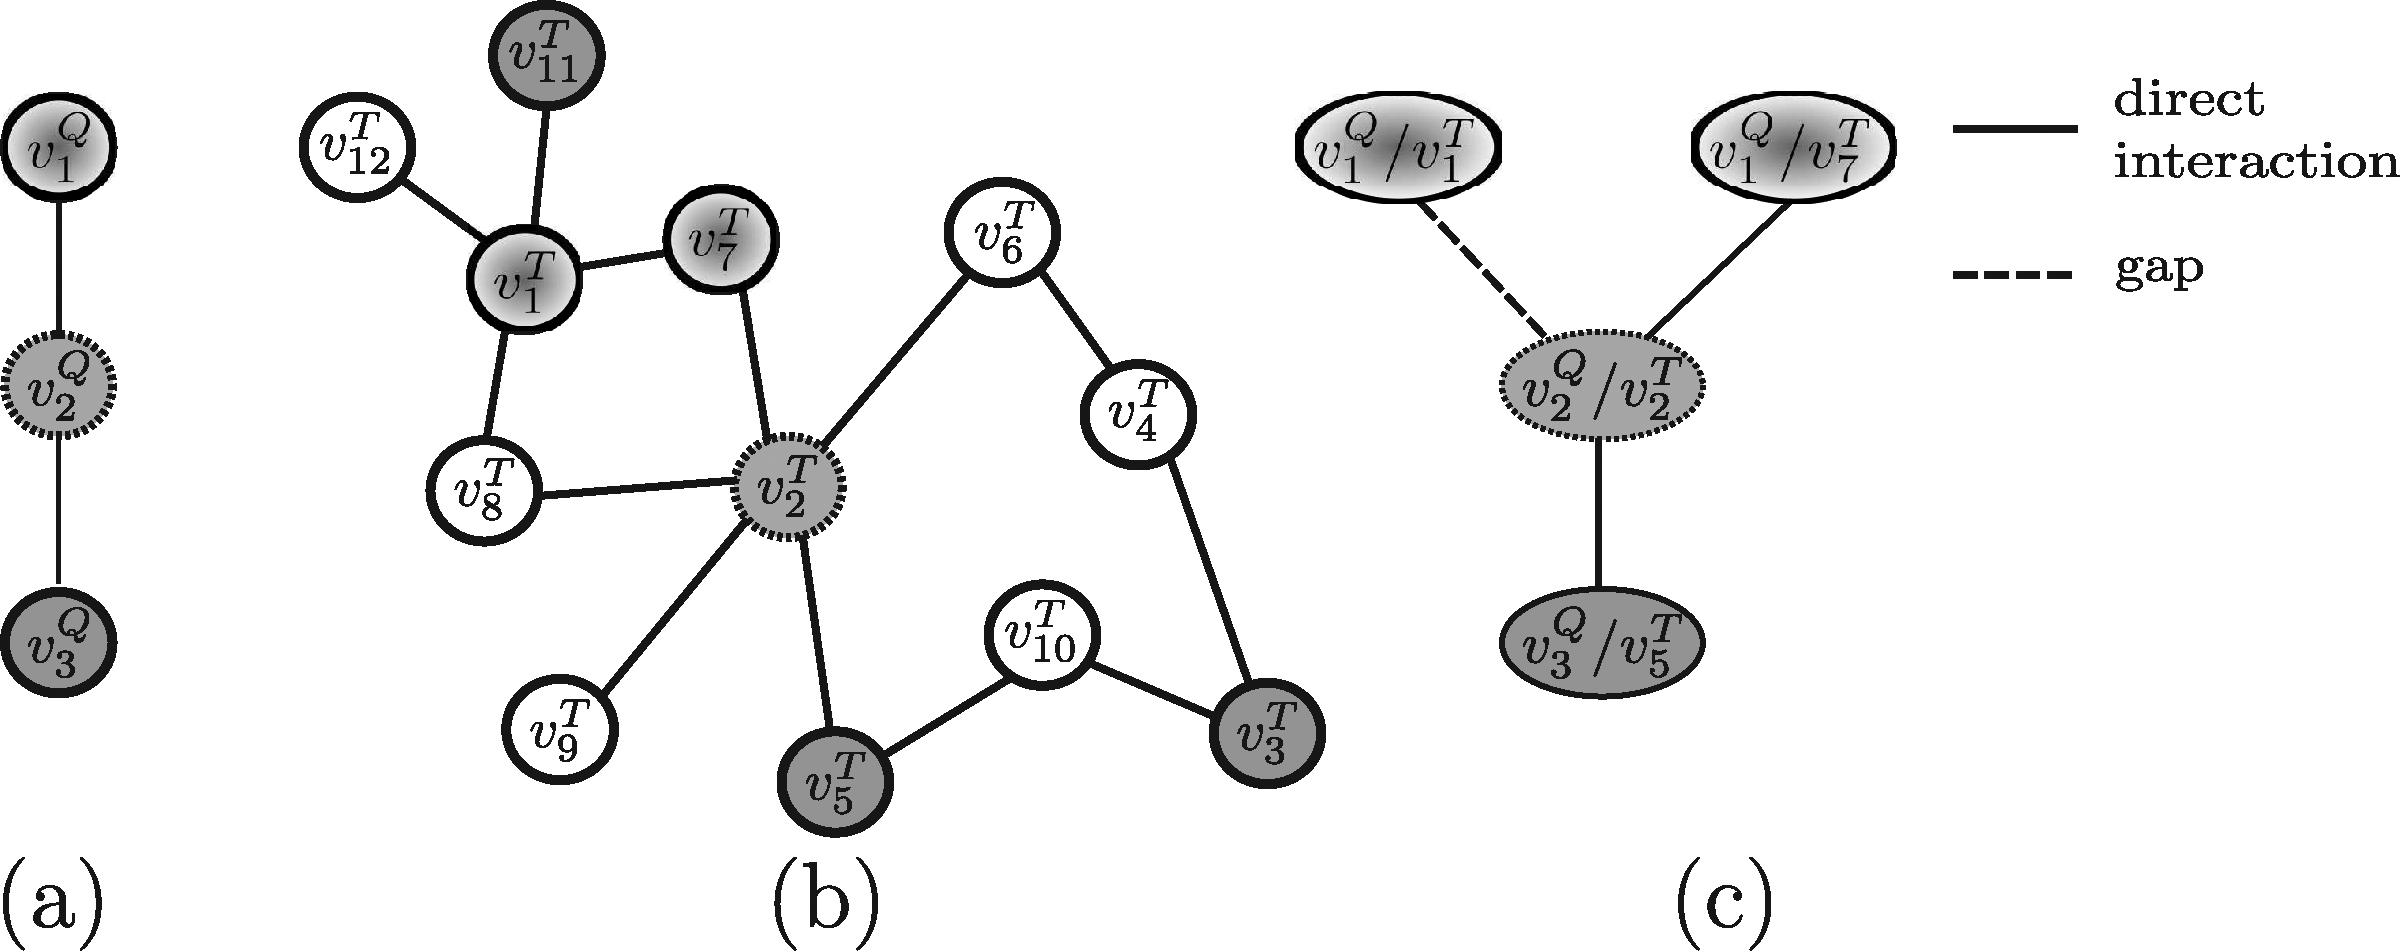
The first approach we consider in this context is PATHBLAST (Kelley et al., 2003). PATHBLAST, in its original formulation, identifies the conserved pathways across a pair of input networks. Afterwards, it has been extended to identify protein interaction complexes and pathways by aligning more than two networks (Sharan et al., 2005; Kalaev et al., 2008). Even though PATHBLAST was conceived to align the entire networks of two organisms, it can also be exploited to query a whole network against a specific pathway by merely using that pathway as one of the two input networks. The method starts by building a global alignment graph, where each node v represents a pair of similar proteins 〈vQ,vT〉, one from each of the input networks, and edges represent either conserved interactions or gaps (corresponding to both node insertions and deletions) or mismatches. In PATHBALST the same protein pair cannot occur more than once and neither gaps nor mismatches can occur consecutively (which limits a bit the generality of the technique).
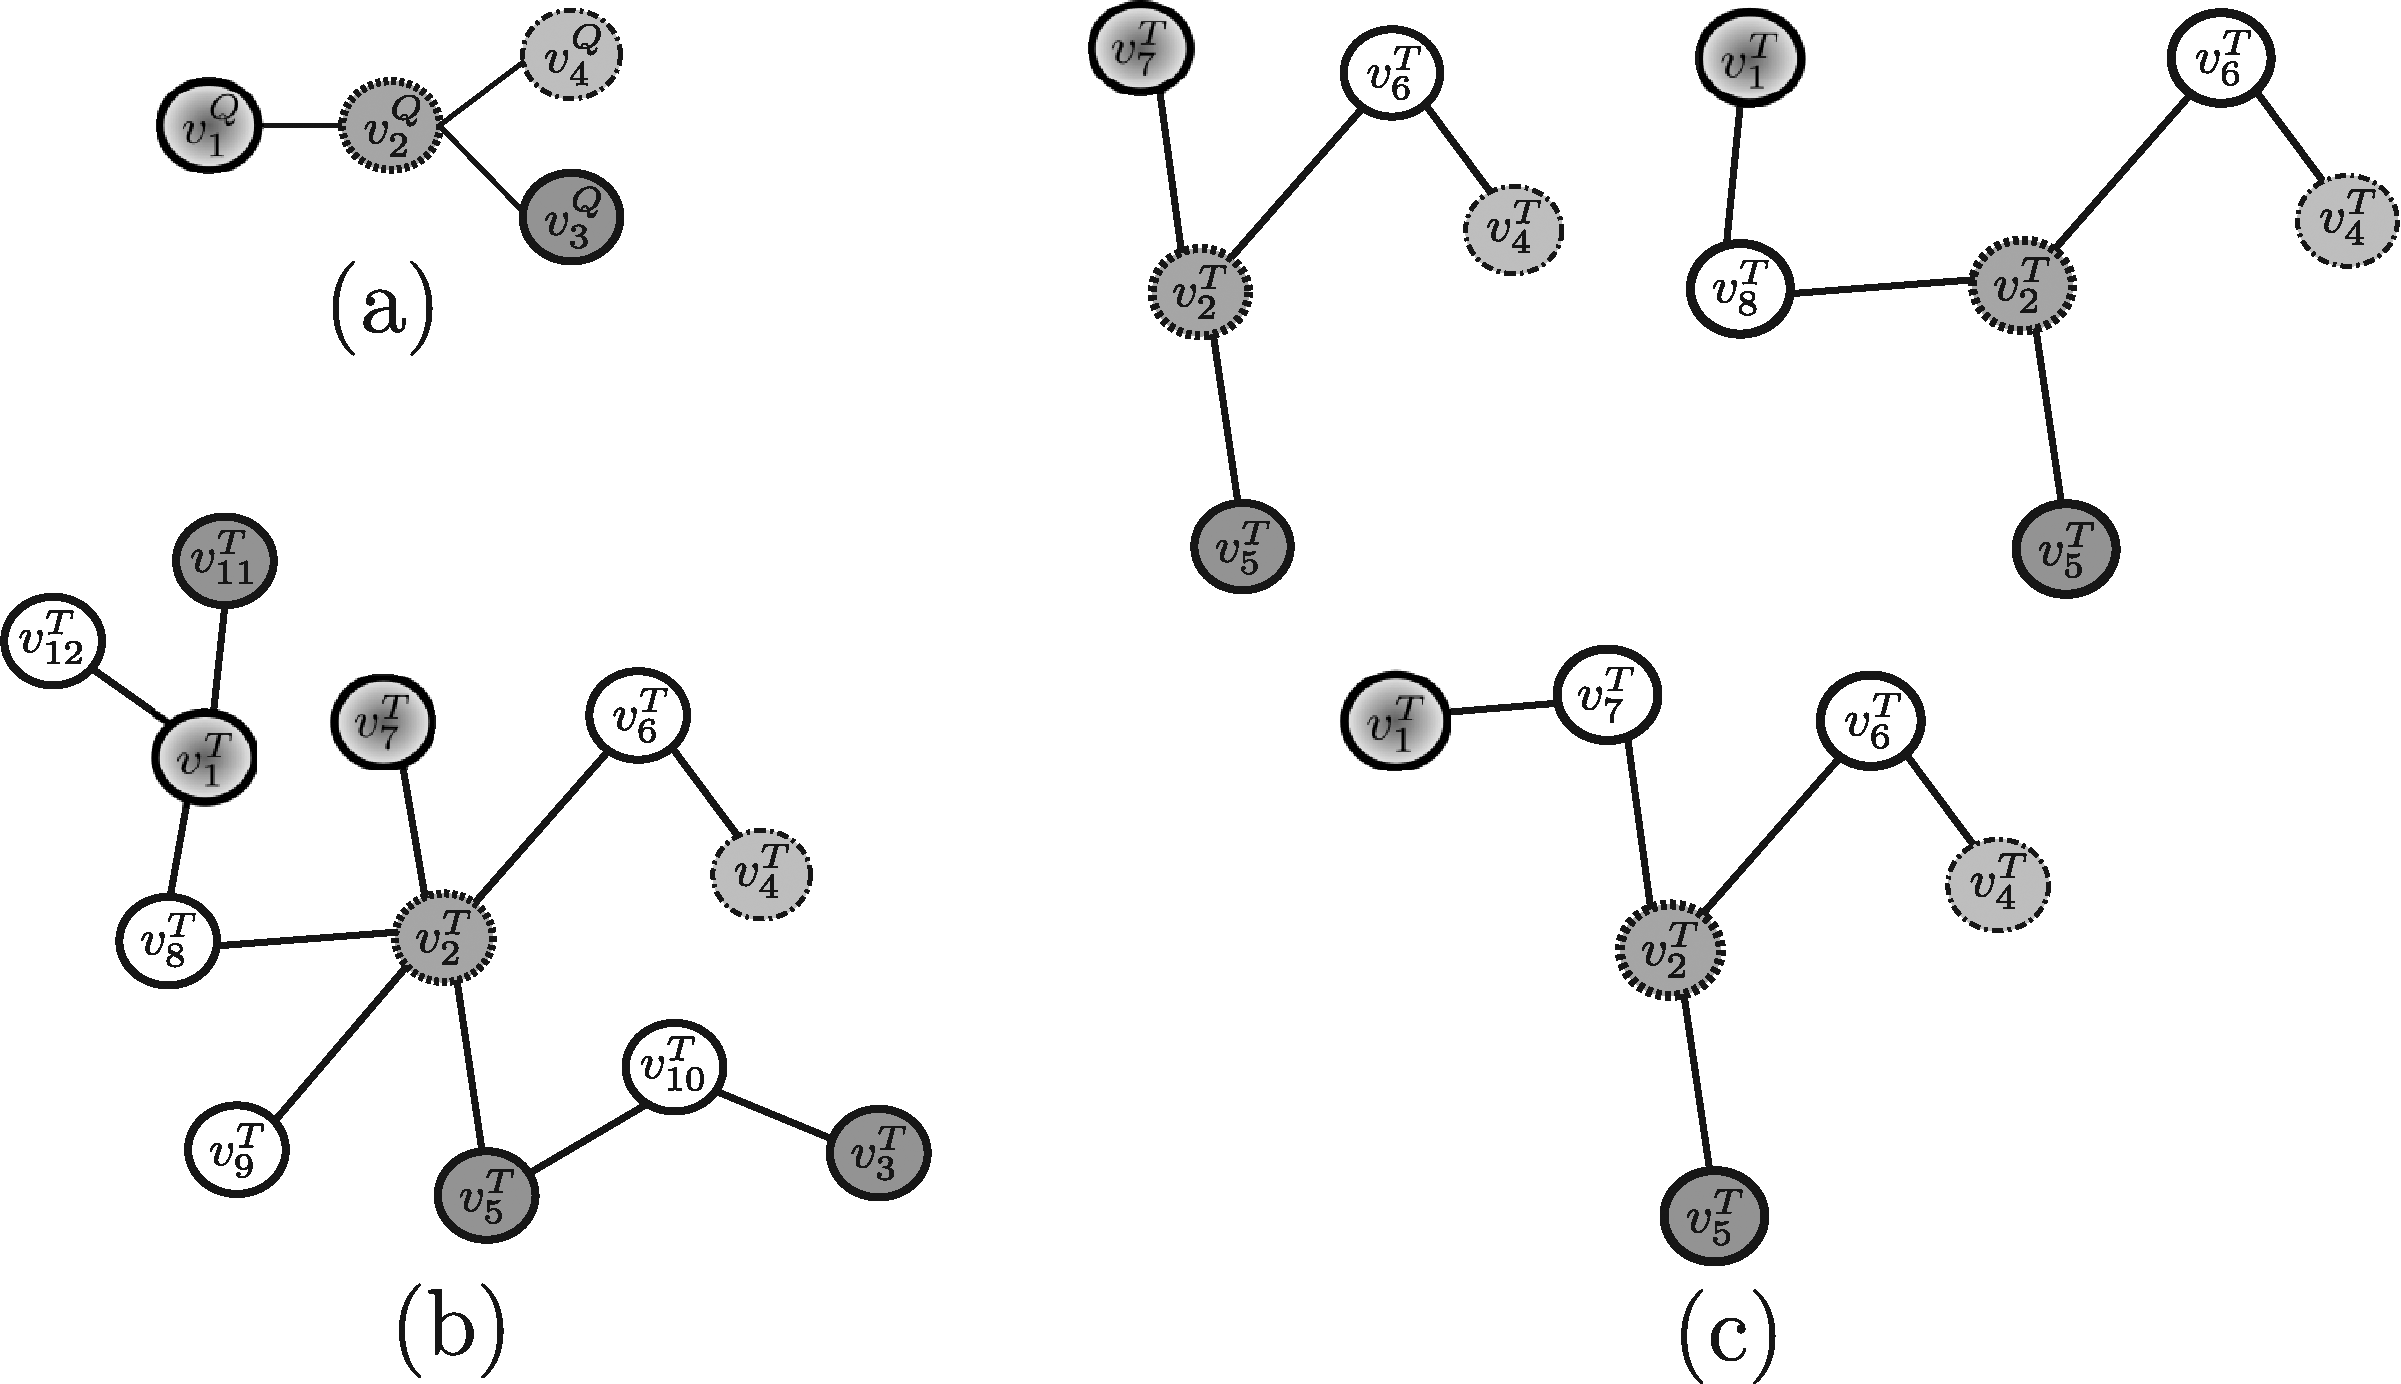
Example 1. Assume that the query pathway and the target network shown in Figure 5a, b are provided to PATHBLAST as the input. The resulting global alignment graph is shown in Figure 5c. Each path of such a graph is a potential solution of the querying problem. In this case, the solution paths PATHBLAST returns are
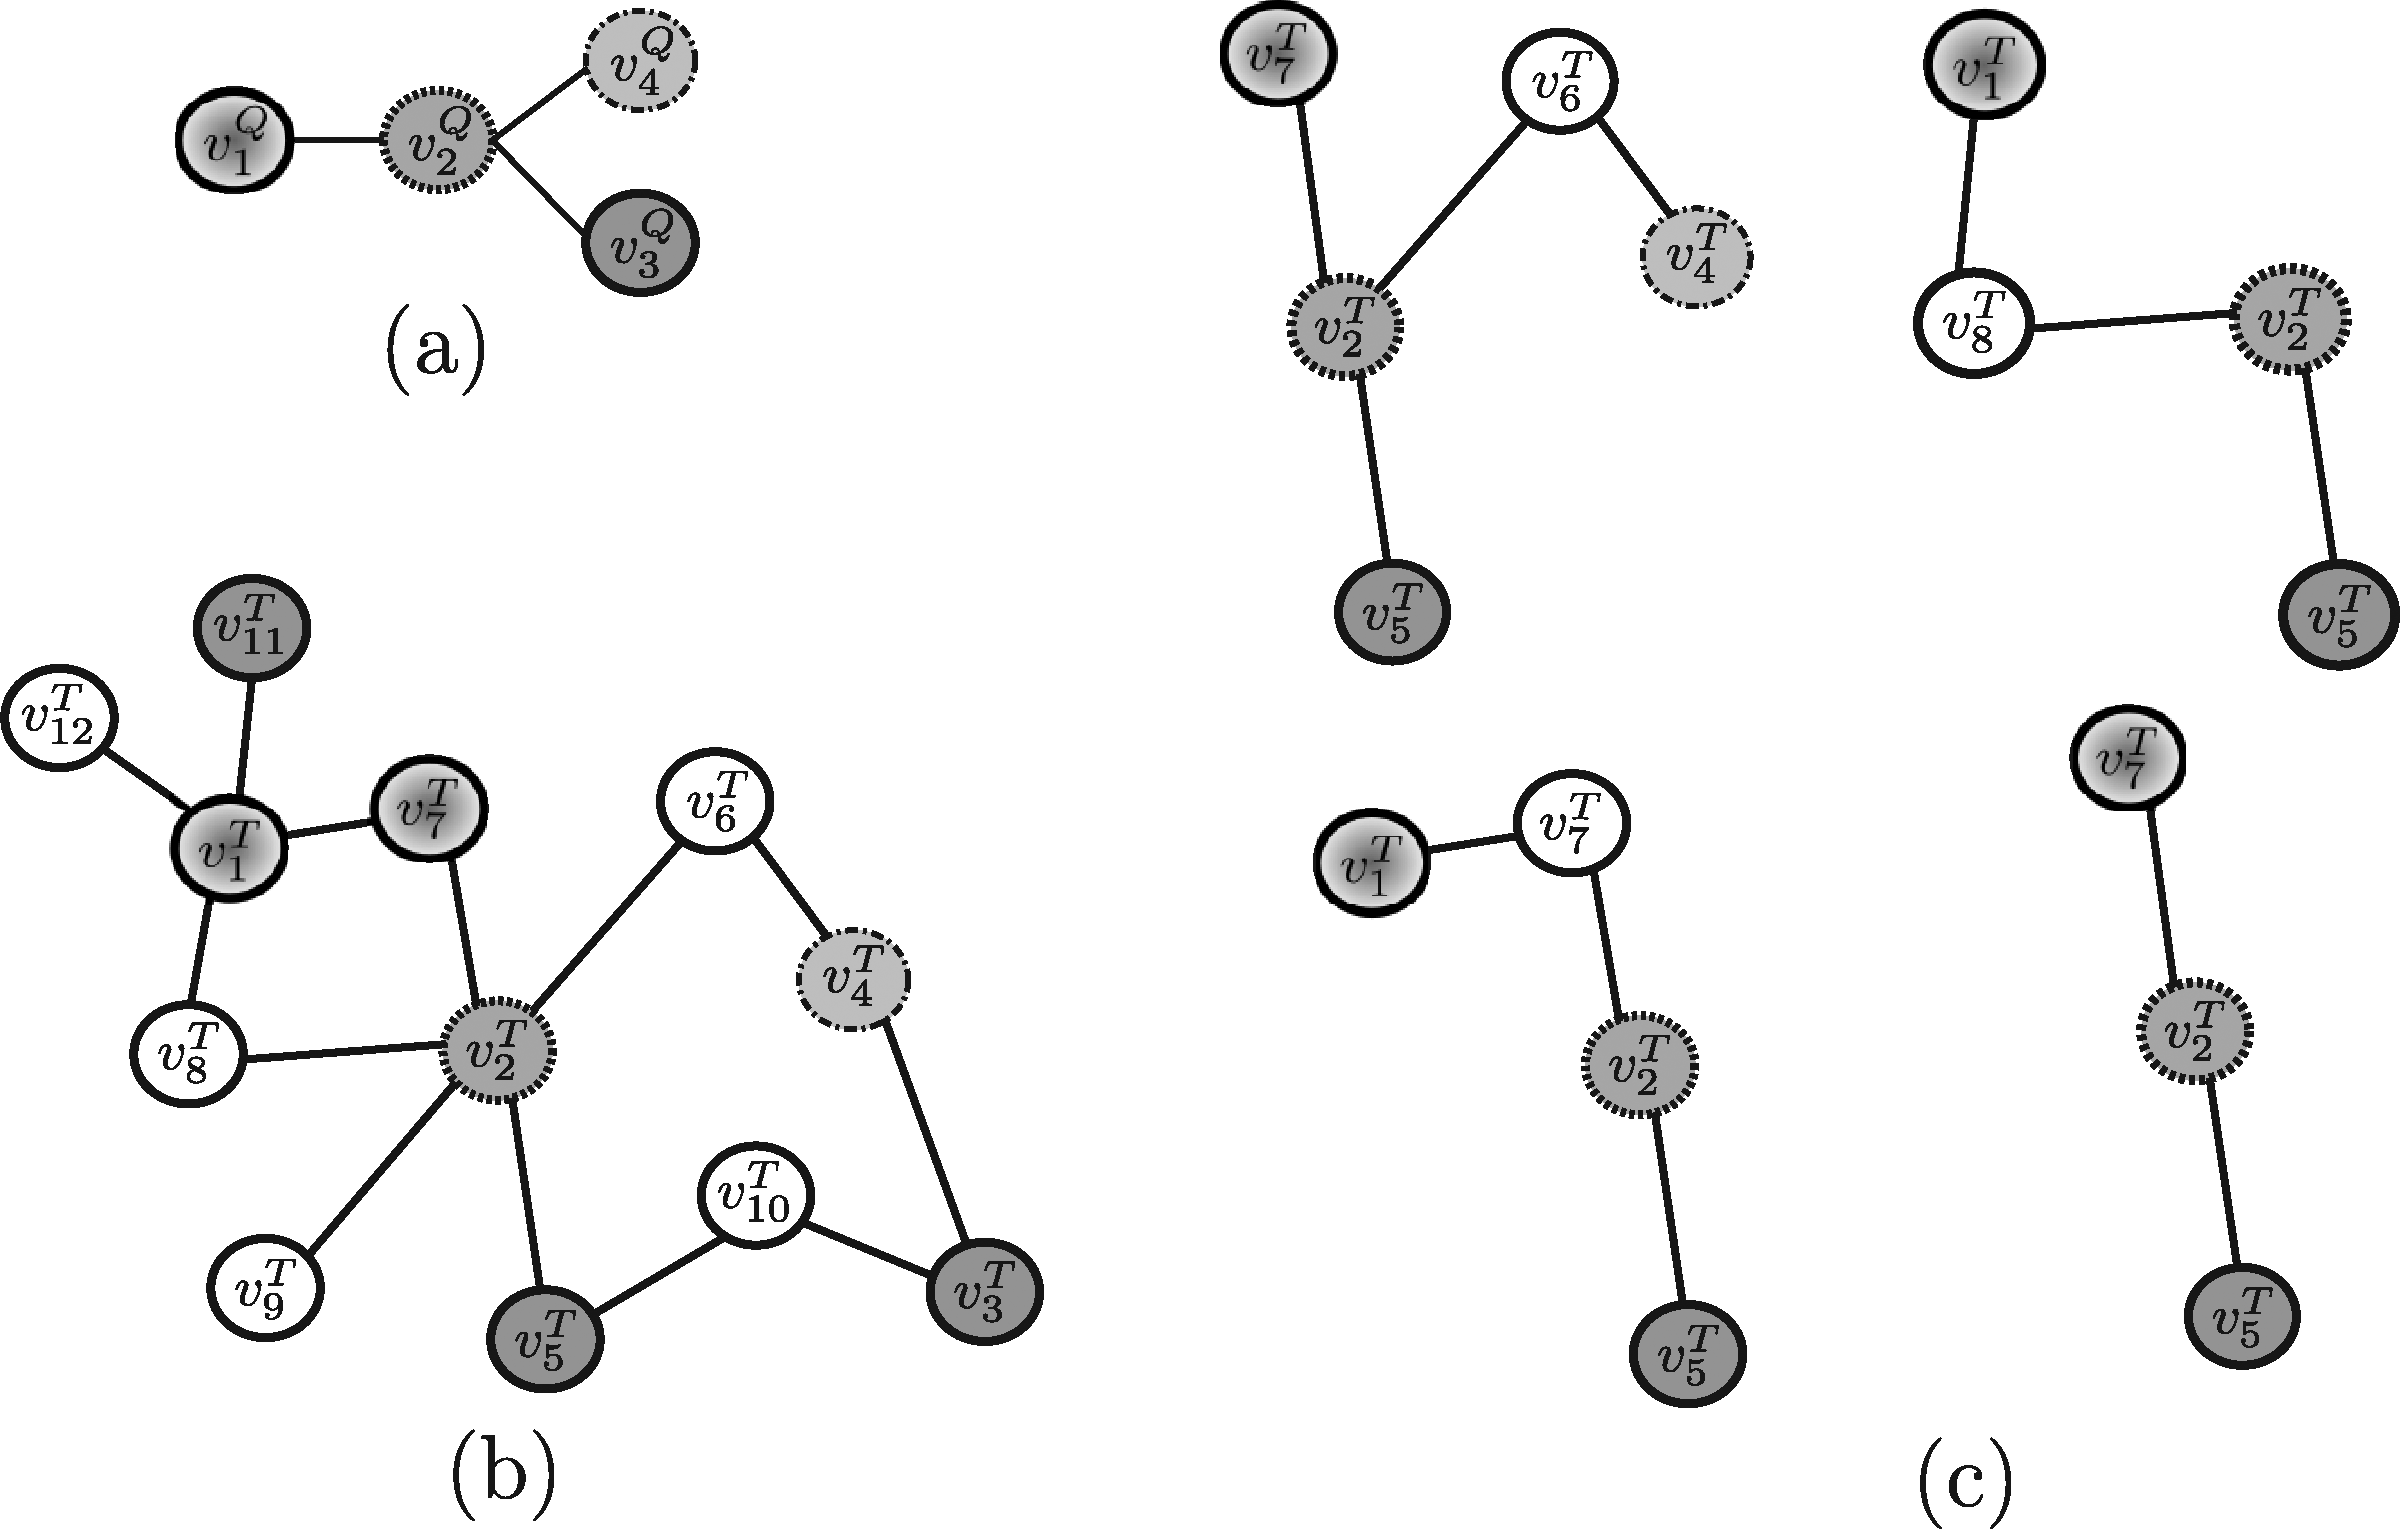
QPath (Shlomi et al., 2006) and QNet (Dost et al., 2008) are other two techniques to query PPI networks, both based on the color coding technique (Alon et al., 1995). QPath limits itself to path-structured queries, while QNet is also able to deal with queries shaped as trees or graphs having bounded treewidth (Robertson and Seymour, 1986) even if, in the current system release, only tree-shaped queries are handled. In both methods, the total number of node insertions and deletions in the potential solutions are bounded by two threshold values, called Nins and Ndel, respectively. Finally, both algorithms guarantee that each resulting solution includes distinct proteins and provide the best discovered solution as the output.
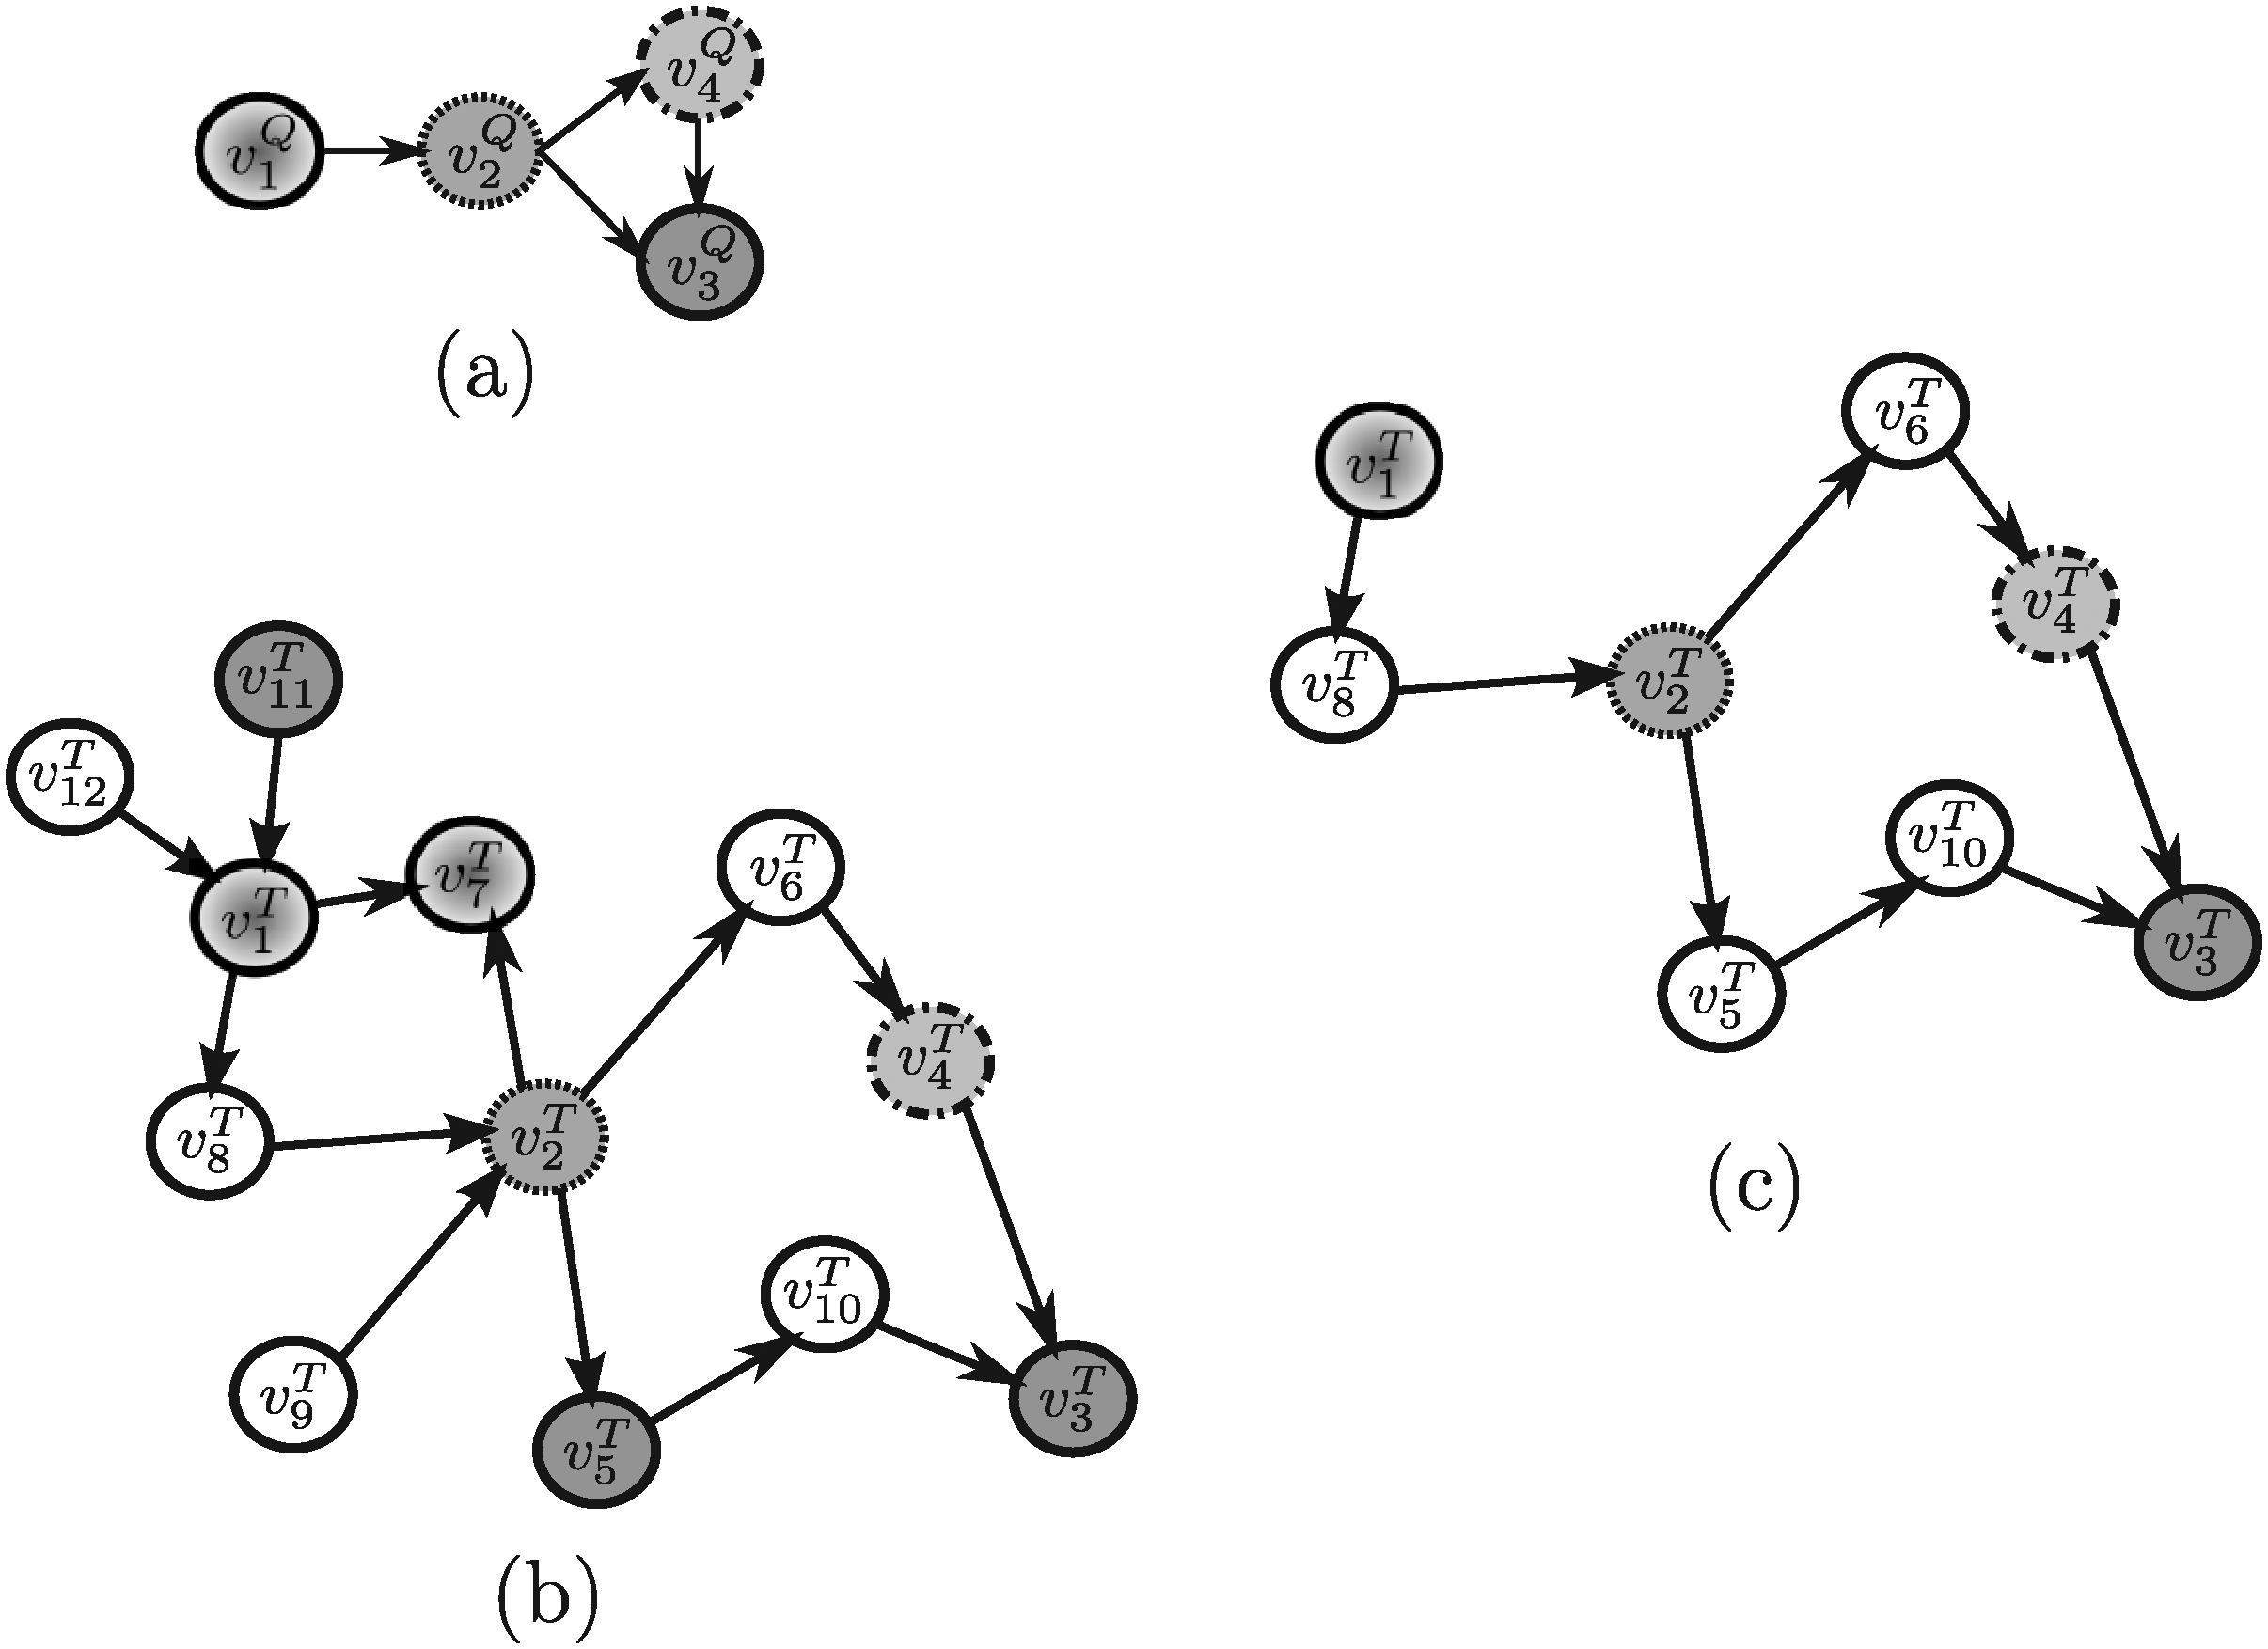
Example 2. As an example, suppose Nins = Ndel = 1 and consider for QPath the undirected versions of the query pathway and the target network reported in Figure 4a, d and for Qnet the query tree and the target network displayed in Figure 6a, b, respectively. For this example, QPath is able to find the same result pathways discovered by PATHBLAST (Fig. 5c), whereas QNet is able to retrieve the solution trees reported in Figure 6c. As stated, the tools return the best scoring solution among all the potential solutions they are able to discover. Clearly, the solution retrieved depends on the specific setting of input parameters the user specifies.
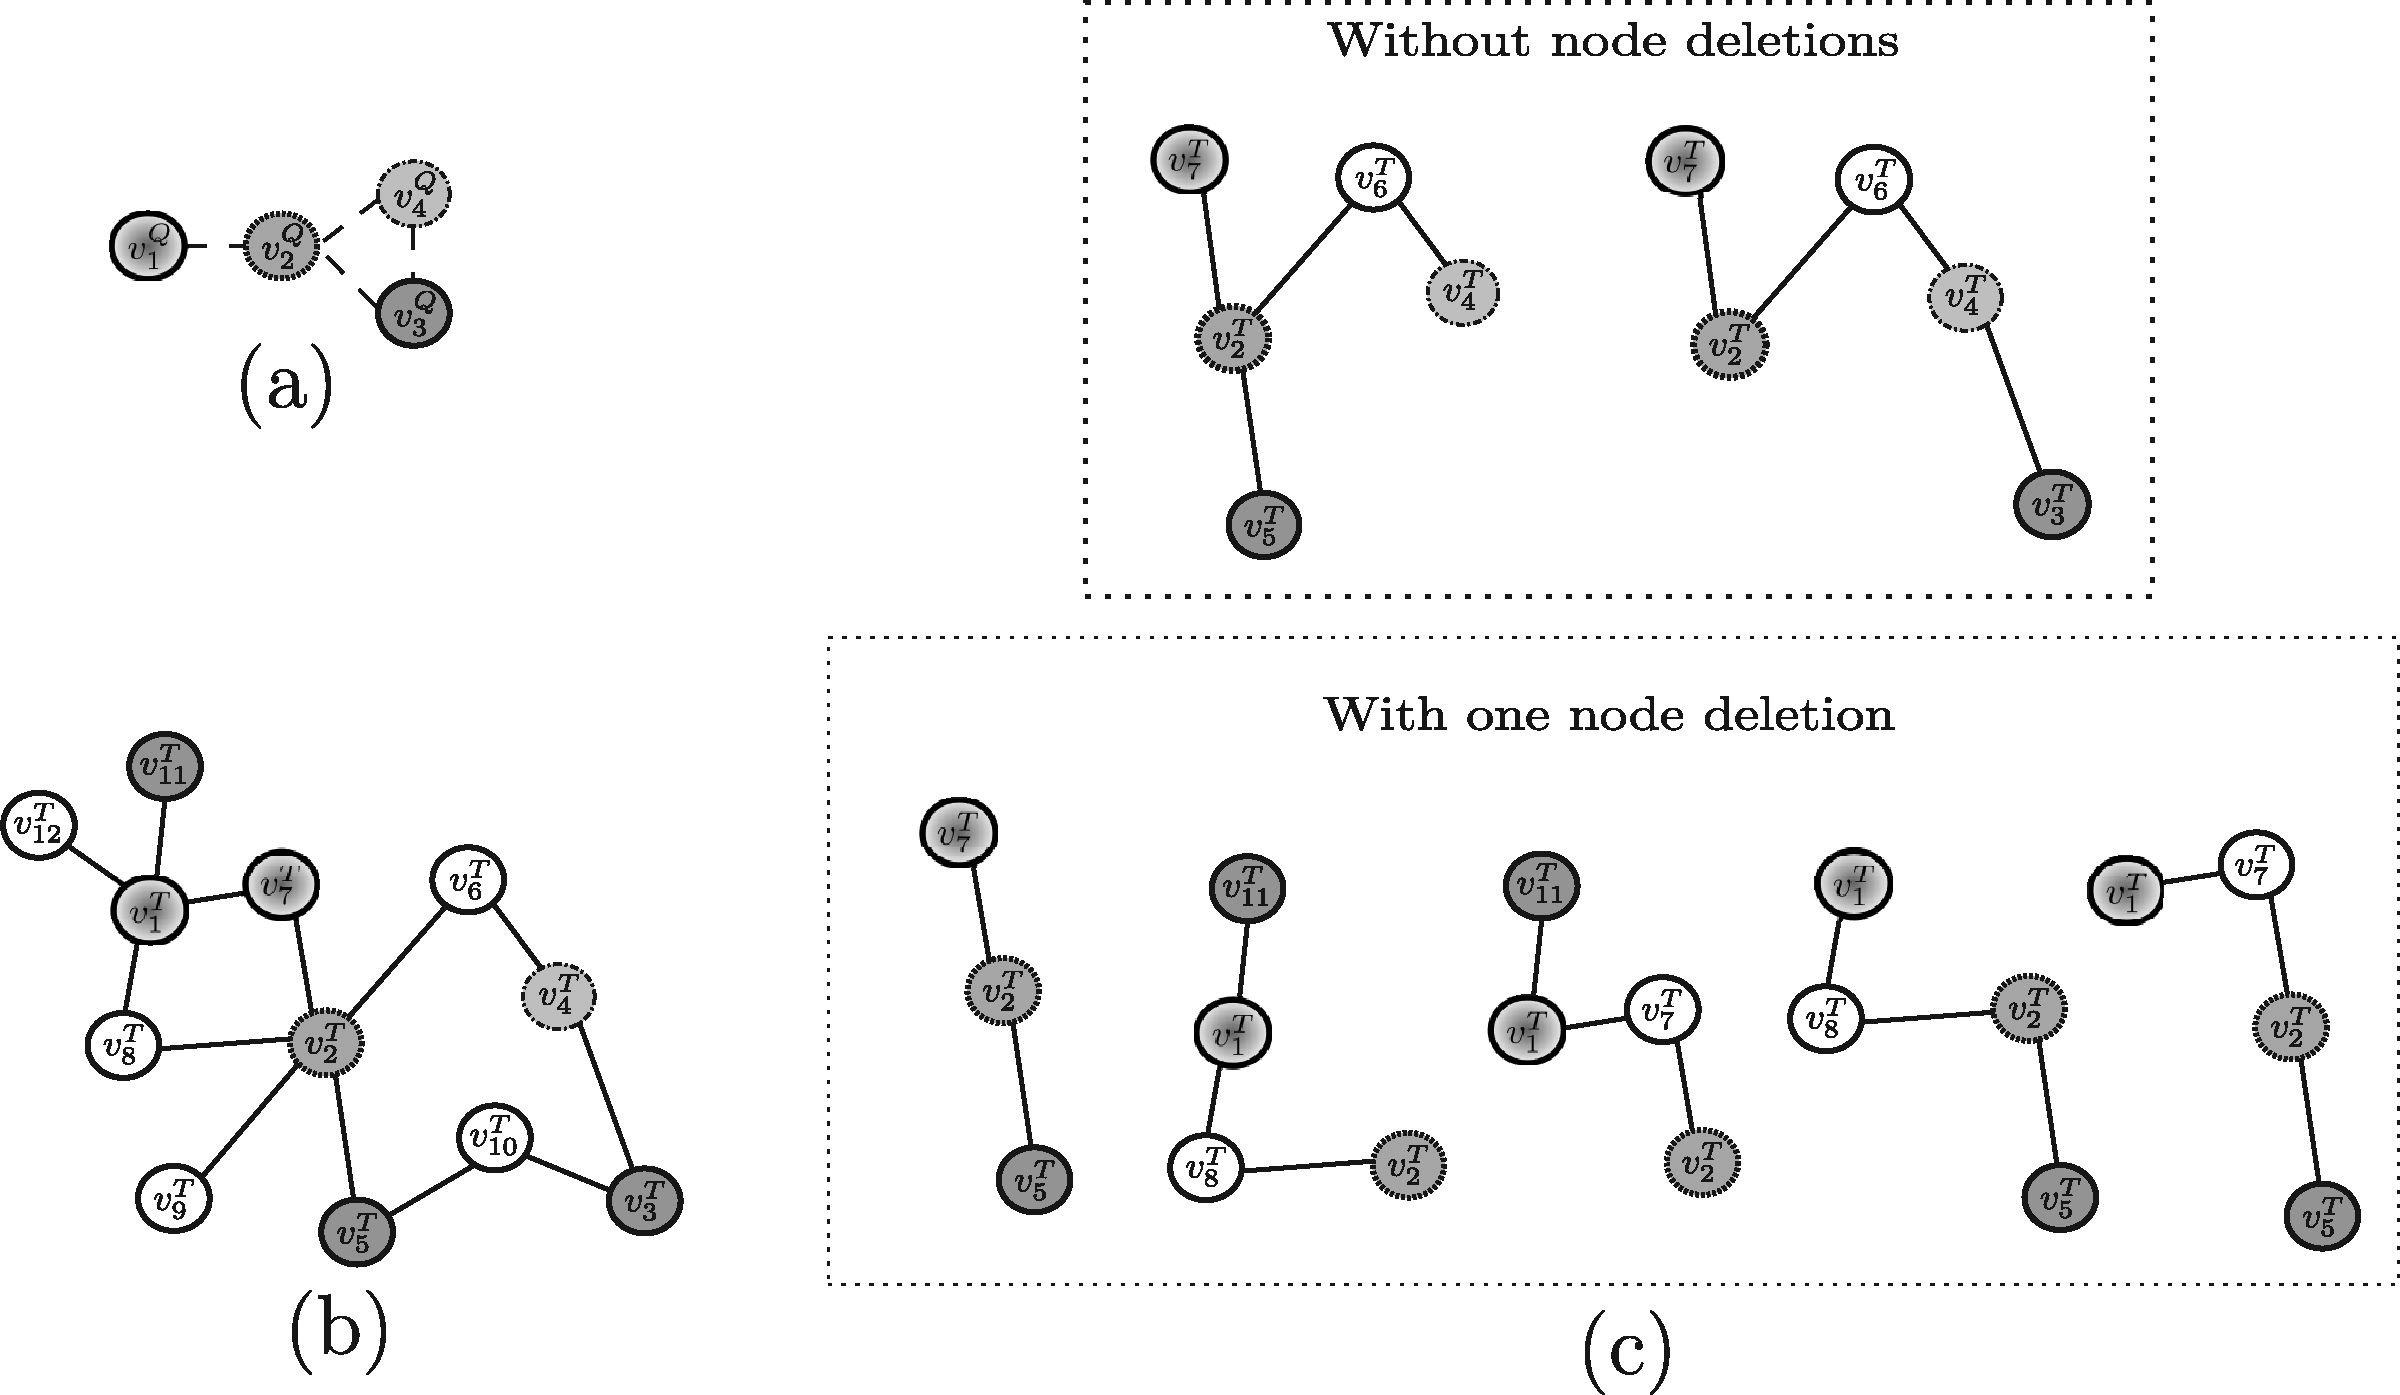
Torque (TOpology-free netwoRk QUErying) (Bruckner et al., 2009) is a technique focused on querying PPI networks, where a bound on both the maximum number of node insertions and node deletions is imposed. Torque is a topology-free querying algorithm, that is, the query ”network” solely specifies the set of involved proteins, and does not carry out any information about the interactions among them. The observation underlying this choice is that most of the protein complexes reported in the literature are not correlated with any information about their interaction patterns. Thus, the goal of Torque is to find a connected set of proteins in the target network matching the query proteins. However, in the current system release, the resulting module is provided without any information about the correspondences w.r.t. the query nodes. Torque has been implemented using several fixed-parameter algorithms based on dynamic programming. The authors also provide an integer programming formulation of the querying problem to allow commercial solvers to be exploited.
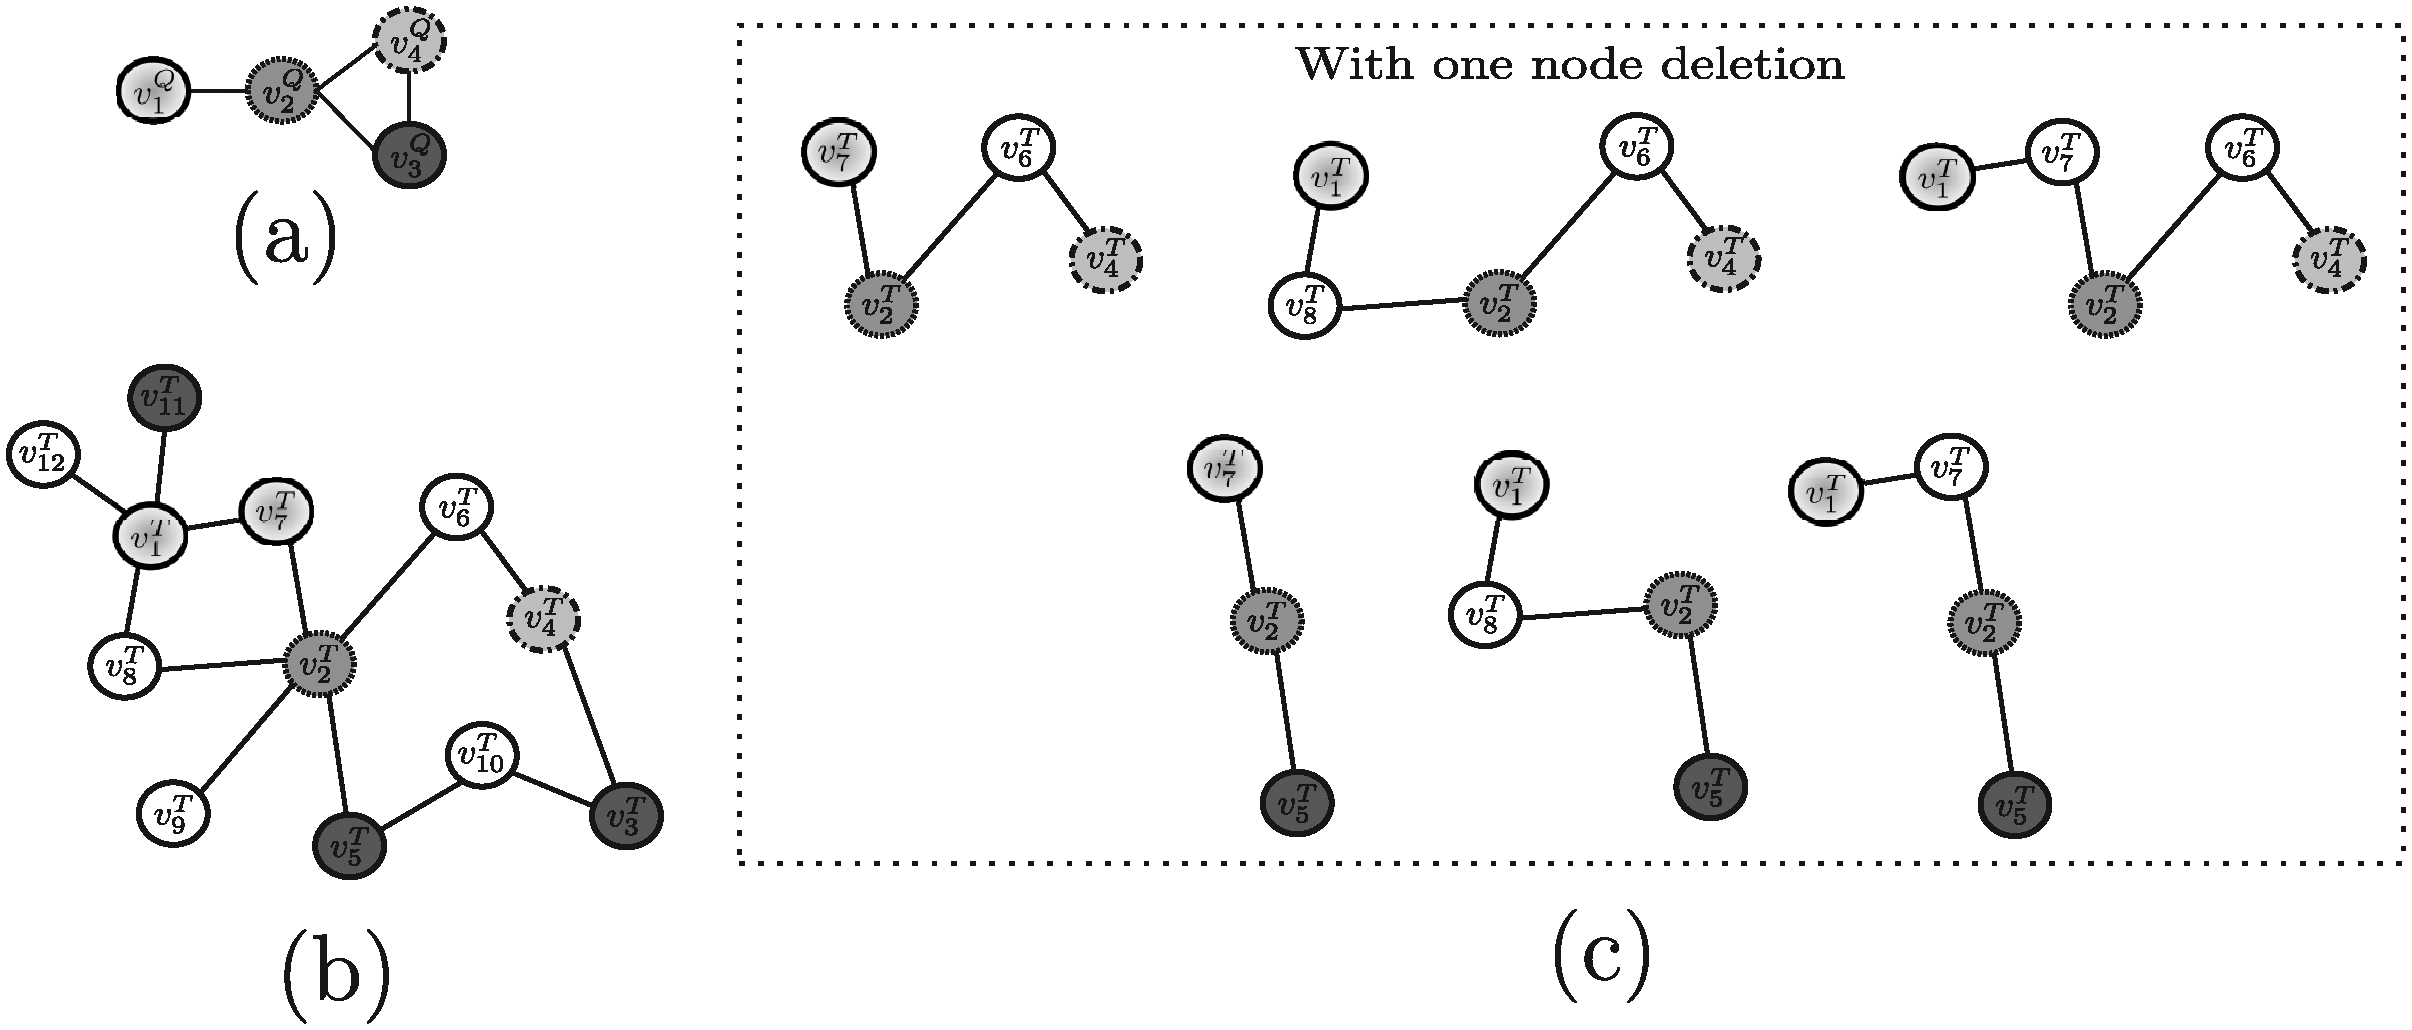
Example 3. By applying Torque to the query proteins reported in Figure 7a and the target network in Figure 7b, the solutions Torque may return are shown in Figure 7c. Note that, in this example, only one node insertion and one node deletion are allowed in the solution sub-graphs and recall that Torque considers no query structural information. Also, depending on the specific setting of input parameters the user specifies, one of those solution will be actually returned.
Basically along the same research line, two other approaches (Fionda et al., 2008; Qian et al., 2009) have been developed. Both of them impose no simultaneous bound on the number of node insertions and deletions.
In particular, neither the number of node insertions nor node deletions is ”ex-ante” bounded in the algorithm by Fionda et al. (2008), hereafter called Fionda for simplicity. Fionda exploits an heuristic approach that associates a distance score with each potential solution and stops either when a solution with a distance score lower than the threshold (set by the user) is found, or when a maximum number of execution attempts has been reached. In the latter case, no solution is returned.
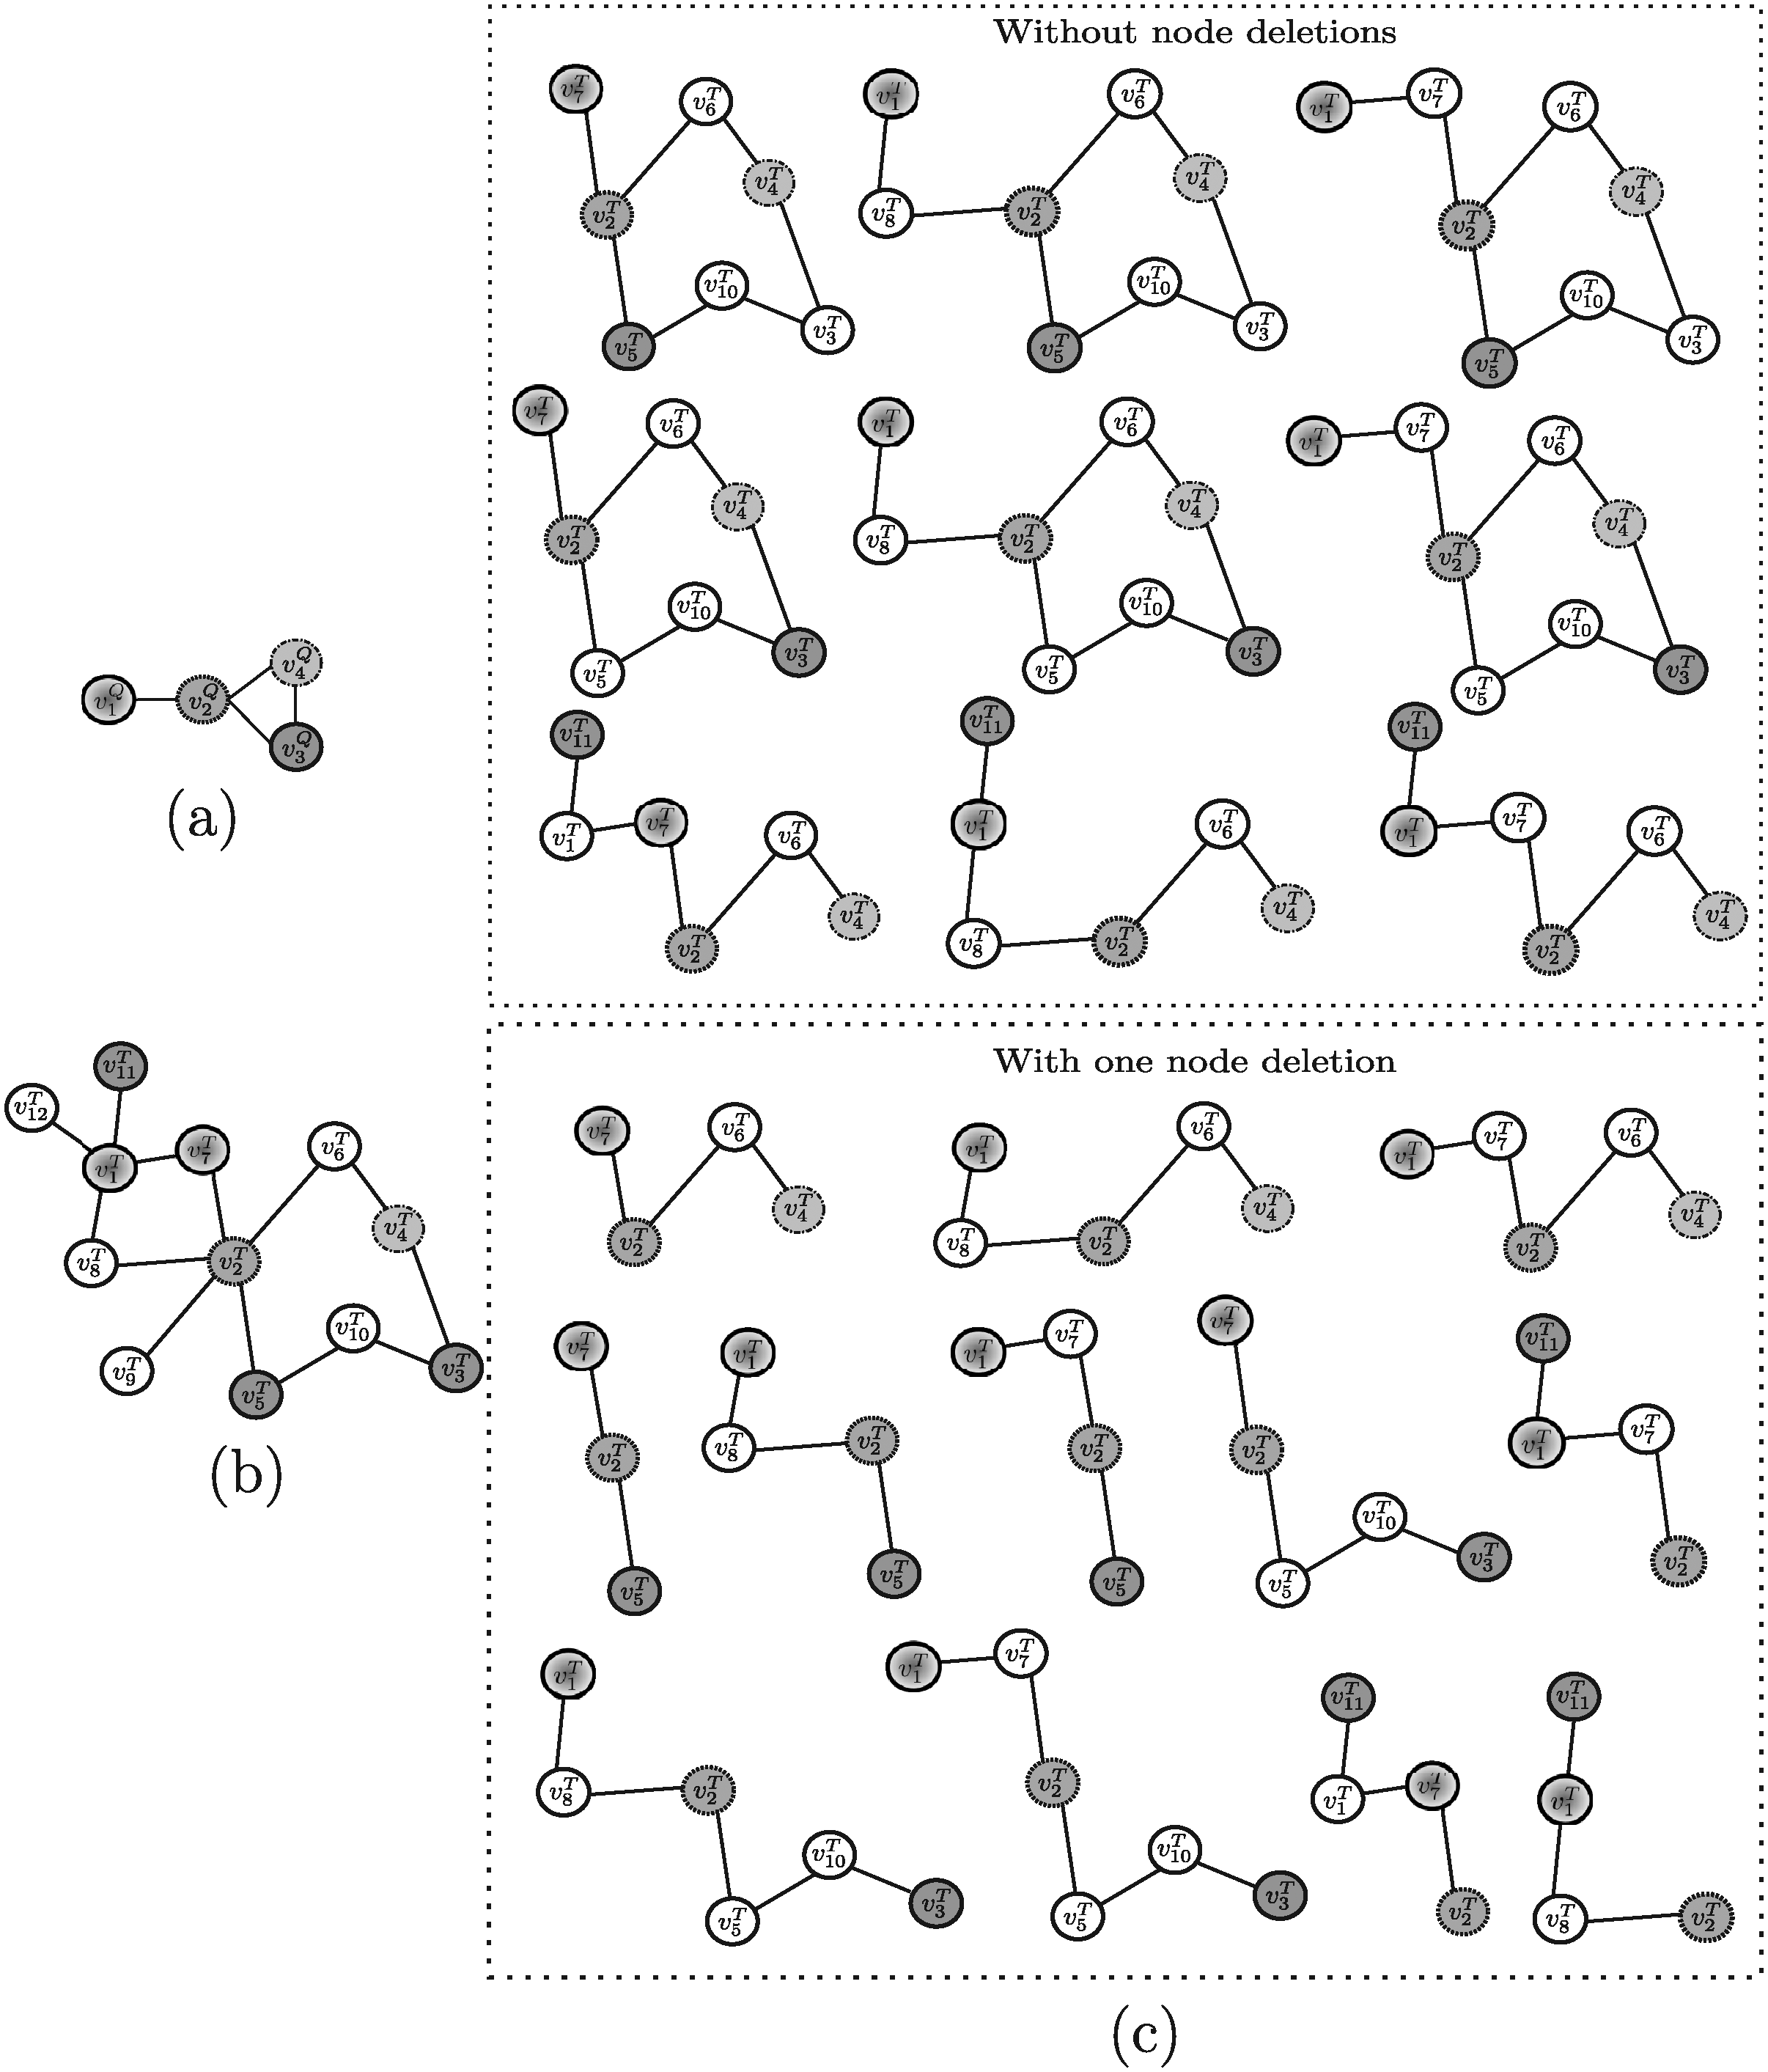
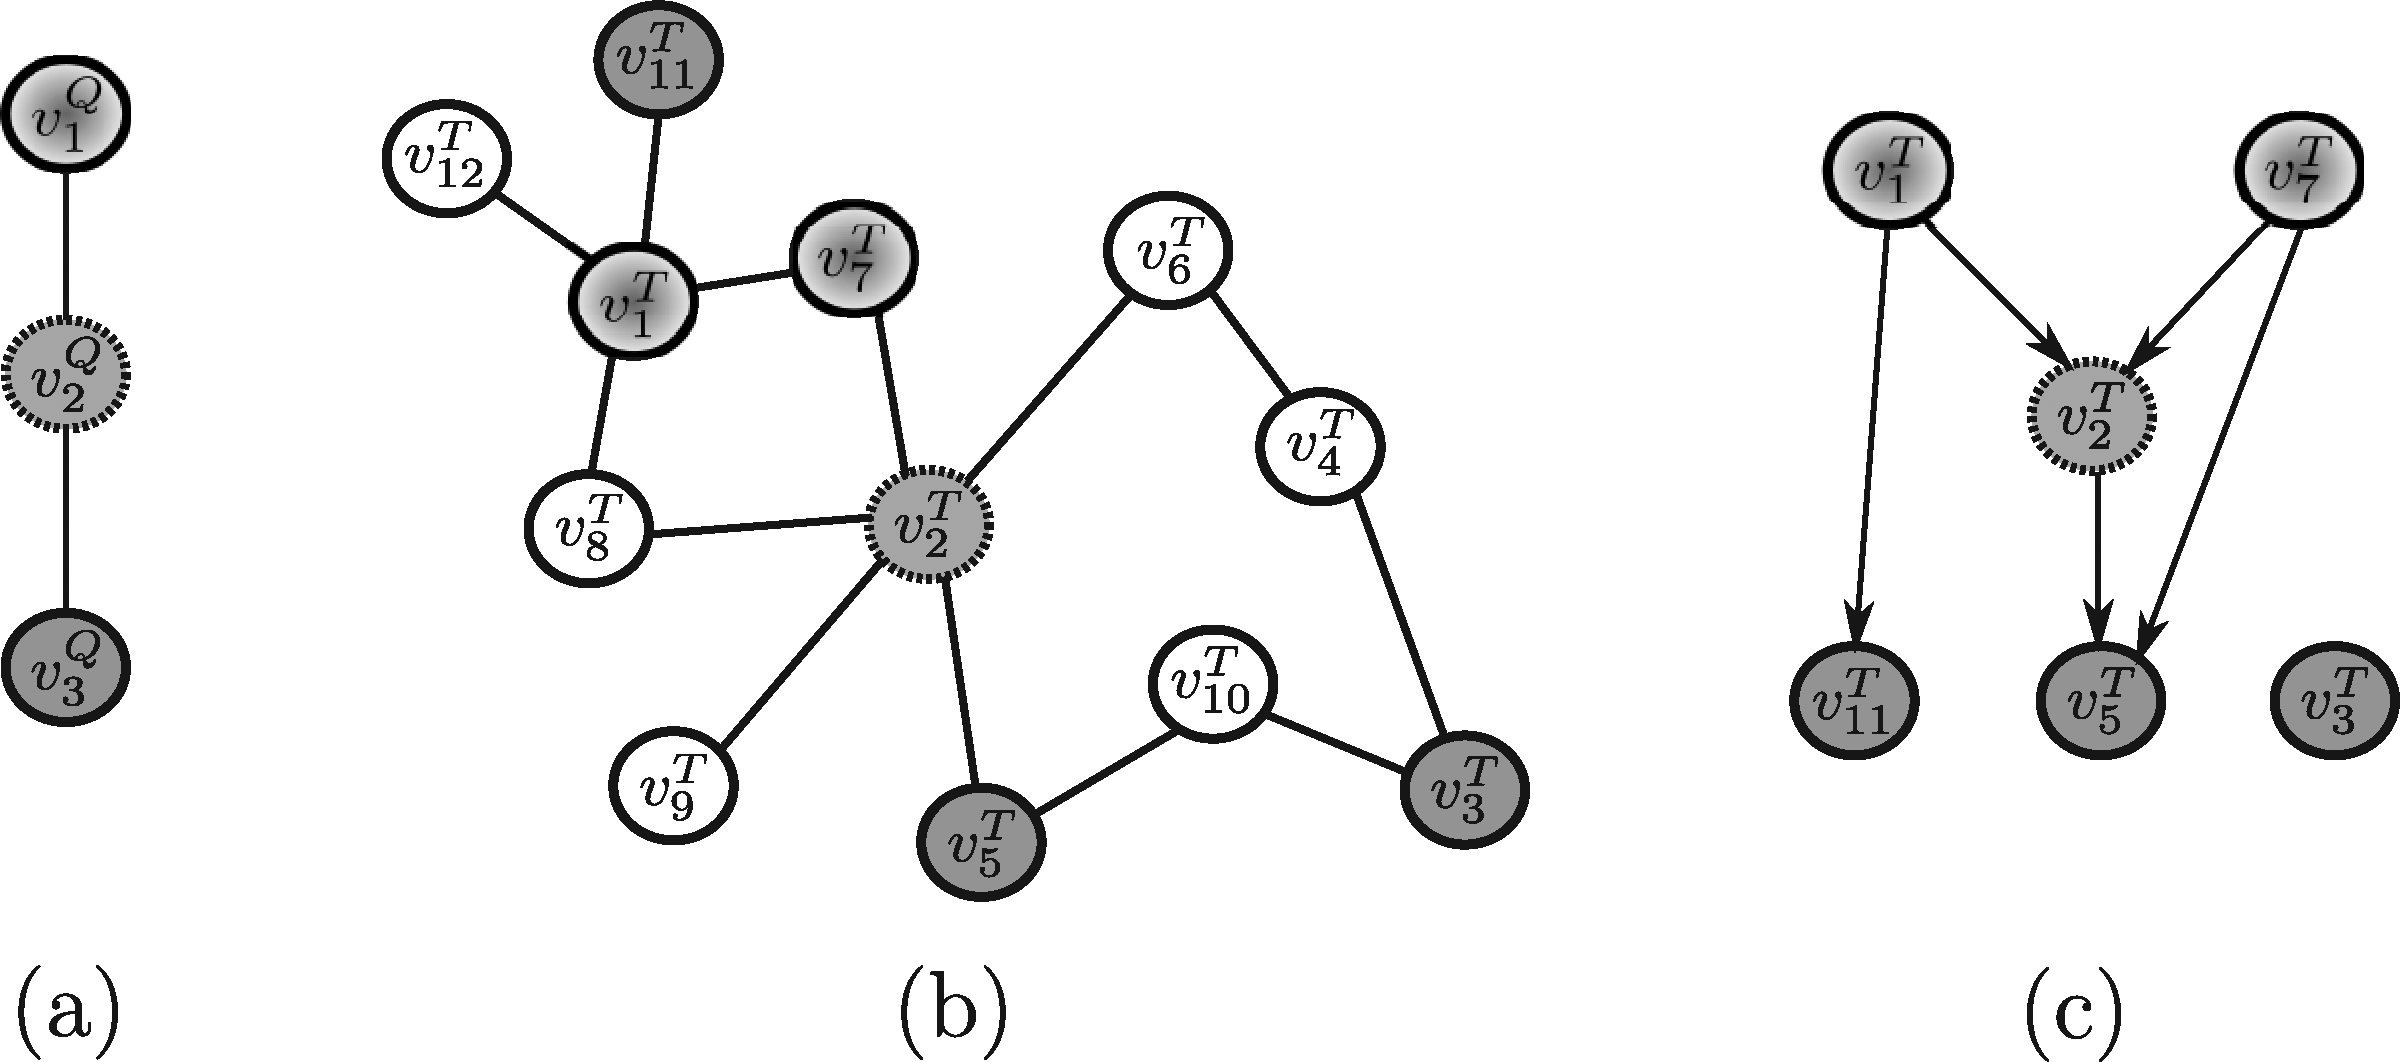
Example 4. By considering Fionda as applied to the query graph reported in Figure 8a and the target network reported in Figure 8b, the algorithm is able to find one of the solutions shown in Figure 8c (note that Fionda, actually, returns in output only one subgraph, depending on the specific setting of input parameters the user specifies).
The algorithm by Qian et al. (2009), hereafter denoted Qian for simplicity, imposes a bound only on the maximum number of node insertions and it is based on computing hidden Markov models (HMMs). Also in this case, as in PATHBLAST, the query stucture is constrained to pathways. In this framework, PPI networks are modelled using the HMM formalism that embeds protein similarities into its probabilistic framework.
Example 5. As an example, by assuming that the maximum number of allowed node insertions is equal to 1, Qian applied to the query pathway represented in Figure 4a and the target network reported in Figure 4d, is able to discover the same result pathways as those identified by PATHBLAST and QPath, and reported in Figure 5c.
3.2. Methods developed to query metabolic networks
In this section, an overview of the techniques developed to query graphs encoding metabolic networks is given.
MetaPathwayHunter (Pinter et al., 2005) is probably the first tool designed to work on metabolic networks. The system takes advantage of the particular topology of most metabolic pathways, usually shaped as multi-source trees (i.e., directed acyclic graphs whose underlying undirected graphs are trees). In fact, this tool only deals with queries and target networks shaped as multi-source trees. Moreover, it handles both node deletions from the query module and node insertions in the retrieved target submodules (that can be also viewed as deletions from the target trees). The method exhaustively computes both all optimal solutions and several suboptimal solutions (up to a predefined threshold score), which are ranked by their statistical significance. This system exploits a bottom-up dynamic programming approach based on a subtree homeomorphism computation. Two graphs (trees, respectively) are homeomorphic if their edges can be split (i.e., edges can be replaced by paths of arbitrary length in the same direction) in a way that the resulting graphs (trees, respectively) are isomorphic.
Example 6. In order to apply MetaPathwayHunter to the example of Figure 4, it is necessary to modify the target network as illustrated in Figure 9b, since the tool requires a forest of multi-source trees rather than a graph. The solutions discovered by MetaPathwayHunter are shown in Figure 9c (note that at most one consecutive node insertion is allowed by the algorithm). The query network is reported in Figure 9a for completeness.
MetaPAT (Wernicke and Rasche, 2007) deals with metabolic network querying as well. The underlying technique partitions the query vertices into two set: (a) path vertices, that are those vertices having exactly one incoming edge and one outgoing edge, and (b) branch vertices, that are all the other vertices. The authors of the system observed that branch vertices must be conserved, whereas paths can be elongated or shortened. The approach exhaustively examines all the sub-graphs of the target network that are homeomorphic to the query sub-graph.
Example 7. MetaPAT, if applied to the query graph and target network reported in Figure 10a, b, would return the solutions shown in Figure 10c.
SAGA (Substructure Index-based Approximate Graph Alignment) (Tian et al., 2007) is a system proposed to search for a query sub-graph in a database of graphs and implemented for querying metabolic pathways. A label is associated with each node of the query and each node of the graphs in the database with the aim of identifying node mismatches. The search is based on the construction of an index, called Fragment Index, containing substructures of size k extracted from the graphs in the database.
Example 8. Consider SAGA as applied to the query graph shown in Figure 4c and the target network reported in Figure 4d and recall that only one consecutive node insertion and only one node deletion is allowed. The resulting subgraphs retrieved by this algorithm are the same as those shown for Torque (Fig. 7c).
3.3. Methods developed to query multiple kinds of biological networks
This section discusses techniques developed to query more than one kind of biological networks. PathMatch and GraphMatch (Yang and Sze, 2007) are two examples of tools suitable for querying different biological networks. PathMatch has been proposed to search for paths, whereas GraphMatch looks for general graphs. A peculiarity of these two approaches is that each node of the target network may correspond to more than one node of the query sub-network. Both algorithms fix the maximum number of allowed node insertions for each direct edge in the query graph by a threshold value Nins. While PathMatch is an heuristic algorithm that takes advantage of the linearity of the query module, thus reducing the query problem to that of finding the longest weighted path in a directed acyclic graph, GraphMatch exploits an exact algorithm. In particular, PathMatch builds a directed graph G′ to reduce the path querying problem to that of finding a path P′ in G′ with the maximum sum of vertex and edge weights.
Example 9. By applying PathMatch to the query path shown in Figure 11a and the target network reported in Figure 11b and allowing only one consecutive node insertion and one consecutive node deletion, the graph G′, built by PathMatch, is shown in Figure 11c. Note that the ids used to identify the nodes of G′ are the same ids of the nodes in GT.
On the other hand, GraphMatch enumerates all the potential solutions so that the query process turns out to be effective only if the query network is small enough.
Example 10. Let Nins be equal to 1, and suppose to apply GraphMatch to the query and target graphs shown in Figure 12a, b. The subgraphs found out by GraphMatch are shown in Figure 12c.
3.4. Methods developed to query general biological graphs
This section surveys on techniques developed for querying general graphs, the nodes of which may possibly denote biological entities. GenoLink (Durand et al., 2006) is a software platform developed for graph querying and exploration. A query consists of a graph pattern in which nodes and edges are constrained. The nodes of the graphs may represent biological objects (e.g., Organism, Gene, Chromosome, Protein) with the edges modeling the relationships holding among the nodes (e.g., Chromosome BelongsTo Organism, Gene IsTranslatedTo Protein). GenoLink is able to retrieve an occurrence of the query graph in the target graph that must feature: (a) exactly the same topology as the query graph, (b) all its nodes and edges must have the same data types (or subtypes) of corresponding query nodes and edges, (c) all the query constraints on attributes must be satisfied.
Example 11. GenoLink as applied to the example queries shown in Figure 4a–c and the target network reported in Figure 4d, is not able to return any solution, since there does not exist any subgraph of the target network that exactly satisfy all the structural constraint imposed by the queries.
NetMatch (Ferro et al., 2007) is another tool devised along the same ideas, which was built as a Cytoscape plugin (http://www.cytoscape.org). NetMatch queries may be structurally approximated in the sense that some of their parts may be left unspecified. Each node and edge may have associated a list of attributes specifying query constraints. Thus, some elements of the query sub-graph are marked as constants, whereas others are unspecified. The resulting sub-graphs are connected according to the same structure as the query graph. NetMatch is able to handle query and target graphs with more than one edge between a pair of nodes.
Example 12. Similarly to GenoLink, NetMatch as applied to the example queries shown in Figure 4a–c and the target network reported in Figure 4d does not return any solution. However, suppose to apply the algorithm to the query and target graphs shown in Figure 13a, b, in which the dashed lines represent unspecified edges of the query graph that can be matched with path of any length. The subgraphs found out by NetMatch are, in this case, shown in Figure 13c.
4. Coarse-Grain Comparison
In the previous sections, network querying tools have been discussed with respect to: (a) adopted network model; (b) biological information exploited; (c) delivery of exact versus approximate results; (d) types of approximation supported; (e) handling of general versus specific types of network. In this section a comparison will be carried out for the given tools along the following further directions:
(f) supported query structures; (g) adoption of exact versus heuristic algorithms; (h) computational complexity; (i) availability and modifiability; (j) user interface; (k) data used for the evaluation.
Some relevant data pertaining the comparison carried out in this section are listed in Table 2 (concerning points (f )–(h)), Table 3 (concerning points (i) and (j), and Table 4 (concerning point (k)).
4.1. Supported query structure
Network querying techniques can be classified with reference to the structural constraints imposed on the query networks. Some of the techniques here discussed (i.e., PATHBLAST, QPath, PathMatch, and Qian) only handle path-shaped queries. Other techniques, such as MetaPathwayHunter and QNet, were developed to manage tree queries. Actually, QNet might also be used to search for graph queries (of bounded treewidth), but in the current system release this latter feature is not available. The most general techniques (i.e., GenoLink, NetMatch, SAGA, GraphMatch, MetaPAT and Fionda) can handle queries shaped as general graphs. Finally, Torque is a topology-free querying technique, where no information about the interaction patterns as encoded in the query graph is taken into account.
Moreover, the constraints in some cases imposed in the algorithms allow for the use of heuristic techniques to efficiently perform the search (for example, the color coding technique (Alon et al., 1995)). In some cases (e.g., for MetaPathwayHunter) the restrictions imposed on the query structure are dictated by the particular topology of the most interesting biological substructures in the biological networks of interest (e.g., metabolic networks).
4.2. Adoption of exact versus heuristic algorithms
Because of the typical size of the graph structures encoding biological networks, the adoption of exact vs. heuristic search techniques can produce significant differences in performances. In fact, only five of the eleven approaches under analysis (i.e., GenoLink, NetMatch, MetaPathwayHunter, GraphMatch and Torque) implement exact algorithms. Thus, on the one hand, due to the complexity of the sub-graph matching problem (recall that sub-graph isomorphism is NP-complete (Garey and Johnson, 1979)), exact algorithms can be applied only to small problem instances. On the other hand, since other methods (i.e., QPath, QNet, PATHBLAST, SAGA, MetaPAT, PathMatch, Fionda, and Qian) exploit heuristic algorithms, they do not guarantee optimal solutions to be necessarily returned.
4.3. Computational complexity
In order to proceed with comparing the methods on the basis of their computational complexity the following parameters are introduced:
n is the number of nodes of the target network;
m is the number of edges of the target network;
q is the number of nodes of the query sub-network;
Nins is the maximum number of allowed node insertions;
Ndel is the maximum number of allowed node deletions.
Note that, for three of the analyzed techniques (i.e., GenoLink, SAGA, and MetaPAT), complexity figures are not reported since complexity results are not available.
4.3.1. Polynomial time techniques
Some of the analyzed techniques, that are, MetaPathwayHunter, PathMatch, Fionda and Qian, run in polynomial time. In particular, MetaPathwayHunter (Pinter et al., 2005) has a time complexity of
4.3.2. Exponential time techniques
Five of the discussed systems, that are, PATHBLAST, NetMatch, QPath, QNet, GraphMatch, and Torque, run in exponential time in the number of nodes of the query sub-network. Therefore, these techniques are applicable only to relatively small problems. In detail, PATHBLAST (Kelley et al., 2003) runs in time O(q!l), where l is the number of edges of the global alignment graph. NetMatch's time complexity (Ferro et al., 2007) is O(q!q), while QPath (Shlomi et al., 2006) runs in
Note however that, in the computational complexity figures cited above, the exponential trend in q might not be as much problematic as an exponential trend in n, since in real applications q is expected to be relatively small as compared to n.
4.4. Availability and modifiability
All the techniques considered in this article developed to query Biological Networks are freely available for academic purposes. By modifiability we mean the possibility of accessing, and thus modifying and extending, the source code. For all the systems, it is possible to obtain the executables but only for a few of them, that is, QNet, PathMatch, GraphMatch, Qian, Torque, Fionda and PATHBLAST also the source code is available (Table 3). Some of the tools, i.e., MetaPathwayHunter, NetMatch, PathMatch, GraphMatch and MetaPAT can be directly downloaded; other systems, that is, QNet, Fionda and Qian can be obtained upon request. For those tools, i.e., PATHBLAST, SAGA and Torque, that are accessible via a Web interface, also the executable can be obtained (by a direct download link for SAGA and upon request for Torque and PATHBLAST). QPath is no longer available since its functionalities are now included in QNet, that is a more general tool. Finally, GenoLink is no longer maintained as a stand alone tool but most of its code, and in particular the query engine, has been reused in the Genostar's DataExplorer module.
4.5. User interface
As already mentioned in Section 4.4, some querying tools are accessible by a web interface. In particular, PATHBLAST can be accessed at www.pathblast.org/, SAGA at http://saga.ncibi.org/, and Torque at www.cs.tau.ac.il/∼bnet/torque.html. Other tools are not stand-alone systems, but rather, they were developed as plug-ins of some existing platform. NetMatch, for instance, can be downloaded as a java plug-in for the Cytoscape platform and Genolink is now part of the DataExplorer module developed by the Genostar team. All the other tools (Pinter et al., 2005; Dost et al., 2008; Yang and Sze, 2007; Wernicke and Rasche, 2007; Fionda et al., 2008; Qian et al., 2009) are available as stand-alone tools (Table 3).
The systems offering a web interface are simple to use, and the interfaces are rather user-friendly. Some of the stand-alone (MetaPathwayHunter, MetaPAT) and the plug-in tools (NetMatch and GenoLink), however, have a Graphical User Interface (GUI) that makes their usage simple and intuitive as well. The other tools (QNet, PathMatch, GraphMatch, Fionda, Qian), even if not providing a GUI, have a command line interface and are equipped with a reference manual and/or some sample data for helping novice users.
4.6. Data used for the evaluation
The approaches developed for querying biological graphs were tested by their developers on different organism networks. The data used for the evaluation have been extracted from several databases, as reported in Table 4. All the techniques proposed to querying PPI networks (Dost et al., 2008; Fionda et al., 2008; Kelley et al., 2003; Shlomi et al., 2006; Yang and Sze, 2007; Bruckner et al., 2009; Qian et al., 2009) were evaluated on networks downloaded from DIP (Database of Interacting Proteins) (Salwinski et al., 2004), though some of them also used other databases to obtain additional information (e.g., functional classification) or to perform evaluations on different data. For example, QPath (Shlomi et al., 2006) and QNet (Dost et al., 2008) used FlyGrid (Stark et al., 2006) (the section of BioGRID containing the interaction data pertaining the Drosophila melanogaster); Fionda (Fionda et al., 2008) also exploits data downloaded from MINT (Molecular INTeraction database) (Chatraryamontri et al., 2007); Torque (Bruckner et al., 2009) downloaded the interaction data also from Flybase (Flybase, 1999) (a database of Drosophila genes and genomes), SGD (Saccharomyces Genome Database) (Cherry et al., 1998), AmiGo (Gene Ontology database) (Carbon et al., 2008), CORUM (Ruepp et al., 2008) (the Comprehensive Resource of Mammalian protein complexes) and HPRD (Human Protein Reference Database) (Prasad et al., 2008).
Similarly to the approaches working on PPI networks, the approaches proposed to query metabolic networks (Pinter et al., 2005; Yang and Sze, 2007; Tian et al., 2007; Wernicke and Rasche, 2007) were evaluated on datasets downloaded from diverse databases. In detail, PathMatch, Graphmatch and SAGA were evaluated on the data downloaded from KEGG (Kyoto Encyclopedia of Genes and Genomes) (Kanehisa and Goto, 2000). The information stored in EcoCyc (Keseler et al., 2009) were used in PathMatch, Graphmatch and MetaPathwayHunter. Furthermore, this latter system also exploited the SGD (Cherry et al., 1998) data, SAGA used Reactome (Matthews et al., 2008) data and MetaPAT downloaded information from BioCyc (Karp et al., 2005). Finally, GenoLink was evaluated on the data downloaded from COG (Tatusov et al., 2001), InterPro (Hunter et al., 2008), and BRENDA (Chang et al., 2008).
Moreover, the systems were evaluated on networks of different organisms (Table 4). In detail, PATHBLAST was tested on the PPI network of S. cerevisiae (yeast); QPath and QNet were evaluated using the networks of S. cerevisiae, D. melanogaster (fly), and H. sapiens (human); PathMatch was run on the networks of S. cerevisiae, D. melanogaster, C. elegans (worm), H. pylori (bacteria), and E. coli (bacteria); for GraphMatch, the networks of S. cerevisiae, D. melanogaster, and C. elegans were used; Fionda was tested on the networks of S. cerevisiae, D. melanogaster, C. elegans, and H. sapiens; Torque was evaluated on the networks of S. cerevisiae, D. melanogaster, H. sapiens, M. musculus (mouse), R. norvegicus (rat), and B. taurus (bovine); Qian was tested on the networks of S. cerevisiae, D. melanogaster, H. sapiens, C. elegans, and E. coli.
With regard to the systems tested on metabolic networks, MetaPathwayHunter was evaluated using the networks of E. coli and S. cerevisiae; SAGA on the networks of H. sapiens and MetaPAT on the networks of B. subtilis (bacteria), E. coli, H. sapiens, S. cerevisiae, and T. thermophilus (bacteria). Finally, Genolink was evaluated on the networks of E. coli and H. pylori; PathMatch on the network of E. coli and GraphMatch on the ones of E. coli and T. thermophilus (bacteria).
5. Comparison of Biological Results
In this section, a comparison of the results obtained by running the different tools for querying real biological networks is carried out. In particular, Section 5.1 reports the results obtained by the tools devoted to querying protein-protein interaction networks (Kelley et al., 2003; Shlomi et al., 2006; Dost et al., 2008; Yang and Sze, 2007; Fionda et al., 2008; Bruckner et al., 2009; Qian et al., 2009), and Section 5.2 discusses the results obtained by those systems that deal with metabolic pathways (Pinter et al., 2005; Tian et al., 2007; Yang and Sze, 2007; Wernicke and Rasche, 2007). All the experiments were executed on an Intel Core2 Duo running at 2.4GHz with 4 GB RAM.
5.1. PPI network comparison
Since not all the tools proposed to query protein-protein interaction networks are able to deal with general graphs, the comparison was carried out following two directions. The first comparison concerned the systems proposed to search for pathways (Kelley et al., 2003; Shlomi et al., 2006; Yang and Sze, 2007; Qian et al., 2009) and is reported in Section 5.1.1. The second comparison regarded the tools able to handle queries shaped as general graphs (Yang and Sze, 2007; Fionda et al., 2008) and is conducted in Section 5.1.2. As for Torque (Bruckner et al., 2009), which is a topology-free querying algorithm, it was compared to the other methods using a general graph query. Regarding QNet, since this is the only tool proposed to query PPI networks using tree-shaped queries, its results were compared with the ones obtained by the other tools using as query a tree extracted from the more general query graph. The thresholds imposed to the E-values for considering two proteins as a matching pair have been set according to the characteristics of input data and involved algorithms. The data used for the evaluation were taken from the May 2008 release of the MINT database (Chatraryamontri et al., 2007).
5.1.1. Pathway queries
In this section, we discuss tools that allow pathway-shaped queries. The query pathway used in the evaluation was the mating-pheromone response pathway taken from the yeast network and shown in Figure 14. This pathway has been used to query the yeast network itself to identify similar pathways. The query pathway consists of 6 proteins and contains the mitogen-activated protein (MAP) kinase cascade, made of the proteins Ste11, Ste7, and Fus3.
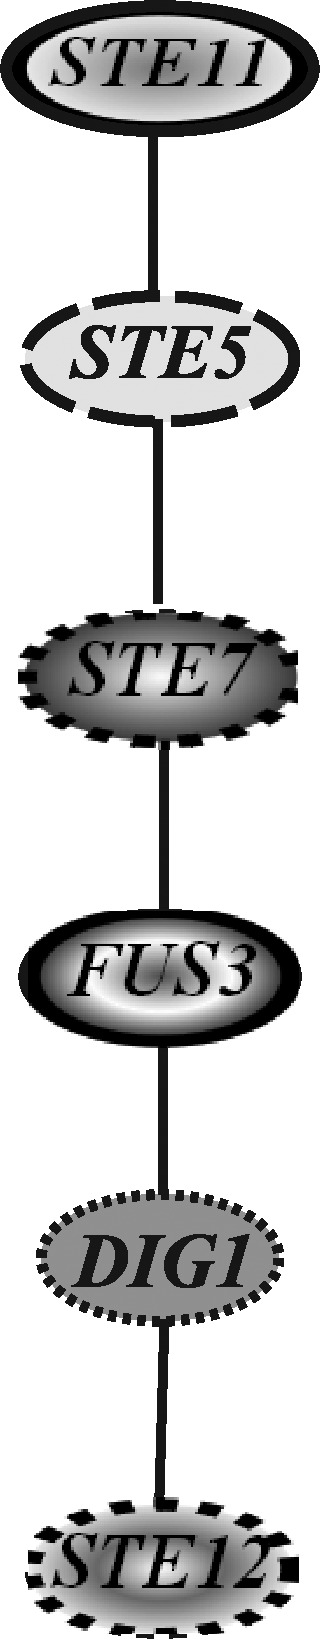
Mating-pheromone response pathway of yeast used to query the yeast network.
The default values for the running parameters were used for all the softwares, and the BLAST E-value threshold for considering two proteins as a matching pair was set to 10−2. For all results a table, reporting the E-value of the matching proteins, is provided.
Figure 15 shows the results obtained by running PATHBLAST. The execution time was in the order of few seconds. The best-score pathway retrieved by PATHBLAST is not the query pathway itself, but a pathway in which the Fus3 protein is substituted by its homologous Kss1 (both Fus3 and Kss1 are mitogen-activated kinases). The query pathway itself was ranked the third among the retrieved solutions, while the second one was a pathway that matches Fus3 to Ste11 and Kss1 to Fus3. This apparently strange behavior can be explained by looking at edge weights. Indeed, the interaction between Ste7 and Kss1 and Dig1 and Kss1 are more reliable that the ones between Ste7 and Fus3 and Dig1 and Fus3. Moreover, the interaction between Fus3 and Ste5 is more reliable than that of Ste11 and Ste5, and even if Fus3 and Ste11 obviously have a lower sequence similarity than Ste11 with itself, their E-value is lower than the imposed threshold so that Fus3 and Ste11 represent anyway a matching protein pair.
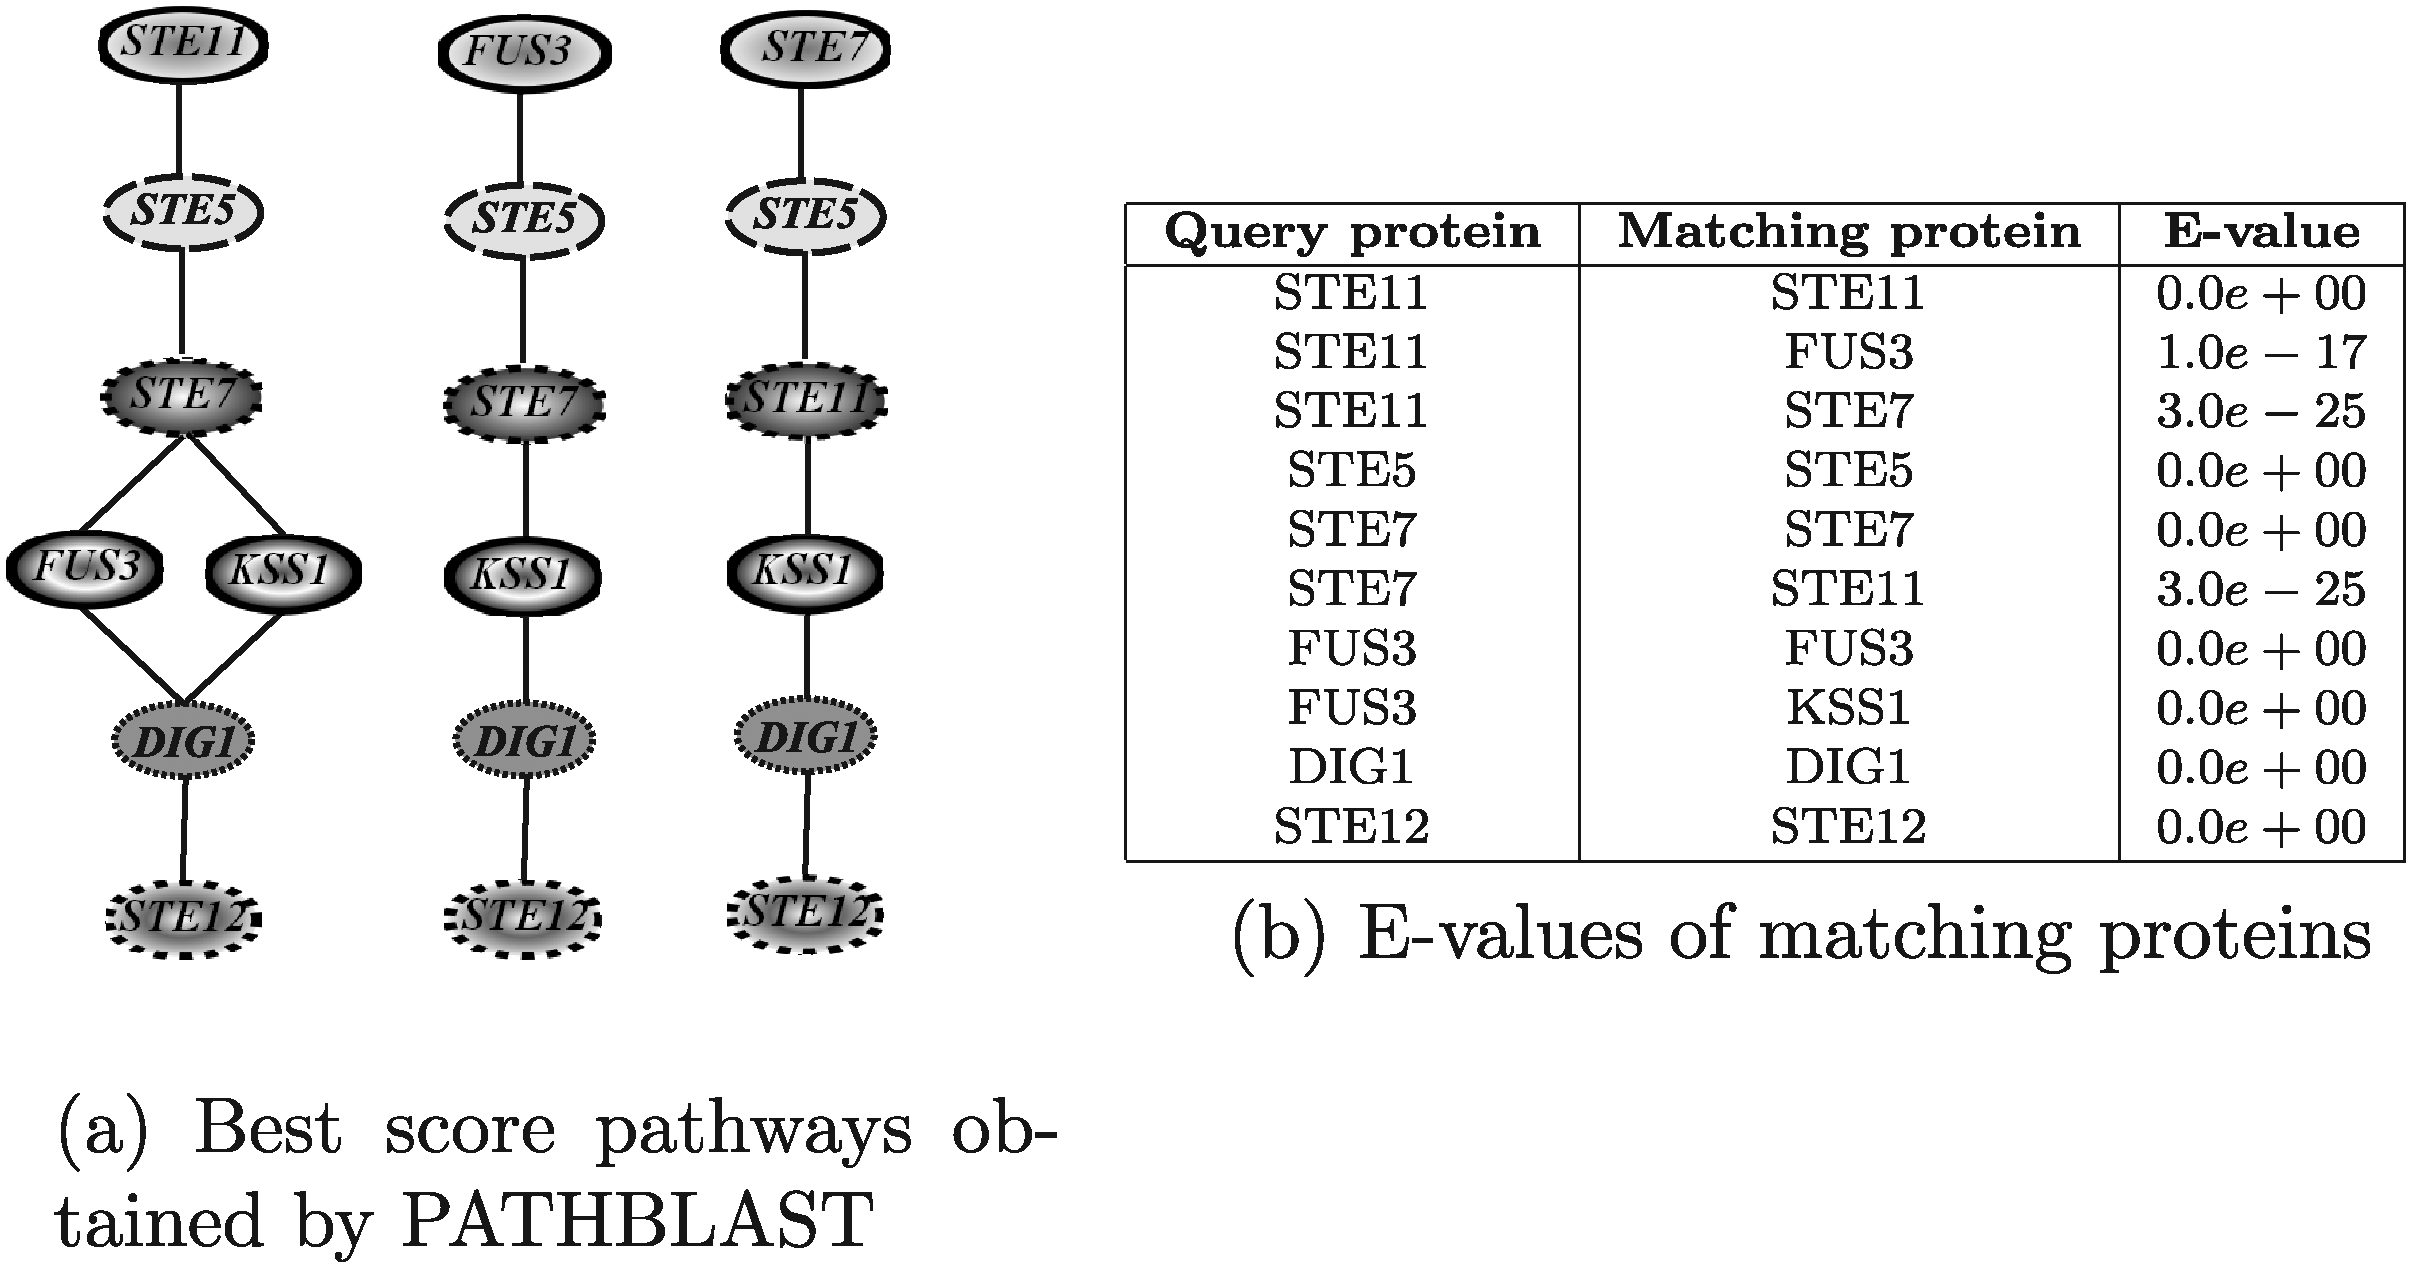
Best score yeast pathways retrieved by PATHBLAST
Figure 16 shows the results obtained by running PathMatch. The results reported in Figure 16a correspond to three different values for the allowed number of node insertions (1–3). The execution times of all the three configurations were of about 27 minutes. The best results returned by all executions were collected and ordered by decreasing scores. The two best score pathways were the query pathway itself and the homologous pathway in which Fus3 is substituted by Kss1. Since PathMatch does not take into account interaction reliabilities, it assigns the same score to both pathways. This tool is able to discover a larger set of pathways than PATHBLAST. This is explained by noting that PATHBLAST is only able to discover solutions in which no more than one consecutive gap occur. It is also worth noting that the correspondences retrieved by PathMatch are indeed relevant, as the proteins Fus3, Kss1, Slt2 and Hog1 are mitogen-activated kinases and Ste11, Ste7 and Bck1 are Serine/threonine kinases.
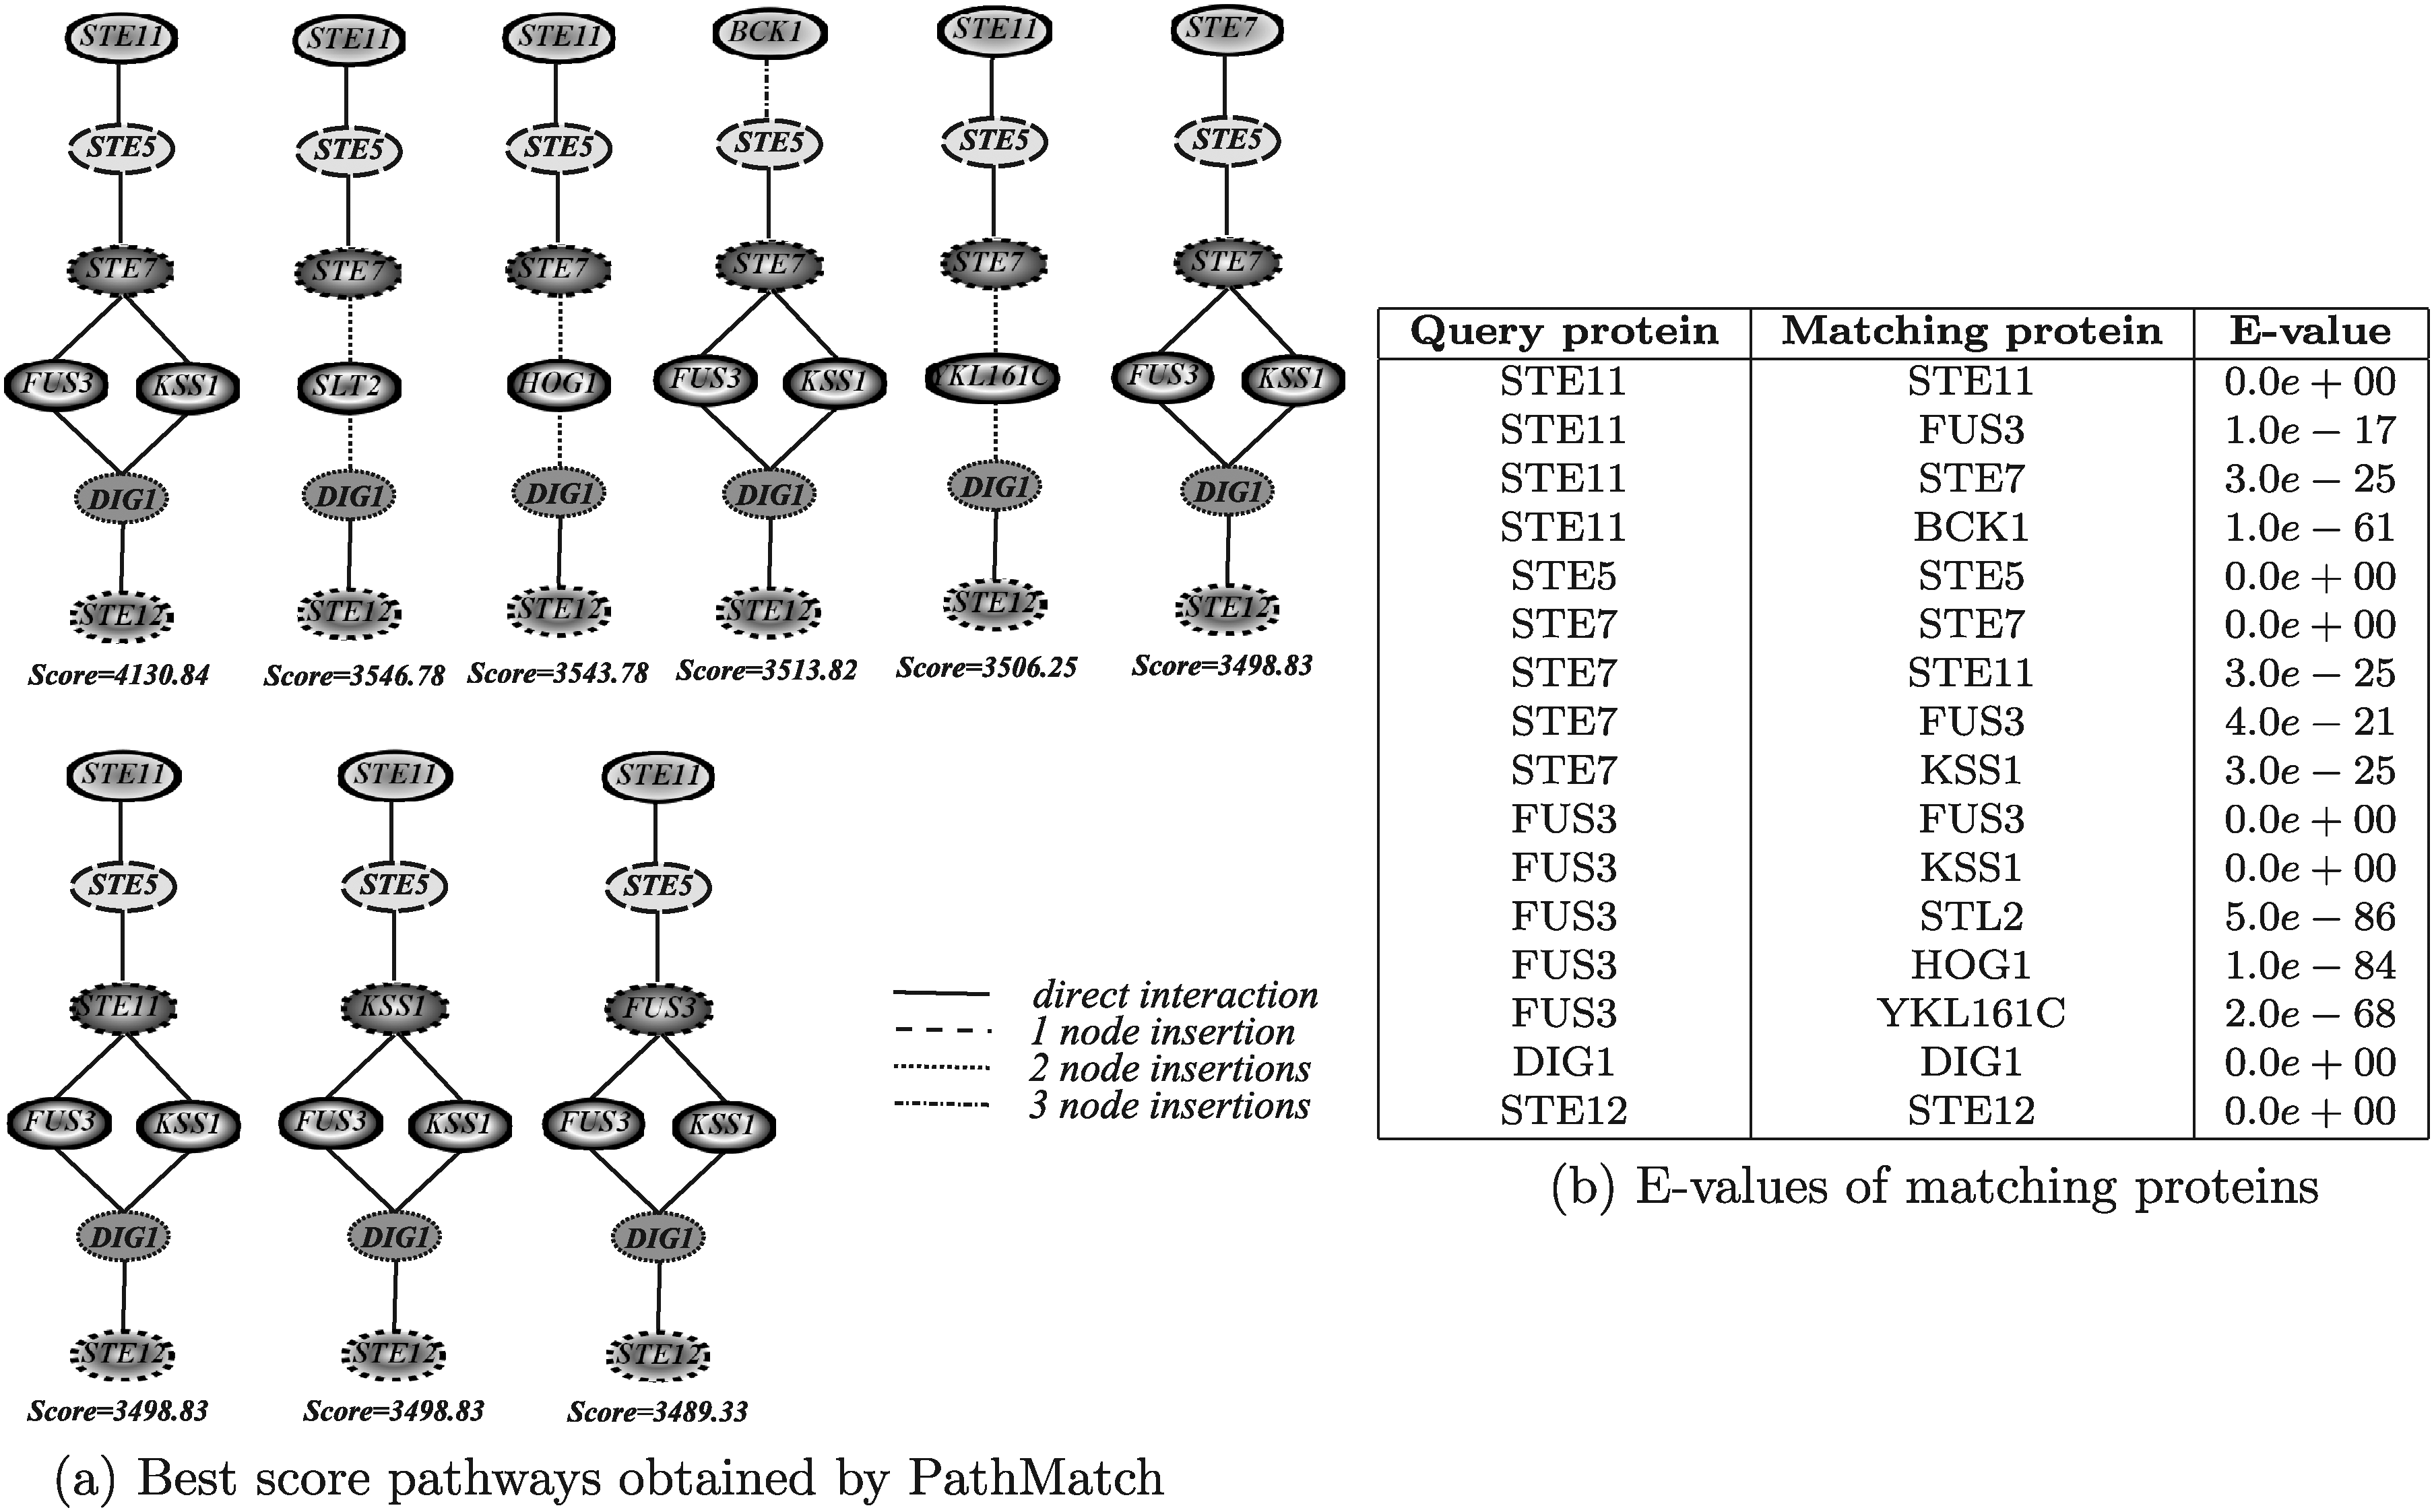
Best score yeast pathways retrieved by PathMatch.
Figure 17 shows the results obtained by running Qian. The results reported in Figure 17a were obtained by allowing no node insertions. The algorithm has been also executed considering 1, 2, 3, 4 and 5 node insertions, but in all those cases the resulting pathways were the same as reported in the figure, with the only difference that some node insertions were included at the end of the pathway or between two matching nodes. The execution times for all configurations were in the order of few seconds. Qian retrieved basically the same pathways discovered by PathMatch by setting no node insertions and in almost the same order (recall that Qian, as PathMatch, does not take into account interaction reliabilities).
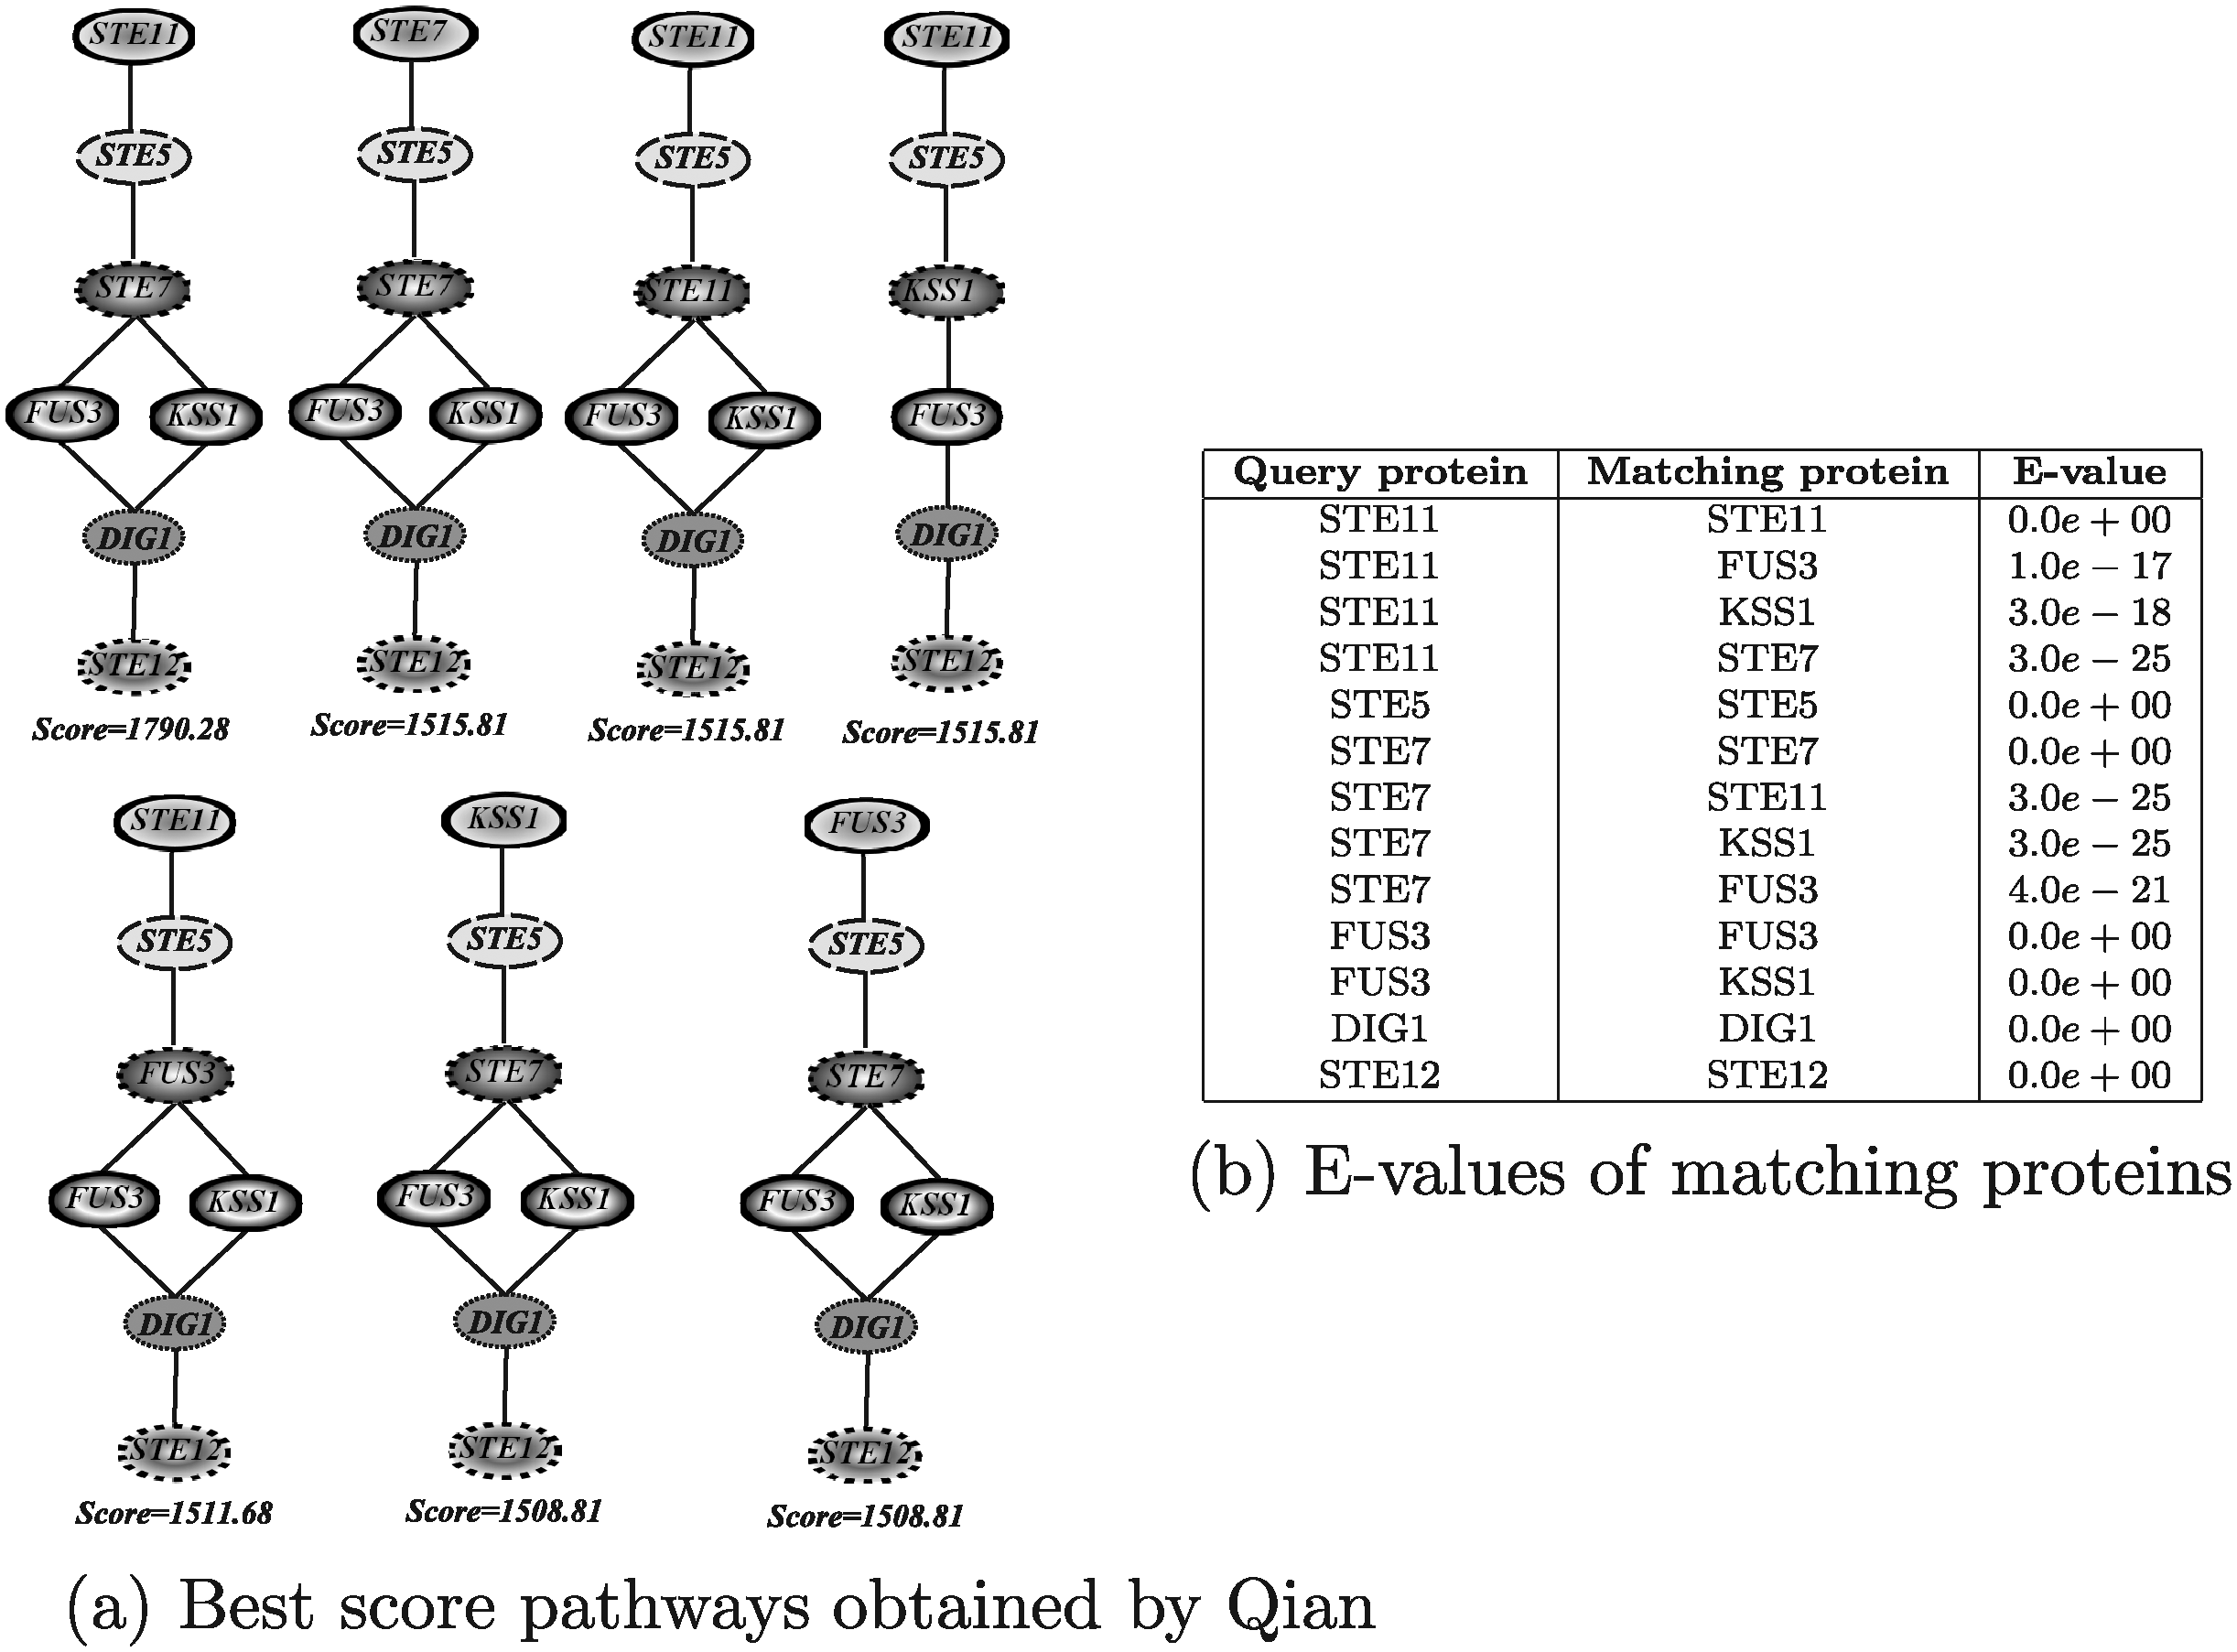
Best score yeast pathways retrieved by Qian.
Figure 18 shows the results obtained by running QPath. The algorithm has been executed allowing 1, 2, and 3 node insertions. The execution times in the three different configurations were of about 3 seconds, about 1 minute and 40 seconds, and about 5 hours, 25 minutes, and 40 seconds, respectively. A larger number of node insertions were not considered in the experiments since these would have taken too long to be executed. In the first configuration, the tool returned the query pathway itself as the solution. It the other two configurations, rather strangely, QPath retrieved the same solution returned by other algorithms, but it included two and three node insertions, respectively, between the proteins Ste11 and Ste5 even if these two proteins have a direct interaction.
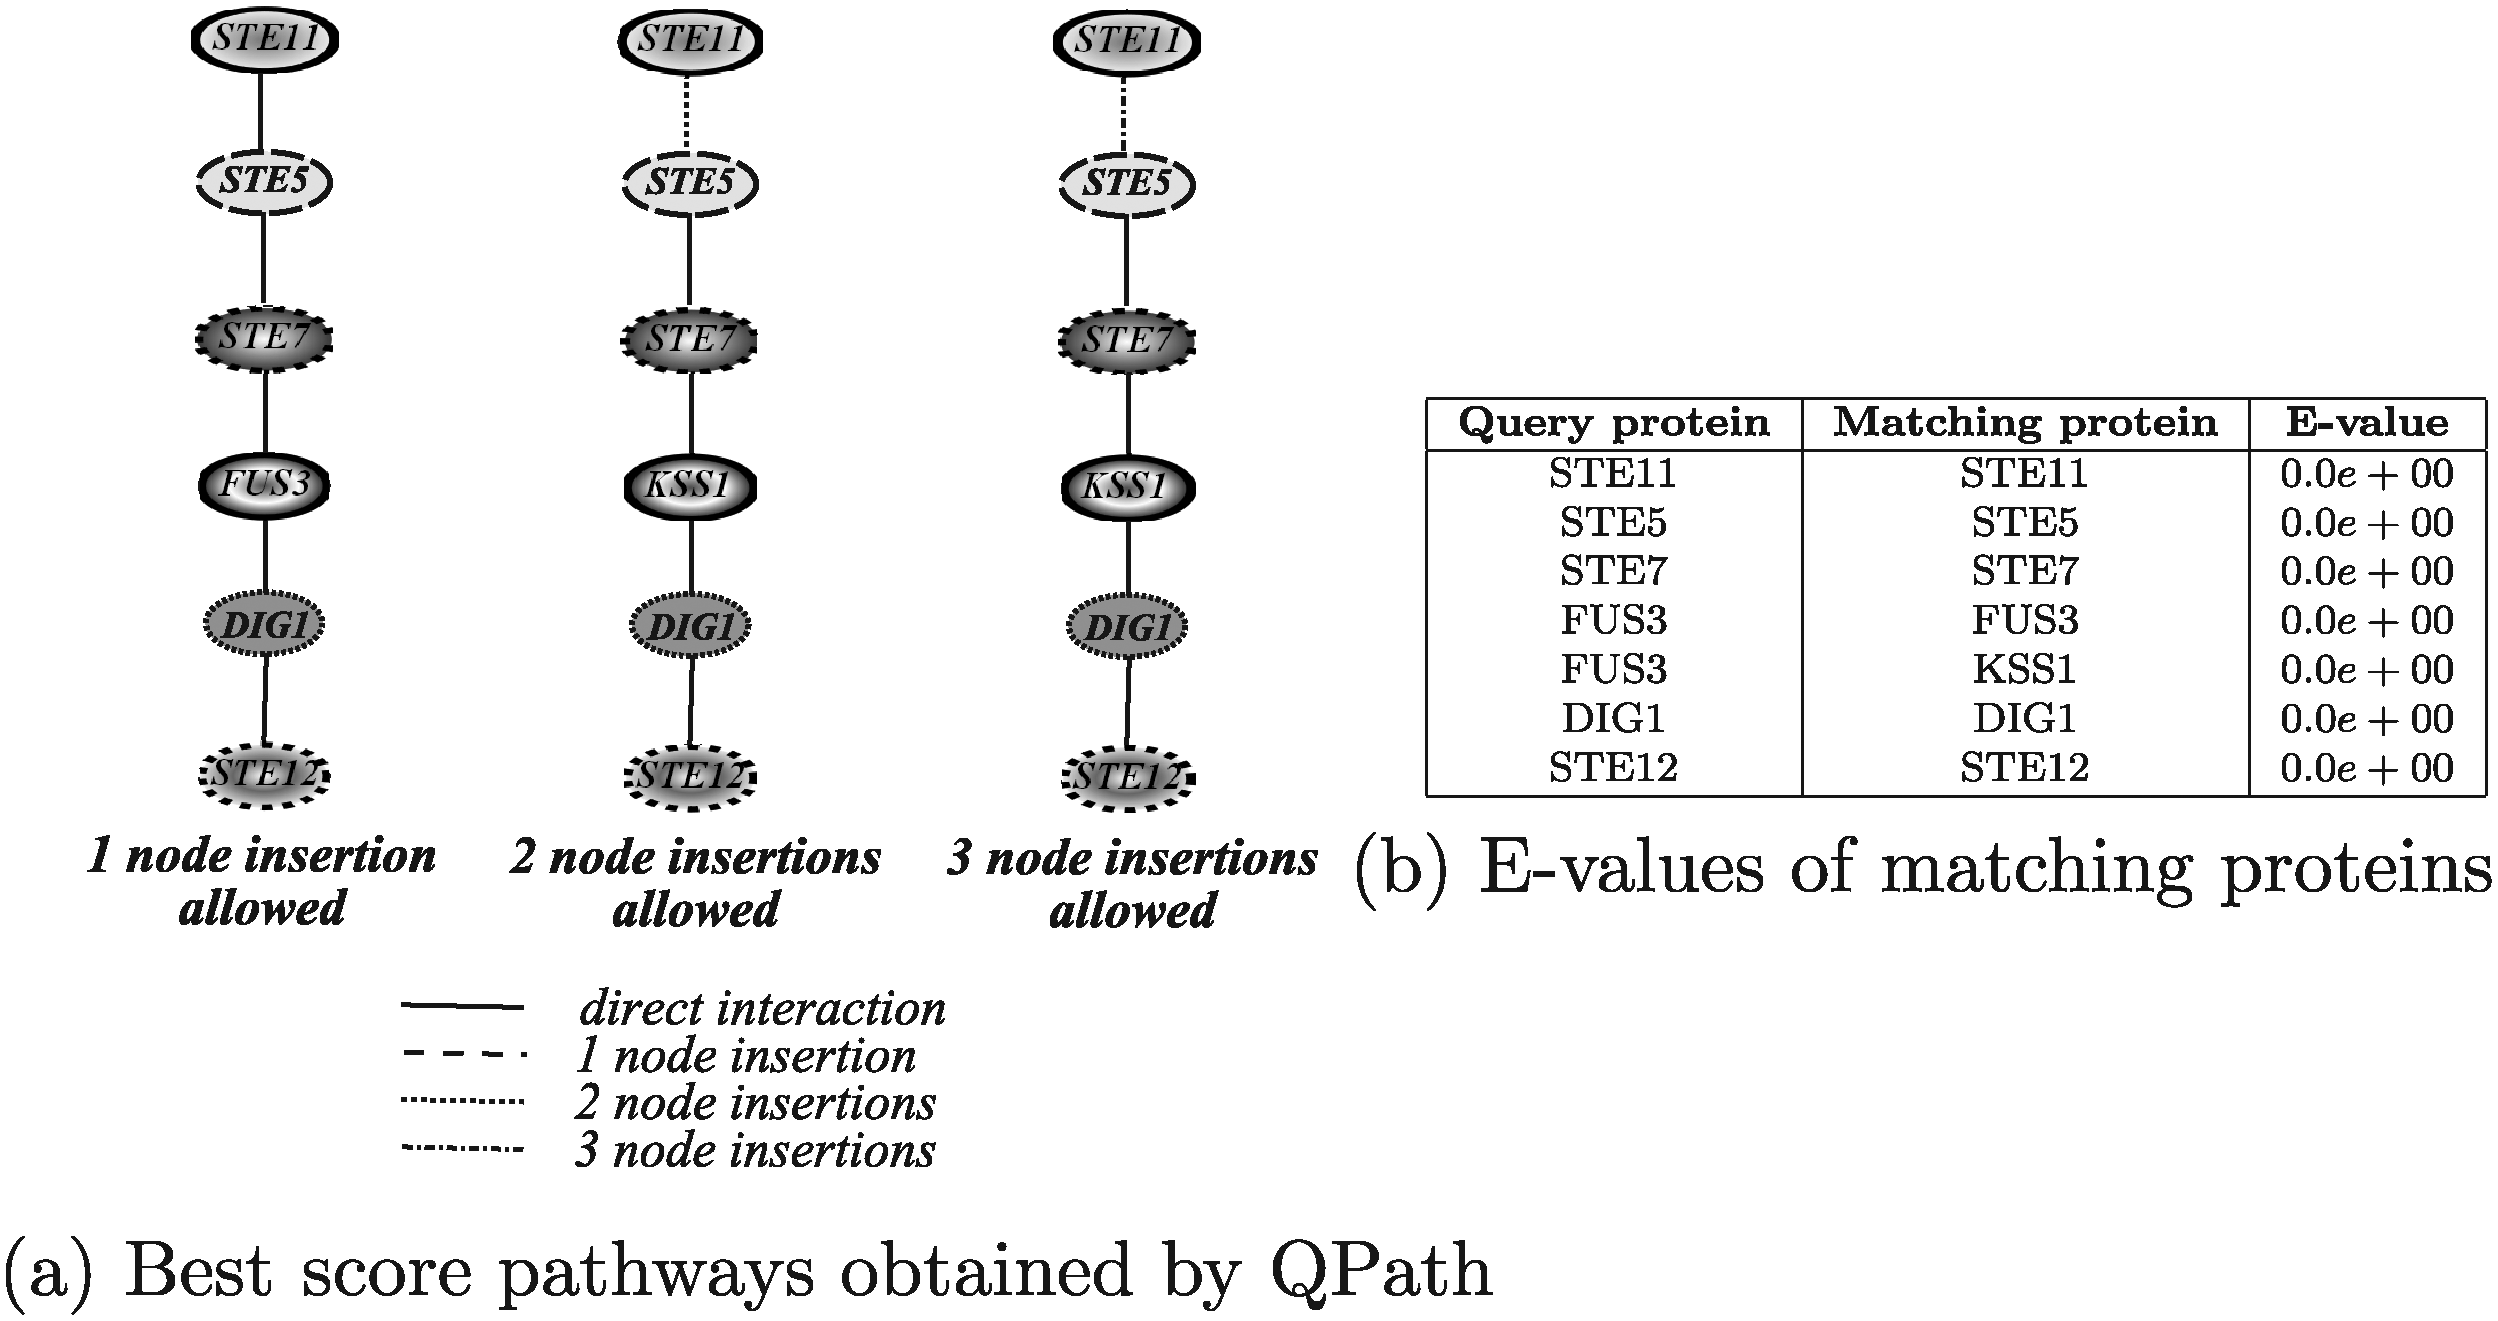
Best score yeast pathways retrieved by QPath.
5.1.2. General graph queries
In this section, the results obtained by exploiting the tools able to query PPI networks using queries shaped as general graphs, are discussed. The query graph used in the evaluation was the yeast actine-related-proteins module, shown in Figure 19a. The actin is well conserved among eukaryotes since it is a main component of the cytoskeleton. In yeast, it binds several proteins that regulate its polymerization/depolymerization and which are included in the query graph. This module has been used to query the human network to identify similar functional modules.
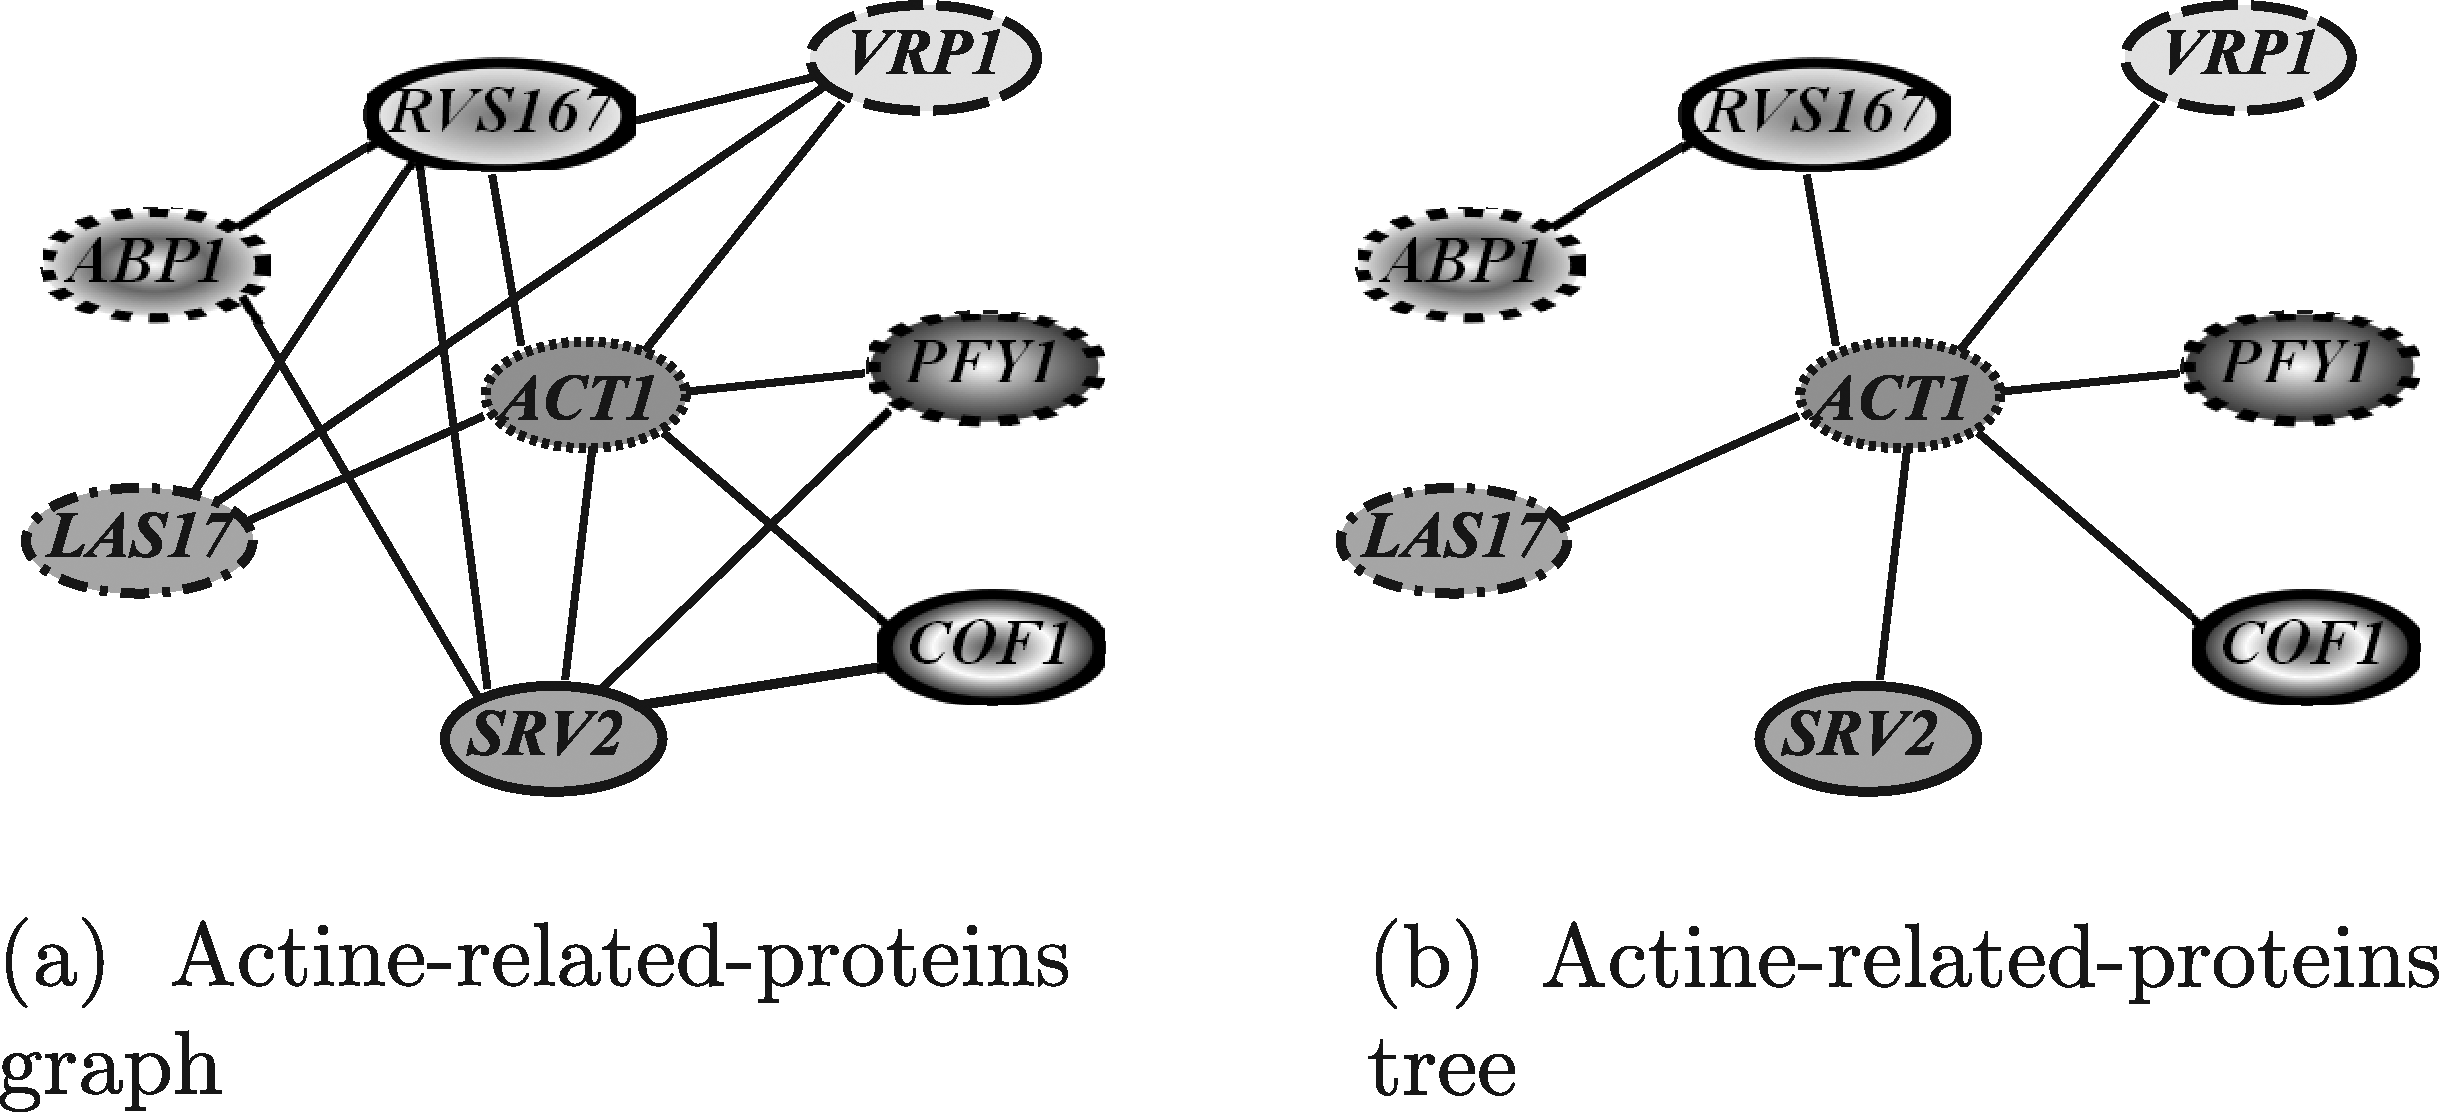
Yeast actine-related-proteins modules used to query the human network.
In more detail, for testing GraphMatch (Yang and Sze, 2007) and Fionda (Fionda et al., 2008) the query graph reported in Figure 19(a) has been used. Instead, the query tree reported in Figure 19b, extracted from the complete query module, has been exploited for testing QNet (Dost et al., 2008), since this tool deals with tree-shaped query only. Clear enough, in order to test Torque (Bruckner et al., 2009), the proteins occurring in the query module have been used as a simple set, without any information about their interactions.
Default values of running parameters were used for all the softwares, and the BLAST E-value threshold for having two proteins considered as a matching pair was set to 10−8. For all results a table reporting the E-value of the matching proteins is provided.
Figure 20 shows the results obtained by running GraphMatch. The results reported in Figure 20c correspond to three different values for the allowed number of node insertions (1–3). The execution times for all three configurations were in the order of 36 minutes and GraphMatch was able to find significant biological results. In fact, human homologs of the yeast proteins have been correctly paired (i.e., ACT1/ACTB, ACT1/ACTR1B, COF1/CFL1, VRP1/WIPF1, PFY1/PFN1, LAS17/WAS, SRV2/CAP2 in yeast and human, respectively). Moreover, since the searched module has increased its complexity moving from yeast to human, the interaction between several pairs of proteins is mediated by other proteins. Of course, the best result was obtained by allowing three node insertions. Indeed, by allowing only one or two node insertions the system was not able to discover very good solutions in that only three and four proteins, respectively, were matched. Moreover, GraphMatch forced the matching of ABP1 and RVS167 proteins that have no homologous in the considered target network which, from a biological point of view, should be considered as node deletions.
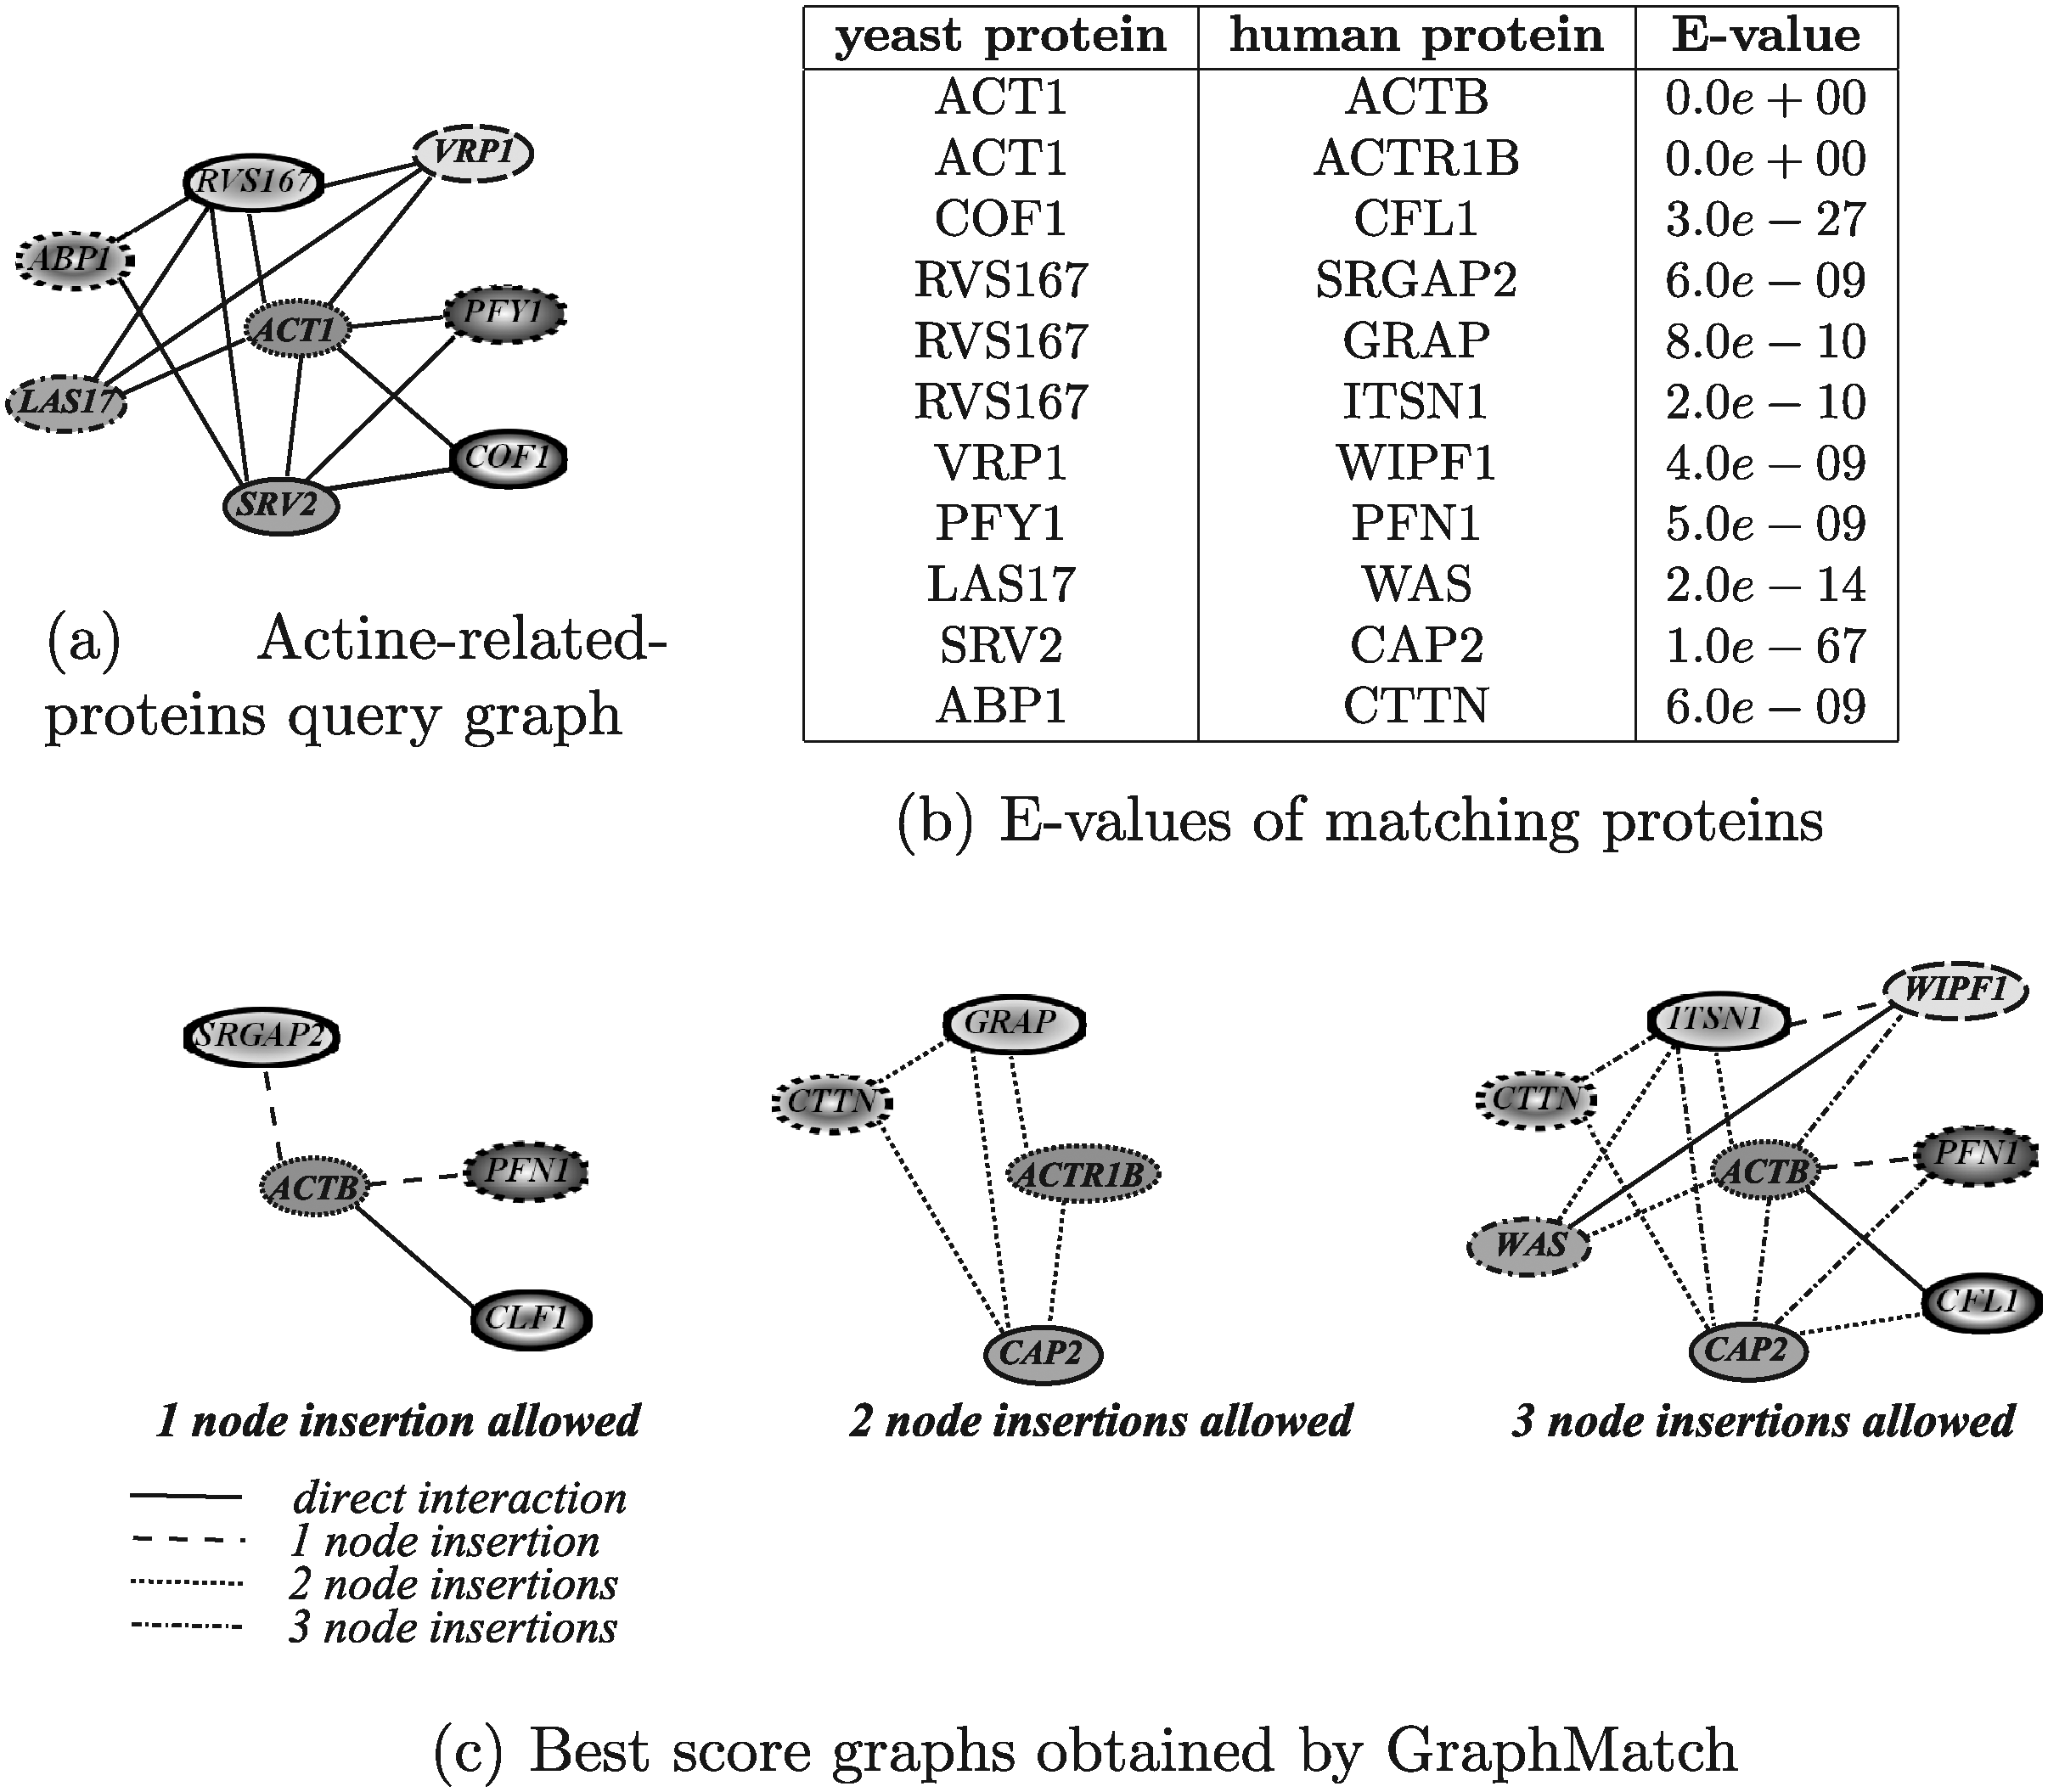
Human actine-related-proteins modules retrieved by GraphMatch using different running configurations.
Figure 21 shows the results obtained by running Fionda. The result reported in Figure 21c were obtained by fixing two different values for the distance thresholds (i.e., 12 and 13). The execution times in both the cases were of about one second. Note that the running times do not take into account the execution of the Floyd-Warshall algorithm, for computing target protein distances, since for a given target network this algorithm has to be executed only once and off-line and the matrix can be saved on a file and accessed for subsequent executions. In both the executions, Fionda was able to retrieve significant biological results by correctly pairing the human homologs of the yeast proteins (the same as those retrieved by GraphMatch plus the pair COF1/DSTN). In addition, and more correctly than GraphMatch, Fionda considered the protein ABP1 as a node deletion since it has no an homolog in the considered target network.
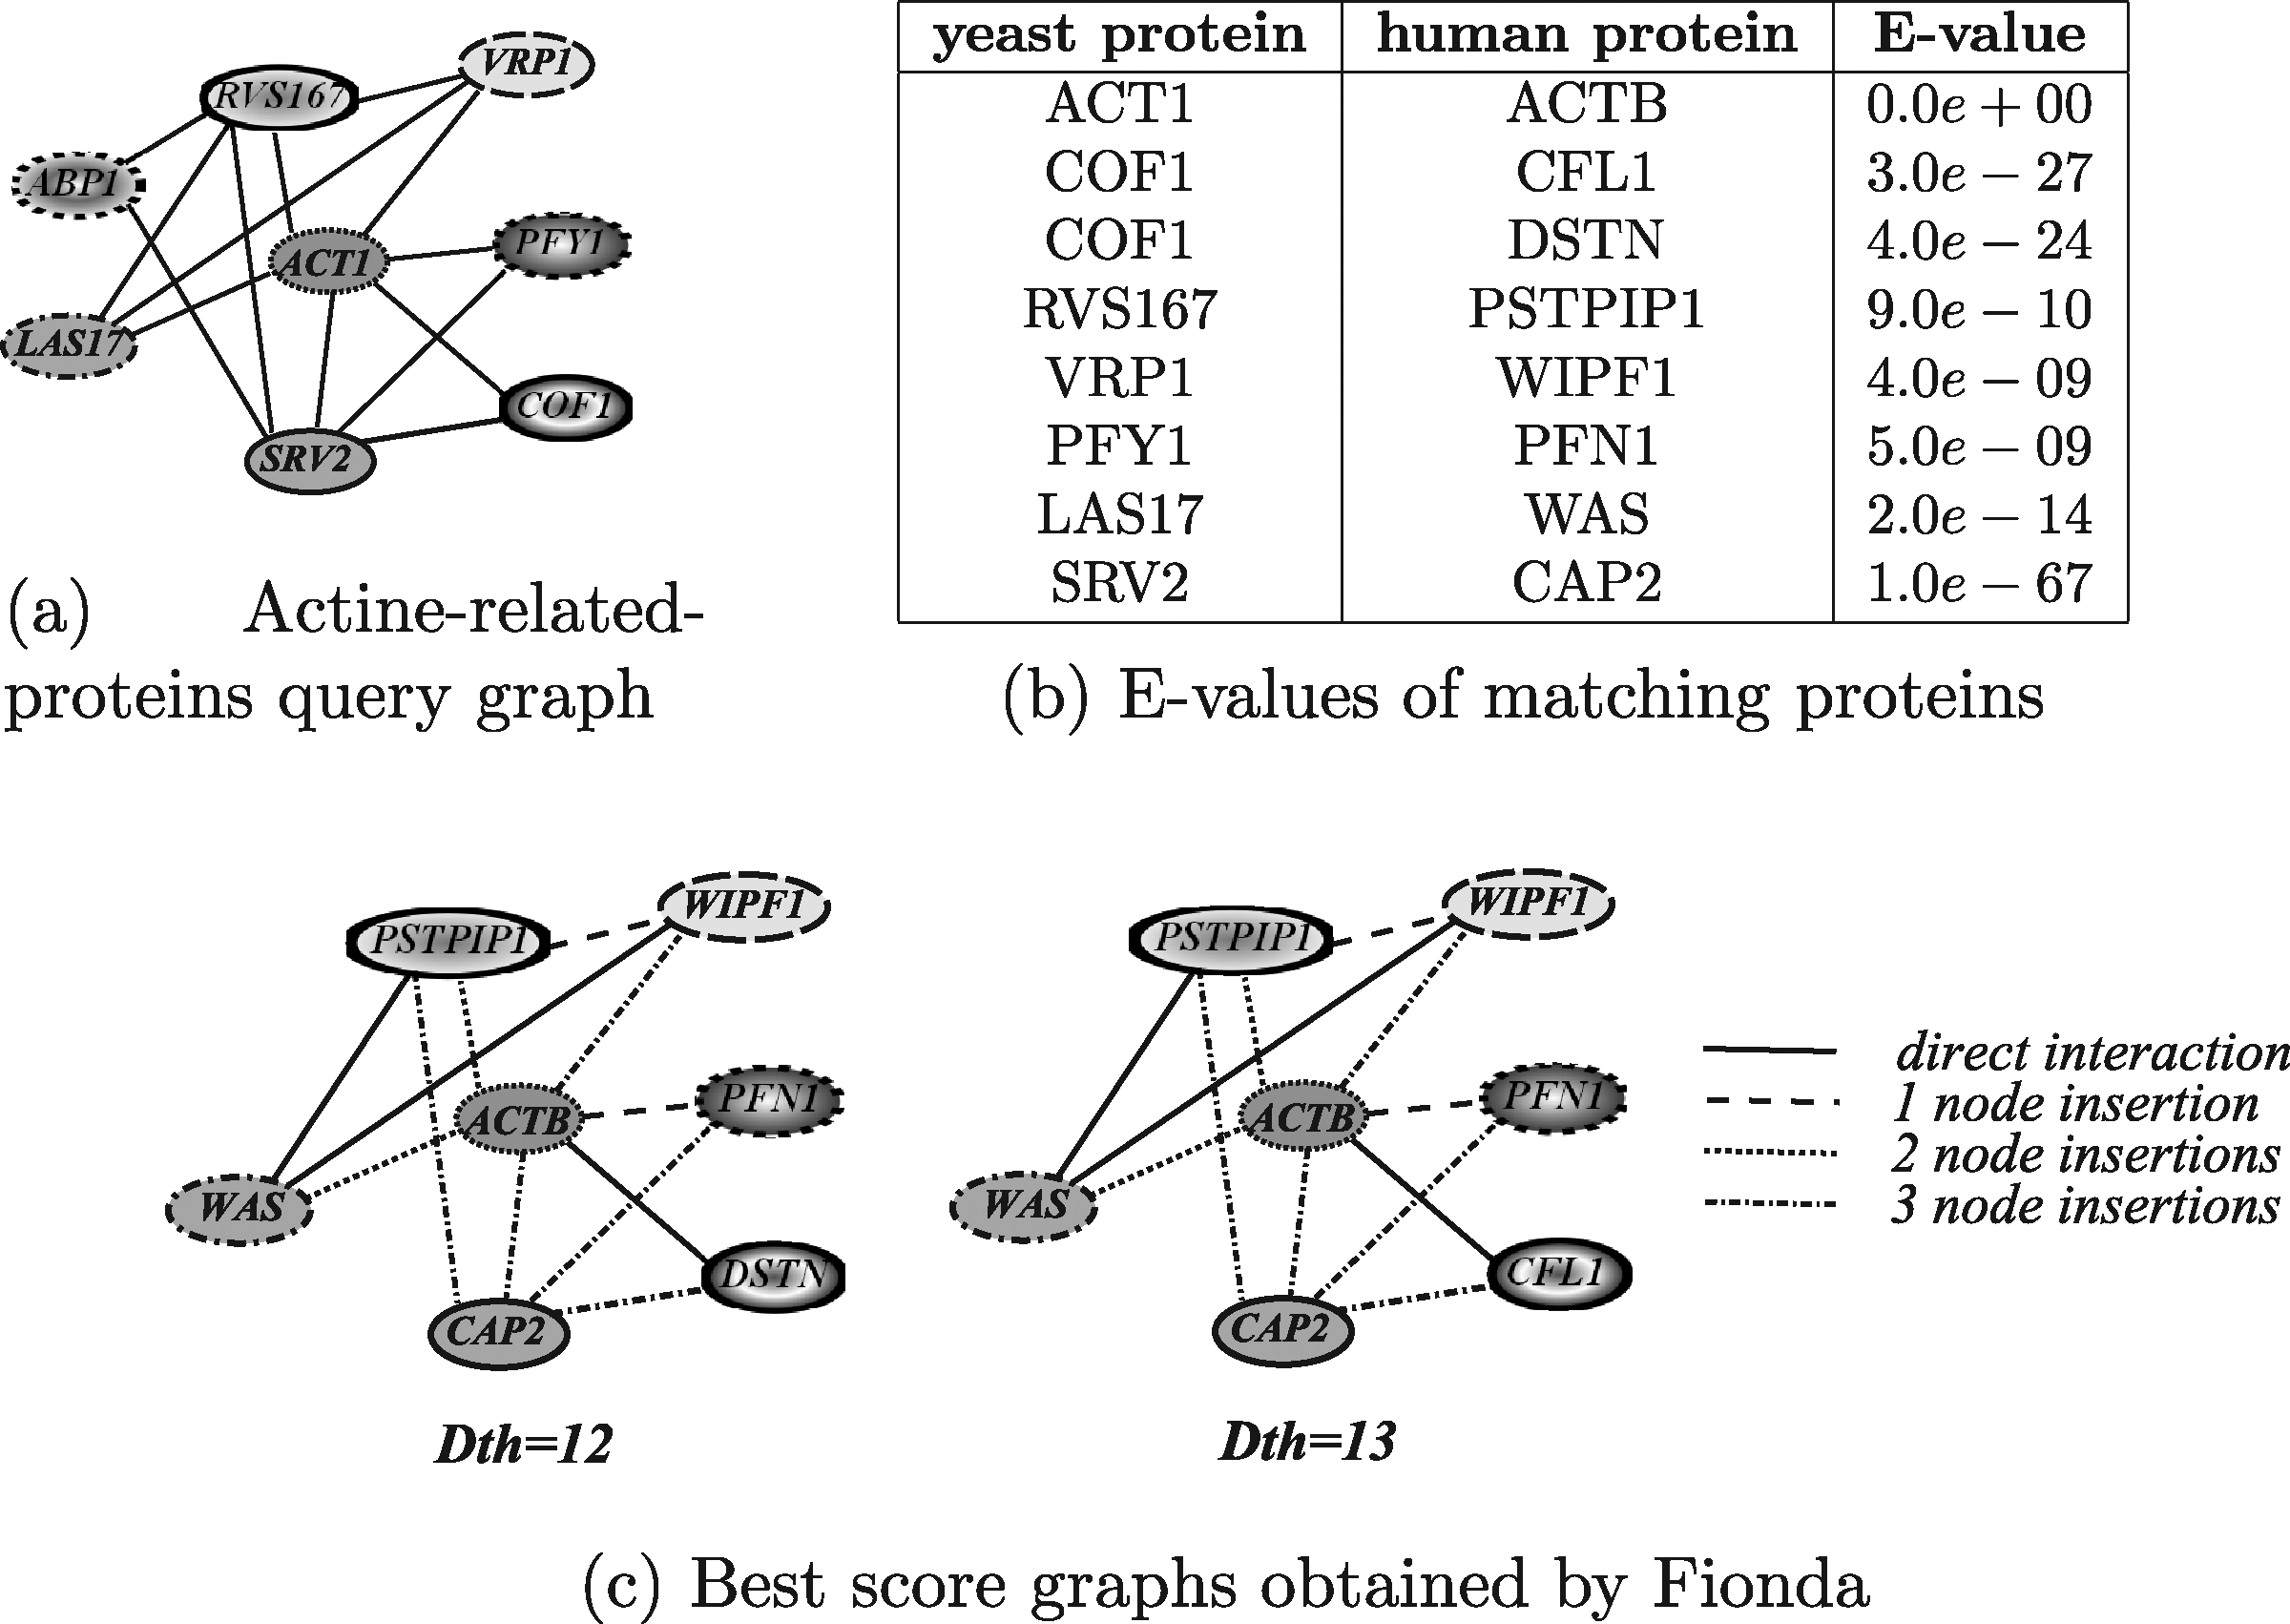
Human actine-related-proteins module retrieved by Fionda using a distance threshold equal to 12 and 13.
Figure 22 shows the results obtained by running QNet. The results reported in Figure 22c were obtained by running the algorithm by fixing the maximum number of allowed node insertions to 3 and the maximum number of node deletions to 4. The execution time was about 6 minutes and 9 seconds. QNet correctly paired the proteins ACT1/ACTB, PFY1/PFN1, and COF1/CLF1. However, it “wasted” two of the three allowed node insertions to match the pair RVS167/PSTPIP1 even if protein RVS167 has no homologs in the considered target network. We tried also to run QNet by fixing a threshold of 4 node insertions but, after several days, we stopped the execution obtaining no results.
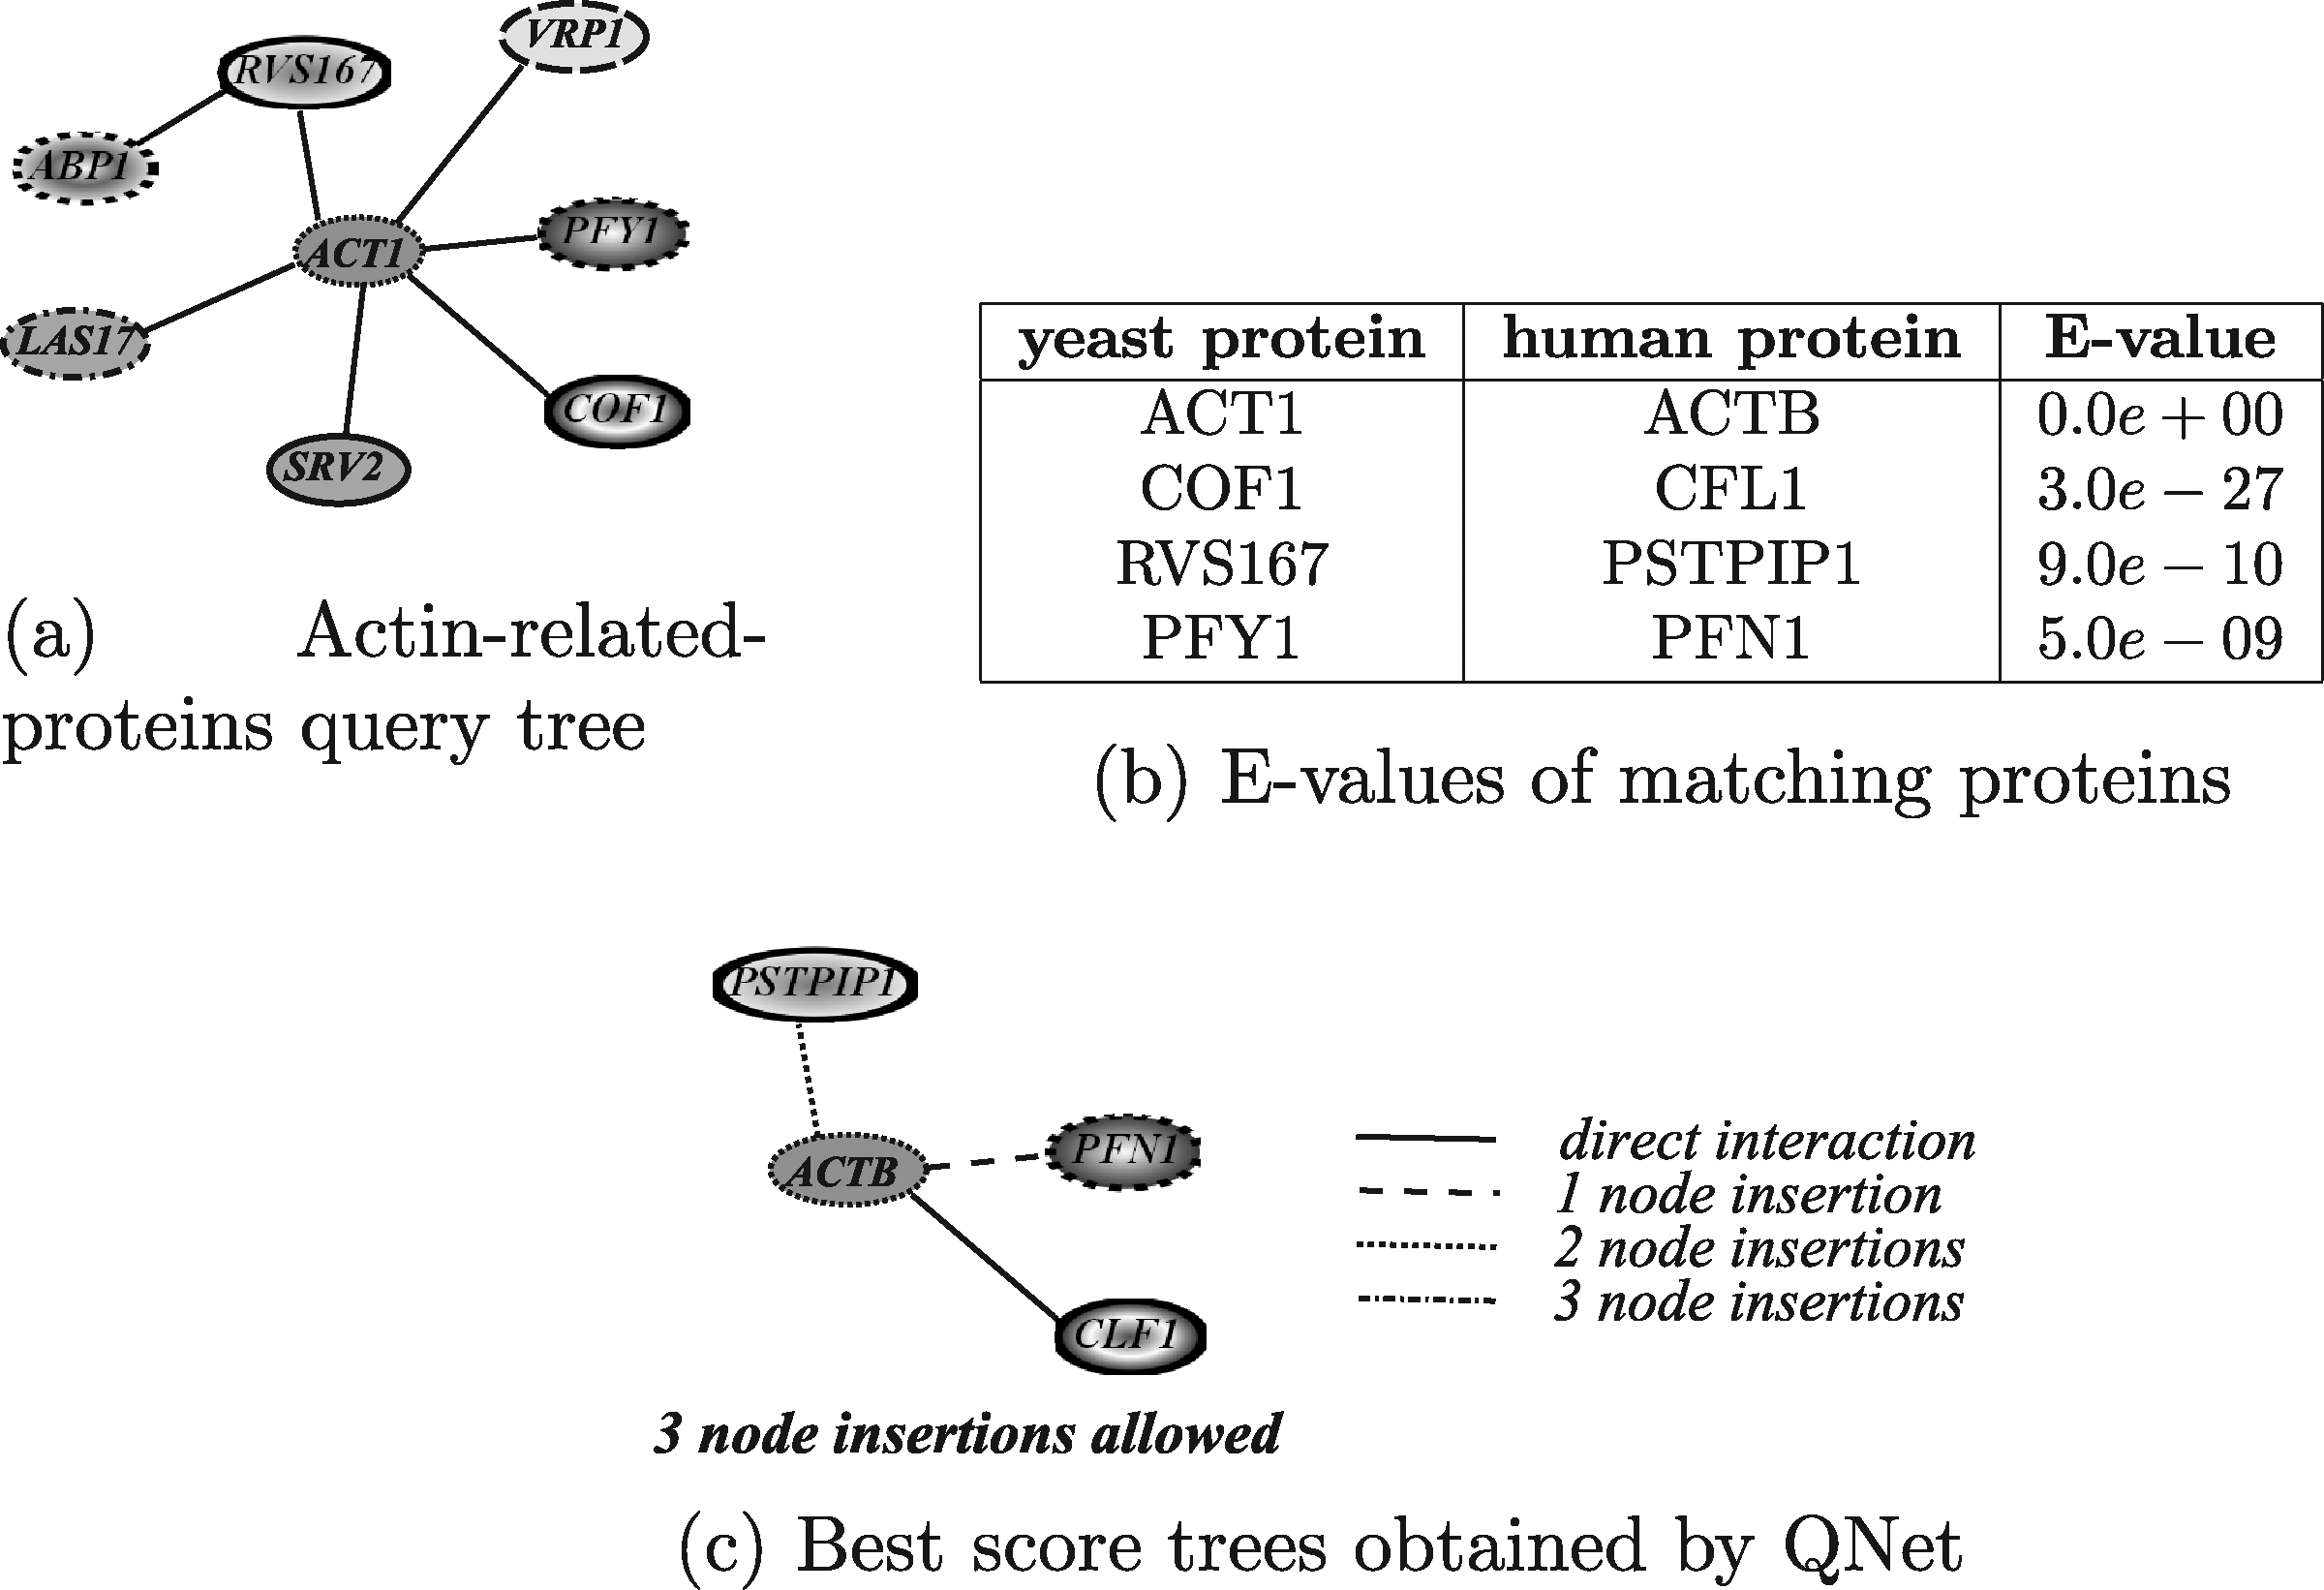
Human actin-related-proteins modules retrieved by QNet using different running configurations.
Figure 23 shows the module obtained by running Torque. As Torque does not provide any information about which discovered proteins match which query proteins, the matching proteins were identified by maximizing the correspondent E-values. The execution time was about 3 hours, 41 minutes, and 28 seconds by allowing a maximum of 6 node insertions and 4 node deletions. Torque paired only four query proteins and was able to pair three human homologs (i.e., ACT1/ACTR2, VRP1/WIPF1, LAS17/WASL). However, one of the four matched proteins (i.e., RVS167) has no homologs in the human network, thus that this protein can be considered to have been incorrectly paired.
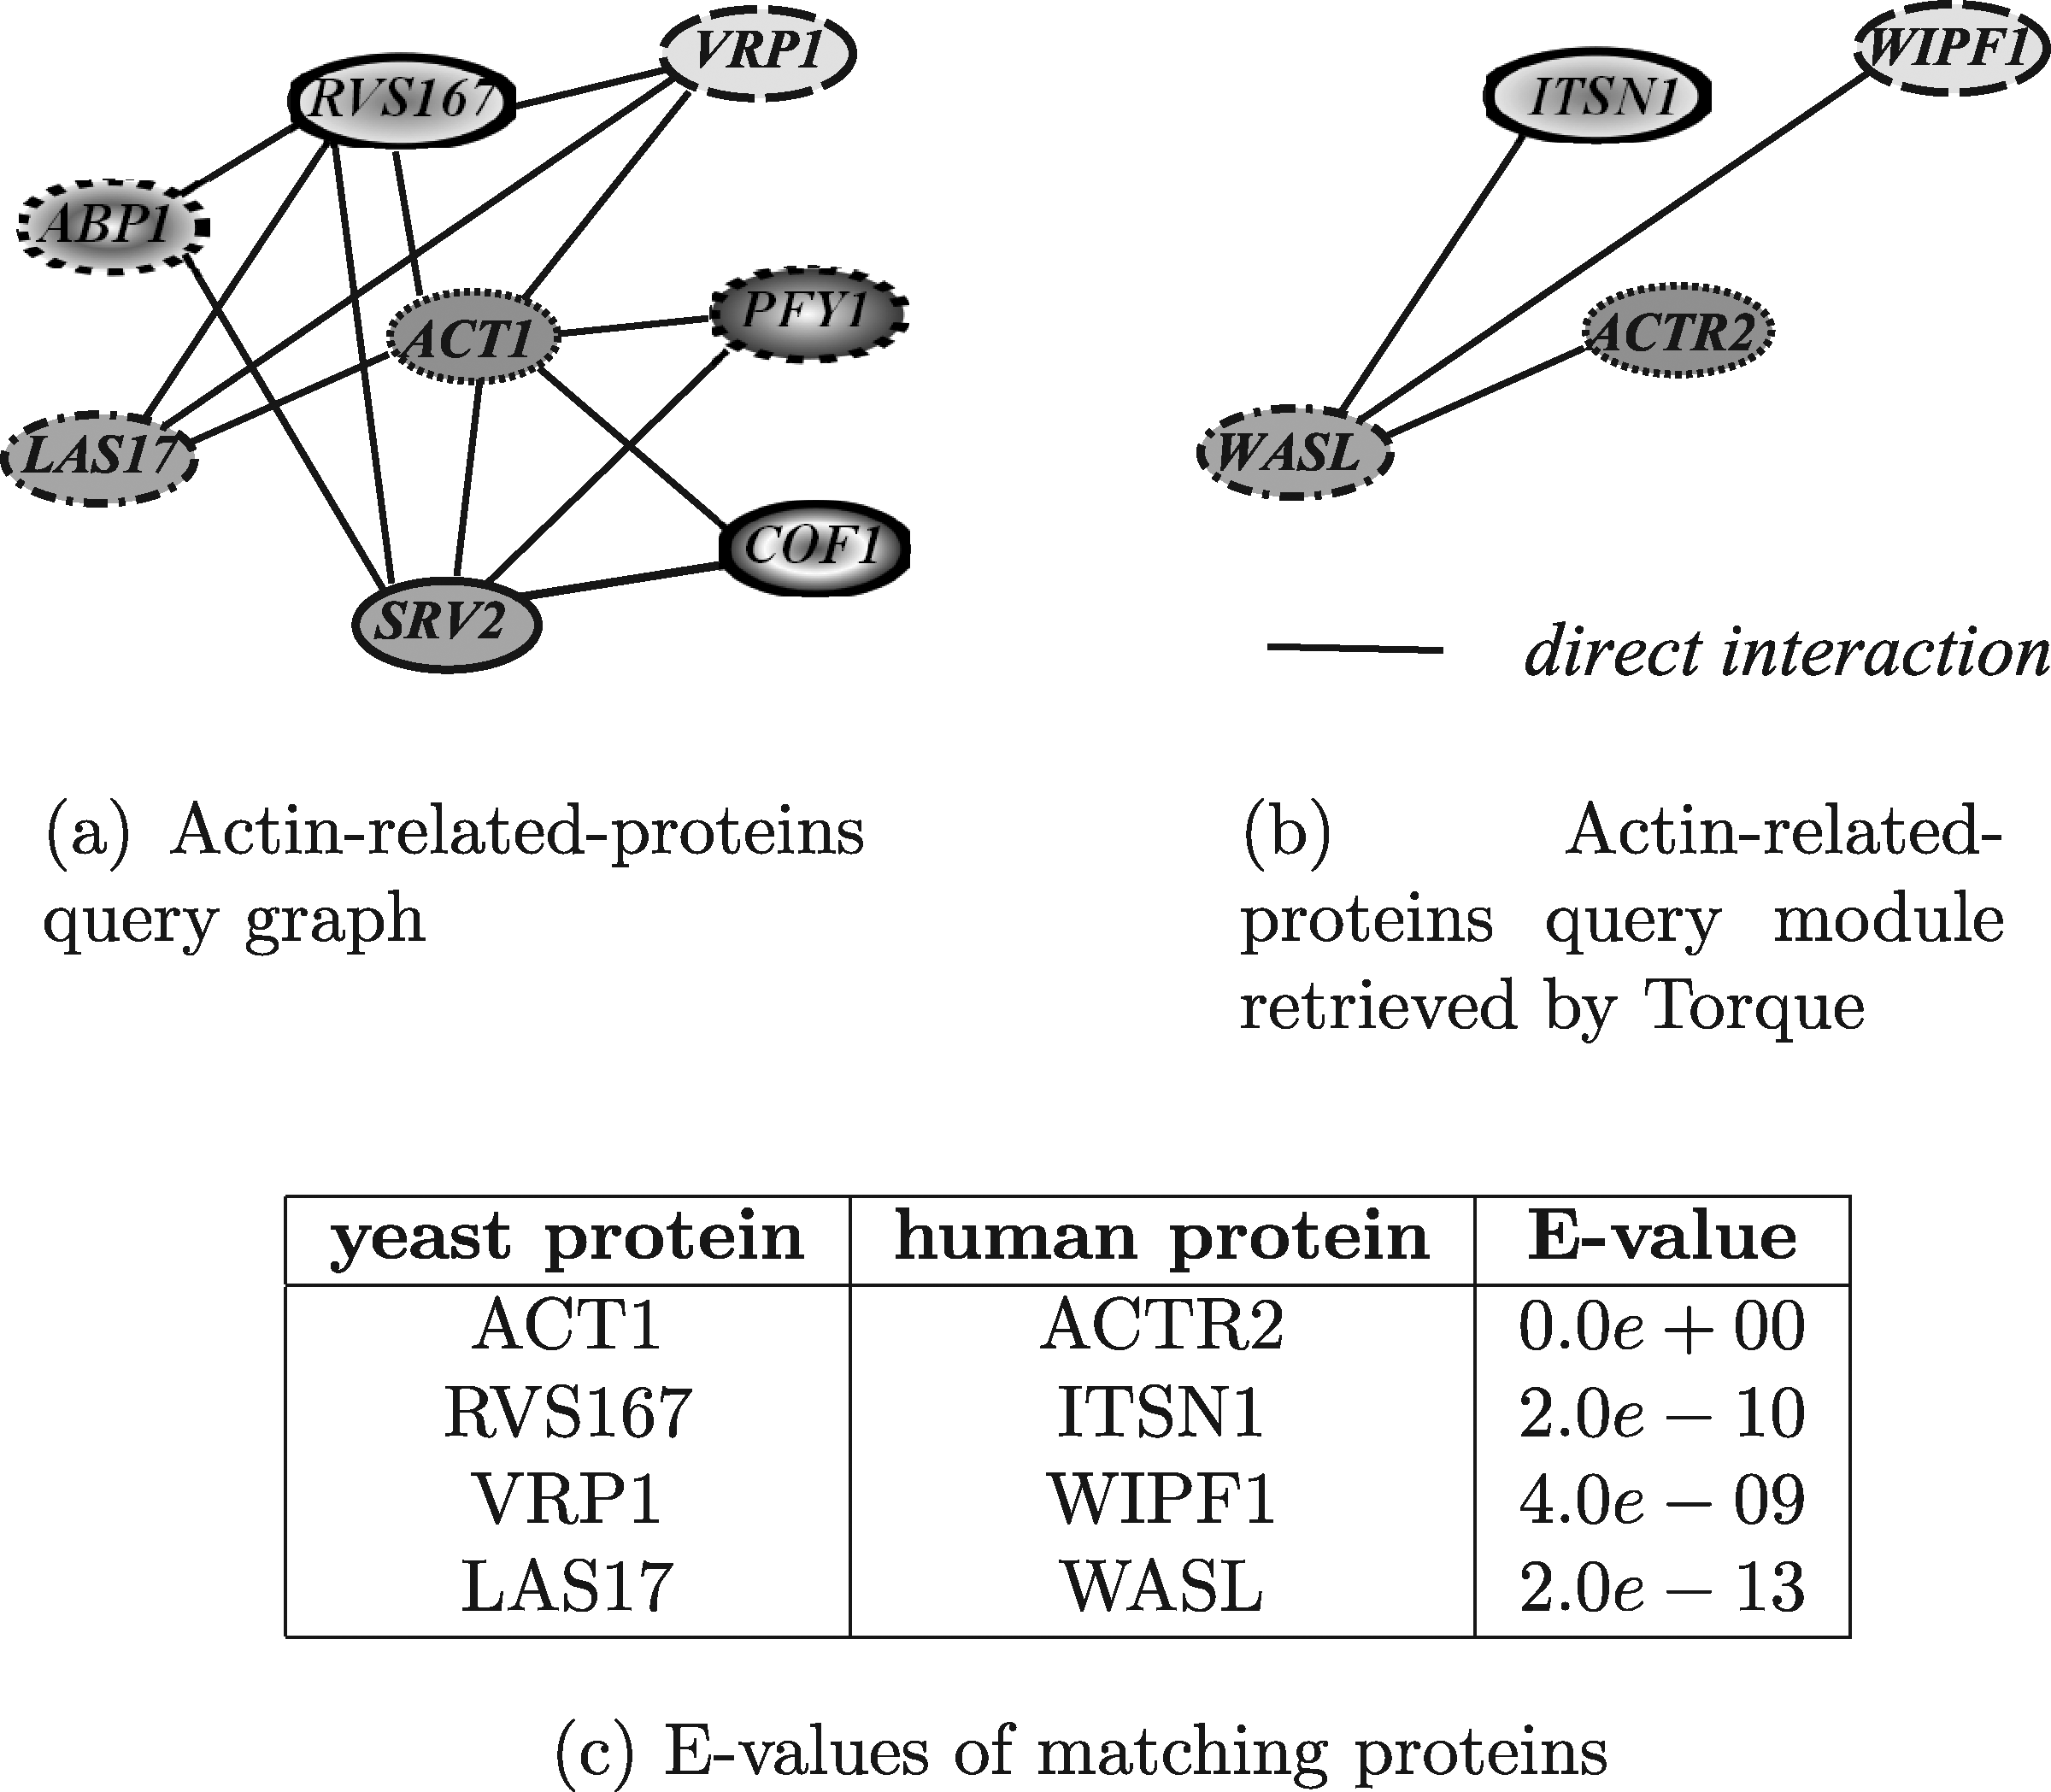
Human actine-related-proteins module retrieved by Torque.
5.2. Metabolic pathway comparison
The tools proposed to query metabolic pathways were compared using two different queries, according to the different types of query structure handled by the various systems. In particular, the comparison of the tools developed to search for query that have some structural restriction (Pinter et al., 2005; Yang and Sze, 2007) is reported in Section 5.2.1, whereas the results obtained using the tools able to handle queries shaped as general graphs (Tian et al., 2007; Yang and Sze, 2007; Wernicke and Rasche, 2007) are reported in Section 5.2.2. It is important to note that the comparison of the results obtained by these tools is not as much informative as the one devoloped for PPI networks (see Section 5.1), due to the fact that some of the approaches proposed to query metabolic networks (Pinter et al., 2005; Tian et al., 2007) use a collection of distinct metabolic pathway as the target network, while others (Yang and Sze, 2007) require in input a unique network. Moreover, PathMatch and GraphMatch (Yang and Sze, 2007) take into account also the information about the similarity between compounds taking part in the reactions, while the other systems exploit only informtion about enzymes. The data used for the evaluation were taken from the KEGG database (Kanehisa and Goto, 2000).
5.2.1. Pathway queries
In this section, we discuss tools that impose some structural restrictions over the query, that are, MetaPathwayHunter (Pinter et al., 2005), which deals with tree-shaped query, and PathMatch (Yang and Sze, 2007), which allows pathway queries. Both systems were tested by using the Homoserine and methionine biosynthesis of E. coli as the query pathway, which is reported in Figure 24. Methionine is an essential amino acid, that is synthesized, in bacteria and plants, from aspartate. The pathway was used for querying the S. cerevisiae.
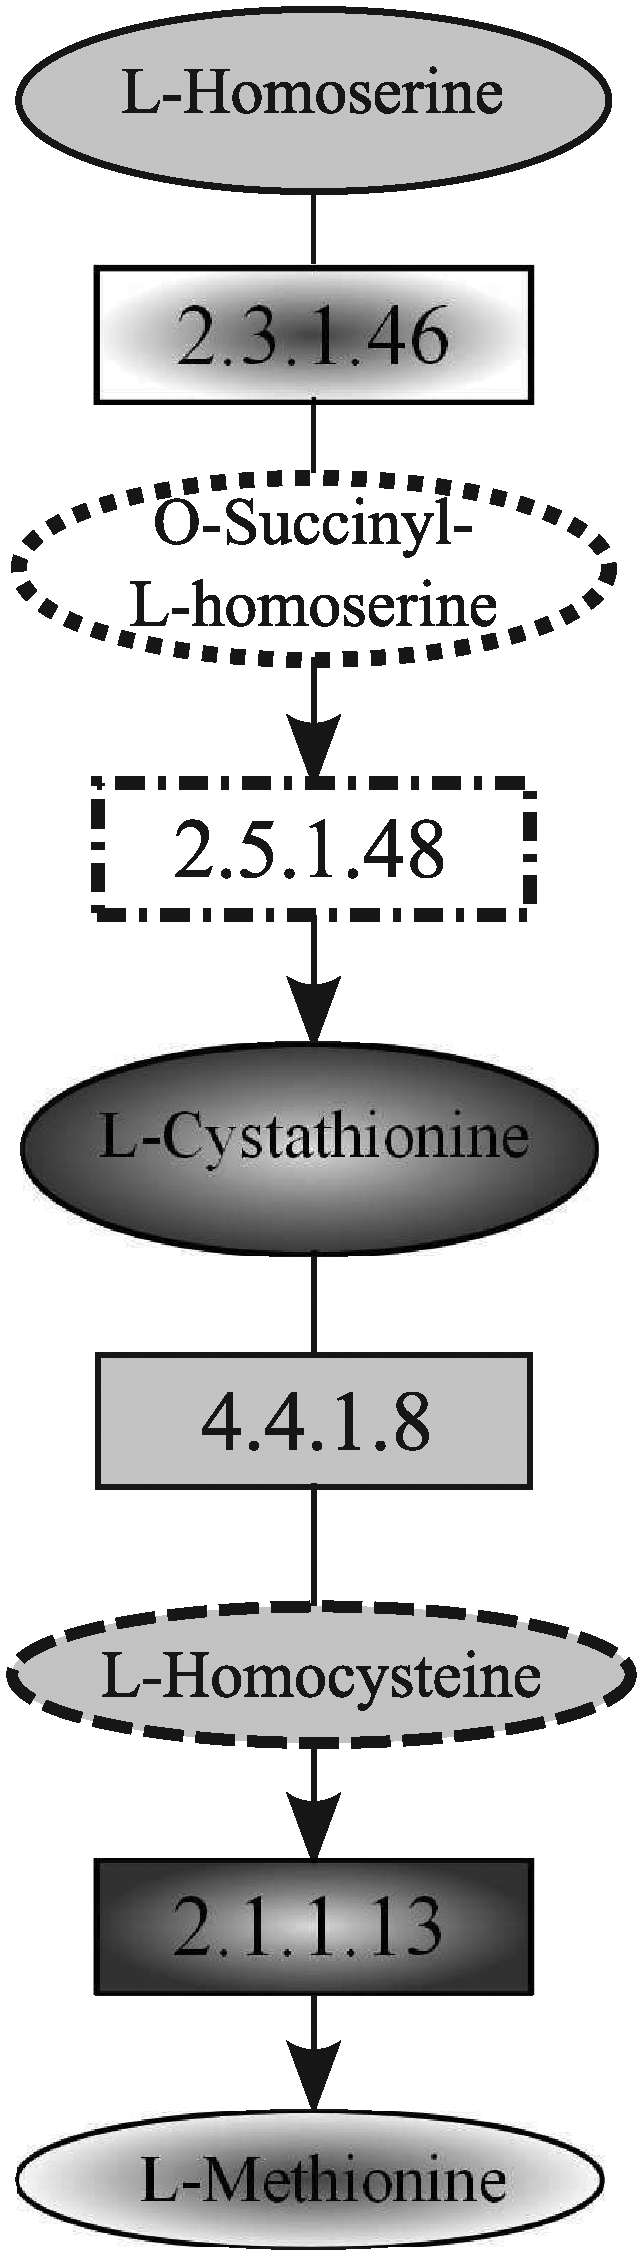
Homoserine and methionine biosynthesis pathway of E. coli used to query the yeast.
Since it was not possible to get a working version of MetaPathwayHunter, we proceed by comparing the results obtained by the authors in their experimantal evaluation, reported in Figure 25, with the best score pathway obtained by PathMatch, shown in Figure 26. As for PathMatch, the target network was built by merging the various yeast pathway stored in the Kegg database. However, since the input data are not exactly the same, in the two cases, it was not anyway possible to carry out a precise comparison of the methods.
Homoserine and methionine biosynthesis pathway of S. cerevisiae retrieved by MetaPathwayHunter.
Homoserine and methionine biosynthesis pathway of S. cerevisiae retrieved by PathMatch.
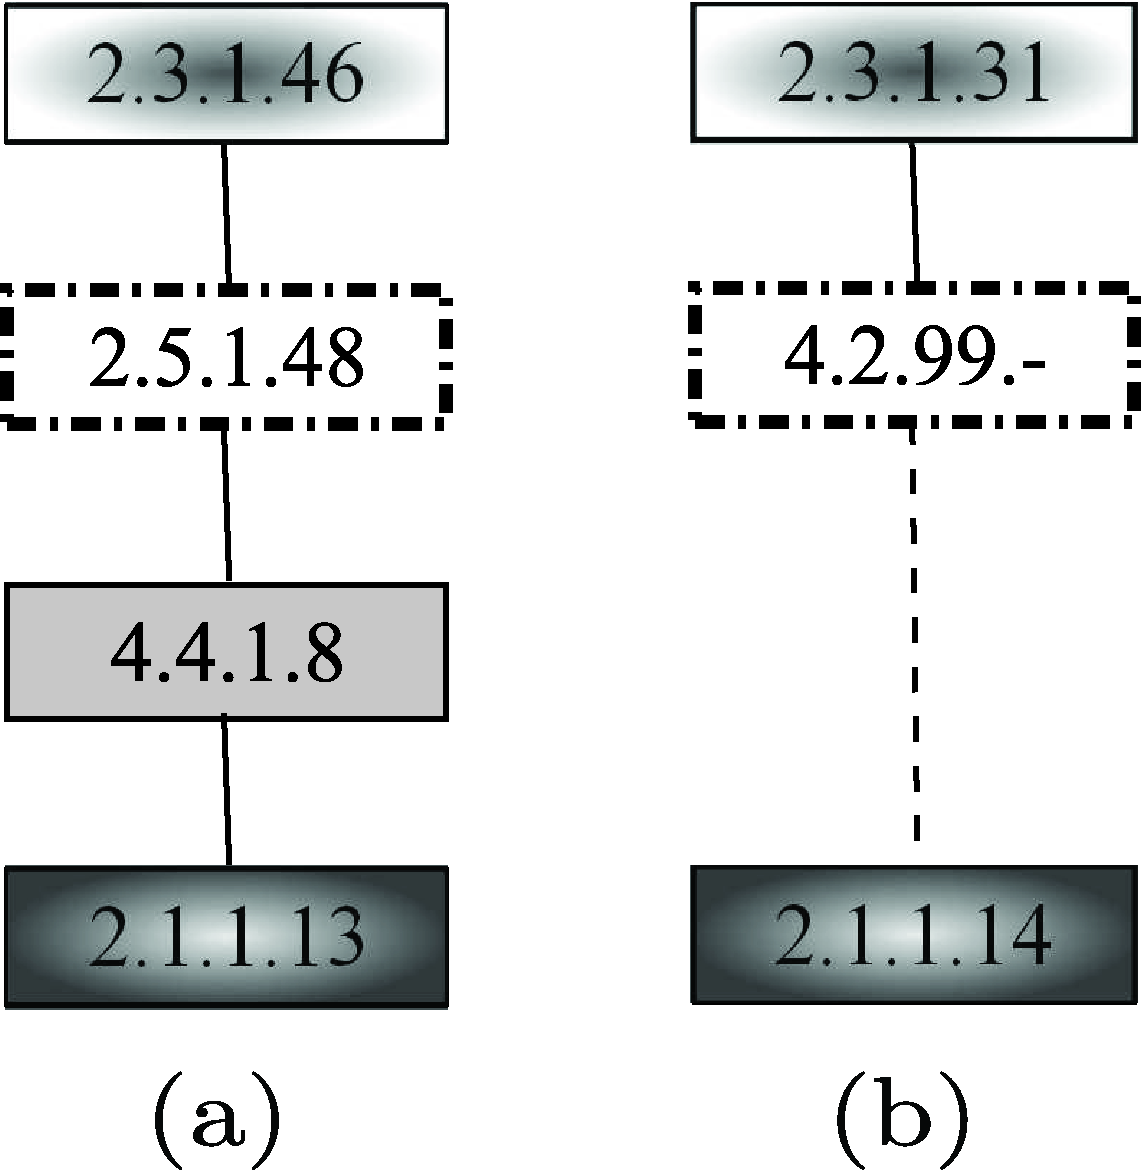
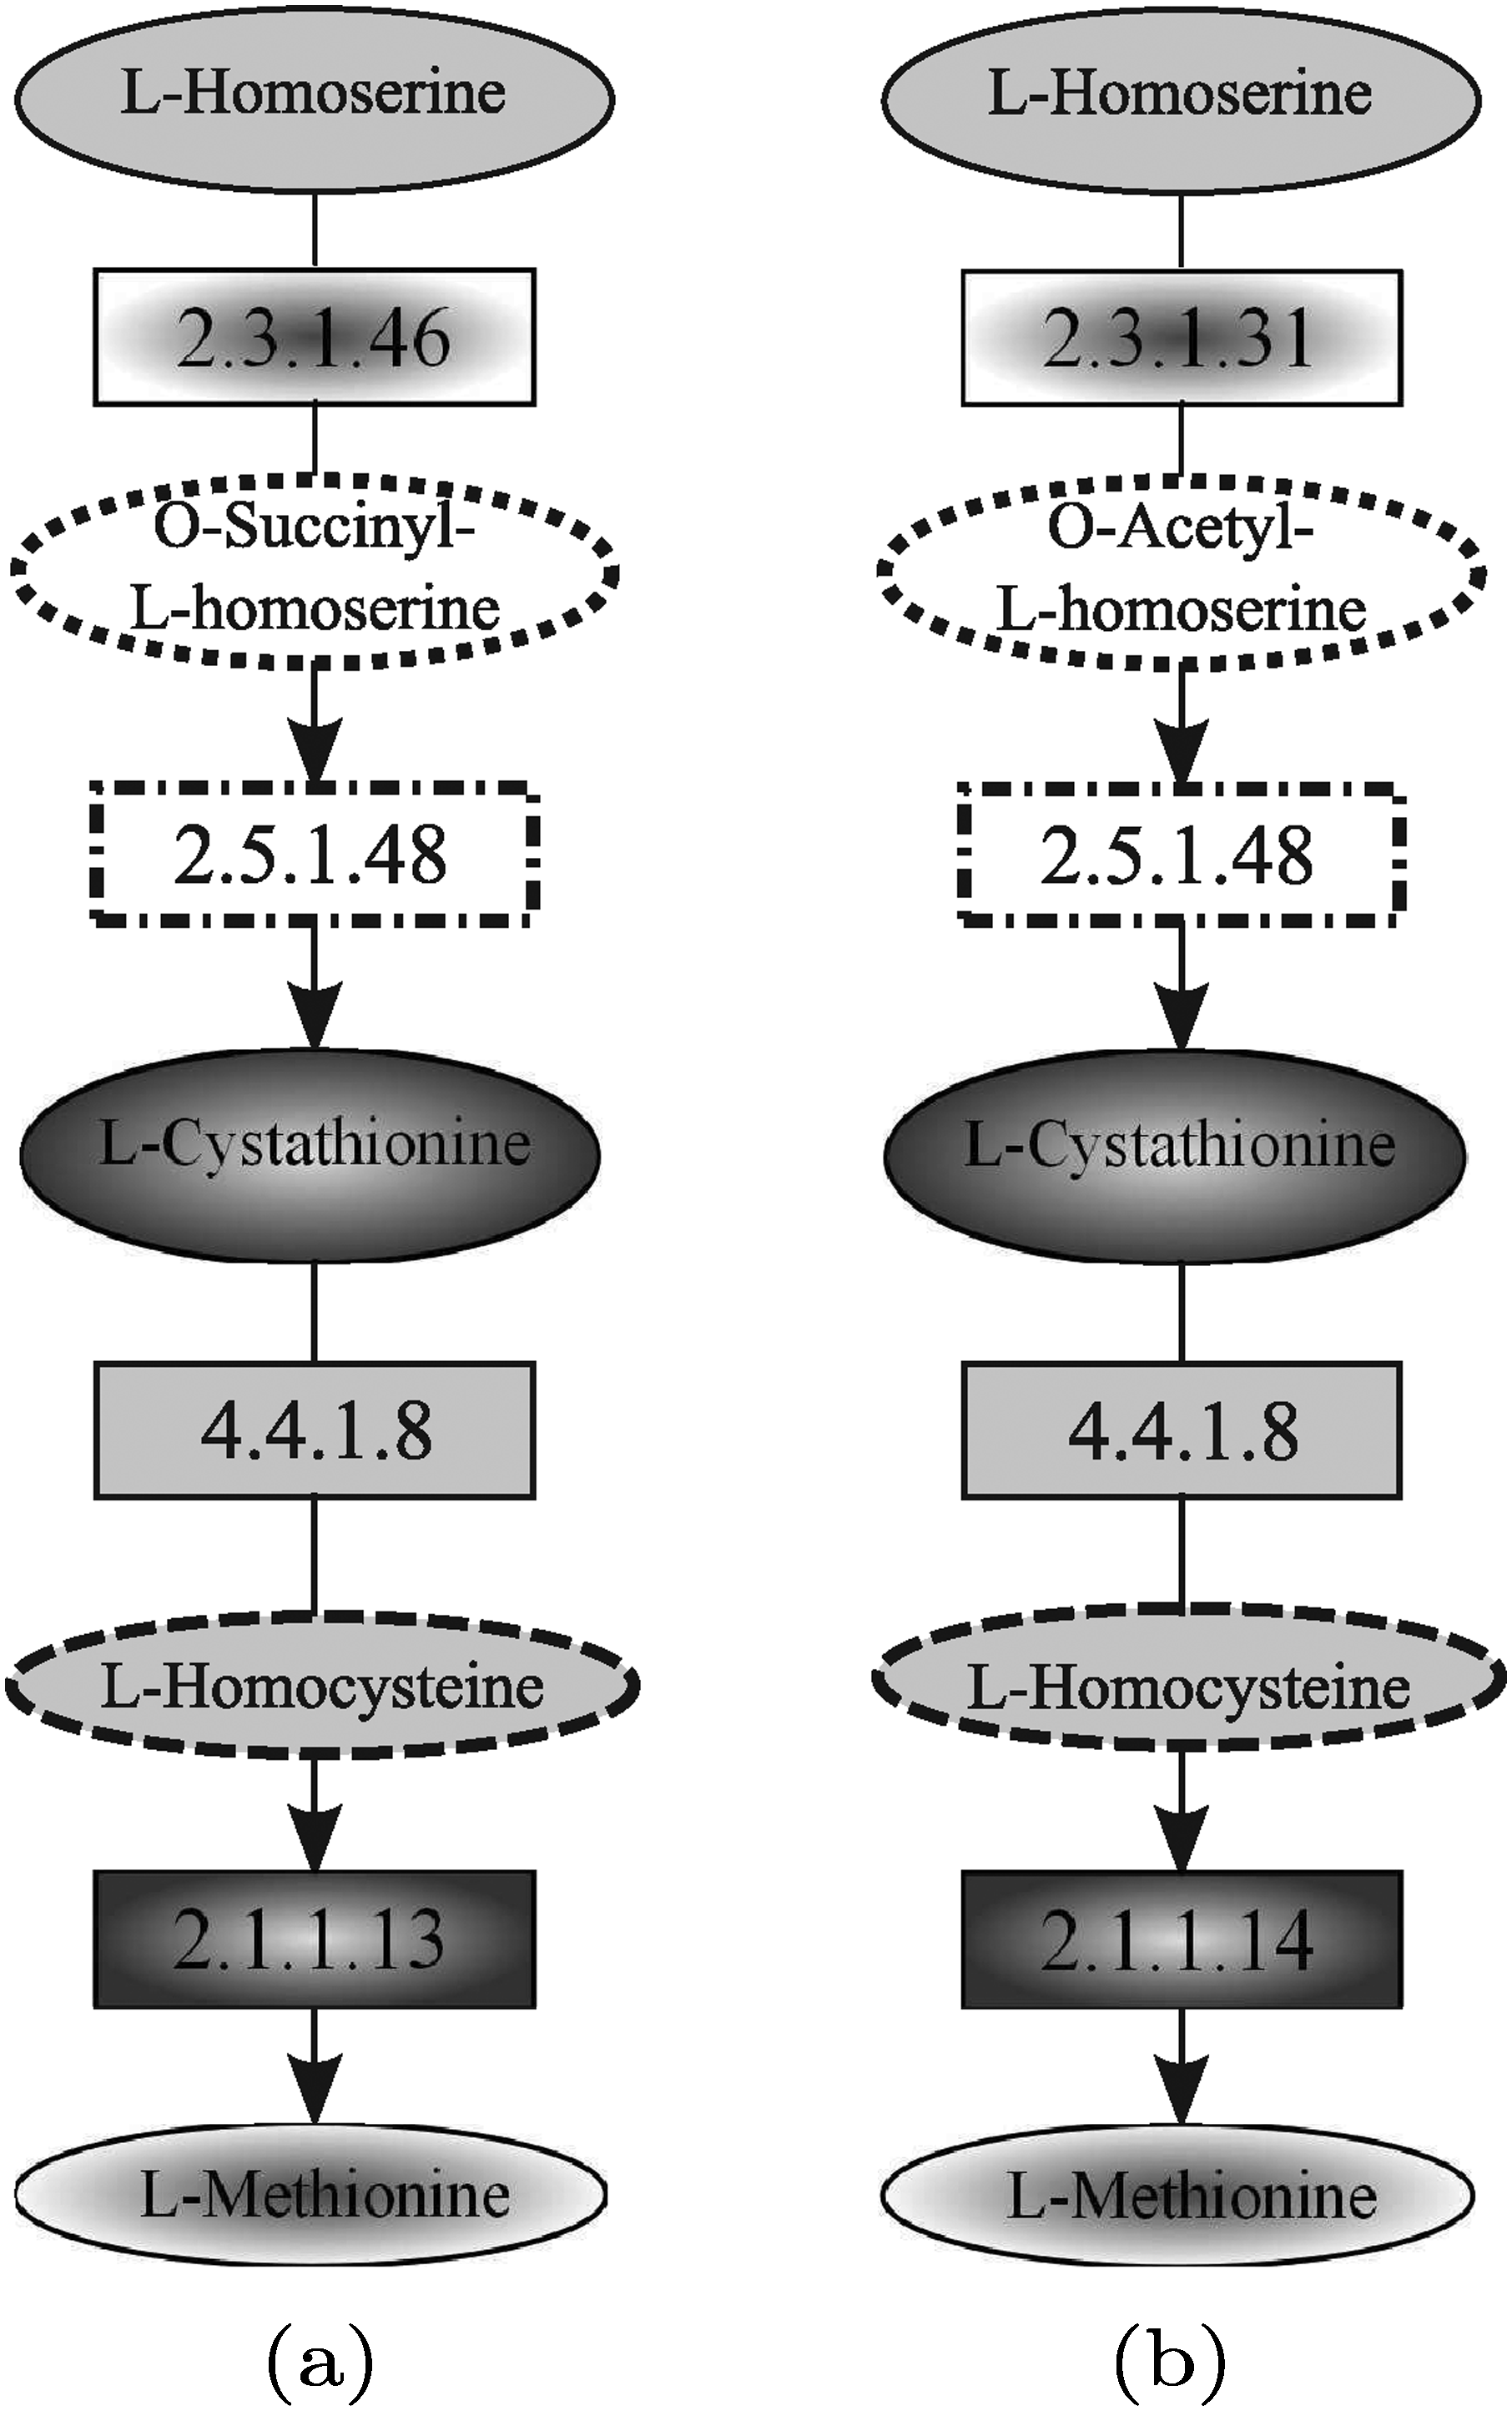
Since MetaPathwayHunter (Pinter et al., 2005) considers only the information about the enzymes that take part in the reactions, the pathway reported in Figure 25a, obtained by deleting compound information from the more complete pathway, was used as the query. The result pathway retrieved by MetaPathwayHunter is shown in Figure 25b. Note that the tool was not able to retrieve the complete yeast pathway since the target network (i.e., yeast homoserine and methionine biosynthesis pathway) provided as the input to MetaPathwayHunter contains only the three enzymes shown in the result. Anyway, the available enzymes were correctly paired. Note that the class of enzymes 4.2.99 is no longer available in the enzyme nomenclature. However, the enzymes 2.5.1.48 and 2.5.1.49, both belonging to the new nomenclature of that class, map the reaction from O-acetyl-
Unlike MetaPathwayHunter, PathMatch (Yang and Sze, 2007) considers also the information about the compounds involved in the reactions. The result pathway retrieved by PathMatch is shown in Figure 26b. The tool was able to retrieve the complete yeast homoserine and methionine biosynthesis pathway, involving the corresponding enzymes and the same compounds of the query, except for the O-succinyl-
5.2.2. General graph queries
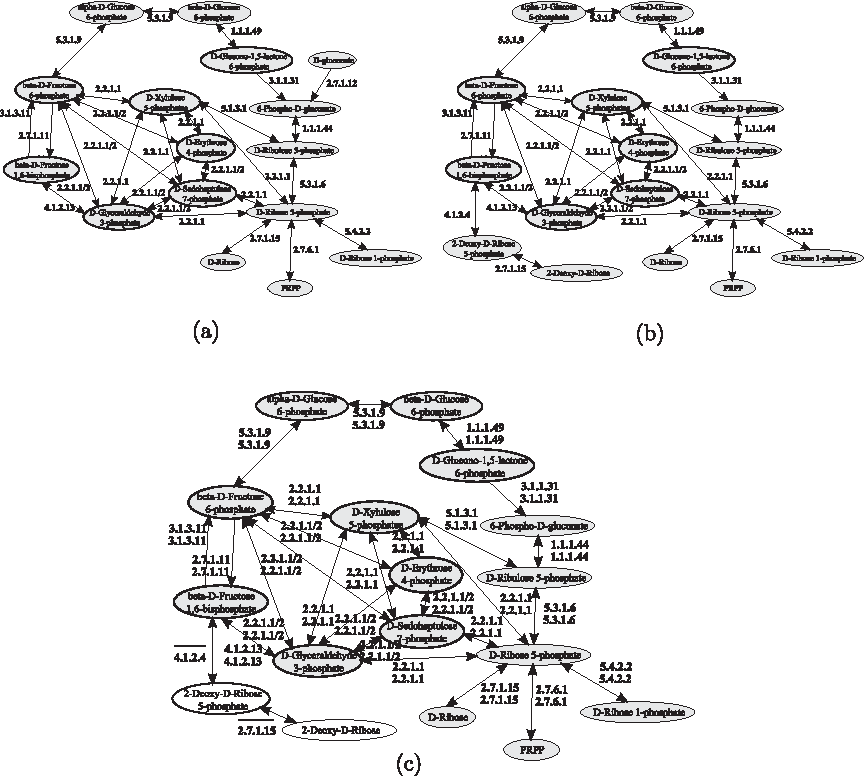
In this section, the results obtained by those analyzed tools that allow query shaped as general graphs (Yang and Sze, 2007; Wernicke and Rasche, 2007; Tian et al., 2007) are discussed. In this respect, it is important to note that, also in this case, tools differs from one another in the information they are able to deal with. Indeed, SAGA (Tian et al., 2007) exploits only information about enzymes while MetaPAT (Wernicke and Rasche, 2007) and GraphMatch (Yang and Sze, 2007) considers also compounds. The query used in the comparison is the pentose phosphate pathway of the yeast, reported in Figure 27a and the target network is the pentose phosphate pathway of the human, reported in Figure 27b. The pentose phosphate pathway is a process that produces NADPH and pentoses (5-carbon sugars). The pathway includes two distinct phases. One is the irreversible oxidative phase, in which NADPH is generated, by converting glucose-6P to ribulose-5P. The other is the reversible non-oxidative synthesis of 5-carbon sugars (i.e., xylulose-5P, ribulose-5P, and ribose-5P).
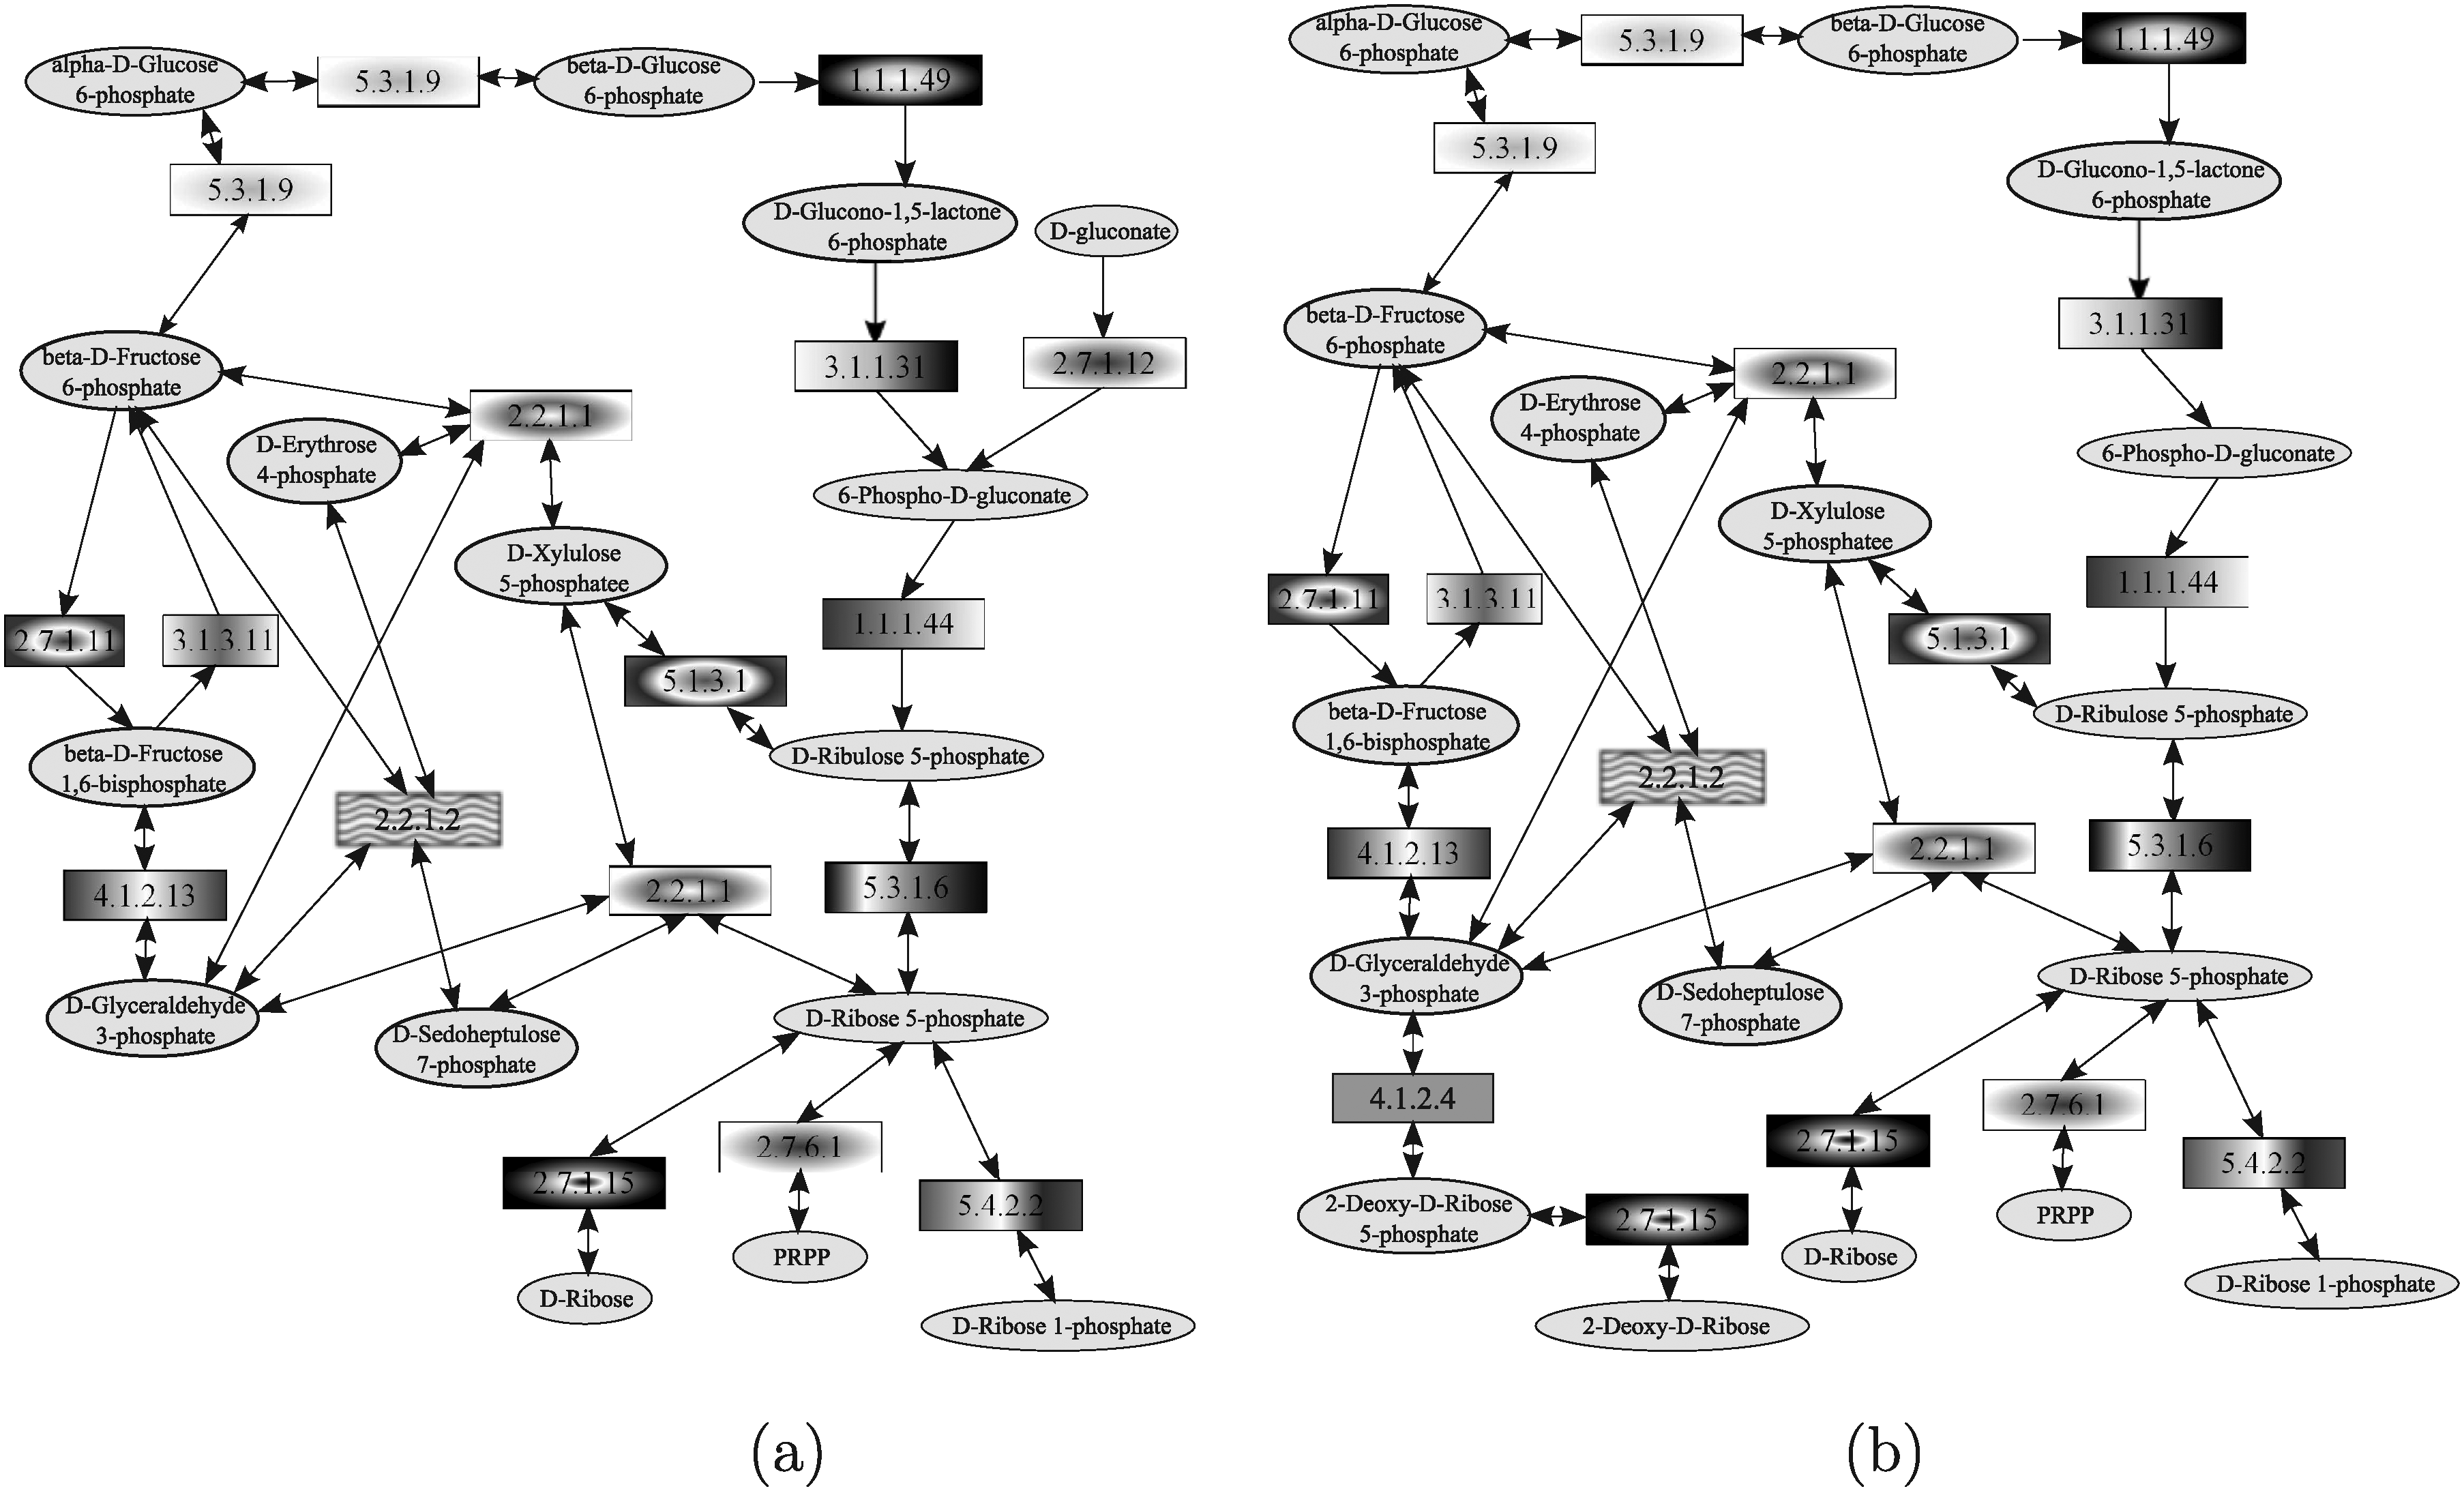
Pentose phosphate pathways of yeast (used as query)
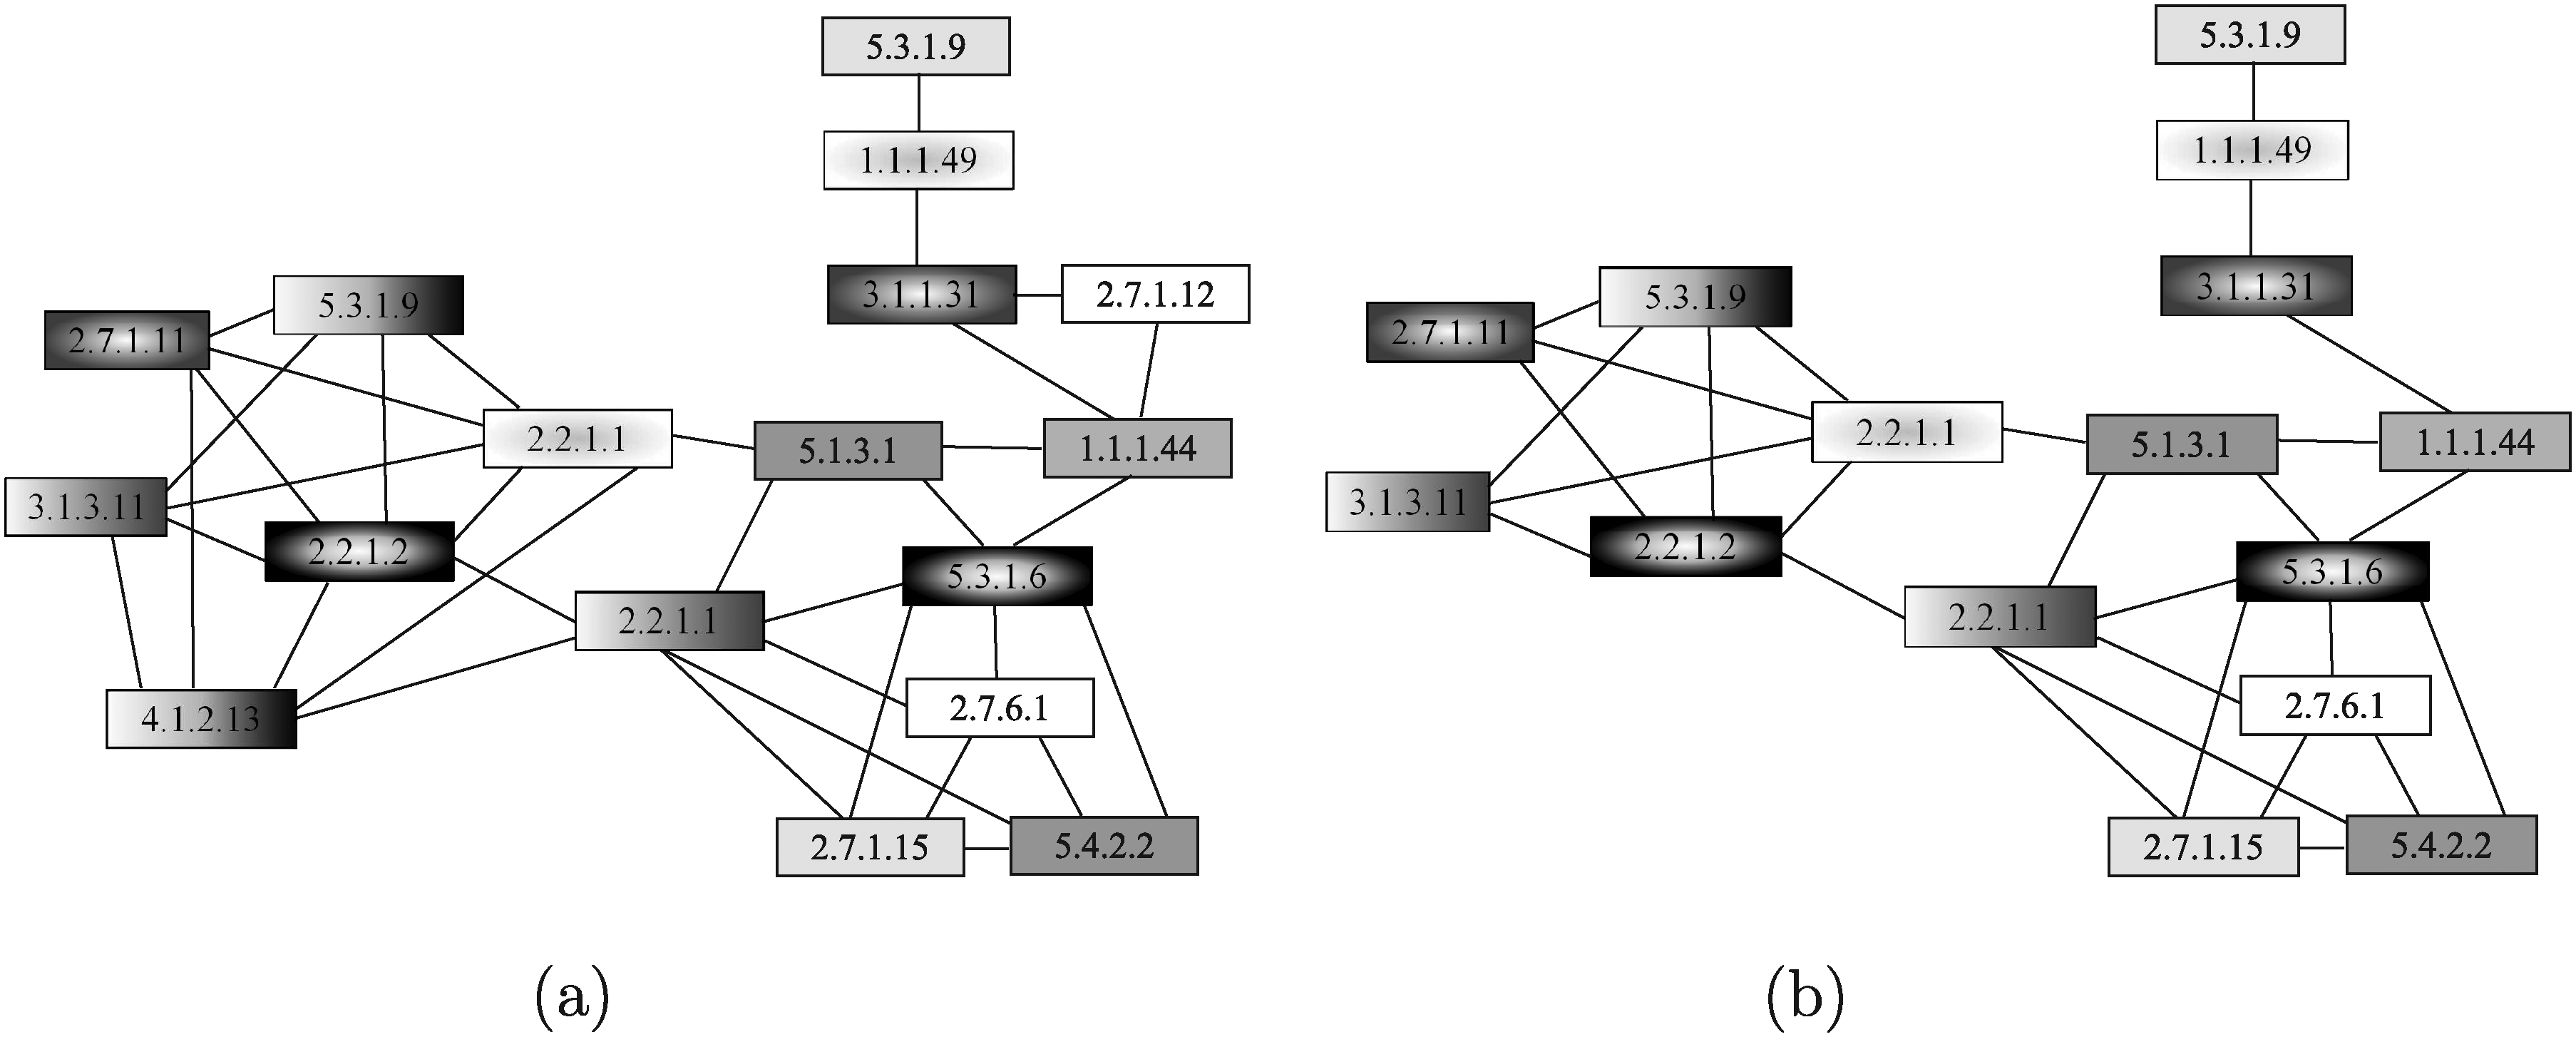
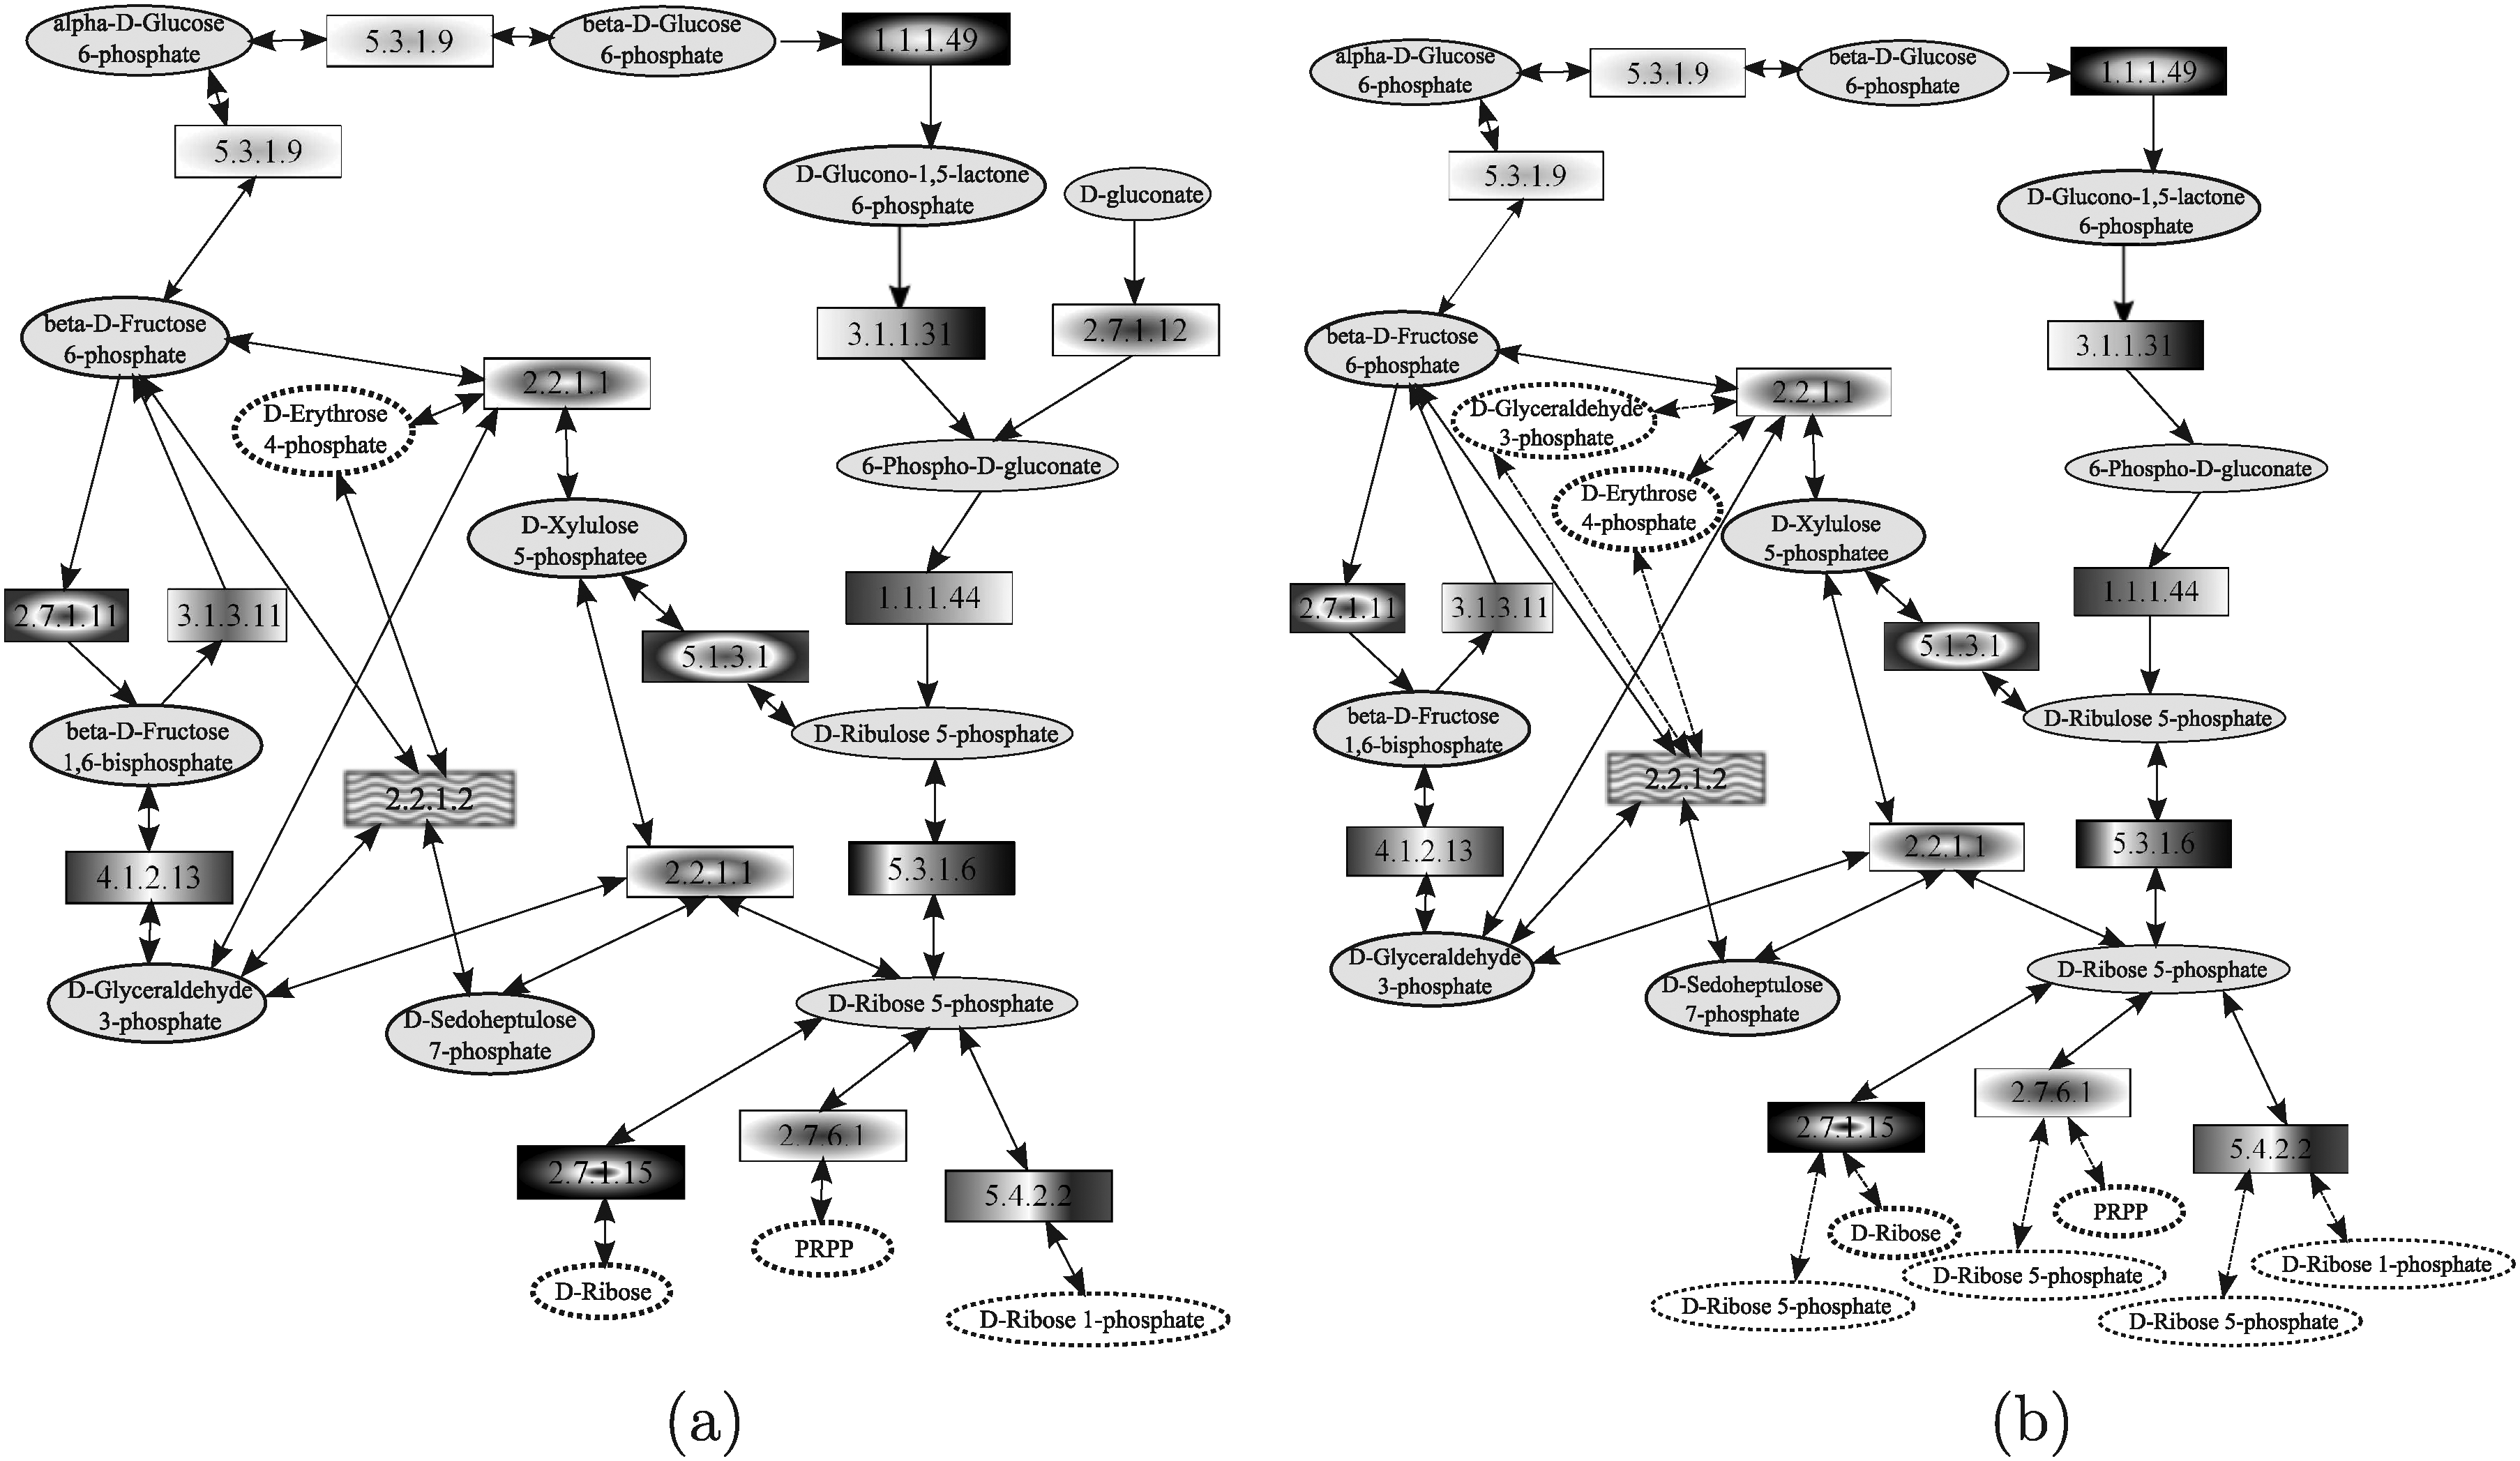
Since SAGA does not take into account the compounds involved in the reactions, the graph reported in Figure 28a was used as the query. This query graph was obtained by running the script, downloaded from SAGA website (http://saga.ncibi.org/saga_translate.html), translating the KEGG KGML format to the SAGA format. Figure 28b shows the result obtained by running SAGA. Nodes in the same position, having the same filling, represent a matching pair. SAGA was able to correctly match 15 out of 17 query nodes. The enzyme 2.7.1.12 was correctly left unmatched since there is no a corresponding enzyme in the human pentose phosphate pathway. However, enzyme 4.1.2.13 was incorrectly left unmatched. Indeed, the predefined data used by SAGA do not contain the 4.1.2.13 human enzyme homologous to the yeast one, even if there is an enzyme in the human pathway catalyzing the same reaction. The running time was in the order of few seconds.
Pentose phosphate pathways of yeast used as query
MetaPAT models metabolic pathways by a graph in which nodes represent compound and edges are labeled by using the EC numbers of enzymes catalyzing the reactions. Thus, MetaPAT was run on the query and the target networks represented in Figure 29a, b, respectively, but, in this case, it was not able to retrieve any matching sub-graph. Therefore, the node representing D-gluconate and the edge labeled by the enzyme 2.7.1.12 were deleted and, in this case, MetaPAT was able to correctly match the corresponding compounds and reactions in the two input networks, as shown in Figure 29c. The running time was in the order of few seconds.
Pentose phosphate pathways of yeast used as query
GraphMatch (Yang and Sze, 2007) considers both compounds and enzymes, that are represented by graph nodes. The query graph used in the evaluation is reported in Figure 30a, and the top-scoring results retrieved by GraphMatch are shown in Figure 30b. Note that, to compute compound similarity scores, we followed the line suggested by Yang and Sze and exploited the SimComp tool (Hattori et al., 2003) by imposing a score cutoff for compound matches. GraphMatch was able to correctly retrieve the pentose phosphate human pathway, even if some compound pairs (i.e.,
Pentose phosphate pathways of yeast used as query
6. Discussion
In this article, a comparative survey of the methods developed to query biological networks has been carried out. As implied by the previous descriptions and comparisons, those techniques are rather different from one another.
On the one hand, from a computational point of view, there are methods that, due to the adoption of exact algorithms (e.g., GraphMatch (Yang and Sze, 2007)), or because they handle generic graph queries (such as NetMatch (Ferro et al., 2007)), result in rather “theoretical” high time complexity. Improvements in execution times can be obtained by exploiting heuristic algorithms (e.g., Fionda (Fionda et al., 2008)), by restricting query structure (e.g., as done in PathMatch (Yang and Sze, 2007)), or by only allowing few types of approximations in the result sub-graphs (e.g., in MetaPathwayHunter (Pinter et al., 2005)).
On the other hand, from a biological point of view, all the tools are on the average capable to find biologically significant results even if some tools outperforms the others. Among the tools proposed to deal with protein-protein interaction networks using pathway queries, PathMatch (Yang and Sze, 2007) is the most promising one. Indeed, despite the long running time, it proves able to retrieve the most significant results. Among the tools that deals with general graphs, Fionda (Fionda et al., 2008) and GraphMatch (Yang and Sze, 2007) seem to outperform the others. However, differently from Fionda, GraphMatch needs to know a priori the number of allowed node insertions. Also, it forced, in the studied example (see Section 5.1.2), the matching of all the proteins in the query, even if some proteins did not have any homologous in the target network. Moreover, even though GraphMatch exploits an exact matching algorithms, and, thus, despite the corresponding “theoretical” high time complexity (exponential running time), it practically runs in a reasonable time. Indeed, its running time was much more lower than several heuristic techniques (e.g., QNet(Dost et al., 2008) and Torque (Bruckner et al., 2009)).
As for the tools proposed to deal with metabolic networks, the comparison is more difficult to carry out since the tools use different representations of input data. Surely, PathMatch and GraphMatch (Yang and Sze, 2007) appears to be interesting and useful tools, as they are able to take into account both compound and enzyme information retrieving, at the same time, relevant biological results.
To conclude, it is sensible to take a look at the application domains in order to single out the best method to use.
In this respect, for pathway queries, the best choices are PathMatch (Yang and Sze, 2007) and Qian (Qian et al., 2009), which are able to deal with node mismatches, insertions and deletions and have the lowest time complexity among the considered systems (linear time complexity in target and query network size).
For queries shaped as general graphs, the best tools appear to be Fionda (Fionda et al., 2008) and GraphMatch (Yang and Sze, 2007). Fionda has the advantage of exploiting a heuristic technique that keeps the time complexity low, while at the same time considering both node insertions and node deletions, without fixing any a priori bound. GraphMatch, on its turn, by exploiting an exact search algorithm, guarantees to find the best solution according to the adopted scoring schema, while maintaining, in the analyzed practical cases, short running times.
Finally, Torque (Bruckner et al., 2009) proves itself to be quite innovative for it opening an appealing view on the topology-free querying issue.
As a general trend, most of the tools do not yet exploit the entire set of available biological additional information (e.g., GO terms or interaction reliability coefficients) that might improve the quality of the returned result. Besides, most of them do not take into account all possible biological diversities (e.g., approximations in resulting sub-graphs) that might permit to obtain more accurate results.
Despite those limitations, the results obtained so far are definitely promising and the efforts within this research area have been steadily increasing in the last few years. As such, this area appears as an interesting research domain in the quest towards improving the knowledge about biological data and mechanisms at the basis of life processes.
Footnotes
Disclosure Statement
No competing financial interests exist.