
Abstract
Abstract
Recent advances in the automation of metabolic model reconstruction have led to the availability of draft-quality metabolic models (predicted reaction complements) for multiple bacterial species. These reaction complements can be considered as trait representations and can be used for ancestral state reconstruction to infer the most likely metabolic complements of common ancestors of all bacteria with generated metabolic models. We present here an ancestral state reconstruction for 141 extant bacteria and analyze the reaction gains and losses for these bacteria with respect to their lifestyles and pathogenic nature. A simulated annealing approach is used to look at coordinated metabolic gains and losses in two bacteria. The main losses of Onion yellows phytoplasma OY-M, an obligate intracellular pathogen, are shown (as expected) to be in cell wall biosynthesis. The metabolic gains made by Clostridium difficile CD196 in adapting to its current habitat in the human colon is also analyzed. Our analysis shows that the capability to utilize N-Acetyl-neuraminic acid as a carbon source has been gained, rather than having been present in the Clostridium ancestor, as has the capability to synthesize phthiocerol dimycocerosate, which could potentially aid the evasion of the host immune response. We have shown that the availability of large numbers of metabolic models, along with conventional approaches, has enabled a systematic method to analyze metabolic evolution in the bacterial domain.
1. Introduction
Bacteria not only evolve through vertical inheritance but also through horizontal gene transfer (HGT). Often HGT can provide metabolic genes (Pál et al., 2005; Yagi et al., 2009), and potentially antibiotic resistance and toxin-encoding genes (Petridis et al., 2006) to bacteria. On the other hand, evolution through gene loss can occur in some environments (Zomorodipour and Andersson, 1999). These processes directly involve gene losses and gains, but it is not the genes themselves that are of most interest, but their function and how they interrelate with the functions of all other genes in the system.
Evolution is often studied through ancestral state reconstruction (ASR) for various biological traits (Schluter et al., 1997; Latysheva et al., 2012). ASR relies on biological trait information from extant organisms to infer trait occurrence in the common ancestors of those organisms. This information can be provided in the form of a character matrix for the characteristics under investigation. Depending on the context, a parsimony or maximum likelihood approach can be used on a phylogenetic tree to obtain the probabilities of different ancestral nodes possessing the considered traits. This approach has been taken in looking at gene families in the metabolic context (Merhej et al., 2009), and metabolic reaction occurrences have been compared according to inferred metabolic models for a small set of 16 E. coli strains to investigate the evolution of these strains (Baumler et al., 2011).
Previously genomic comparisons have been done using information from the WIT (‘what is there’) database, examining differences between the metabolic pathway complements of various extant organisms (Liao et al., 2002). Additionally, phylogenetic profiles have been inferred based on enzyme evolutionary predictions (Whitaker et al., 2009) to establish the ancestral relationships between a large number of prokaryotes and eukaryotes.
With the advent of automatic methods for bacterial metabolic model reconstruction—such as the Model SEED pipeline (Henry et al., 2010)—it is possible for the first time to establish direct reaction complements for any bacterium for which there is a complete genome sequence. Data from these draft-quality automatically generated metabolic models can be used as the input to ASR, since these models make direct assertions about which reactions are present and absent in each bacterium. Consequently, it is possible to infer ancestral metabolic complements directly and to investigate the precise metabolic changes accumulated by bacteria in the evolution toward their current lifestyles and ecological niches at the system level. This improves on previous approaches by being reaction-specific, rather than at a pathway level. Also, information about specific reactions can be made based on enhanced inferences (achieved through the Model SEED pipeline) about reaction presence and absence, not just based on direct observation of annotated enzymes.
Here we present an ancestral state reconstruction of the metabolic reactions inferred to be present in 141 bacteria by the Model SEED server. A hierarchical clustering was used to establish the metabolic similarity of these 141 bacteria, and this was compared to the 23S rRNA phylogenetic tree inferred for these same bacteria. Further we related this clustering to the lifestyles of the bacteria according to three categorizations—habitat, respiratory mode, and pathogenic mode—and showed that each of these categorizations encapsulates information about how the evolution of these bacteria has proceeded.
Results for the gain and loss of reactions for each of the extant bacteria have been produced using the metabolic networks inferred for the common ancestors of these bacteria, and for two cases these gains and losses have been investigated at the system level to look for coordinated sets of reactions (those reactions adjacent in the metabolic networks inferred from their respective metabolic models) that have been lost (in the case of an obligate intracellular pathogen) and gained (in the case of a free-living pathogen). This has been achieved by using an approach based on active modules (Ideker et al., 2002) called ambient, which finds connected subnetworks in the bipartite network of reactions and metabolites associated with strong evidence for reaction gain or loss for both these bacteria (Bryant et al., 2013). In fact, ambient has picked out several reaction pathways in C. difficile CD196 that would not be seen by gene-based analysis (since several of the reactions have no gene association) but are clearly found by taking advantage of the generated metabolic model used here.
2. Methods
2.1. 23S rRNA phylogeny construction
From the NCBI Nucleotide Database, 23S rRNA sequences were obtained for all 141 organisms in the current analysis along with an out-group organism (Thermoplasma acidophilum). Multiple sequence alignment of the 23S rRNA sequences of these organisms was obtained using MAFFT (Katoh et al., 2009). A threshold score of E = 8.4e − 11 was used (the default threshold value used by MAFFT).
Based on the results of multiple sequence alignment, a phylogeny was constructed using PhyML 2.4.4 (Guindon et al., 2010). Bootstrapping was performed 100 times on the tree to obtain the most likely phylogeny. After rooting the tree, the out-group was removed. For visualization of the phylogeny obtained and for the creation of phylogeny images Dendroscope was used (Huson et al., 2007). The phylogeny can be seen in Supplementary Figure 1 (Supplementary Data available online at www.liebertonline.com/cmb).
2.2. Comparison of reaction numbers and lifestyle
Three lifestyle classifications were used to assess how they related to the evolutionary histories of the bacteria in this study. The classifications are named i) habitat, indicating the usual environment the bacteria experience; ii) respiratory mode, indicating their ability to tolerate oxygen; and iii) pathogenic mode, each bacterium falling into one of four categories: free-living, facultative host-associated, obligate intracellular mutualists, and obligate intracellular pathogens. These classifications were taken from work by Zientz et al. (2004) and Merhej et al. (2009). It should be noted that although the last classification is termed “pathogenic mode,” this is just an alternative classification of habitat based on the types of environment experienced by bacteria in their eukaryotic hosts.
A Mann Whitney U test was conducted between each category for each classification to establish correlations between reaction numbers and lifestyles. The Benjamini–Hochberg multiple testing correction was used to control for false positives, and the corrected p-values were used to establish significance.
2.3. Ancestral state reconstruction
For ancestral state reconstruction (ASR), Mesquite was used (Maddison and Maddison, 2011). The ancestral state reconstruction algorithm, as implemented in Mesquite, looks for ancestral states that maximize the probability of the observed characteristics in extant organisms.
Maximum likelihood reconstruction methods look for ancestor states that maximize the probability of producing the current state, having evolved under a defined model of evolution (Pagel, 1999; Schluter et al., 1997). It is equivalent to the marginal reconstruction method as implemented in PAUP (Swofford, 2003). Every reaction was classified as present or absent according to the Model SEED metabolic model creation server (Henry et al., 2010). The asymmetrical Markov k-state 2 parameter model (AsymmMK model) in Mesquite was chosen because it allows different rates for reaction gains and losses. In the ASR, the out-group organism was removed from the phylogeny, and the reaction traits for the out-group were not specified in the character matrix.
A boolean character matrix was created for all the 2526 metabolic reactions that were present in at least one of the bacteria under investigation. Maximum likelihood ASR was performed for this categorical, discrete dataset of reactions. Values for the probability (
2.4. Correlation between dendrograms and lifestyle classifications
Two dendrograms were obtained from the 23S rRNA alignment and the metabolic traits comparison. The cutree package in R was used to examine every possible clustering of each dendrogram, and the maximum adjusted Rand index (ARI) (Hubert and Arabie, 1985) from all possible clusterings was obtained for each dendrogram against the three classifications in this analysis: habitat, respiratory mode, and pathogenic mode. Adjusted Rand index measures the similarity of different partitions of a set; in this case the partitions are the three classifications and the set is all bacteria under consideration.
2.5. Inference of gains and losses in extant bacteria
Each branch in the phylogeny connects two nodes. One node is the parent (ancestor) node and the other node is the child (descendant) node. In order to assess the gain and loss of reactions from an ancestor to its descendant, δPj values were calculated according to the following formula:
where
There are a total of 140 internal (parent) nodes in the phylogeny. Each node gives rise to 2 branches, giving a total of 280 branches. δP j values were calculated for all the reactions on all of the branches. Thus, there are a total of 707,280 δP j values (280 × 2526) for the entire phylogeny.
A δP cutoff of ± 0.9 was used to define those reactions gained or lost. Using this threshold δP value, ancestral state reconstruction predicted a total of 10,396 gain and loss events. δP ≤ −0.9 (loss) had 5001 events and δP ≥ +0.9 (gain) had 5395 events.
2.6. Metabolic traits hierarchical clustering
The construction of a metabolic trait-based hierarchical clustering was done using the Pars program in the PHYLIP package (Felsenstein, 2013). Each reaction present in at least one, but less than 141, of the bacteria under investigation was used as a metabolic trait, as for the ASR. The Pars program produced a total of 12 trees from which a consensus tree was obtained using the CONSENSE program in the PHYLIP package.
2.7. Analysis of coordinated metabolic changes
Ambient (Bryant et al., 2013) was used to run simulated annealing on a bipartite metabolic network of reactions and metabolites to find coordinated gains and losses of metabolic pathways throughout the evolutionary history of the 141 bacteria (since their last common ancestor). The metabolic network used for all bacteria was the complete “meta-” metabolic network consisting of the union of the networks of all 141 bacteria used in this article. Using the meta-metabolic network allows both gains and losses of metabolic function to be seen for each bacterium.
Since changes in probability of gain and loss were recorded along each branch of the phylogeny between two nodes (including internal nodes) and ancestral state reconstruction was performed for those nodes, pathway gains and losses can be traced through the phylogenetic tree and metabolic evolution could be inferred between these ancestral states.
Ambient uses scores for each reaction and metabolite in its attempt to find connected network components encompassing multiple highly gained or lost adjacent reactions. In this case the scores for reactions were taken from δP values for each branch of the phylogenetic tree. Metabolites were scored using the default ambient scoring method—with a penalty equal to their connectivity in the metabolic network—to select against currency metabolites.
Ambient was run with the following nondefault parameters: maximum number of modules tracked (−M) set to 100, maximum number of steps (−N) set to 2,500,000, temperature gradient (−U) to 0.95, initial temperature factor (−T) to 3, reaction score offset (−Y) to −0.15, and number of steps between equilibrium tests (−i) to 6000.
Sets of modules found by ambient for each branch were compared to look for metabolic pathways that are coherently lost or gained multiple times in the evolutionary history of these bacteria. Each module in each branch was compared to each module in every other branch using F-measure. A simple network was created in which each module found was a node and each pair of nodes was connected if that pair had an F-score of greater than 0.85. Connected components of this network were then extracted to show the closely related modules that were seen multiple times as either gains or losses.
For each connected component in this simple network, the bacteria corresponding to each node were extracted, and the union of the modules at each node was created to show the regions of metabolism that had been gained or lost as a unit multiple times in the evolutionary history of these bacteria. Since strictly speaking the nodes in this graph represent edges in the phylogenetic tree, the convention was used that internal branches are labeled with the IDs of the two terminal nodes, and edges terminating at an extant bacterium were labeled with the name of that bacterium.
3. Results and Discussion
3.1. Distribution of organism lifestyles and reactions
Information about the number and types of organisms and reactions (Henry et al., 2010) was integrated with data about the lifestyles of those organisms (Zientz et al., 2004; Merhej et al., 2009). Figure 1 shows the distribution of the number of reactions in each organism with respect to their lifestyles: habitats, respiratory modes, and pathogenic mode. The median number of reactions in the organisms is 1014. The reactions common to all 141 organisms account for about 1% of the total number of reactions.
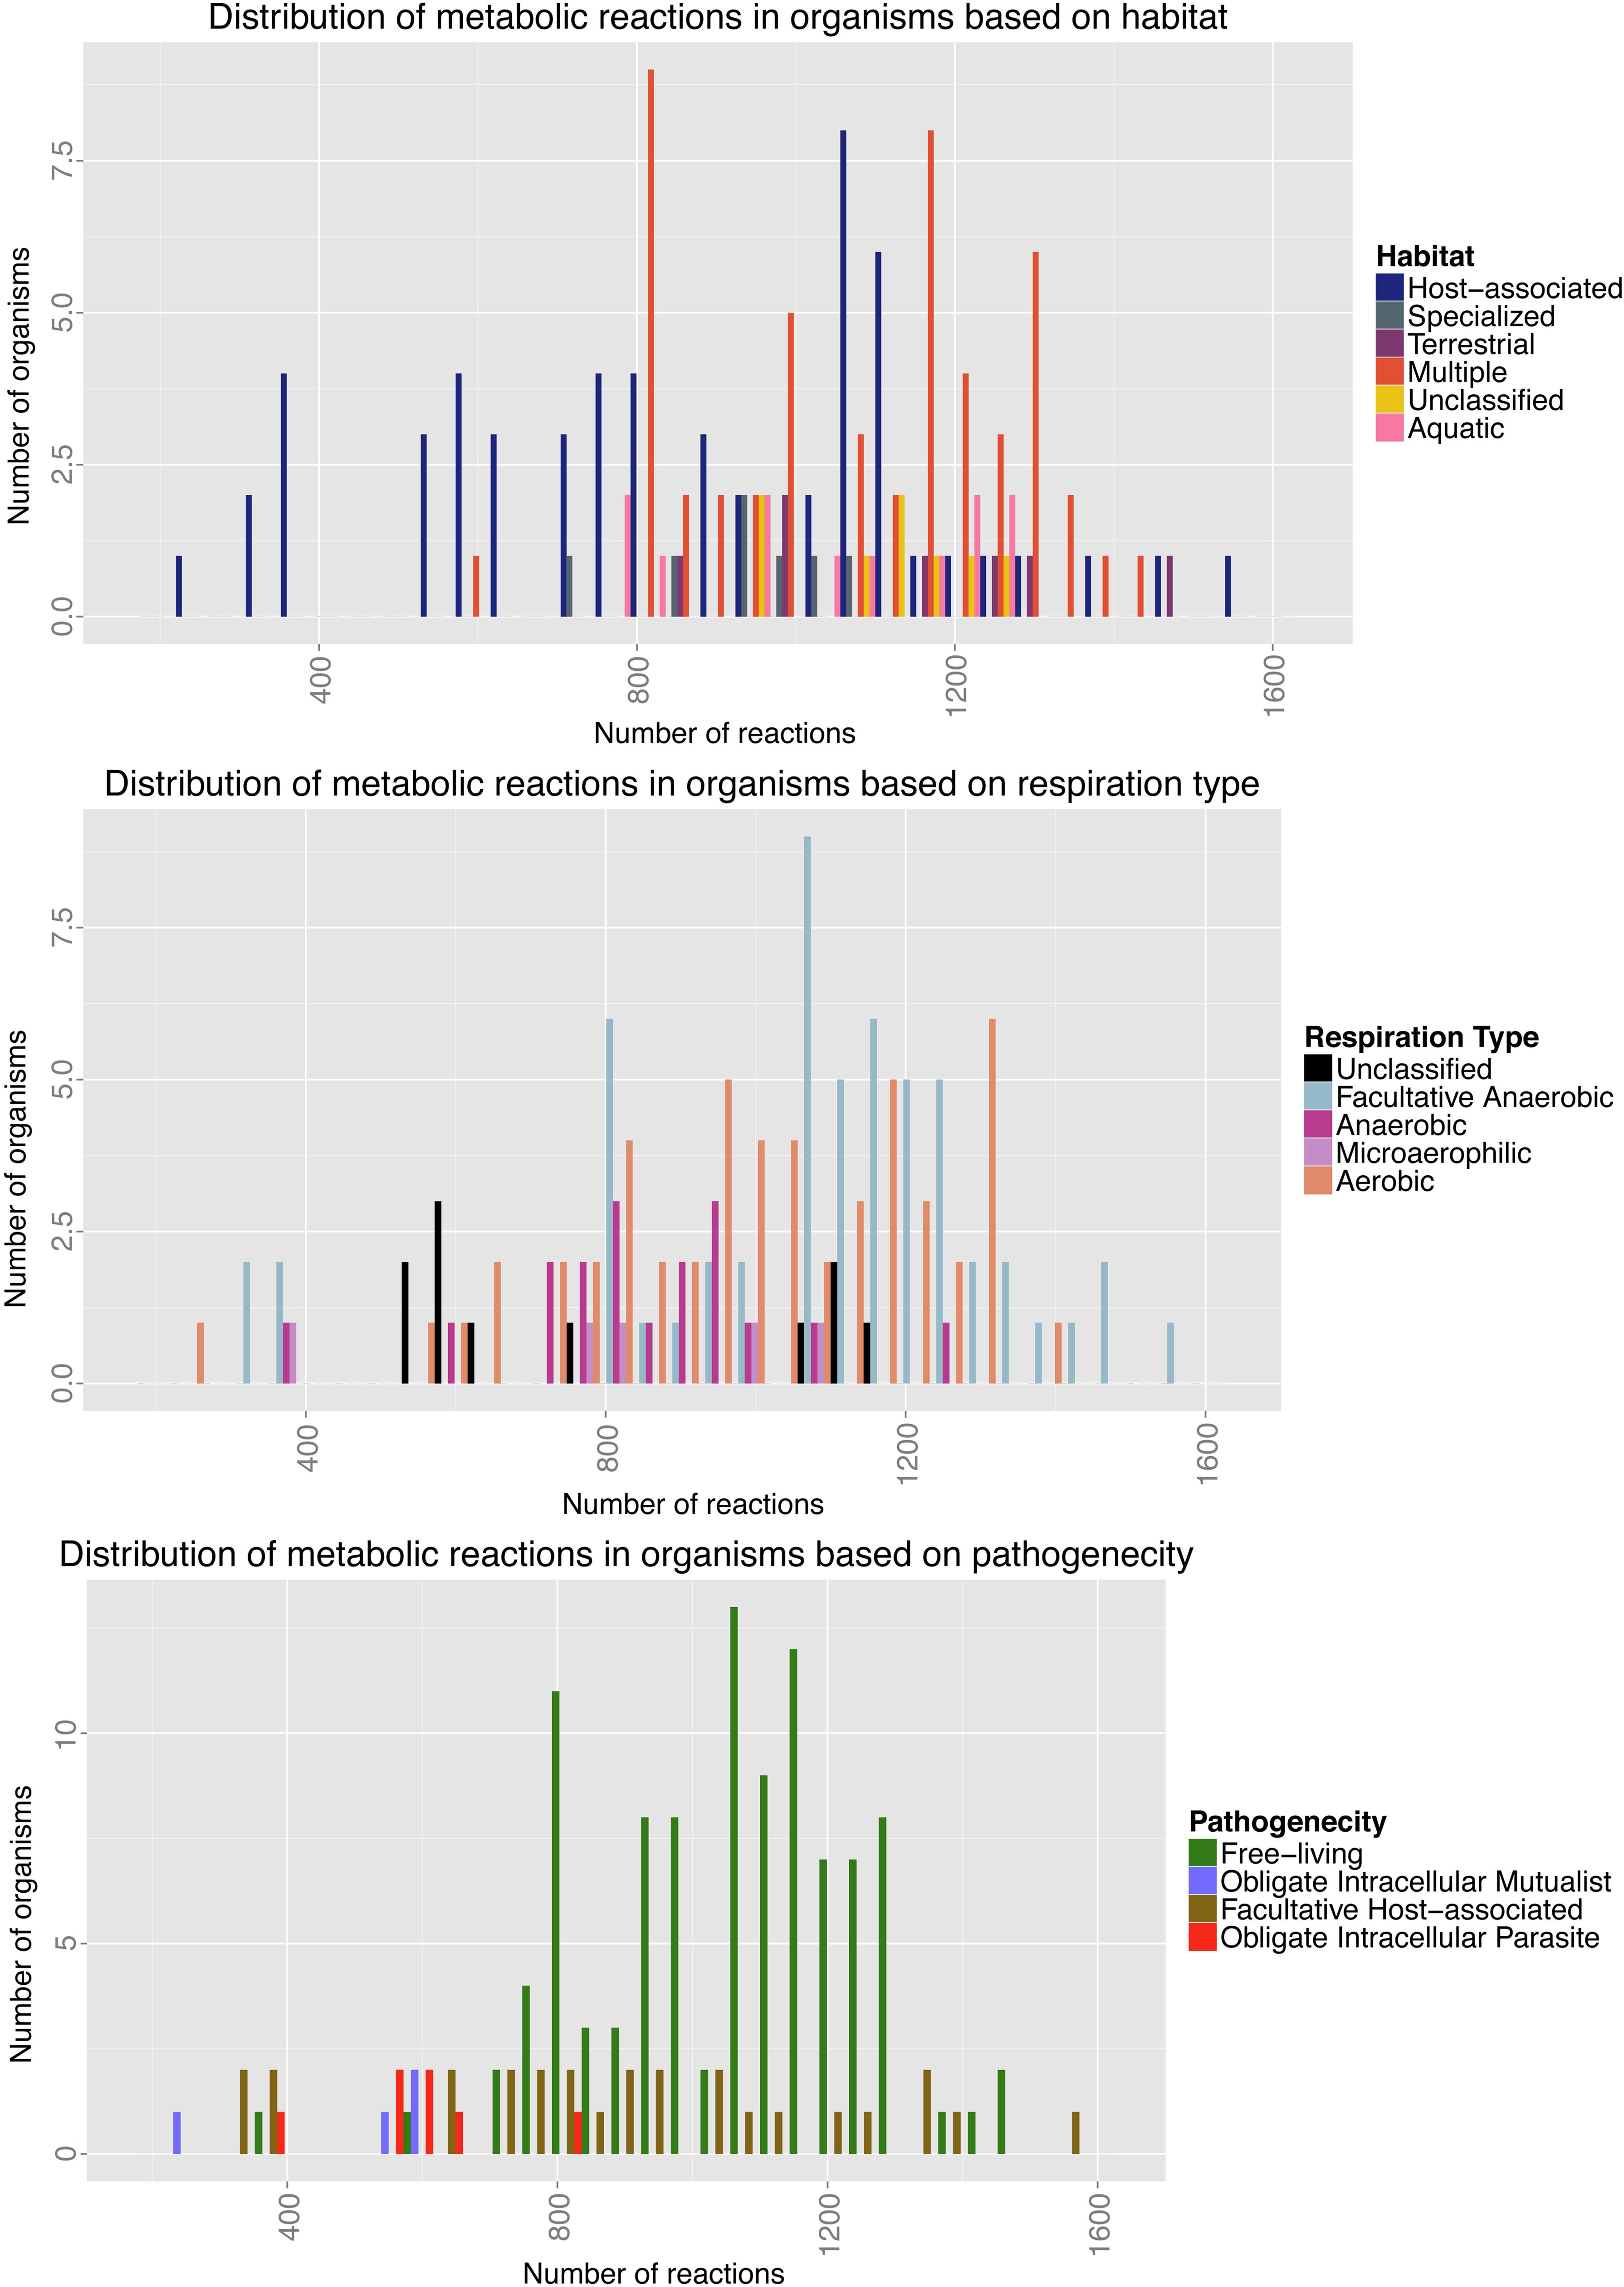
Histograms showing the relationship between reaction numbers and bacterial lifestyles. Each diagram shows the distribution of total number of reactions in organisms based on habitat type (top), respiratory type (middle), and pathogenicity (bottom) according to Model SEED reconstructions of 141 bacteria.
As can be seen from Figure 1, most of the organisms that have fewer than 700 reactions are host-associated; indeed from the distribution of pathogenic modes these bacteria represent the vast majority of obligate intracellular symbionts and pathogens. A Mann Whitney U test was conducted to establish whether there was any statistically significant relationship between lifestyle and number of reactions present in each bacterium. Results for each individual test and their p-values corrected for multiple testing can be seen in Supplementary Table 1 (Supplementary Material Available Online at www.liebertonline.com/cmb).
The results show that differing habitats do not necessarily have a large impact on numbers of reactions that the bacteria maintain, except when comparing the free-living bacteria with those that are host-associated. There is also some impact of respiratory mode on number of reactions, but this could be due to a dependence of respiratory mode on bacterial habitat.
The most significant results come from the comparison of the different pathogenic lifestyles of these organisms, as classified by Merhej et al. (2009). Supplementary Table 1C clearly shows, as expected from observations of symbiotic and parasitic bacteria, that the number of reactions available for each bacterium is strongly dependent on their relationship with their eukaryotic host. This is not just true for obligate intracellular bacteria, but also to an extent for host-associated pathogenic bacteria. Unsurprisingly, obligate intracellular mutualists and parasites do not differ significantly in the size of their metabolic network, since their lifestyles, restricted to within a eukaryotic host, mean they experience the same nutrient availability and limitations.
3.2. Ancestral state reconstruction
Ancestral state reconstruction for each reaction (trait) was performed on the phylogenetic tree inferred from the 23S rRNA alignment. A total of 30 metabolic reactions were present in all the 141 bacteria, and these were excluded from the analysis, so 2526 reactions were considered.
ASR predicted the presence and absence of every reaction at every ancestral node on the phylogeny. Inferences about the gains and losses of reactions through evolutionary history could be established by using the results of the ASR. For each branch, the change in likelihood of the presence of a particular reaction between the parent node and the child node was calculated, called δP (see Methods Section). A cutoff value for δP of ± 0.9 was used to infer which reactions were most likely gained and lost along each branch of the phylogeny, thus establishing where these metabolic changes occurred in the history of each extant bacterium.
The results obtained from ASR appear to be consistent with our biological knowledge about the different habitats and lifestyles of the bacteria under investigation. Using the aforementioned threshold score, the top five branches that showed the greatest number of gain and loss events were terminal branches leading to various extant bacteria.
The greatest gain was observed in the terminal branch leading to the bacterium Clostridium difficile CD196. These metabolic changes could be related to C. difficile pathogenicity and are thus of interest. The gains made by this C. difficile strain were analyzed by ambient (see Section 3.4) to establish whether these gains occurred in a modular way (adjacent reactions in the metabolism of the bacterium).
In terms of loss, the greatest loss is observed in Onion yellows phytoplasma OY-M, which is an obligate intracellular plant pathogen and contains an even smaller complement of metabolic genes than Mycoplasma genitalium (Oshima et al., 2003). These losses were analyzed by ambient to discover whether they are linked together in the metabolic network.
3.3. Metabolic traits hierarchical clustering compared with 23S rRNA phylogeny
Based on 23S rRNA sequence similarity, many organisms appear closely related to each other on the phylogenetic tree. However, the metabolic data presented here indicate the divergence of these organisms at a metabolic level far greater than that implied by their vertical evolution (genetic inheritance from ancestors) alone. This reflects the knowledge that bacteria evolve metabolically by horizontal gene transfer in addition to vertical evolution.
A hierarchical clustering based on metabolic reaction traits was created to show metabolic relatedness of various extant bacteria. Indeed using clusters of orthologous groups of genes as traits to construct a hierarchical clustering has been shown to cluster bacteria along metabolic lines (Merhej et al., 2009). This clustering is based on metabolic similarity so should reflect both vertical evolution (where the bulk of metabolic capabilities are inherited from) and horizontal gene transfer, depending on the importance of each of these mechanisms in the evolution of each organism.
The clustering was constructed using the character matrix of metabolic traits to gain a better understanding of the evolutionary relationships as revealed through the ASR results presented above. Supplementary Figure 2 shows the consensus tree obtained based on the metabolic traits of the organisms. The results obtained here clearly show that even though two organisms may be distantly related based on 23S rRNA sequence similarity, they can be very similar in terms of their metabolic capabilities, that is, that they have been subject to convergent evolution. A clear example here is between Mycoplasma pulmonis UAB CTIP and Onion yellows phytoplasma OY-M. They appear evolutionarily distant on the 23S rRNA phylogeny but are very similar according to their metabolic trait profiles. Supplementary Figures 1 and 2 show the phylogeny and the metabolic hierarchical clustering respectively.
Dendrograms were produced from the trait-based tree and the RNA-based phylogeny and these were analyzed to find whether the clusterings in the dendrograms corresponded to the three lifestyle classifications considered here. Maximum ARIs were produced for each dendrogram/classification pair to quantify their relatedness. For the RNA-based tree, none of the maximum ARIs were greater than 0.1, indicating little or no correlation between vertical evolution and current lifestyle. However, when the metabolic traits (i.e., metabolic reaction complement) and the lifestyles were compared, a value of 0.15 was obtained for respiratory mode and a value of 0.37 for pathogenic lifestyle (free-living, host-associated, obligate intracellular mutualists and obligate intracellular pathogens). This indicates that the pathogenic mode adopted by a bacterium has a clear influence on its metabolic network.
3.4. Active module analysis
While overall gains and losses of reactions in bacteria are informative in establishing some of the principles of metabolic evolution, the specific changes and how coordinated these changes are might shed more light on the dependence of metabolic evolution on bacterial lifestyles and pathogenicity. Most metabolic processes rely on multiple distinct reactions, therefore on multiple genes encoding those enzymatic functions, so gains and losses of adjacent metabolic functions (pathways) might be expected to occur simultaneously. Here we used ambient (Bryant et al., 2013) to look for reaction gains and losses that form connected components of the metabolic networks of the bacteria under consideration.
Some modules have been gained or lost multiple times in different branches in the phylogeny. By comparing modules between branches, these particularly plastic regions of bacterial metabolism were identified (Supplementary Table 2). Although some of these metabolic modules are associated with only one or two genes, entire biochemical pathways can be gained as a unit when genes form clusters on the genome. A good example of this can be seen in the case of LPS biosynthesis, which is inferred to have been gained on eight separate branches within the phylogeny and covers a total of 39 reactions.
Detailed analysis of the branches leading to two bacteria, representing two different lifestyles, are presented here as case studies: the obligate intracellular (Onion yellows phytoplasma OY-M) and the free-living (Clostridium difficile CD196).
The analysis of C. difficile produced 14 metabolic modules significant at the q = 0.001 level, which can be seen in Supplementary Figure 3. Table 1 shows a summary of the functions of the modules found. Several modules are involved in monosaccharide utilization and some in cell wall biosynthesis. Of particular interest is the apparent gain of phthiocerol dimycocerosate biosynthesis capabilities; this lipid has been shown to protect Mycobacterium tuberculosis when growing in a mammalian host (Cox et al., 1999) and therefore could potentially perform the same function for C. difficile.
Each line is an individual module (connected metabolic component) that has significantly higher scores for gains than would be expected in the whole metabolic network (at the corrected p = 0.001 level). The Metabolic Function column represents a summary of the enzymatic functions present in the module.
It has been established previously that C. difficile CD196 utilizes as carbon sources N-Acetyl-glucosamine and N-Acetyl-neuraminic acid, which are both represented in the metabolic network used here. It appears that the reactions around N-Acetyl-glucosamine are shared with the other Clostridium strains in this study. One of the significant modules found by ambient (Fig. 2) shows that C. difficile gained the ability to utilize N-Acetyl-neuraminic acid since its divergence from the other Clostridia in the study. The assimilation of N-Acetyl-neuraminic acid proceeds by conversion through several intermediates to Fructose-6-phosphate, which is part of central carbon metabolism.
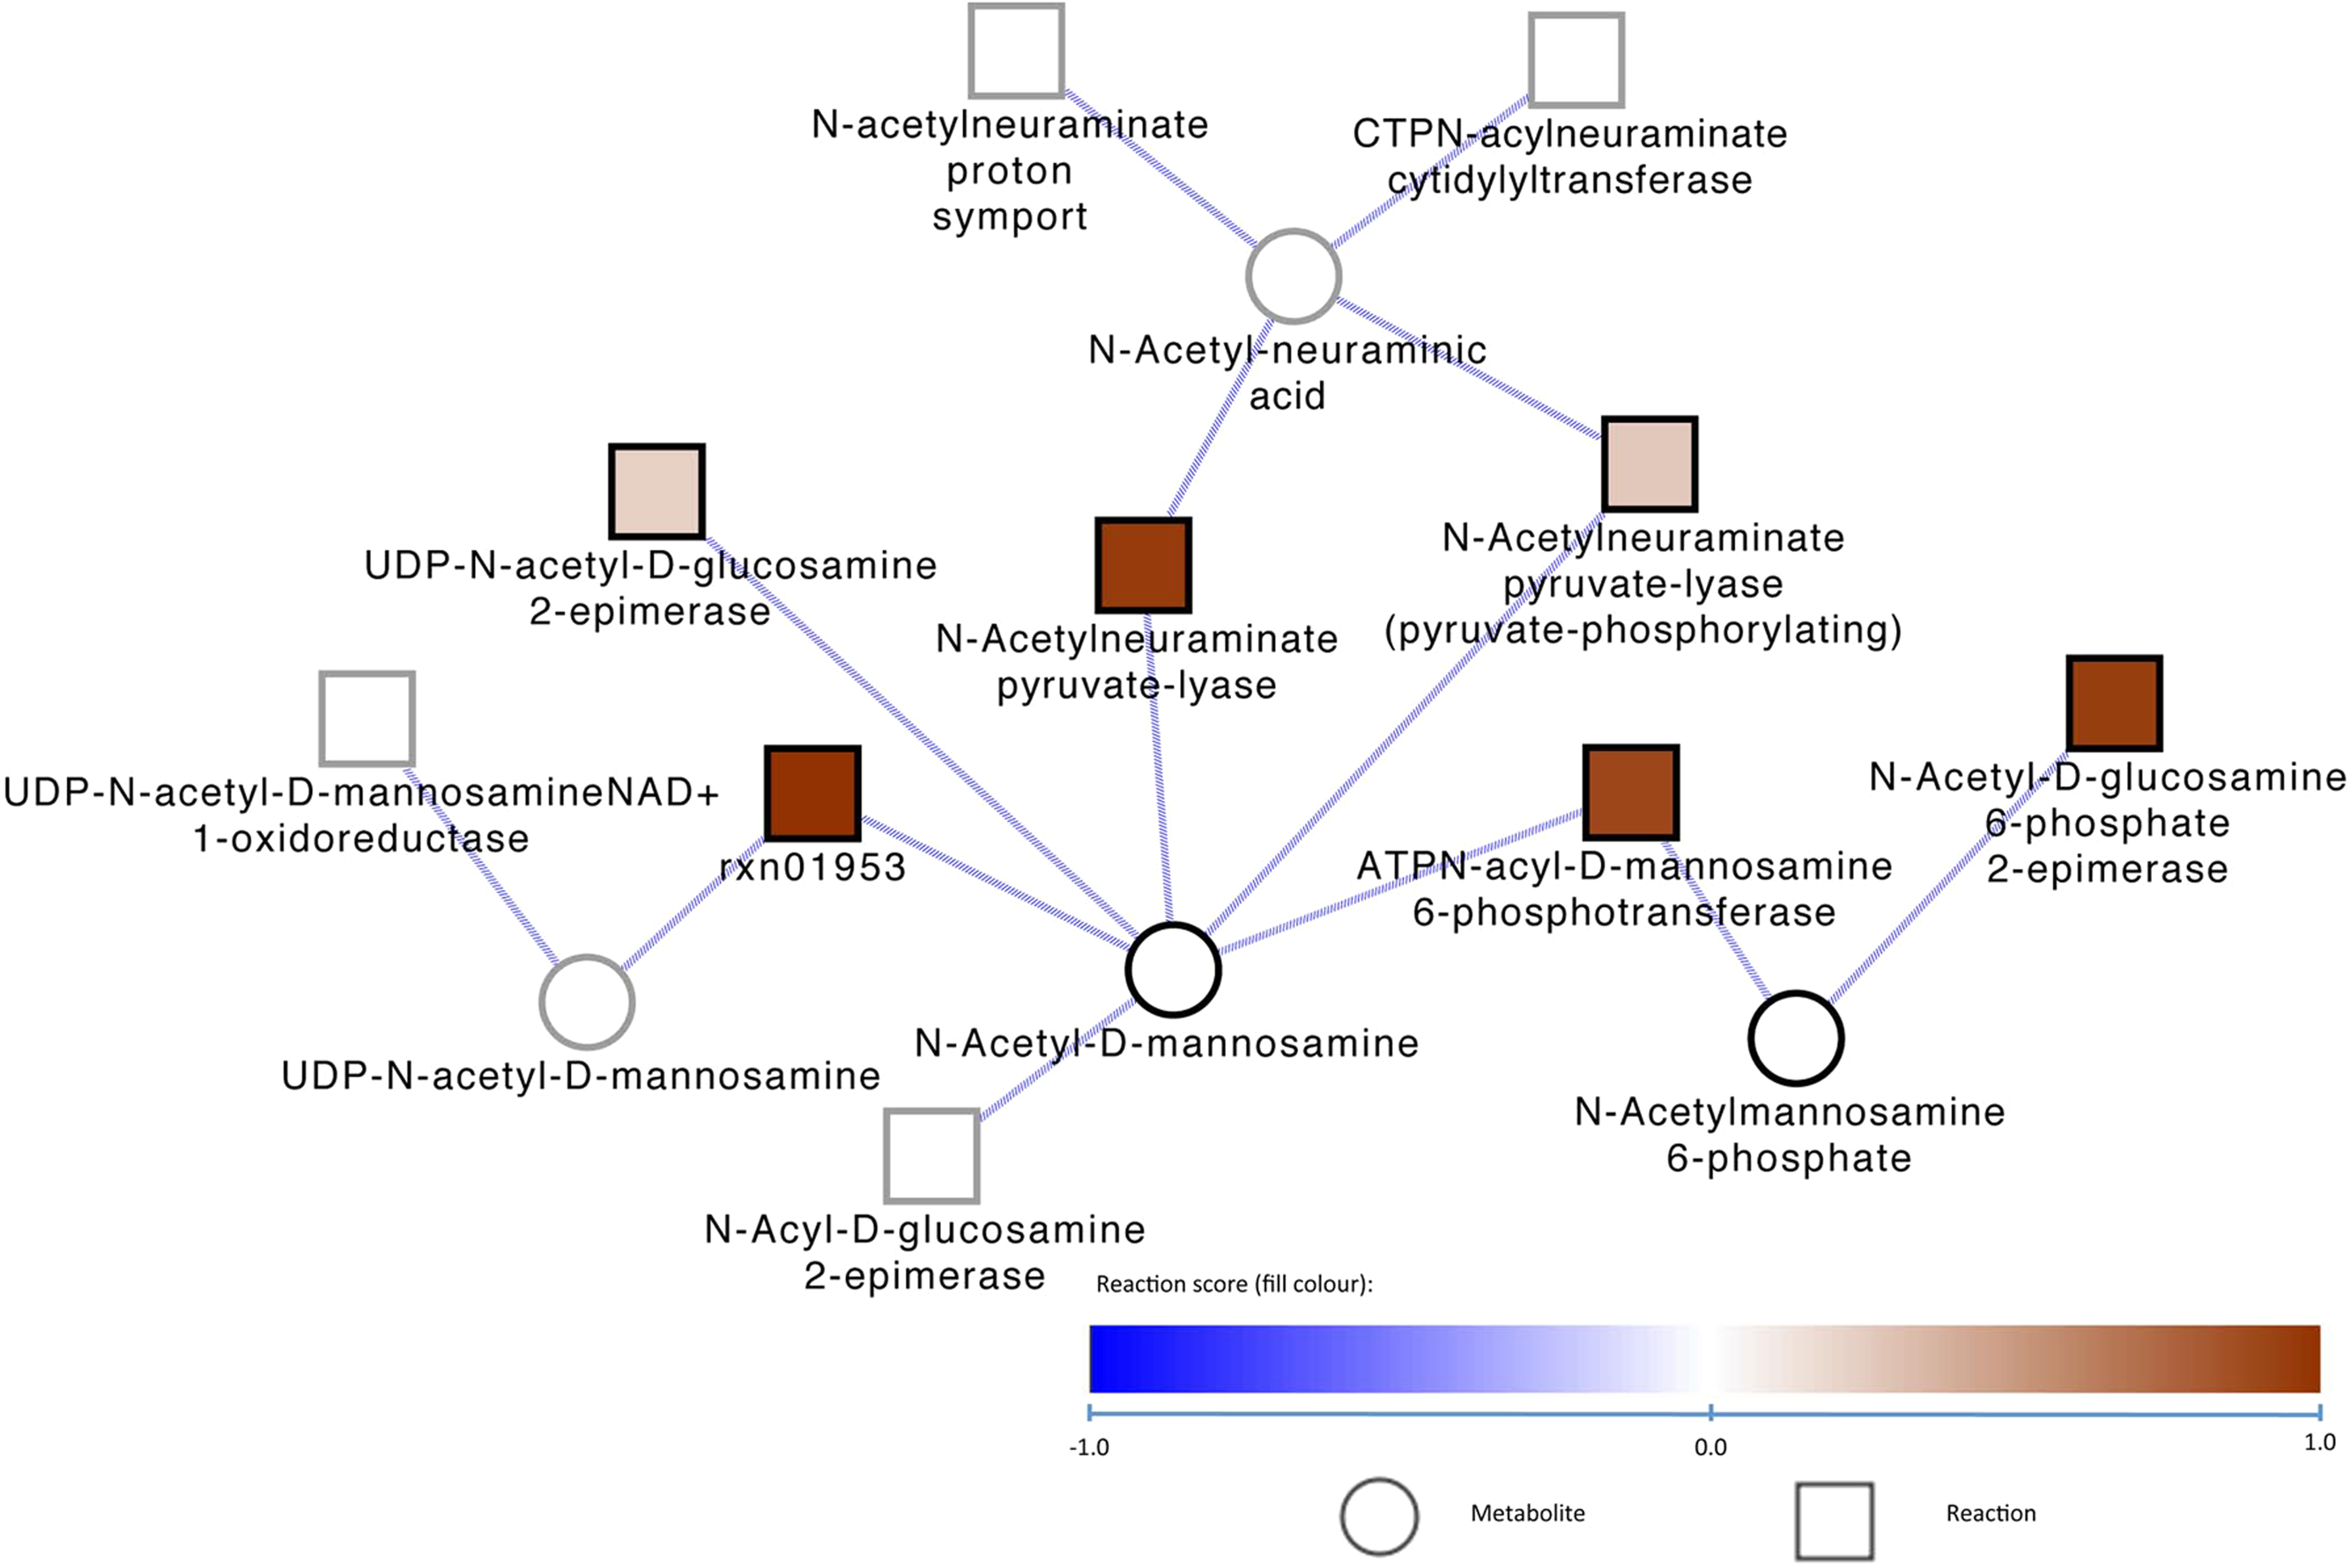
Metabolic module 14 gained in C. difficile CD196 and its metabolic neighborhood, according to ambient analysis of the reaction gains and losses from its closest ancestor on the 13S rRNA phylogenetic tree. Members of module 14 are outlined in black and those not in the module are outlined in gray. The fill colors of the reactions correspond to δP values.
The reactions responsible for this interconversion, allowing C. difficile to utilize this carbon source, have been inferred by Model SEED to be present in this C. difficile strain. Some of the reactions in the model were predicted to be present without having a gene associated with them. In the case of this module, two genes, nanA and CD196_2092, were associated with two of the reactions, ATPN-acyl-D-mannosamine 6-phosphotransferase and N-Acetylneuraminate pyruvate-lyase, in the module. These genes are transcribed in the same direction and have just three closely spaced same-sense genes between them, each of unknown function. This establishes the tantalizing possibility that these three intervening genes could encode proteins with other functions within this coordinately gained metabolic module.
As expected from an obligate intracellular pathogen, ambient finds extensive coordinated losses in the Onion yellows phytoplasma OY-M metabolic network, with over 350 reactions lost in connected metabolic modules (as shown in Supplementary Fig. 4). The closest relatives of Onion yellows in this study share only the same Phylum (Firmicutes), so this represents a long period of evolutionary history. Nonetheless, Onion yellows has only gained (and retained) 91 reactions in the same period, indicating a very strong bias toward metabolic function loss, as expected from the bacterium's lifestyle. By far the largest module shows the complete loss of lipid biosynthesis, as expected since Phytoplasmas lack a cell wall.
4. Conclusions
The ancestral state reconstruction results and metabolic traits phylogeny have been able to unpick and clarify the significant gains and losses of metabolic capabilities in various organisms during their evolutionary history. The findings have correlated well with previous biological knowledge of the lifestyles of these organisms. The hierarchical clustering of these bacteria using metabolic traits has shown that, as expected, metabolic evolution is far more intimately linked with current lifestyle than is bacterial ancestry.
The adaptation of bacteria to different conditions has led to a considerable gain and/or loss of reactions over time. Considerable gain has been observed in Clostridium difficile, which is consistent with the expectations for a nonintracellular opportunistic pathogen. Considerable losses, including those of lipid biosynthesis, have been observed in Onion yellows phytoplasma, which is a known obligate intracellular plant pathogen that does not produce a cell wall. The metabolic traits–based hierarchical clustering has provided insight into examples of convergent evolution with respect to bacterial metabolism.
The ambient analysis presented here has clearly picked out some relevant and biologically meaningful metabolic modules that have been gained or lost in a coordinated fashion. This approach, combined with the multiple metabolic models produced by Model SEED, which can infer reaction presence even in the absence of known enzymes, is a powerful tool that goes beyond previous approaches to investigating metabolic evolution.
Footnotes
Acknowledgments
Thanks to David Hughes, Lesley Hoyles, Pakorn Aiewsakun, and Ghazal A. Milani for kindly collating the reaction presence/absence tables for the 141 bacteria analyzed in this article from the Model SEED website. A.A.F. was supported by the Mohamedali Habib Welfare Trust, Karachi. W.A.B. was supported by the BBSRC, grant BB/G020434/1. J.W.P. is supported by a University Research Fellowship from the Royal Society.
Author Disclosure Statement
No competing financial interests exist.
References
Supplementary Material
Please find the following supplemental material available below.
For Open Access articles published under a Creative Commons License, all supplemental material carries the same license as the article it is associated with.
For non-Open Access articles published, all supplemental material carries a non-exclusive license, and permission requests for re-use of supplemental material or any part of supplemental material shall be sent directly to the copyright owner as specified in the copyright notice associated with the article.