
Abstract
Abstract
1. Introduction
A
2. Related Work
Structure-based protein function prediction depends on finding a relation between protein structures and their function. This may be based on analyzing the similarities between the structures of proteins that belong to the same functional class (Bray et al., 2009; Boaretoa et al., 2012) in order to predict the functions of functionally unannotated proteins. Protein function prediction methods include statistical methods (Ewens and Grant, 2005), data mining approaches (Han and Kamber, 2008), and machine learning techniques (Larranaga et al., 2006; Cheng et al., 2008). The similarity comparison level of protein can be global, in which the whole structure is considered, or local, which considers only substructures and is termed as motif finding. Besides, the comparison may require alignment technique (Csaba et al., 2008; Ritchie et al., 2012) or not (Pires et al., 2011). Protein function prediction accuracy and efficiency are based on protein representation and prediction methods. The protein structure could be represented according to atom coordinates as done by Xie and Bourne (2007) and Pires et al. (2011), who used Cα atom to represent protein structures, topological structure that considers relationships between secondary structure elements (Gilbert et al., 1999, 2001; Veeramalai et al., 2008), or surface shape that considers overall surface features (Sael et al., 2008a,b; La et al., 2009; Kihara et al., 2011). Many methods have been proposed for structure-based protein function prediction. These include function prediction motif finding (Jia et al., 2009; Ku and Hu, 2012; Wang et al., 2013), binding sites prediction (Xie and Bourne, 2007; Zhao et al., 2010, 2011; Alvarez and Yan, 2012; Nisius et al., 2012), or enzyme classification (Dobson and Doig, 2005; Erdin et al., 2010, 2013; Wang et al., 2011; Alvarez and Yan, 2012; Rahimi et al., 2013).
Finding motifs that appear in proteins belonging to the same function could be important for function analysis and are known as functional sites. Jia et al. (2009) represented motifs as subgraphs and proposed APproximate Graph Mining (APGM) algorithm to identify con-served structures by finding the frequent subgraphs with approximate matching in a set of graph-represented proteins with an accuracy of 78%. Ku and Hu (2012) proposed a two-stage framework for structural motif discovery. It starts with converting protein three-dimensional (3D) coordinates into structural alphabet sequences, and then finds motifs using sequence motif-finding tool. Wang et al. (2013) used local 3D structural motifs by implementing the structurally aligned local sites of activity (SALSA) method for predicting protein biochemical function. For predicting binding sites where some proteins function by binding to other proteins through them, Nisius et al. (2012) reviewed binding sites analysis methods through their scopes, limitations, and validation. Xie and Bourne (2007) proposed a new shape descriptor to represent protein structure based on its global shape and the surrounding environment of each residue using Cα atoms. For binding site prediction, they accurately identified 85% of known binding sites. Alvarez and Yan (2012) introduced a graphical method for protein structure representation based on the spatial clustering of amino acids and evolutionary profiles of the proteins. Using Support vector machine (SVM), the proposed method achieved an accuracy of 92% for the prediction of DNA-binding proteins. Zhao et al. (2010) achieved an accuracy of 98% for predicting DNA-binding proteins utilizing knowledge-based energy function and atom-type-dependent features.
Zhao et al. (2011) proposed a structure-based method to predict zinc-binding sites that are applied on 1888 protein structures with unknown function. For enzyme classification, Dobson and Doig (2005) used a set of global attributes calculated from proteins structure. They achieved 35% of accuracy using support vector machines. Alvarez and Yan (2012) achieved for the prediction of enzymes an accuracy of 87% using their proposed graphical method that is based on the spatial clustering of amino acids and evolutionary profiles of the proteins. Using 3D templates (structure–function motifs or 3D function-associated motifs) and evolutionary information, Erdin et al. (2010) classified enzymes and nonenzymes using gene ontology terms (Ashburner et al., 2000) as functional classifications and achieved an accuracy of 94%. By letting each protein contribute multiple templates instead of one, Erdin et al. (2013) maintained the accuracy over 91%. Rahimi et al. (2013) used 3D motifs to predict the full EC number of enzymes. The representative 3D motif for each EC number is determined by searching for an active site whose spatial arrangement has the minimum average distance to other active sites belonging to the same class. Wang et al. (2011) proposed a method based on support vector machine to predict enzyme function. For the prediction of first three EC digits, an accuracy ranging from 81% to 98% is achieved.
3. Methods
3.1. Cutoff scanning matrix
Pires et al. (2011) proposed a cutoff scanning matrix (CSM) method to represent a set of proteins using distance patterns between their residues. As shown in Figure 1, each row in the matrix refers to a feature vector of a protein, which represents the frequency distribution of pairs within a range of distances (starting from dmin to dmax with the distance step dstep) and a defined maximum distance threshold (cutoff). They used a cutoff of 30 Å for all proteins.
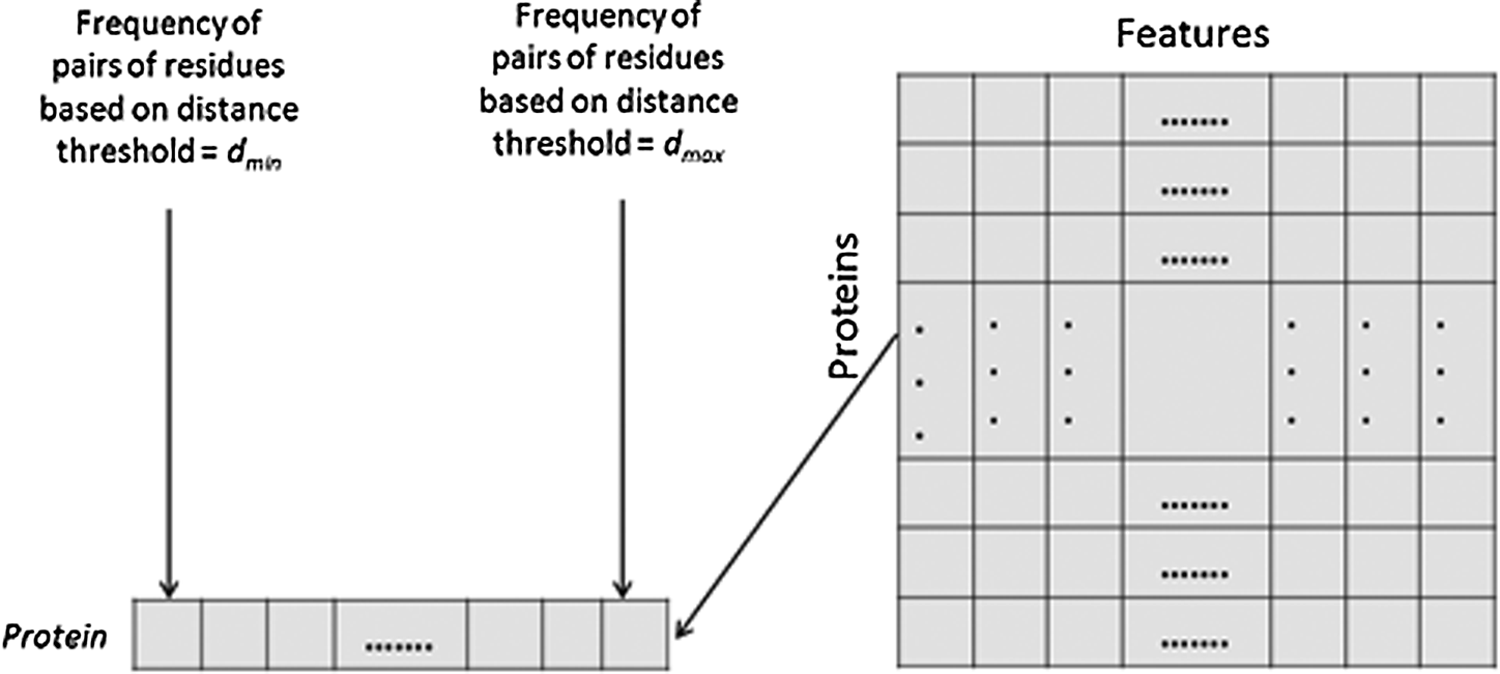
Cutoff scanning matrix (CSM) for a set of proteins.
The CSM method fails to capture the 3D structure of the protein. The CSM encodes only the distance patterns between the residues in the protein, while the angles between the residues affect the protein structure dramatically. Therefore, we propose a new representation that builds on the same concept of the scanning matrix method and captures the 3D structure of the protein. The following section presents such a representation in detail.
3.2. Protein structure matrix
We propose a protein structure matrix (PSM) representation that captures the 3D structure of the protein. The PSM encodes both the distance and angle patterns between pairs of protein residues. The distance and the angle between a residue pair are computed as done by Gao and Zaki (2008), as shown in Figure 2.
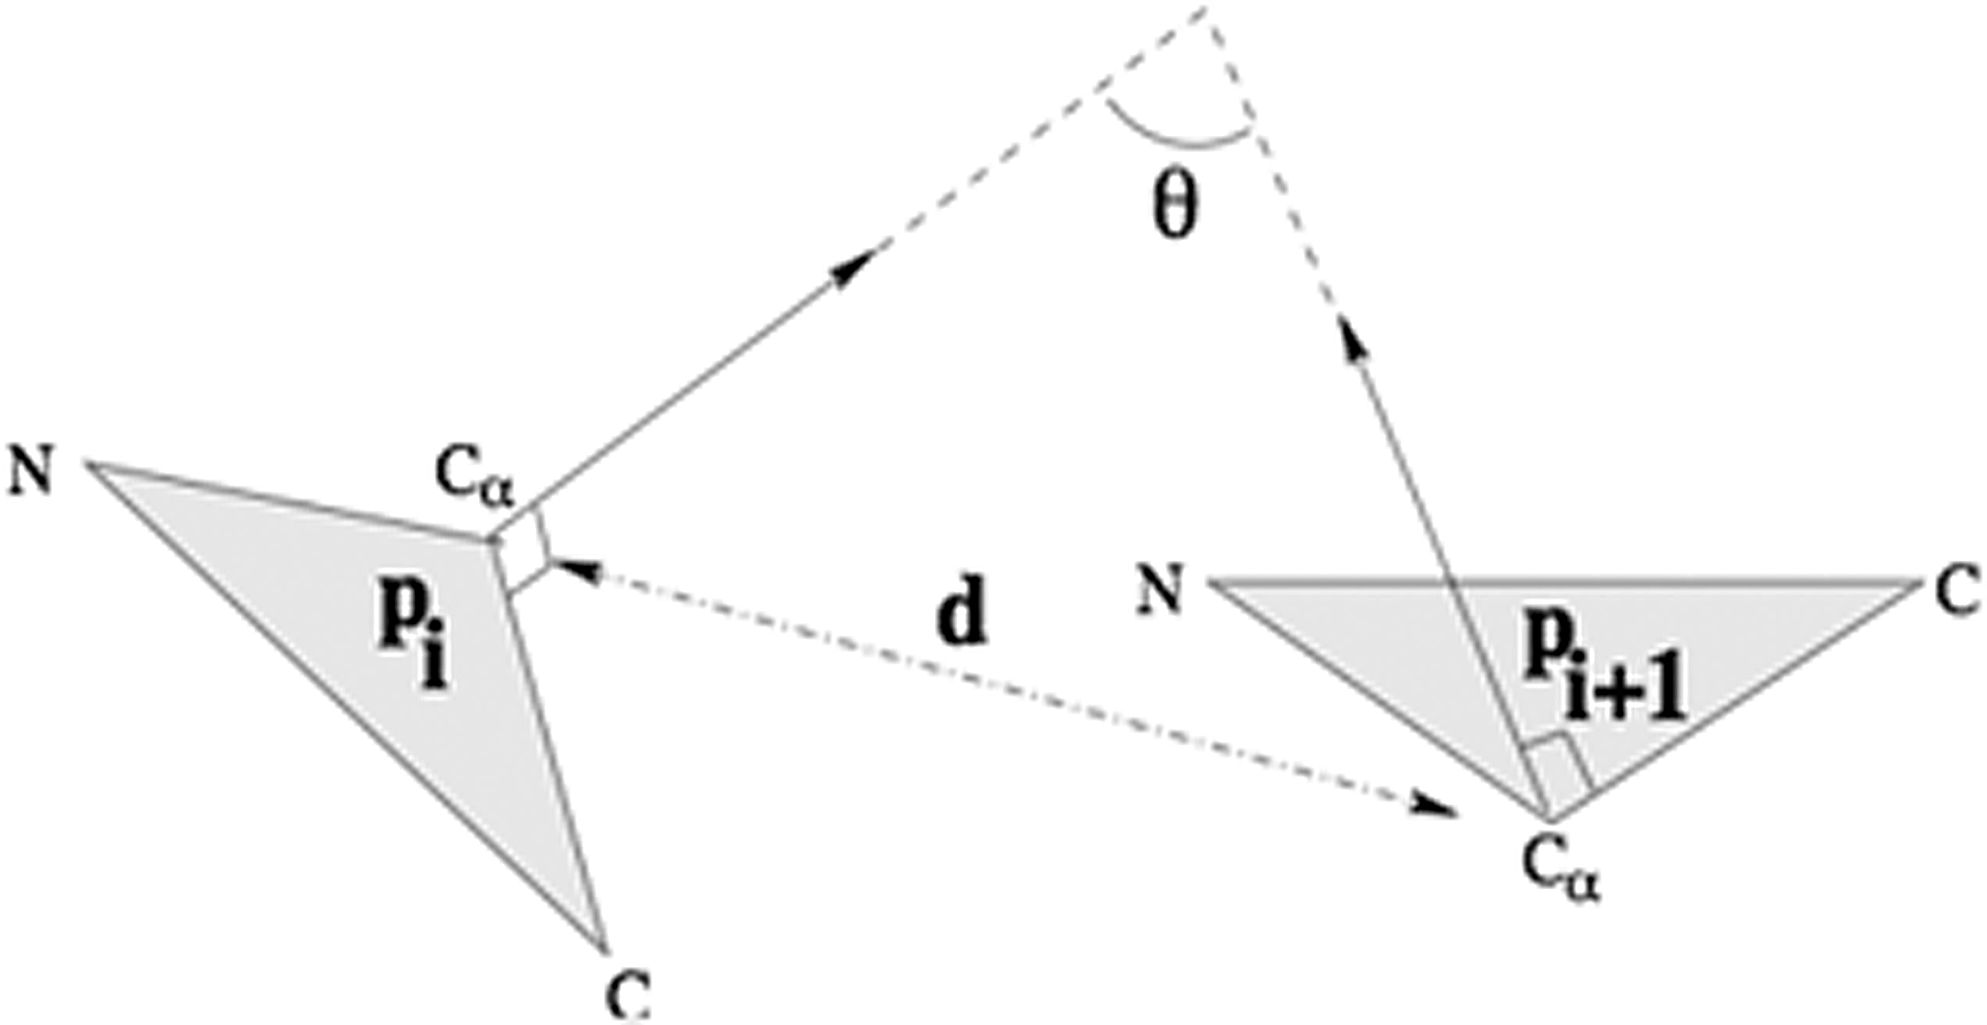
The distance and angle between two residues (Gao and Zaki, 2008).
The PSM is generated as follows. We first compute the Euclidean distance D(Cα) and angles
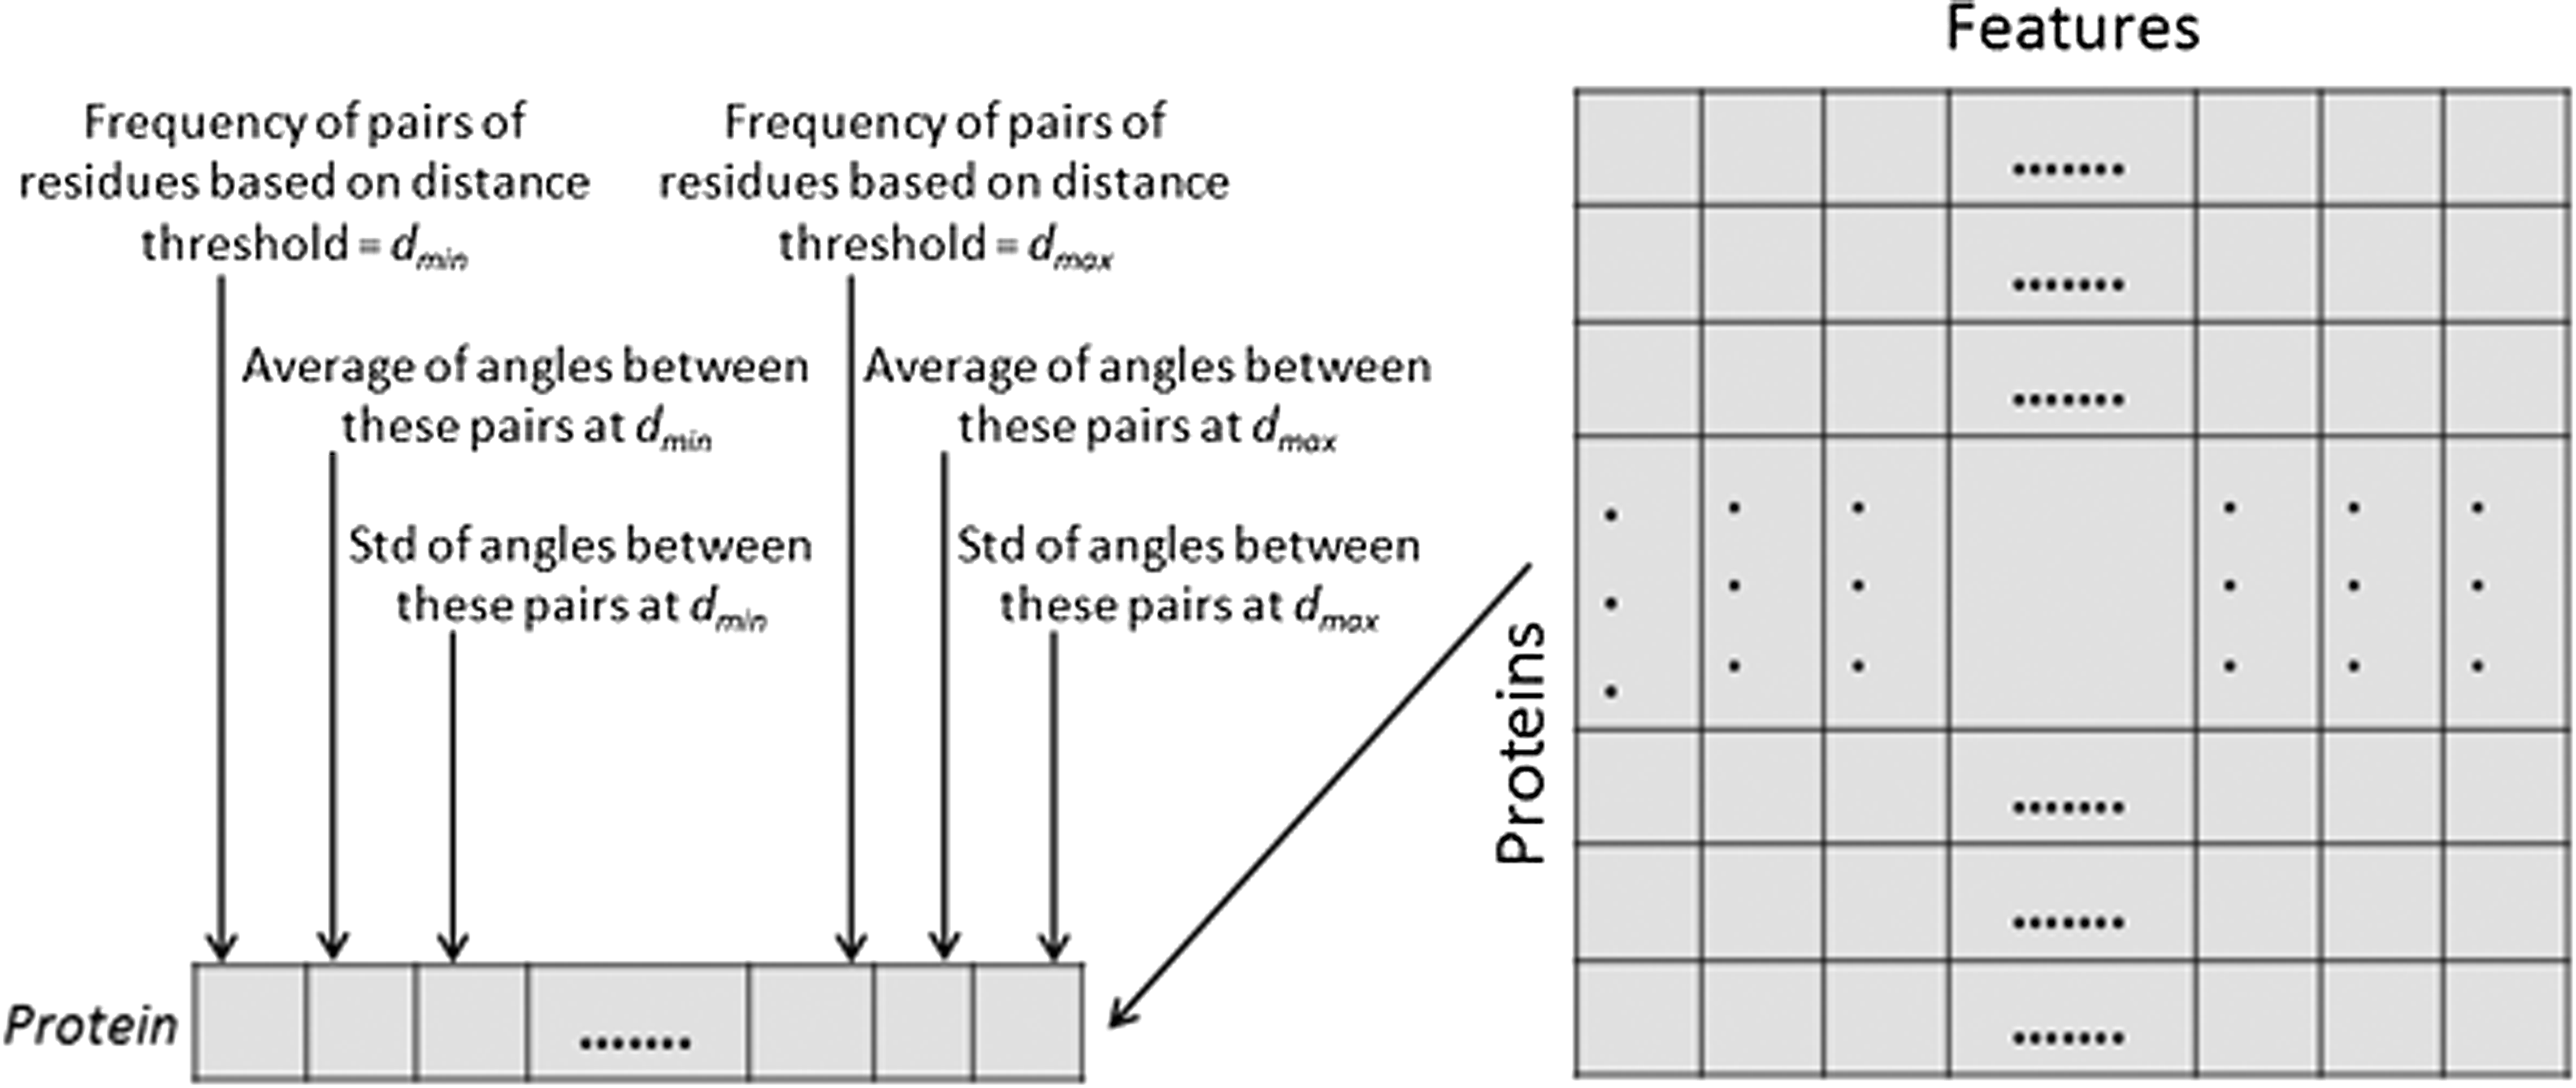
Protein structure matrix (PSM) for a set of proteins.
The distance between residue pairs is the Euclidean distance between their Cα atoms. The angle between residue pairs is computed as done by Gao and Zaki (2008). They utilized the coordinates of the N, Cα, and C atoms of each residue. Each residue is represented by a plane containing its N–Cα–C triangle. The angle between two residue pairs is defined as the angle between the planes normal, as shown in Figure 2.
The normal to the N–Cα–C plane is defined by
Hence, the angle between the two normal
Algorithm 1 shows the detailed steps of computing the PSM.
3.3. PSM with cutoff
In order to show the importance of encoding the angles in a protein representation, we presented another implementation for the PSM with a cutoff (PSM-C), so that we could compare the performance of the PSM representation with that of the CSM. The PSM-C is very similar to the CSM, but it further encodes the angles between residue pairs. The feature vector in the PSM-C is computed, as in the PSM it encodes only the pairs within a defined threshold distance (the cutoff). Algorithm 2 shows the details of computing the PSM-C.
4. Results and Discussion
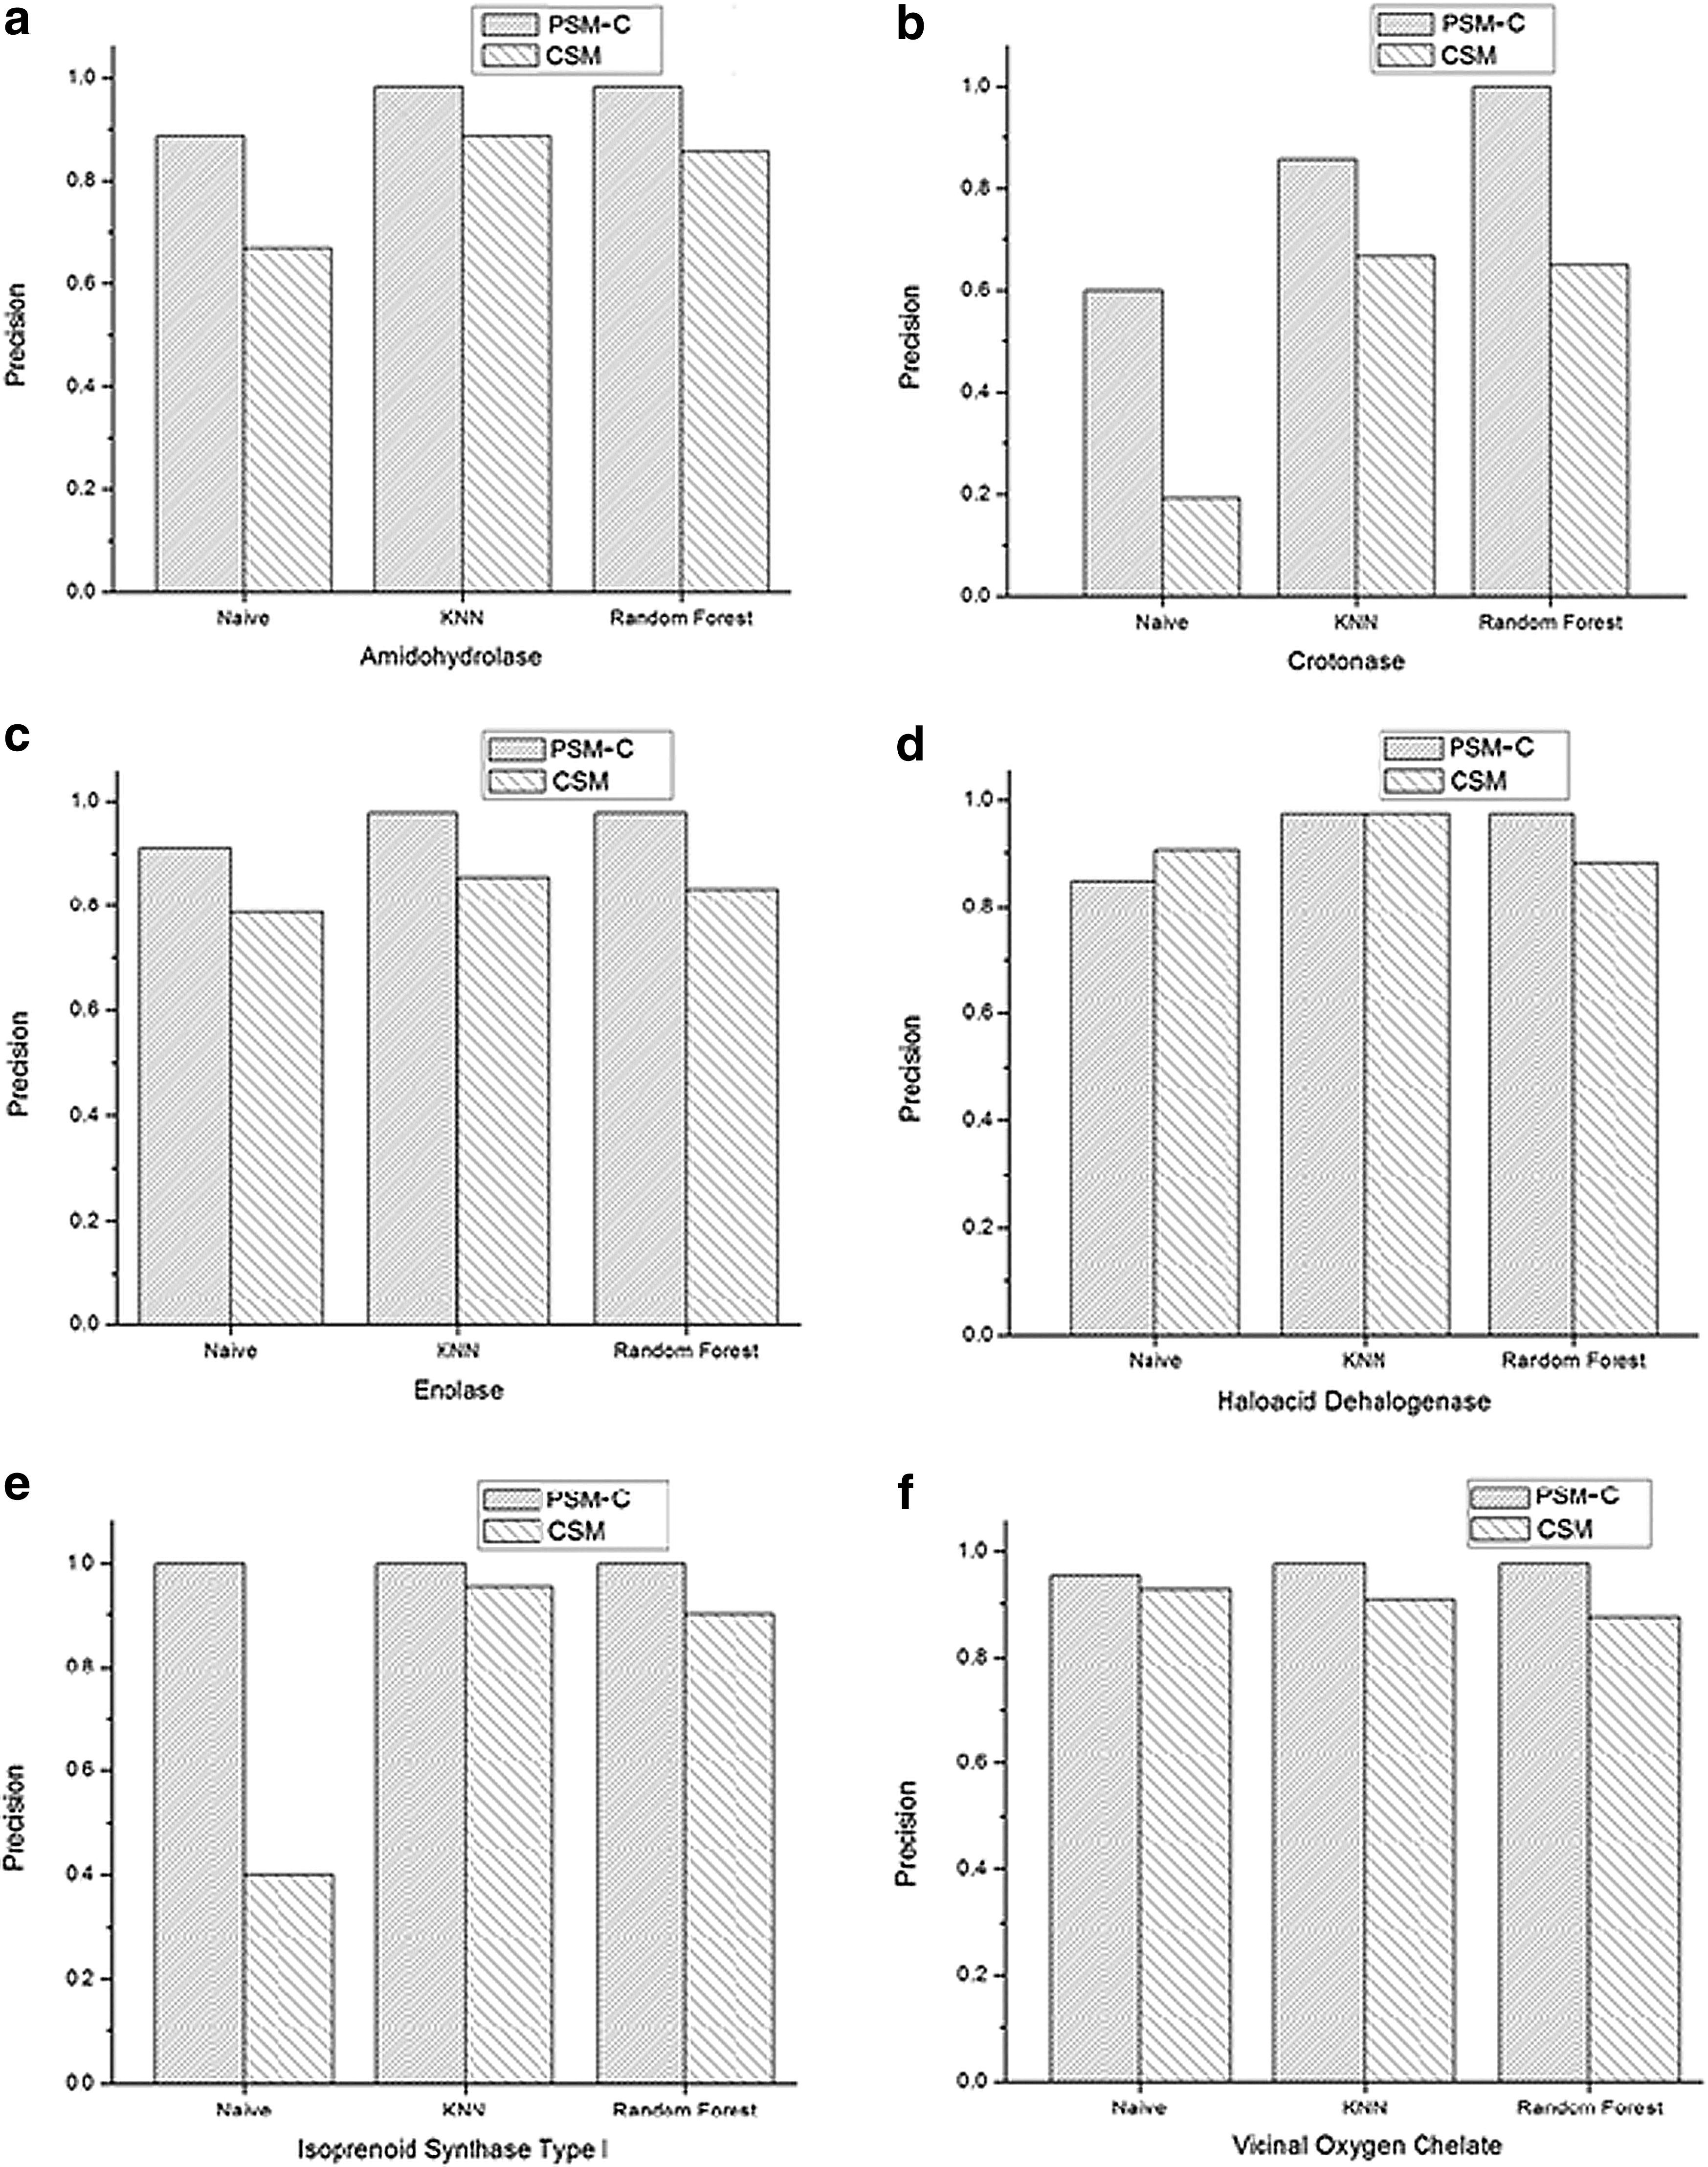
We used two data sets. The first data set is the same as used by Pires et al. (2011). It is a gold standard of mechanistically diverse enzyme superfamilies (Brown et al., 2006). Proteins that do not conform to the adopted configuration for computing angles between residues are excluded. This condition leads to a data set that contains 346 protein structures that are available in the Protein Data Bank (Berman et al., 2000) and belongs to the 6 superfamilies, which are amidohydrolase, crotonase, enolase, haloacid dehalogenase, isoprenoid synthase type I, and vicinal oxygen chelate. The second data set was created by Dobson and Doig (2003). It contains 1178, from which only 1157 proteins conform to the adopted configuration. This data set is divided into 679 enzymes and 478 nonenzymes. We implemented three algorithms that utilize the CSM, PSM-C, and PSM representations to predict protein function using these data sets.
For both CSM and PSM-C, the same distance range proposed by Pires et al. (2011) was used, which starts from 0 to 30 Å as a maximum distance with a step 0.2 Å. This range produces 151 feature values. Hence, we also set the number of features for the PSM to be 151 in order to compare its results with the other two representations. Note that in the PSM and PSM-C, each feature vector contains 151 × 3 = 453 values. The Weka Toolkit developer version 3.7.6 (Witten and Frank, 2005) was used with 10-fold cross-validation. Three algorithm, naïve Bayes, k-nearest neighbors (KNN), and random forest, were implemented as classifiers, and the prediction accuracy was evaluated using five performance measures, accuracy, precision, recall, f-measure, and receiver operating characteristic (ROC) area. The details of these performance measures for multiclass classification task can be found in (Sokolova and Lapalme, 2009).
CSM, cutoff scanning matrix; KNN, k-nearest neighbors; PSM, protein structure matrix; PSM-C, protein structure matrix with a cutoff.
SVD, singular value decomposition.

ROC, receiver operating characteristic.
5. Conclusion
Functions of proteins depend highly on their structure. Therefore, good protein structure representation could result in effective protein function prediction. In this article, we propose a new protein structure representation: the PSM, which encodes protein structure based on the 3D patterns of protein residues. PSM representation encodes angle patterns of protein residues along with their distance patterns. This representation has significantly improved protein function prediction accuracy. The proposed method requires neither prior alignment process nor any sequence information. Furthermore, it is independent of the prediction method. Computation results using three different classification algorithms and two different data sets show that the prediction accuracy for the PSM representation outperforms that for the CSM representation, which only encodes distance patterns of protein residues. Our representation achieved a prediction accuracy of 98% in predicting superfamily. On average, it achieved an improvement of about 10% in the prediction accuracy of different protein families using different classification methods.
Footnotes
Author Disclosure Statement
No competing financial interests exist.