
Abstract
Abstract
Computationally assessing the functional similarity between proteins is an important task of bioinformatics research. It can help molecular biologists transfer knowledge on certain proteins to others and hence reduce the amount of tedious and costly benchwork. Representation of amino acids, the building blocks of proteins, plays an important role in achieving this goal. Compared with symbolic representation, representing amino acids numerically can expand our ability to analyze proteins, including comparing the functional similarity of them. Among the state-of-the-art methods, electro-ion interaction pseudopotential (EIIP) is widely adopted for the numerical representation of amino acids. However, it could suffer from degeneracy that two different amino acid sequences have the same numerical representation, due to the design of EIIP. In light of this challenge, we propose a complex prime numerical representation (CPNR) of amino acids, inspired by the similarity between a pattern among prime numbers and the number of codons of amino acids. To empirically assess the effectiveness of the proposed method, we compare CPNR against EIIP. Experimental results demonstrate that the proposed method CPNR always achieves better performance than EIIP. We also develop a framework to combine the advantages of CPNR and EIIP, which enables us to improve the performance and study the unique characteristics of different representations.
1. Introduction
A
Among the state-of-the-art methods, electron-ion interaction potential (EIIP) is a de facto numerical representation approach (Cosic, 1994; Keković et al., 2010; Cosic and Pirogova, 2007). However, it only works well on identifying proteins of the same type of functions (Cosic, 1994; Cosic and Pirogova 2007), suffering from degeneracy (Yau et al., 2003) issues that two functionally different proteins may get very similar or even the same representation. The degeneracy issue is due to its design in which some amino acids are mapped to close or even same numbers.
To tackle this challenge, in this article, we propose a complex prime numerical representation (CPNR) of amino acids. The motivation behind CPNR is to consider the number of codons of amino acids. We observe a great similarity between the number of codons of amino acids and a differential pattern of prime numbers. Such observation inspires us to develop the new representation based on prime numbers. To make the representation more biologically meaningful, prime numbers are mapped into complex domain. Compared with previous work, CPNR has no degeneracy problem, and the numbers in CPNR are relatively independent from each other, which means that one number cannot be obtained from another by addition, multiplication, or exponentiation with a real number.
To validate the effectiveness of CPNR, we compare its accuracy against EIIP (Cosic, 1994). Results show that CPNR achieves higher accuracy of 69.18% than EIIP. We further develop a framework to combine the advantages of CPNR and EIIP. Modeled as an optimization problem, the framework achieves an accuracy of 84.25% and 81.53% when solved by particle swarm optimization (PSO) (Birge, 2003) and support vector machine (SVM) (Lu et al., 2004; Cheng et al., 2006), respectively.
2. Data
Both protein sequences and annotations about their functions are from UniProt (Universal Protein Resource) where 520 protein sequences from 7 most systematically researched functional groups form our dataset (Table 1). Hence, there are
3. Methods
3.1. Complex prime numerical representation (CPNR)
A protein sequence is usually represented as a symbolic sequence based on the alphabet set
To address degeneracy, in this article, we propose a prime number-based approach where we make use of the pattern on the numbers of amino acid codons. A codon is a tuple of three nucleic acids that can be encoded into one amino acid in gene expression. One amino acid can be encoded from more than one codon. This makes amino acid sequences more fault-tolerant for point mutations (Lehmann and Libchaber, 2008).
We notice that the numbers of amino acid codons share a great similarity with the differences between prime numbers in the interval [2, 67] (Tables 3 and 4). Table 3 shows the numbers of codons for all 20 amino acids, while Table 4 shows the difference between each noncomposable (i.e., 1 and prime) number in interval [1, 67] and the next one.
Take the five amino acids P, T, V, A, and G as an example. Each of the five amino acids has four codons. Correspondingly, there are five prime numbers (7, 13, 19, 37, and 43) in the interval [2, 67], each of which is less than the next noncomposable number by 4. Such similarity inspires us to develop a representation of amino acids based on prime numbers.
Based on the observation above, we construct a set Q from prime numbers between 2 and 67 and the number 1. Then we define a one-to-one mapping
In mapping f, the difference between two encoding numbers can be quite large. For example: 67–2 = 65. To avoid certain amino acids having much higher amplitudes than the others, we further map the 20 numbers in Q onto a unit circle (see Fig. 1) in complex domain.
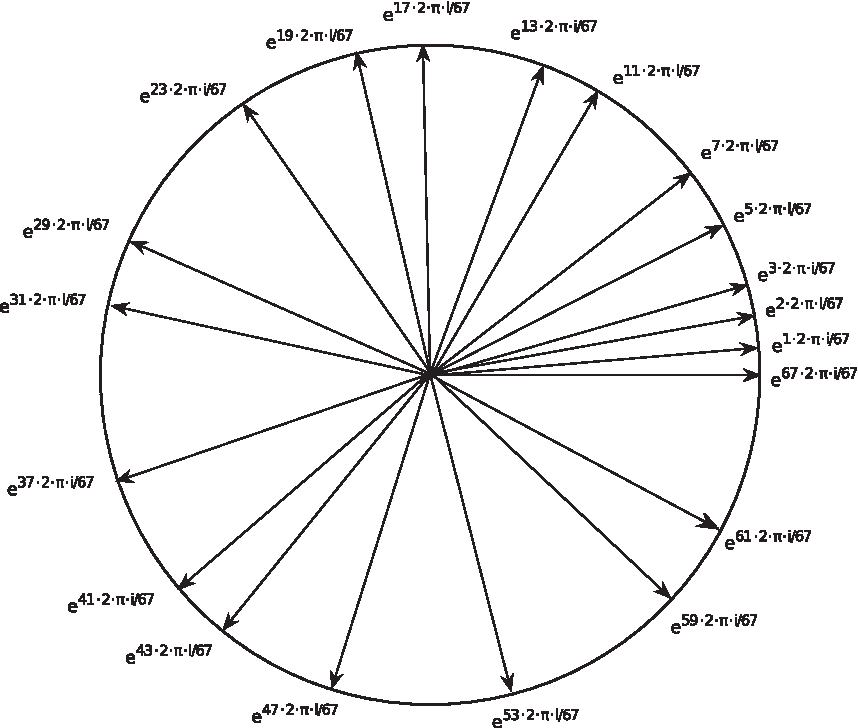
The 20 complex numbers chosen in CPNR divide a unit circle on a complex plane.
Hence, a protein
We call the complex number array
3.2. Functional comparison of proteins in resonant recognition model (RRM)
Here we briefly go over the RRM model (Cosic, 1994), which is the de facto method for functional comparison of proteins based on numerical representation in Algorithm 2. RRM begins by converting two symbolic amino acid sequences
The steps to find
SNR (
RRM (
3.3. Weighted RRM: Combining EIIP and CPNR for higher accuracy
From preliminary experiments, we notice that though CPNR performs better than EIIP, it still cannot give very high comparison accuracy. Hence, we propose a framework to combine the advantages of CPNR and EIIP representations.
3.3.1. Weighted SNR (wSNR)
Our solution to combining EIIP- and CPNR-based functional comparisons is to weight the SNRs obtained from both representations. It is illustrated in Algorithm 3.
Given two proteins
wSNR (
wRRM (
3.3.2. Finding optimized parameters for weighted RRM
Finding the proper values for wx, wy, and t can be modeled as an optimization problem. Denoting the comparison accuracy over a set A of proteins as a function J(A, wx, wy, t), we can define the search for optimal weights wx and wy, and the threshold t as an optimization problem:
The boundaries for wx, wy, and t are chosen based on experience. The optimization problem in Equation 1 is solved by particle swarm optimization (PSO) (Eberhart and Shi 2001), an efficient optimization evolutionary algorithm. In our experiments, we use a set of proteins as the training set to find optimal parameters and use another set of proteins to test the accuracy. Cross-validation is used to test accuracy on different training and test sets.
3.3.3. Weighted RRM as a learning problem
The optimization problem in this paper could also be transferred into a binary classification problem (learning problem). In the learning problem, each pair of proteins has a 4-D feature vector, namely
4. Experimental Results
In order to empirically study the performance of CPNR, we compare it with EIIP. All proteins from the same group are considered as having the same function; Otherwise, different functions.
4.1. Metrics
We use the confusion matrix to measure the performance of functional comparison of proteins. Protein pairs having the same function is considered “positive.” Otherwise, it's “negative.” Algorithm output has four possible outcomes of computational functional comparison: (1) True positive (TP); (2) false positive (FP); (3) true negative (TN); (4) false negative (FN). The metrics mentioned above are summarized in Table 6.
Four values are defined for later analysis of algorithm performance: (1) True positive rate (i.e., sensitivity),
4.2. Results on individual representations
Results on using individual numerical representations are summarized in Table 7. Since the SNR threshold t contributes directly to the accuracy, we run tests on several different SNR thresholds. For the sake of space, we only report the results from the two best SNR thresholds, t = 2 and t = 3.
Table 7 shows the performance of the two numerical representations. CPNR has higher accuracy in both thresholds. As shown in the TPR column of Table 7, the two numerical representations perform well on same-function protein pairs. When using SNR threshold t = 2, CPNR and EIIP both reach TPR values above 95%.
However, both of them reach very low TNR (below 35%) when SNR threshold t = 2. Comparing the results of using two SNR thresholds, the two representations exhibit better overall performance when using SNR threshold t = 3.
Unfortunately, neither CPNR nor EIIP can achieve good accuracy (below 70%). This observation inspires us to develop the weighted RRM as discussed earlier in Section 3.3.
4.3. Results when combining representations
In Section 3.3, we develop a framework, weighted RRM, to combine the advantage of CPNR with EIIP. To evaluate the objective function that we established in Section 3.3.2, we use an exhaustive cross-validation scheme. Each time, four groups of proteins are used as the training set, and the remaining three groups as the test set. No group is used in both training set and test set in any run. The number of proteins in each group is given in the right-most column of Table 1. Since each group has a small amount of samples, to avoid overfitting we carefully pick the combination of training set and test set such that the sizes of the two sets are balanced.
Results on weighted RRM (Algorithm 4) are given in the fourth column of Table 8. The accuracy of Algorithms 2 and 4 are listed in the same table for easy comparison. Boosting average accuracy to 84.25%, combining CPNR + EIIP shows significant performance improvement compared with using any numerical representation alone.
Results of Algorithm 4 and SVM are indicated by cross-validation's average value.
For the sake of space, we are not able to list weights for each run in the cross-validation. Weights for EIIP or CPNR converge to similar values (w1: –0.92 for EIIP and w2: 48.09 for CPNR) regardless of the training and test sets. The convergence shows that our approach for combining CPNR and EIIP is robust. In most cases, we observe that w2 > w1, meaning that CPNR is given a higher trust level than EIIP by our PSO-based optimization. This observation in turn supports that CPNR is better than EIIP.
As mentioned earlier, weighted RRM can be considered as a supervised learning problem as well. Besides Algorithm 4, we also use SVM as the classifier for the comparisons in this work (the SVM approach, Section 3.3.3). The result is given in the last column of Table 8. The overall accuracy of RBF-SVM is 81.53%, which is very similar to that of the PSO-based approach above.
5. Discussion
5.1. On SNR threshold
In our experiments, we notice that the SNR threshold t affects the accuracy greatly. In Section 4.2, we compare the results of using two different SNR thresholds in Algorithm 2, respectively. When SNR threshold t = 2, there is a big difference between TPR/NPV and TNR/PPV (high TPR/NPV and low TNR/PPV) for both numerical representations. Both representations perform well in the comparisons in same functional pairs (90% or even higher). However, both of them make too many false negative decisions for protein pairs of different functions. The highest TNR of the two representations is only 32.81% while the highest PPV is only 58.69% (both achieved by CPNR). The low TNR and PPV values lead to low accuracy, the highest of which is 64.12% when using CPNR.
When the SNR threshold increases from 2 to 3, there is an improvement of TNR and PPV. TNR increases for both numerical representations greatly (at least 20% improvement). No representation gives extremely low TPR, TNR, PPV, or NPV. We should also be aware that there is a side effect: While TNR and PPV increase with higher threshold, TPR and NPV both decrease. Various SNR thresholds have been tested in a series of pre-experiments and t = 2 and t = 3 are the two best ones.
5.2. On algorithm evaluation
Because proteins have different functional groups, any two proteins are more likely to be of different functions than of the same function. In such cases, it is very important to know the ratio or difference between testing outcome positive (i.e., TP + FP) and condition positive (i.e., TP + FN), as well as the ratio or difference between testing outcome negative (i.e., TN + FN) and condition negative (i.e., TN + FP). Based on this, we propose two new statistical metrics to measure the biases within positive and negative groups, respectively. We call them PositiveDeviation (PD) and NegativeDeviation (ND), which are defined as follows:
In this paper, PD denotes the statistical difference between biological positive and computational positive, while ND denotes the statistical difference between biological negative and computational negative.
Table 8 summarizes values of all statistical measures on the performances of Algorithms 2 and 4. A good algorithm is expected to have higher values on TPR, TNR, PPV, NPV, and accuracy, but lower values on PD and ND.
According to Table 8, Algorithm 4 has improved TNR and PPV greatly than using individual representations in Algorithm 2. Compared to Algorithm 2, the statistics biases PD and ND decrease greatly by Algorithm 4. Lower PD and ND prove that the new algorithm can more precisely describe the distribution of protein sequences in group(s).
Also, Algorithm 4 overcomes the disadvantage of Algorithm 2, which is low accuracy on different functional groups. No matter how we change the representation and threshold, Algorithm 2 always give unacceptably low TNR and PPV. Though a higher SNR threshold gives better TNR and PPV for Algorithm 2, TPR and NPV will be inevitably decreased.
The final accuracy of Algorithm 4 based on PSO is 84.25%, almost 20% higher than that of Algorithm 2. Algorithm 4 gets much better overall performance, with TPR, TNR, PPV, and NPV all over 80%. It will give biologists credible protein comparison results and save precious time on benchwork.
6. Conclusion
Designing a numerical representation of amino acids is an important component toward applying numerical methods to compare the function similarities of two proteins. The state-of-the-art numerical representations of amino acids suffer from degeneracy due to their designs. Inspired by the similarity between the pattern of prime numbers and the number of codons of amino acids, we propose a new approach CPNR to the numerical representation of amino acids. Compared with EIIP, our method does not suffer from degeneracy and delivers significantly improved performance. We further introduce a framework to combine CPNR + EIIP, and promising performance gain is achieved. Future research could focus on new numerical representations. If more representations are considered in weighted RRM, similar to ensemble learning, it may achieve even better performance in different protein functional groups.
Footnotes
Author Disclosure Statement
The authors declare that no competing financial interests exist.