
Abstract
Abstract
Integrons are genetic elements that facilitate the horizontal gene transfer in bacteria and are known to harbor genes associated with antibiotic resistance. The gene mobility in the integrons is governed by the presence of attC sites, which are 55 to 141-nucleotide-long imperfect inverted repeats. Here we present HattCI, a new method for fast and accurate identification of attC sites in large DNA data sets. The method is based on a generalized hidden Markov model that describes each core component of an attC site individually. Using twofold cross-validation experiments on a manually curated reference data set of 231 attC sites from class 1 and 2 integrons, HattCI showed high sensitivities of up to 91.9% while maintaining satisfactory false-positive rates. When applied to a metagenomic data set of 35 microbial communities from different environments, HattCI found a substantially higher number of attC sites in the samples that are known to contain more horizontally transferred elements. HattCI will significantly increase the ability to identify attC sites and thus integron-mediated genes in genomic and metagenomic data. HattCI is implemented in C and is freely available at http://bioinformatics.math.chalmers.se/HattCI.
1. Introduction
I
The attC sites are from 55 to 141 nucleotide (nt) long imperfect palindromic sequences that show a low degree of conservation across different gene cassettes. These sites carry two pairs of complementary motifs. The first pair, R″ and R′, is each 7 nt long and located in the 5′ and 3′ end of the attC site, respectively. The motifs of both R″ and R′ are partially conserved between attC sites from different gene cassettes and have the form of RYYYAAC and GTTRRRY, respectively (where R is a purine and Y is a pyrimidine). The second pair, the L″ and L′ motifs, is 8 and 7 nt long and located downstream of R″ and upstream of R′, respectively. The L″ and L′ motifs show a lower degree of conservation than the R″ and R′. The regions between R″ and L″ and between L′ and R′ consist of short spacers of variable length, typically 7–8 nt. These spacers are neither complementary nor do they show any considerable degree of conservation. Finally, the central motif between L″ and L′, often denoted the loop, is of length between 14–102 nt and shows a low degree of conservation, but forms an imperfect inverted repeat (Stokes et al., 1997). The attC sites are vital for mobilization of gene cassettes in and out of integrons (Hall et al., 1991) and can therefore serve as markers for genes that are horizontally transferable.
Several methods have been developed for the identification and analysis of integrons in DNA sequences. The INTEGRALL database contains information about the general structure of integrons, including the integrase gene (intI) and the present gene cassettes (Moura et al., 2009). The Repository for Antibiotic resistance Cassettes (RAC) is specialized in organizing gene cassettes carrying antibiotic resistance genes (Tsafnat et al., 2011) and has implemented an integrated annotation system called Attacca for automatic identification of gene cassettes in DNA sequences. Attacca uses context-driven grammars, where a set of deterministic rules are used to match the characteristic motifs of the start and end of attC sites in the presence of open reading frames and other features of the integron such as the attI site (Tsafnat et al., 2009). Another method is ACID, which identifies the structure of the full integron by recognizing the intI gene and the attC sites of each gene cassette. In this method, intI is identified using BLAST (Altschul et al., 1990), and the attC sites are identified by verifying the presence of their complementary motifs (Joss et al., 2009).
While these methods have provided satisfactory results, they are in essence deterministic and can thus not efficiently handle technical noise and the large biological variability encountered in DNA sequences. Instead, we argue that the identification of attC sites seems more suitably tackled by probabilistic approaches, which can appropriately model different types of variation. Moreover, the existing methods rely on the identification of the attC site, together with other parts of the integron structure, such as the open reading frame in the corresponding gene cassette or the integrase gene (intI), which requires long contiguous DNA stretches for reliable identification. Modern high-throughput DNA sequencing technology is, however, known to produce highly fragmented data with high error rates and where the assembly of longer contiguous sequences is often challenging.
This is particularly true in metagenomics, where entire communities of microorganisms are studied by observing random fragments of their genomes. The assembly of complete integrons from metagenomic data can be especially problematic due to its many repetitive regions, combined with the often low sequencing coverage (Kristiansson et al., 2011; Wu et al., 2012; Bengtsson-Palme and Larsson 2015). Hence, information of the complete integron structure is thus often not available. Also, none of the existing methods is designed to analyze large data sets. In particular, Attacca relies on a manual step for verification of the predictions, which makes it inapplicable to large volumes of genomic and metagenomic data that may contain many thousands of attC sites. Novel methods for identification of attC sites, which are also applicable to fragmented metagenomic sequence data, are therefore required and would enable an accurate analysis of which bacterial genes can be horizontally transferred by integrons, independent of the data context in which it is considered.
In this article, we present HattCI, a new method for fast identification of attC sites in DNA sequence data based on hidden Markov model (HMM). The method divides the motifs of an attC site (R″, R′, L″, L′, spacers, and loop) into separate states and models their specific sequence characteristics, including both their length and the internal dependences of their nucleotide composition. The model parameters are estimated from a reference data set containing 231 nonredundant attC sites from class 1 and 2 integrons, which was created by careful manual assessment of previously reported attC sites. Cross-validation showed that HattCI has sensitivity of up to 91.9% for detecting the attC sites, while maintaining satisfactory false-positive rates (FPR). Moreover, HattCI was applied to a total of 64 gigabases of metagenomic data sequenced from bacterial communities collected in 35 different environments. The relative abundance of attC sites was estimated up to 2.33 occurrences per megabase, where the highest abundances were found in samples that have been previously shown to be associated with high frequencies of horizontal gene transfer elements.
2. Materials and Methods
2.1. Modeling attC sites with generalized HMMs
In this article, we present a generalized hidden Markov model (gHMM) for the identification of attC sites in DNA sequence. A standard discrete-time HMM is a stochastic process formed by two interrelated processes. The first process is hidden from the observer and is a Markov chain that jumps between states in a state space at each time step. The second process is observed and generates one output symbol per step as a function of the underlying hidden state. Through a number of self-transitions into the same state, we can then observe a state length (i.e., a sequence stretch corresponding to a DNA motif) of random length, which, by definition, will follow a geometric distribution, something that is not always a suitable model.
In a gHMM, the length distribution is generalized to any distribution of our choice, and in each time step, the model emits an entire stretch of observed sequence of random length
where we let
In our attC model, we assume that the Markov chain
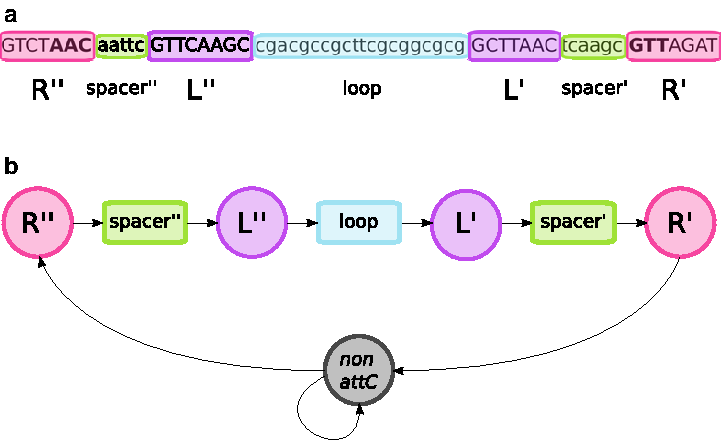
Overview of the HattCI HMM model.
2.1.1. The R″ and R′ states
The R″ and R′ motifs have the form of RYYYAAC and GTTRRRY, where R symbol is purine and Y pyrimidine (Stokes et al., 1997). Thus, their corresponding states have a fixed length of 7 nt (Fig. 1a), with three conserved positions (AAC for R″ and GTT for R′) across all attC sites. Since a substantial number of attC sites does not follow the purine/pyrimidine pattern for either R″ or R′ (Partridge et al., 2009) (see also our reference data set below), we relaxed these restrictions on the remaining four positions by using a pseudocount-induced empirical distribution for all possible 4-tuple combinations.
2.1.2. The spacer states
As motifs, the spacers are nonconserved elements with variable lengths of about 5 nt (Fig. 1a). The length was modeled using an empirical distribution for lengths between 3 and 7 nt for the leftmost spacer (spacer″) and between 3 and 12 nt for the rightmost spacer (spacer′). The nucleotide composition was described by a first-order Markov model
2.1.3. The L″ and L′ states
The L″ and L′ motifs have fixed lengths of 8 and 7 nt, respectively (Fig. 1a), and exhibit a lower degree of conservation across attC sites in comparison to the R-motifs. One important feature of the L-motifs is the presence of an extrahelical nucleotide in L″ due to the difference in the length of L″ and L′. The bulge formed by this extra nucleotide, which is most often a guanine with variation happening eventually (Larouche and Roy, 2011), has been shown to be crucial for the binding of the integrase (Johansson et al., 2004; MacDonald et al., 2006). The lower conservation leads to many more possible combinations for each motif, in comparison to the R-sites. Thus, the L-motifs were modeled using position-specific scoring matrices (PSSMs) (Staden, 1984). A PSSM represents a motif by assigning a probability for each nucleotide in each motif position. In this way, the model of the L″ is capable of capturing the information about the bulge it forms when folded.
2.1.4. The loop state
The loop of an attC site is a 14–102 nt imperfect palindromic region between the L″ and L′ motifs (Fig. 1a). The loop is long relatively to the other motifs of the attC site and thus providing an important contribution to the total likelihood despite its low conservation. However, the imperfect palindromic nature of the loop makes it less straightforward to model, and therefore, we evaluated Markov models of different orders (first to fourth order) to capture the loop nucleotide dependencies. In addition, the length of the loop varies substantially between attC sites, and we therefore compared three different length models: (1) a geometric distribution (i.e., a standard HMM), (2) a gamma distribution, and (3) an empirical distribution. The gamma and the empirical distributions were both truncated between 6 and 120 nt.
2.1.5. The non-attC state
This state, which models the regions outside the attC site, was defined by a standard HMM (with unit output resulting in geometrically distributed state lengths), with a first-order Markov model as distribution to describe the nucleotide composition and dependencies of the non-attC site regions.
2.2. Predicting attC sites
HattCI predicts attC sites in an observed DNA sequence by using the Viterbi algorithm to predict the optimal underlying state sequence. For each state
and with pointers
In practice, at each state index
In this study, we require all the motifs of the attC site to be present in the analyzed sequence for the identification, but this could easily be relieved by allowing the model to start in any state (instead of just the non-attC site). However, since the individual motifs of the attC site are rather short, we expect that this would substantially reduce the performance of the model.
2.3. Parameter estimation
Transition probabilities and nucleotide composition distributions were estimated using maximum likelihood, which, within the gHMM framework, corresponds to the relative frequencies of the corresponding events in the training set (Axelson-Fisk, 2015). Pseudocounts were added to the estimation of the parameters to allow for rare events not present in the training data. The optimal number of pseudocounts was investigated using cross-validation (Section 2.5). The gamma distribution for the loop length was fitted to the observed lengths using numerical maximum likelihood. The empirical distribution was estimated from the observed loop lengths and smoothed using the Gaussian kernel interpolation, applying a bandwidth of 5.358 (van der Vaart, 2000).
2.4. Reference data set
The HattCI model was trained and evaluated on a reference data set consisting of 231 attC sites. This data set was based on the gene cassettes previously described by Partridge et al. (2009) and contains mainly class 1 and 2 integrons. Using their accession numbers, the entire nucleotide sequences containing the reported attC sites were downloaded from GenBank (Benson et al., 2009) in September 2015. The coordinates for all attC sites in Partridge et al. (2009), together with the attC sites of other gene cassettes present in the sequences, were extracted, those that were redundant were discarded, and the remaining nonredundant data set was annotated as follows. The R″/R′ motifs were identified at the edges of each attC site. Then, L″ and L′ were annotated by searching for complementary pairs and a bulge within the range of possible distances from R″ and R′, respectively. The reference data set and its full annotation are available in Supplementary Material—Section B.
2.5. Model evaluation
The performance of our model was evaluated using the model sensitivity (Sn), which measures the capability to detect the attC sites in the reference data set. The sensitivity is defined as follows (Burset and Guigo, 1996):
where true positives (TP) are the number of correctly predicted attC sites in our reference data set and false negatives (FN) are the number of missed attC sites. We also evaluated the model based on the FPR, which is the number of false predictions made in sequences where no attC sites are present. The FPR is defined as
where false positives (FP) are the number of falsely predicted attC sites and DS (database) is the size (in megabases) of the sequence database searched. This database was created by random reshuffling of the Escherichia coli K-12 genome (GenBank accession number NC_000913.3). The model performance (Sn versus FPR) can be adapted by changing the significance cutoff
Twofold cross-validation experiments were performed by randomly splitting the reference data set into two equally sized subsets and using one for parameter training and the other for validation. This procedure was repeated 100 times. The significance cutoff
2.6. Metagenomic data
Quality assessed metagenomic sequence data were downloaded from the CAMERA database (Seshadri et al., 2007). Only samples with an average fragment length of 150 base pairs and at least 40,000 fragments were included in the study, resulting in 35 data sets comprising 64 gigabases in total (see Supplementary Material—Section C for a list of included data sets). HattCI was used to search for attC sites in both strands—in all, 168,749,505 fragments in the data sets. A significance cutoff of 7.5 was used. For each data set, the relative abundance of attC sites was calculated by comparing the number of identified sites to the total number of nucleotides.
3. Results
3.1. Model evaluation
The HattCI model was evaluated based on the sensitivity and FPR estimated through cross-validation experiments performed on our reference data set containing 231 manually annotated attC sites (see Materials and Methods). The performance of the model was investigated in relation to (a) the number of pseudocounts added to the parameters of the nucleotide composition of R″ and R′, (b) the number of pseudocounts added to the parameters of the nucleotide composition of the L″ and L′, (c) the order of the Markov model describing the nucleotide dependencies in the loop, and (d) the distribution used to model the length of the loop. First, the amount of pseudocounts for the nucleotide composition of the R″ and R′ was varied between 1 and 20, while keeping the number fixed to one for the other motifs. Increasing the number of pseudocounts for R″ and R′ resulted in a decreased model performance (Fig. 2a). At a fixed FPR of 1 hit/Mbase, the sensitivity was 0.829 and 0.793 for 1 and 5 pseudocounts, respectively. The sensitivity decreased further when more pseudocounts were added, resulting in a sensitivity of 0.765 for 10 pseudocounts and 0.742 for 20 pseudocounts. This decrease in performance is likely due to the high conservation of the motifs, and we therefore used pseudocount 1 in the final R-motif models.
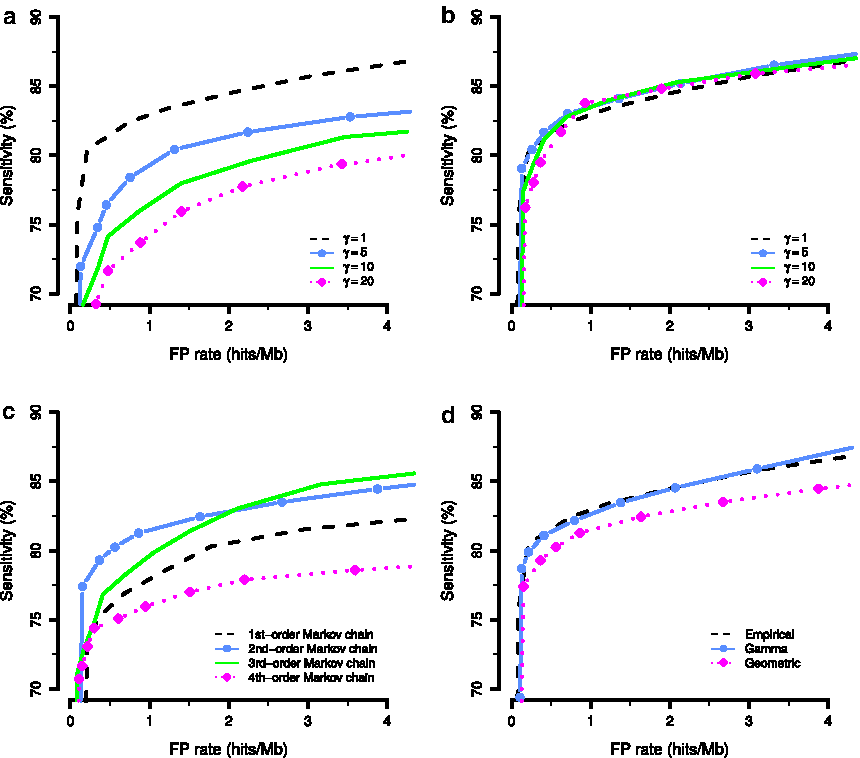
Receiver operating characteristic (ROC) curves describing the sensitivity and the false-positive rate (FPR) for the model under different settings.
Similarly, we investigated the addition of 1 to 20 pseudocounts to the nucleotide composition parameters of L″ and L′, while the pseudocounts used in the other motifs were set to 1. In contrast to R″ and R′, adding pseudocounts to the L″ and L′ distributions resulted in an increased performance (Fig. 2b). For an FPR of 1 hit/Mbase, the sensitivity was 0.829, 0.835, 0.836, and 0.839 for 1, 5, 10, and 20 pseudocounts, respectively. Since the sensitivity at 20 pseudocounts was substantially reduced at both lower and higher FPR compared to the other options, we decided to use 10 pseudocounts for the L-motifs. The increase in performance when adding pseudocounts reflects the more variable nature of the L-motifs and prevents overfitting.
Next, the model for the loop state was evaluated. First, the order of the Markov model for the nucleotide dependencies was varied between first and fourth order (the pseudocounts for the nucleotide composition was fixed at 1 for all motifs). The cross-validation showed that the model with second-order dependencies resulted in the highest sensitivity (Fig. 2c), 0.815, at an FPR of 1 hit/Mbase. The corresponding performance for first-, third-, and fourth-order Markov models was 0.779, 0.796, and 0.760, respectively. We then investigated the impact of the length distribution on the model performance, in which the standard geometric distribution was compared to the more flexible gamma and the smoothed empirical distributions (see Materials and Methods). At an FPR of 1 hit/Mbase, the geometric distribution resulted in a sensitivity of 0.815, while the gamma and the smoothed empirical distributions both had higher sensitivities of 0.826 and 0.829, respectively (Fig. 2d). To maximize the sensitivity, we decided to model the loop sequence using a second-order Markov model and a smoothed empirical length distribution.
3.2. Final model performance
The final HattCI model was set to use pseudocount 1 for the R-motifs and the loop and pseudocounts 10 for the L-motifs and the spacers, respectively (see Supplementary Material—Section D for details on the pseudocounts of the spacers and the loop). For the loop, the nucleotide dependencies were modeled using a second-order Markov model and the length described by a smoothed empirical distribution. Cross-validation showed that the final model had a sensitivity of 0.853, at a fixed FPR of 1 hit/Mbase (Fig. 3a). The corresponding Viterbi scores discriminated between the true and the FP well (Fig. 3b). By changing the significance cutoff
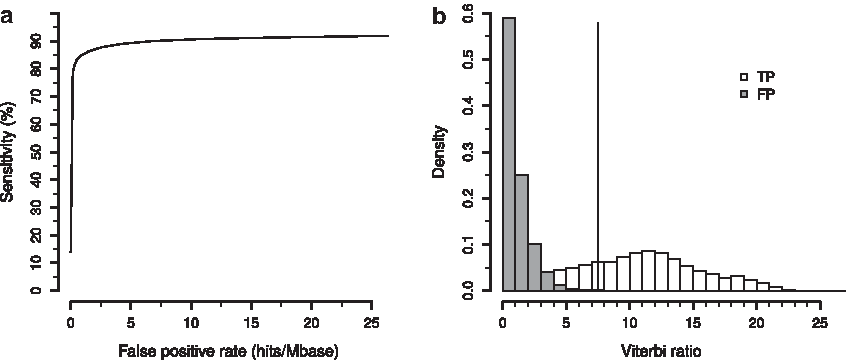
Cross-validation of the performance of the final model.
N indicates how many attC sites in the reference data set that were used for testing. TP gives the number of sites whose HattCI prediction agreed perfectly with the GenBank annotation. FN (partial) corresponds to the attC sites whose prediction coordinates just covered parts of the real attC site and were thus counted as FN. FN (total) is the number of attC sites that were not covered at all by any of the predictions, and FPR is the number of attC sites found per megabase in the reshuffled Escherichia coli genome.
FN, false negatives; FPR, false-positive rate; TP, true positives.
3.3. Metagenomic data analysis
HattCI does not require information of the overall integron structure for the prediction of attC sites and can therefore be applied directly to fragmented sequence data. In this study, we used HattCI to estimate the abundance of integron-mediated genes in 35 metagenomes representing different types of bacterial communities (Seshadri et al., 2007). The metagenomes consisted of 168,749,505 sequence fragments comprising 64 gigabases in total. A strict significance cutoff of
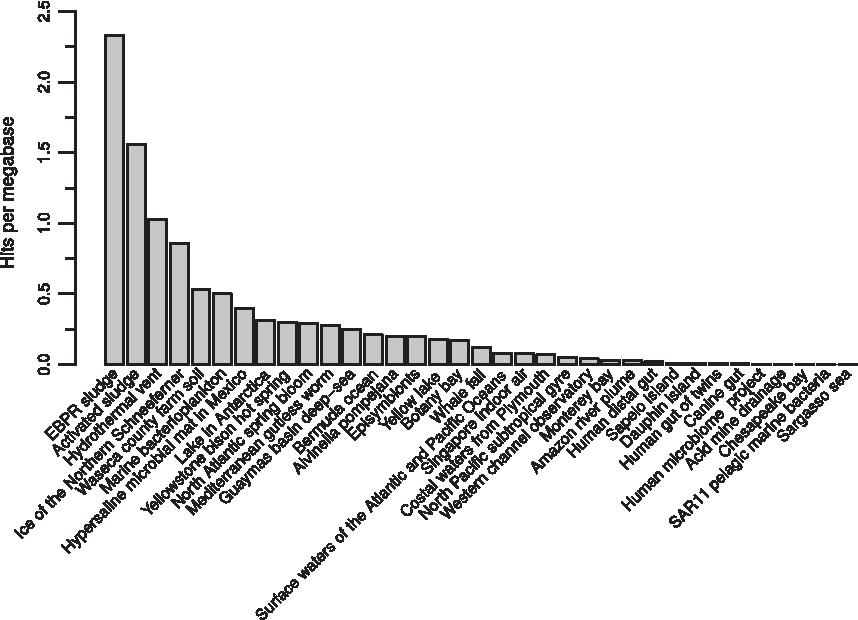
The number of attC sites found per megabase in metagenomic data. The number of attC sites found per megabase (y-axis) is shown for 35 metagenomic samples of the CAMERA project (Seshadri et al., 2007).
3.4. Availability and time performance
The HattCI model was implemented in C as a command line tool for the Unix/Linux computer environment. The model was parallelized by distributing the input data over different threads using OpenMP. Using one thread, HattCI can process ∼5 gigabases per hour (Supplementary Material—Section F). The analysis can be further accelerated by increasing the number of parallel processes used. The program, including documentation, tutorials, and source code, is freely available under the GPL v3 license at http://bioinformatics.math.chalmers.se/HattCI/.
4. Discussion
Integrons are genetic elements that facilitate the horizontal transfer of genes between bacterial genomes. The attC sites, which are essential for the incision and excision of gene cassettes in and out of integrons, are 55 to 141 nt long indistinct patterns. In this article, we present HattCI, a novel method for the fast and accurate prediction of attC sites in the DNA sequence. HattCI is based on an eight-state gHMM, with seven states representing the different motifs of attC sites and one state representing non-attC site regions. The performance of HattCI was evaluated by twofold cross-validation using a manually assessed reference data set. At the most sensitive setting, HattCI was able to identify 91.9% of all attC sites in this data set. HattCI was also used to estimate the abundance of attC sites in 35 metagenomes. The highest abundances were found in metagenomes from microbial communities, previously associated with a high level of integron-mediated genes.
The HattCI method describes the attC site by modeling each of its seven distinct motifs as separate states. Two states with a fixed length of 7 nt were used to describe R″ and R′, which are the most conserved motifs of the attC site. They have three out of their seven positions perfectly conserved in all attC sites, making it possible to parameterize the probability of all possible combinations of the remaining four nucleotides. Similarly, two fixed-length states of 8 and 7 nt, respectively, were used to represent L″ and L′. In contrast to the R-motifs, the L-motifs show much less conservation between different attC sites, which made it impractical to parametrize all possible variants. Instead, the nucleotide composition of the L″/L′ states was modeled using PSSMs describing the nucleotide distribution in each position of the motif. Furthermore, the number of pseudocounts added to the nucleotide counts in each state was evaluated using cross-validation. For the R-motifs, a pseudocount of 1 had the highest sensitivity, while the corresponding number for the L-motifs was 10, which reflects the different levels of conservation of these motifs. The R-motifs are well conserved thereby likely to be well represented by the training data sets. Thus, adding too many pseudocounts will blur the true distribution, and the accuracy of the model will deteriorate. The L-motifs are, on the contrary, more variable, and a larger number of pseudocounts were needed to reach the optimal sensitivity, likely because the training data set did not sufficiently cover all variants.
The modeling of the loop required attention due to its low conservation and variability in length. A number of different model assumptions for the loop nucleotide dependencies and the length distribution were therefore evaluated. The nucleotide dependencies were modeled by Markov models of different orders, from first to fourth order. Our results showed that the second-order Markov model had a substantially better performance than the other models. This indicates that the second-order Markov model could capture a considerable part of the local dependencies, while still keeping the number of parameters limited. It should be noted, however, that a Markov model of higher order could be more suitable when more comprehensive training data become available. For the length distributions, both the gamma and the empirical distributions performed considerably better than the geometric distribution that would result from using a standard HMM. The empirical distribution demonstrated the overall best performance, but the difference from using the gamma distribution was small. Since the gamma distribution has a substantial lower number of parameters, it is therefore a good alternative when the training data are more limited.
The final HattCI model demonstrated a good performance in the cross-validation experiments. At the most sensitive setting, HattCI could correctly identify 91.9% of the attC sites in the reference data set, while the number of FP was 26.4 hits per megabase. This makes HattCI highly suitable to pinpoint attC sites and annotate their individual motifs in smaller sequence data sets such as amplicons or plasmid-mediated integrons, which typically are in the order of 10,000 bases. In fact, in contrast to other methods, HattCI provides detailed information of the attC sites, including position of all its separate motifs. When HattCI was run at a higher stringency (with a higher significance cutoff), the FPR was substantially reduced while maintaining a satisfactory sensitivity. At a cutoff of
It should be emphasized that the performance estimated by the cross-validation is likely to be higher than what is to be expected in real genomic and metagenomic data. This is due to a potential bias in our reference data set caused by the overrepresentation of certain types of attC sites in the scientific literature. For instance, integrons carrying an integrase of class 1 are by far the most studied, while integrons with other classes of integrases (e.g., 2 and 3) have not yet received as much attention (Moura et al., 2009). Even though class 1 integrons can excise and incise many types of gene cassettes (Collis et al., 2001), it has a higher affinity for certain types of attC sites (Larouche and Roy, 2011). Thus, the model trained on the reference data set will therefore have the highest performance for identifying attC sites commonly located in class 1 integrons. The performance for identification of an attC site with a different nucleotide composition and/or loop length distribution, for example, attC located in superintegrons, may therefore be reduced. Note, however, that the model has been designed to be highly flexible, and when training data that more accurately reflect the full diversity of integrons, the performance for detecting atypical attC is likely to improve.
HattCI was used to estimate the abundance of attC sites in 35 metagenomes comprising over 168 million DNA fragments. Our results demonstrated a high relative abundance of attC sites in microbial communities sampled from sludges, farm soil, and hydrothermal vents. These environments have previously been associated with a high abundance of integron-mediated genes and other mechanisms for horizontal transfer of genetic materials (Srinivasan et al., 2008; Xie et al., 2011; Gillings et al., 2015; Munck et al., 2015). The metagenomic analysis shows that HattCI can identify attC sites directly in fragmented data without any additional information about the integron structure. Furthermore, several of the metagenomes known to be more pristine demonstrated a very low attC site abundance, in some cases very close to or even below the 0.011 FPR estimated in the reshuffled E. coli genome, which demonstrates that HattCI can maintain a low FPR when applied to real sequence data. Furthermore, the analysis of horizontally transferred elements in metagenomic data is challenging due to its fragmented nature. The assembly is often hard, especially in regions containing repetitive sequences such as present in integrons (Wu et al., 2012; Bengtsson-Palme and Larsson, 2015). HattCI eliminates the need for a high-quality assembly and can therefore be used directly on the fragmented data, to accurately identify and quantify the presence of integron-mediated mobile genes in bacterial communities.
HattCI is based on a gHMM, which is a flexible framework commonly used to efficiently identify patterns in biological sequences (Koski, 2001). The use of a probabilistic approach allows HattCI to explicitly model the variability of attC sites in an efficient way, enabling the identification of other types than the ones present in the reference data set. In addition, probabilistic models provide a likelihood score (the Viterbi score) of a potential attC site to belong to the model, which allows for fine tuning of the performance by adjusting the stringency of the significance cutoff between true attC sites and spurious ones. This probabilistic approach provides such good power in identifying attC sites that extra context of the surrounding integron parts will, in many cases, not be necessary. The gHMM framework has also computationally favorable properties. Indeed, our C implementation of HattCI is highly efficient and can, by using a single core on a modern computer, process over 5 gigabases of DNA sequences per hour. Moreover, HattCI is parallelized such that the input data can be distributed among multiple threads, which increases the performance further. This contrasts with the existing softwares for identification of gene cassettes, which are developed for small data sets and, in some cases, are also dependent on manual steps (Tsafnat et al., 2009).
5. Conclusion
HattCI is a new, versatile, and computationally efficient tool for accurate identification of attC sites in DNA sequence data. HattCI can be used as a stand-alone tool and can be applied directly to large and fragmented data sets such as metagenomes. It would also be possible to integrate HattCI into existing bioinformatic pipelines and thereby increase the overall performance for detecting and annotating complete integron structures, including all its gene cassettes.
Footnotes
Acknowledgments
This research was funded by the Swedish Research Council (VR), the Chalmers Life Science Area of Advance, and the Wallenberg Foundation.
Author Disclosure Statement
No competing financial interests exist.
References
Supplementary Material
Please find the following supplemental material available below.
For Open Access articles published under a Creative Commons License, all supplemental material carries the same license as the article it is associated with.
For non-Open Access articles published, all supplemental material carries a non-exclusive license, and permission requests for re-use of supplemental material or any part of supplemental material shall be sent directly to the copyright owner as specified in the copyright notice associated with the article.