
Abstract
Abstract
Protein kinase C (PKC) is a superfamily of enzymes, which regulate numerous cellular responses. The specific function of PKC protein family is mainly governed by its individual protein domains. However, existing protein sequence classification methods based on sequence alignment and sequence analysis models focused little on the domain analysis. In this study, we introduce a novel protein kinase classification method that considers both domain sequence similarity and whole sequence similarity to quantify the evolutionary distance from a specific protein to a protein family. Using the natural vector method, we establish a 60-dimensional space, where each protein is uniquely represented by a vector. We also define a convex hull, consisting of the natural vectors corresponding to all members of a protein family. The sequence similarity between a protein and a protein family, therefore, can be quantified as the distance between the protein vector and the protein family convex hull. We have applied this method in a PKC sample library and the results showed a higher accuracy of classification compared with other alignment-free methods.
1. Introduction
Protein kinase C (PKC) is a family of homologous protein kinases, which regulate protein activity through phosphorylation (Mochly-Rosen et al., 2012). Drug development efforts often target protein kinases in this family (Mochly-Rosen et al., 2012). There are three types of PKC—conventional PKC (cPKC), novel PKC (nPKC), and atypical PKC (aPKC). cPKC and nPKC contain three domains—C1 domain (C1A, C1B), C2 domain, and the kinase domain (Joydip and Rahman, 2014). aPKCs contain the C1 domain, the Phox and Bem1 (PB1) domain, and the kinase domain (Joydip and Rahman, 2014). Among these domains, the kinase domain phosphorylates residues of proteins, the C1 domain binds diacylglycerol, the C2 domain binds phosphatidylserine and calcium, and the PB1 domain binds target proteins (Joydip and Rahman, 2014). Members of this family provide tantalizing targets for drug development, but our knowledge of drug selectivity levels among different families of PKC proteins is also limited (Philip et al., 1993; Cripps et al., 2002; Ku et al., 2008). Therefore, a better understanding of the differences between PKC families is urgently required for drug development efforts, so PKC enzymes can be targeted more precisely.
The specific function of a protein is mainly governed by the protein domains that it contains. These protein domains are especially useful for predicting the functions of proteins that have not been studied well (Vinga and Almeida, 2003). However, existing methods of protein sequence classification does not take protein domain information into account, ignoring the impact of modular fragments on the full protein function during evolution (Blaisdell, 1986; Torney et al., 1990; Chatr-aryamontri et al., 2007).
We, therefore, introduce a protein classification method based on both full sequence and domain sequence of proteins. We preserve information about the amino acid distribution pattern for each protein by considering the values of the moments of their distribution. Using the natural vector method, we get a 60-dimensional space, with each coordinate dimension corresponding to one moment of the amino acid distribution (Deng et al., 2011). In this way, the protein universe is in one-to-one correspondence with a set of vectors in 60-dimensional space and each protein is uniquely represented by a vector in this 60-dimensional space. The Euclidean distance between two vectors can then be used to measure the similarity of amino acid distributions between the proteins they represent. We also form the convex hull (Vapnik, 2000; Kodell et al., 2009) of the natural vectors corresponding to all members of a protein family. This convex hull represents the set of all proteins that have amino acid distributions that are similar to members of the protein family. The sequence similarity between a protein and a protein family, therefore, can be measured by the distance between the vector corresponding to this protein and the convex hull (Vapnik, 2000; Kodell et al., 2009) corresponding to this family. Our method has the highest classification accuracy compared with other alignment-free methods when applied to PKC classification.
2. Methods
2.1. Natural vectors
The protein universe can be realized as a subset of high-dimensional Euclidean space where a protein is represented by its corresponding natural vector (Deng et al., 2011). The distribution of amino acids of each protein determines one corresponding location in the space through the following formula (Deng et al., 2011):
A protein is represented by its corresponding natural vector
where k denotes 20 amino acids (A,R,N,D,C,E,Q,G,H,I,L,K,M,F,P,S,T,W,Y,V). nk is the number of times the amino acid k appears in the protein sequence, and n is the total number of amino acids in the protein sequence. We define the first amino acid as the origin of one protein sequence. s[k][i] is the distance from the i-th amino acid k to the origin in the protein sequence.
Specifically, when j = 1, this method produces a one-to-one correspondence between protein sequences and vectors in 60-dimensional space:
This protein space construction makes it possible to measure protein similarity using Euclidean distances in this space.
2.2. Convex hull method
The convex hull method is a classification approach that assigns an unclassified vector to one of several sets of vectors in the Euclidean space (Vapnik, 2000; Kodell et al., 2009). Each set of vectors defines a convex hull. An unclassified vector is assigned to the set of vectors that form the nearest convex hull (Fig. 1).
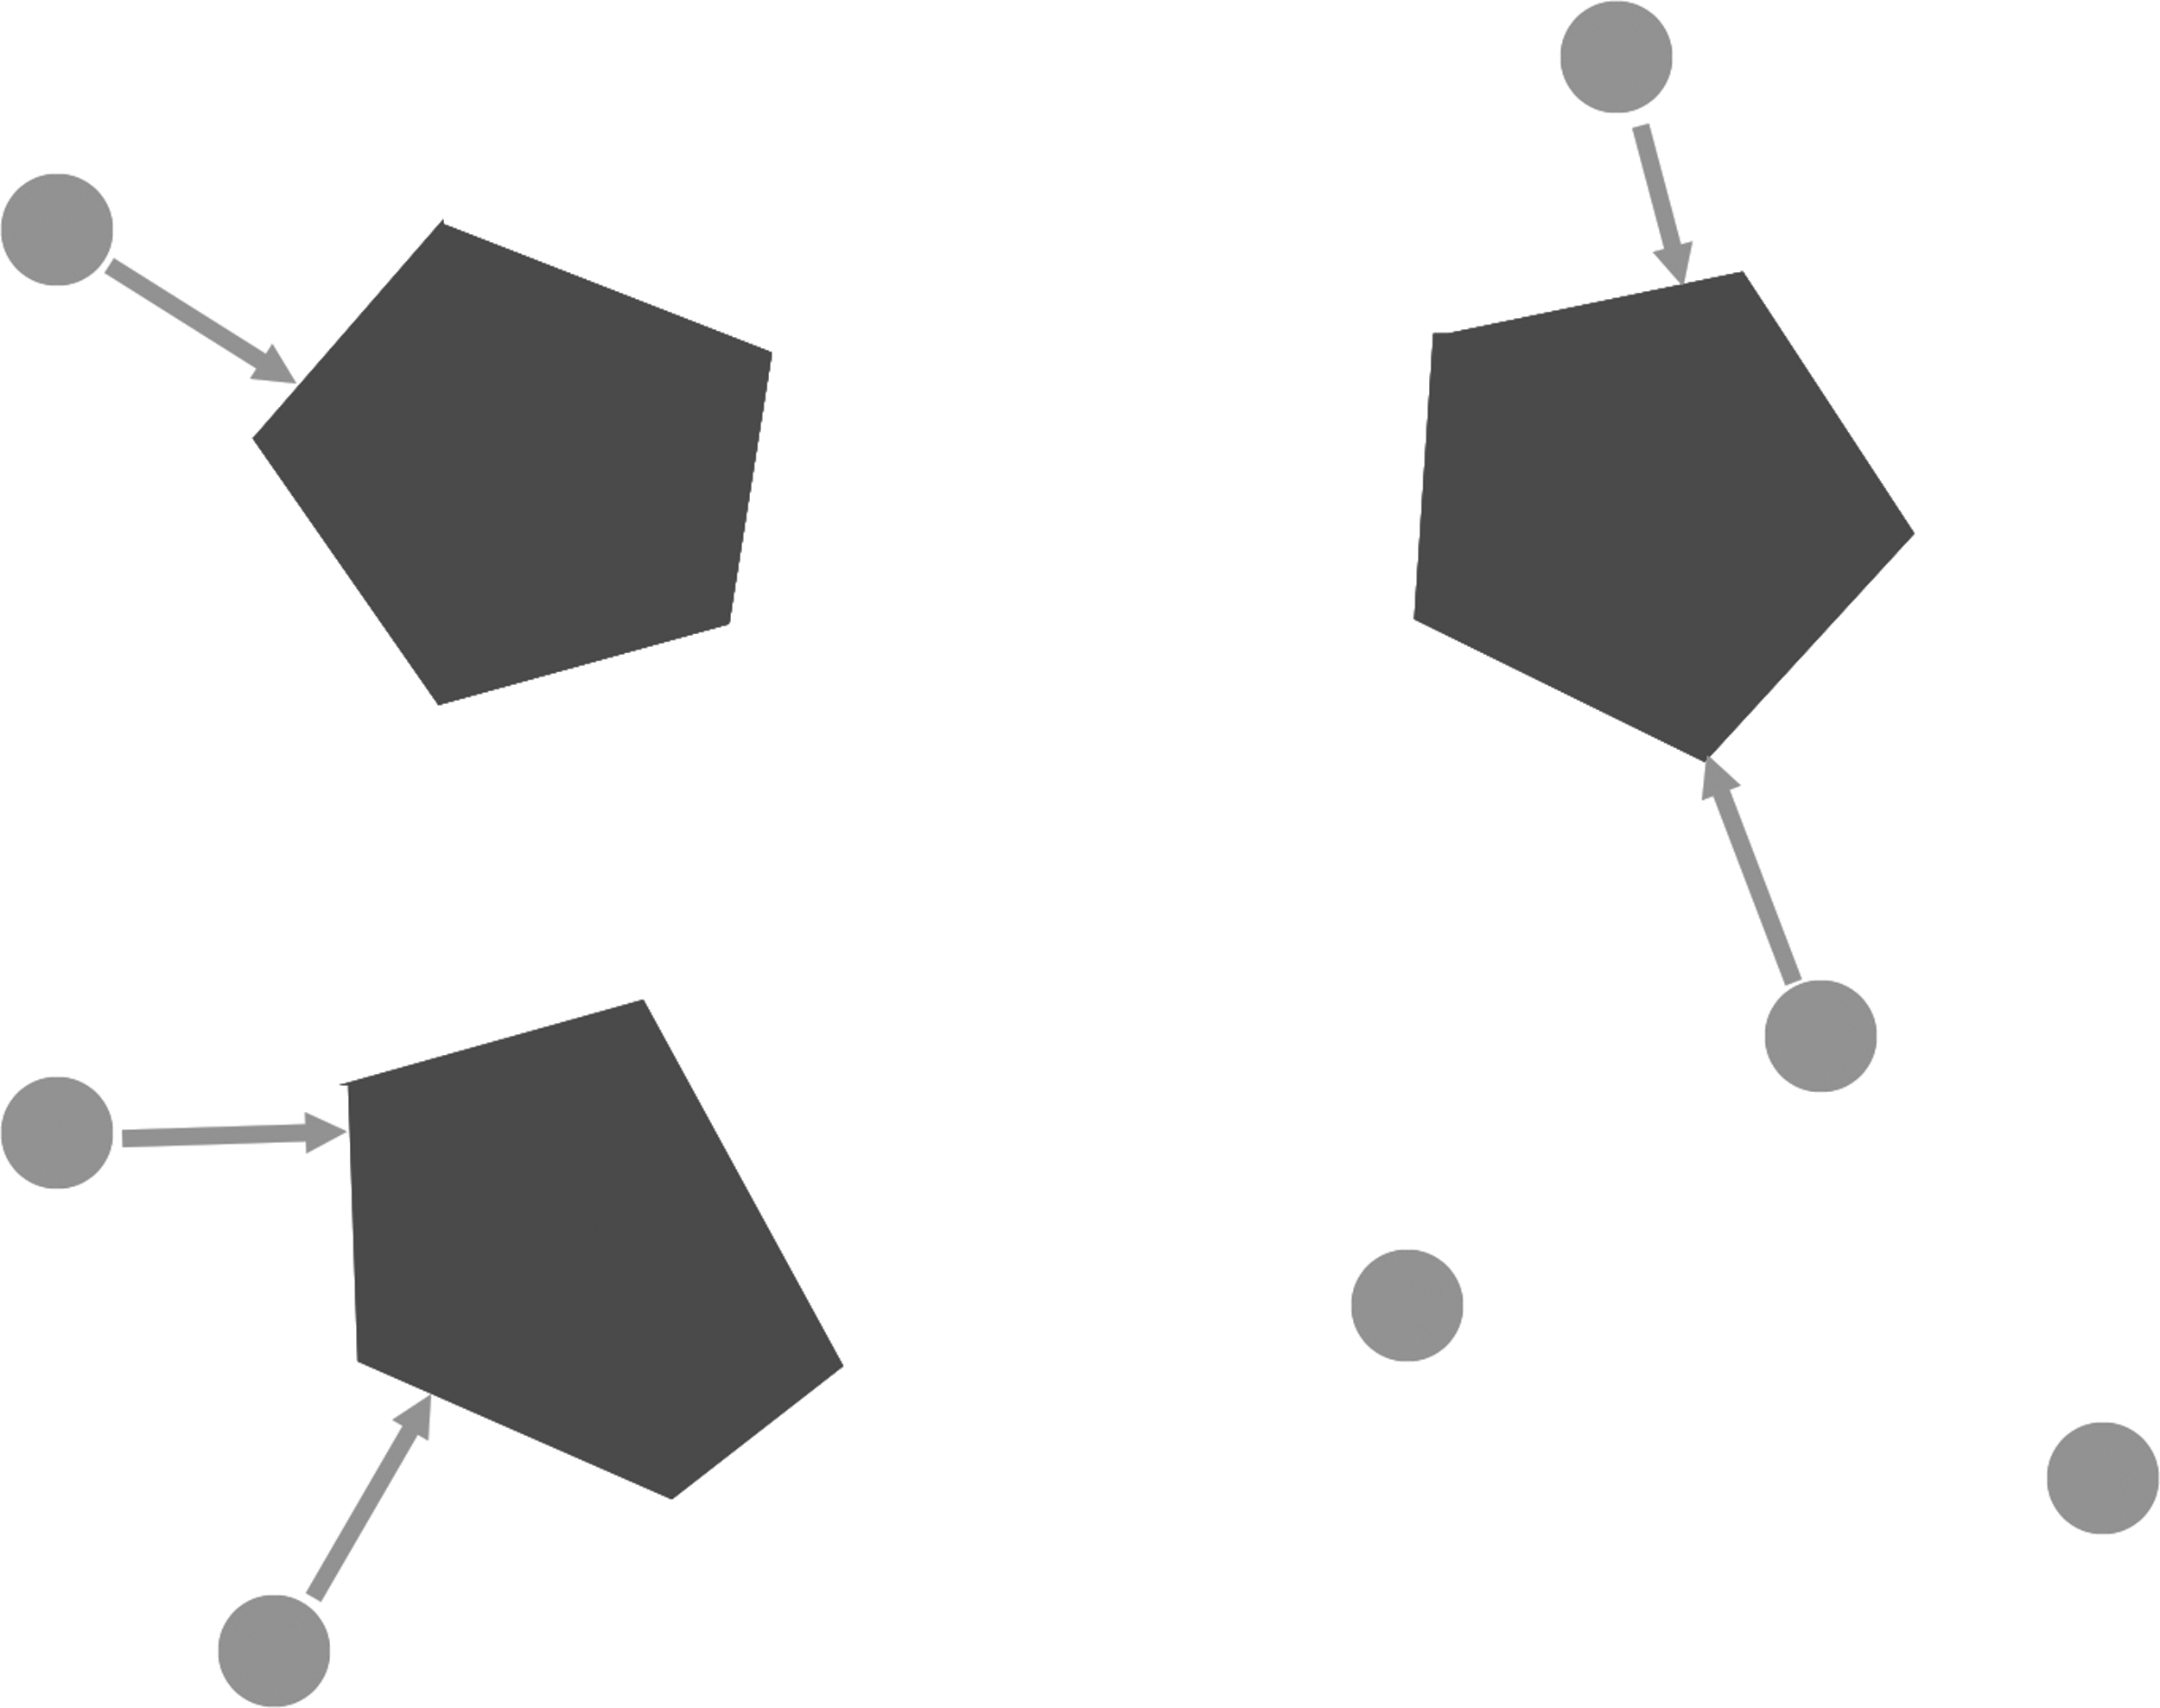
Convex hull method in PKC classification. The convex hull method is an approach that assigns an unclassified point to one of several possible sets of points in the same space, based on the distances from the unclassified point to the convex hulls generated by the members in each group. In this study, unclassified points represent the unclassified protein sequences, and the sets of points represent PKC families. PKC, protein kinase C.
The distance from a vector to a convex hull is defined by a quadratic optimization solution
where Y denotes a vector in the space, Xi, i = 1, 2,…, n, are members in a vector set, and n is the size of the vector set (Vapnik, 2000; Kodell et al., 2009).
In our classification process, we defined three sets of vectors from the PKC whole protein database, with each corresponding to a PKC family. From the PKC domain database, we generated a total of nine sets of vectors based on domain categories. Each set of vectors corresponds to a convex hull in the Euclidean space (Vapnik, 2000; Kodell et al., 2009). Uncategorized protein kinases and their predicted domains were each represented by unclassified vectors.
3. Databases
3.1. Protein kinase C full sequence database
PKC protein sequence database was collected through searching NCBI protein database and checked manually through the annotation of each sequence. This PKC database includes 483 cPKCs, 822 nPKCs, and 648 aPKCs. The accession numbers and species information are in given Supplementary Table S1.
3.2. Protein kinase C domain sequence database
Protein domains are functional modules of whole proteins. Analysis of protein domain sequences has been proved to be an effective method in the study on newly found proteins (Chatr-aryamontri et al., 2007).
We collected PKC domain sequences from the PKC whole protein sequences based on their annotations from NCBI. We categorized our PKC domain database into nine groups, separating C1 domains, C2/PB1 domains, and kinases domains across three families.
3.3. Protein kinase C sample
We used the classified PKC sample from a previously published study as our test library, which contains 35 cPKCs, 37 nPKCs, and 13 aPKCs. The accession number, PKC family, and species information of each PKC are summarized in Supplementary Table S2.
4. Classification Process and Results
The classification is divided into three steps: (1) whole protein distance calculation to the three PKC families, (2) domain discovery and distance calculation to domain convex hulls, and (3) similarity score calculation and classification.
4.1. Whole protein distance calculation to three protein kinase C families
To perform full sequence and domain comparison of an unclassified kinase with each PKC family, we calculated these similarities using the natural vector (Deng et al., 2011) and convex hull method (Vapnik, 2000; Kodell et al., 2009).
We represented the unclassified kinases and the PKC protein sequences from the database as vectors in 60-dimensional protein space using the natural vector method. This enables us to calculate the distance from each unclassified vector to the convex hull defined by the full-length cPKCs, nPKCs, or aPKCs. The distance implies the degree of similarity between a kinase and the specific PKC family (Fig. 2).
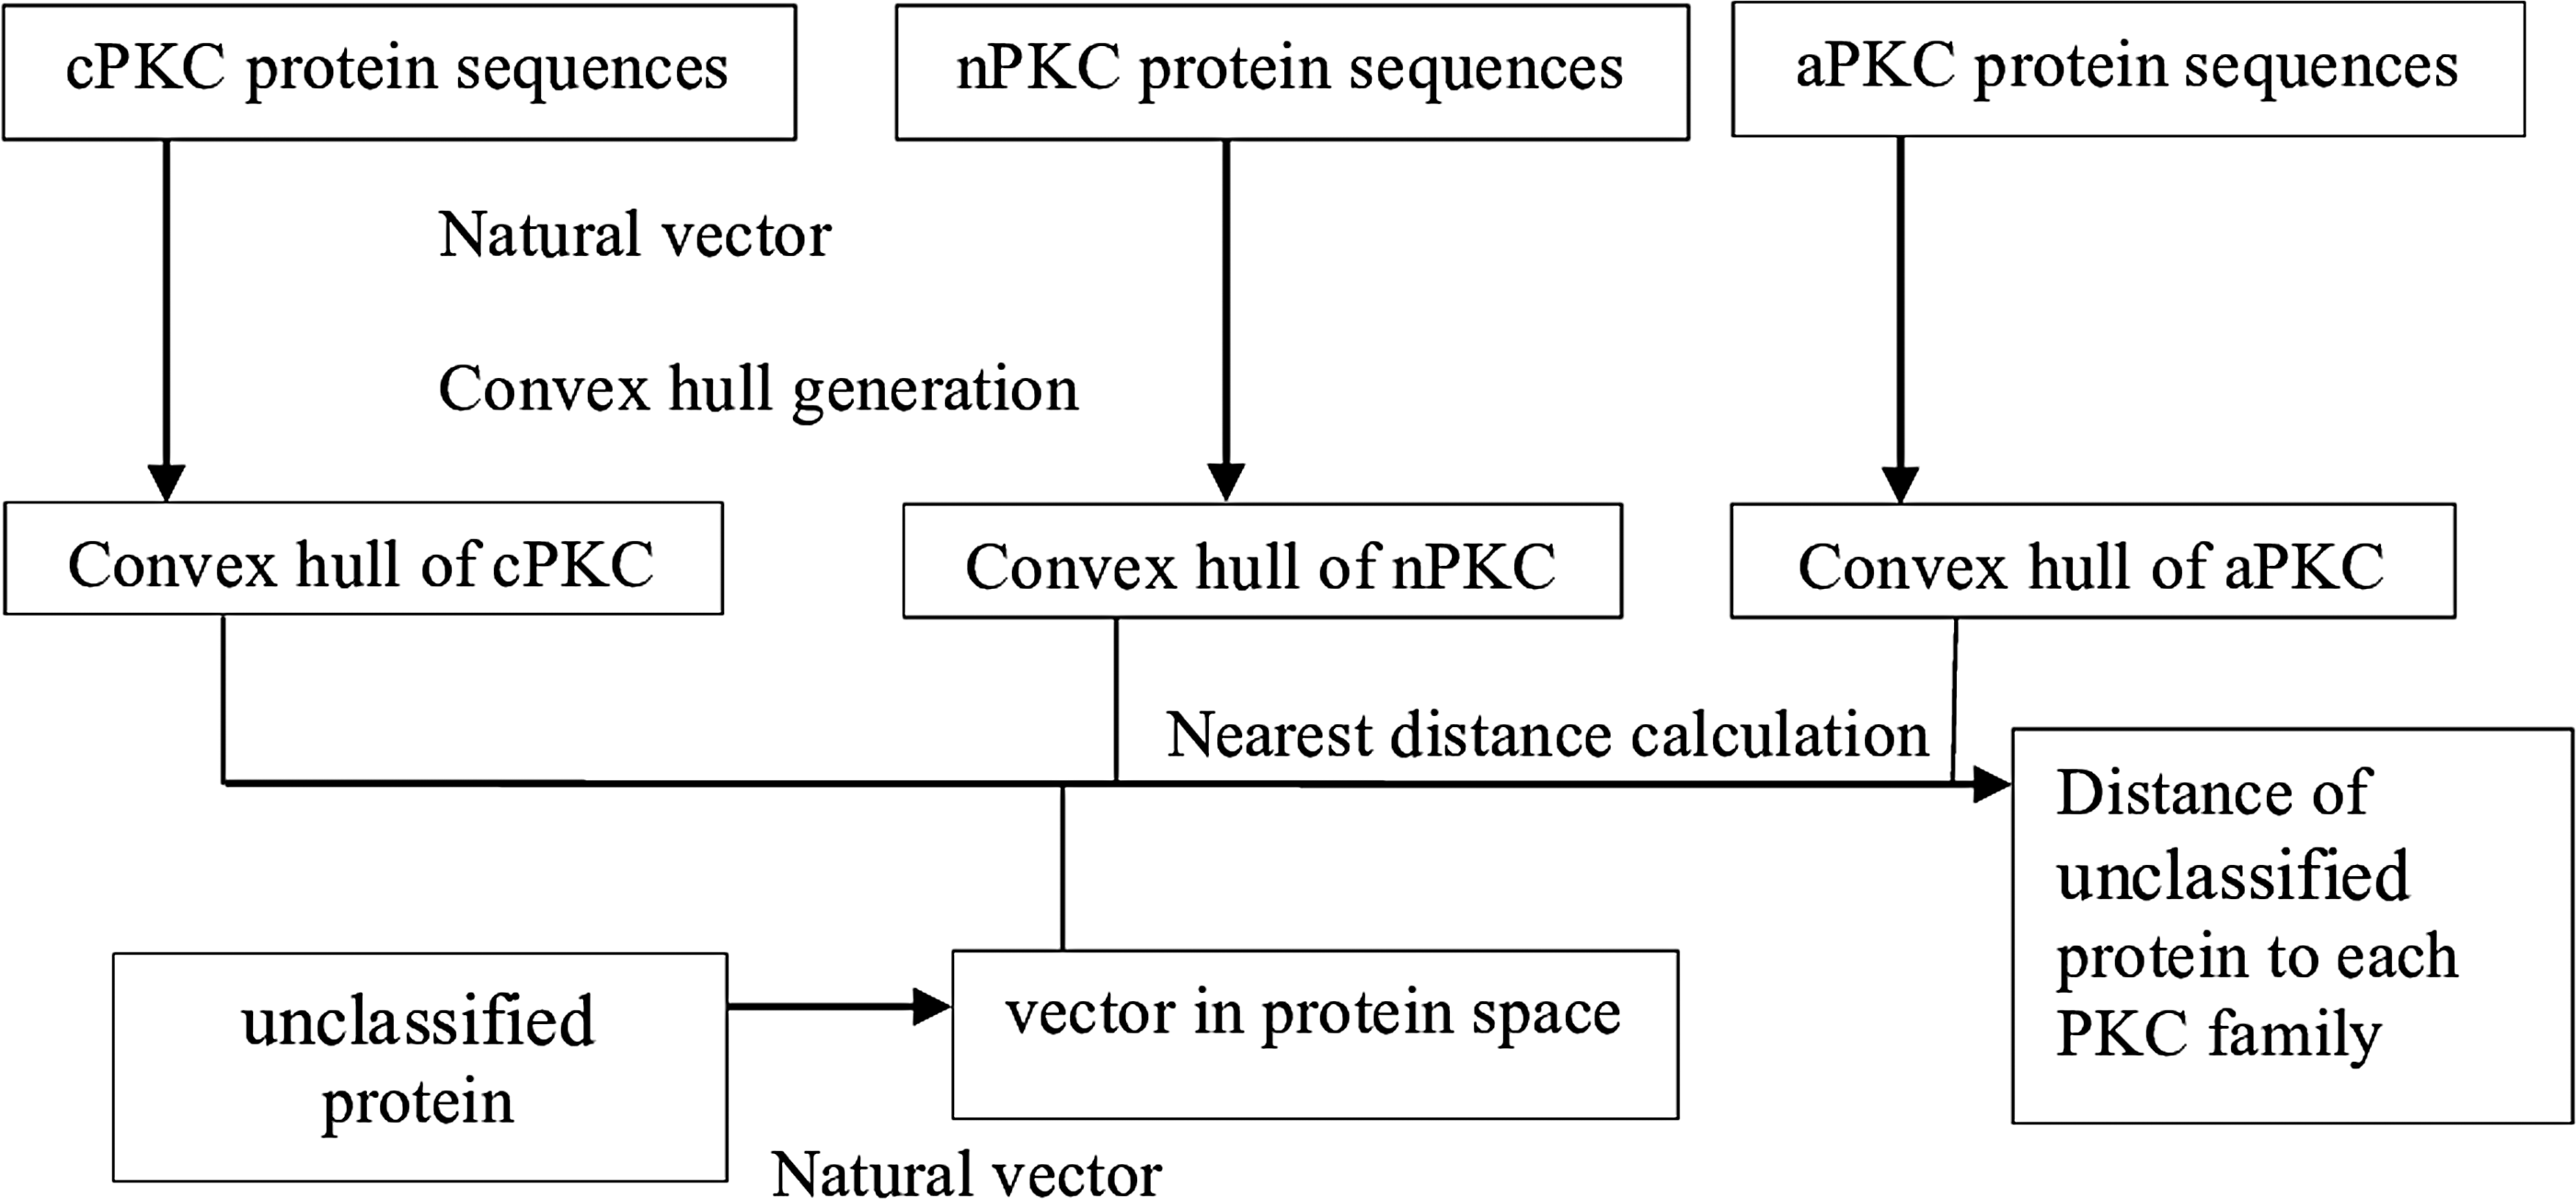
Similarity calculation between unclassified proteins to PKC family using the natural vector and convex hull method. Natural vectors of unclassified proteins and PKCs are calculated, and the convex hulls corresponding to each PKC family are generated from the vectors of PKCs in corresponding family. Subsequently, we measured the distance between each unclassified PKC and each convex hull of PKC family.
4.2. Domain discovery and distance calculation to domain convex hulls
Next, we searched for potential domains in unclassified kinases and quantified the similarity between each predicted domain and the corresponding PKC domain in a specific family.
We calculated the length range of C1 domains in all PKC families and generated sequence fragments starting from the shortest length within the range in each unclassified kinase with a sliding window from the N terminus to the C terminus. Subsequently, we used a sliding window one amino acid wider to generate another set of sequence fragments. This was done for all sequence lengths within the range by an increment of one amino acid. All sets of fragments were subsequently converted to 60-dimensional vectors using the natural vector method. We generated the sequence sets for C2/PB1 domains and kinase domains in a similar manner.
We represented all the sequences in the nine PKC domain groups as points in 60-dimensional Euclidean space using the natural vector method. Each set of vectors belonging to a PKC domain group defined a unique convex hull.
For every individual unclassified protein, we used all the vectors from the sequence fragments of various lengths to calculate the distances to each of the nine convex hulls (Fig. 3).
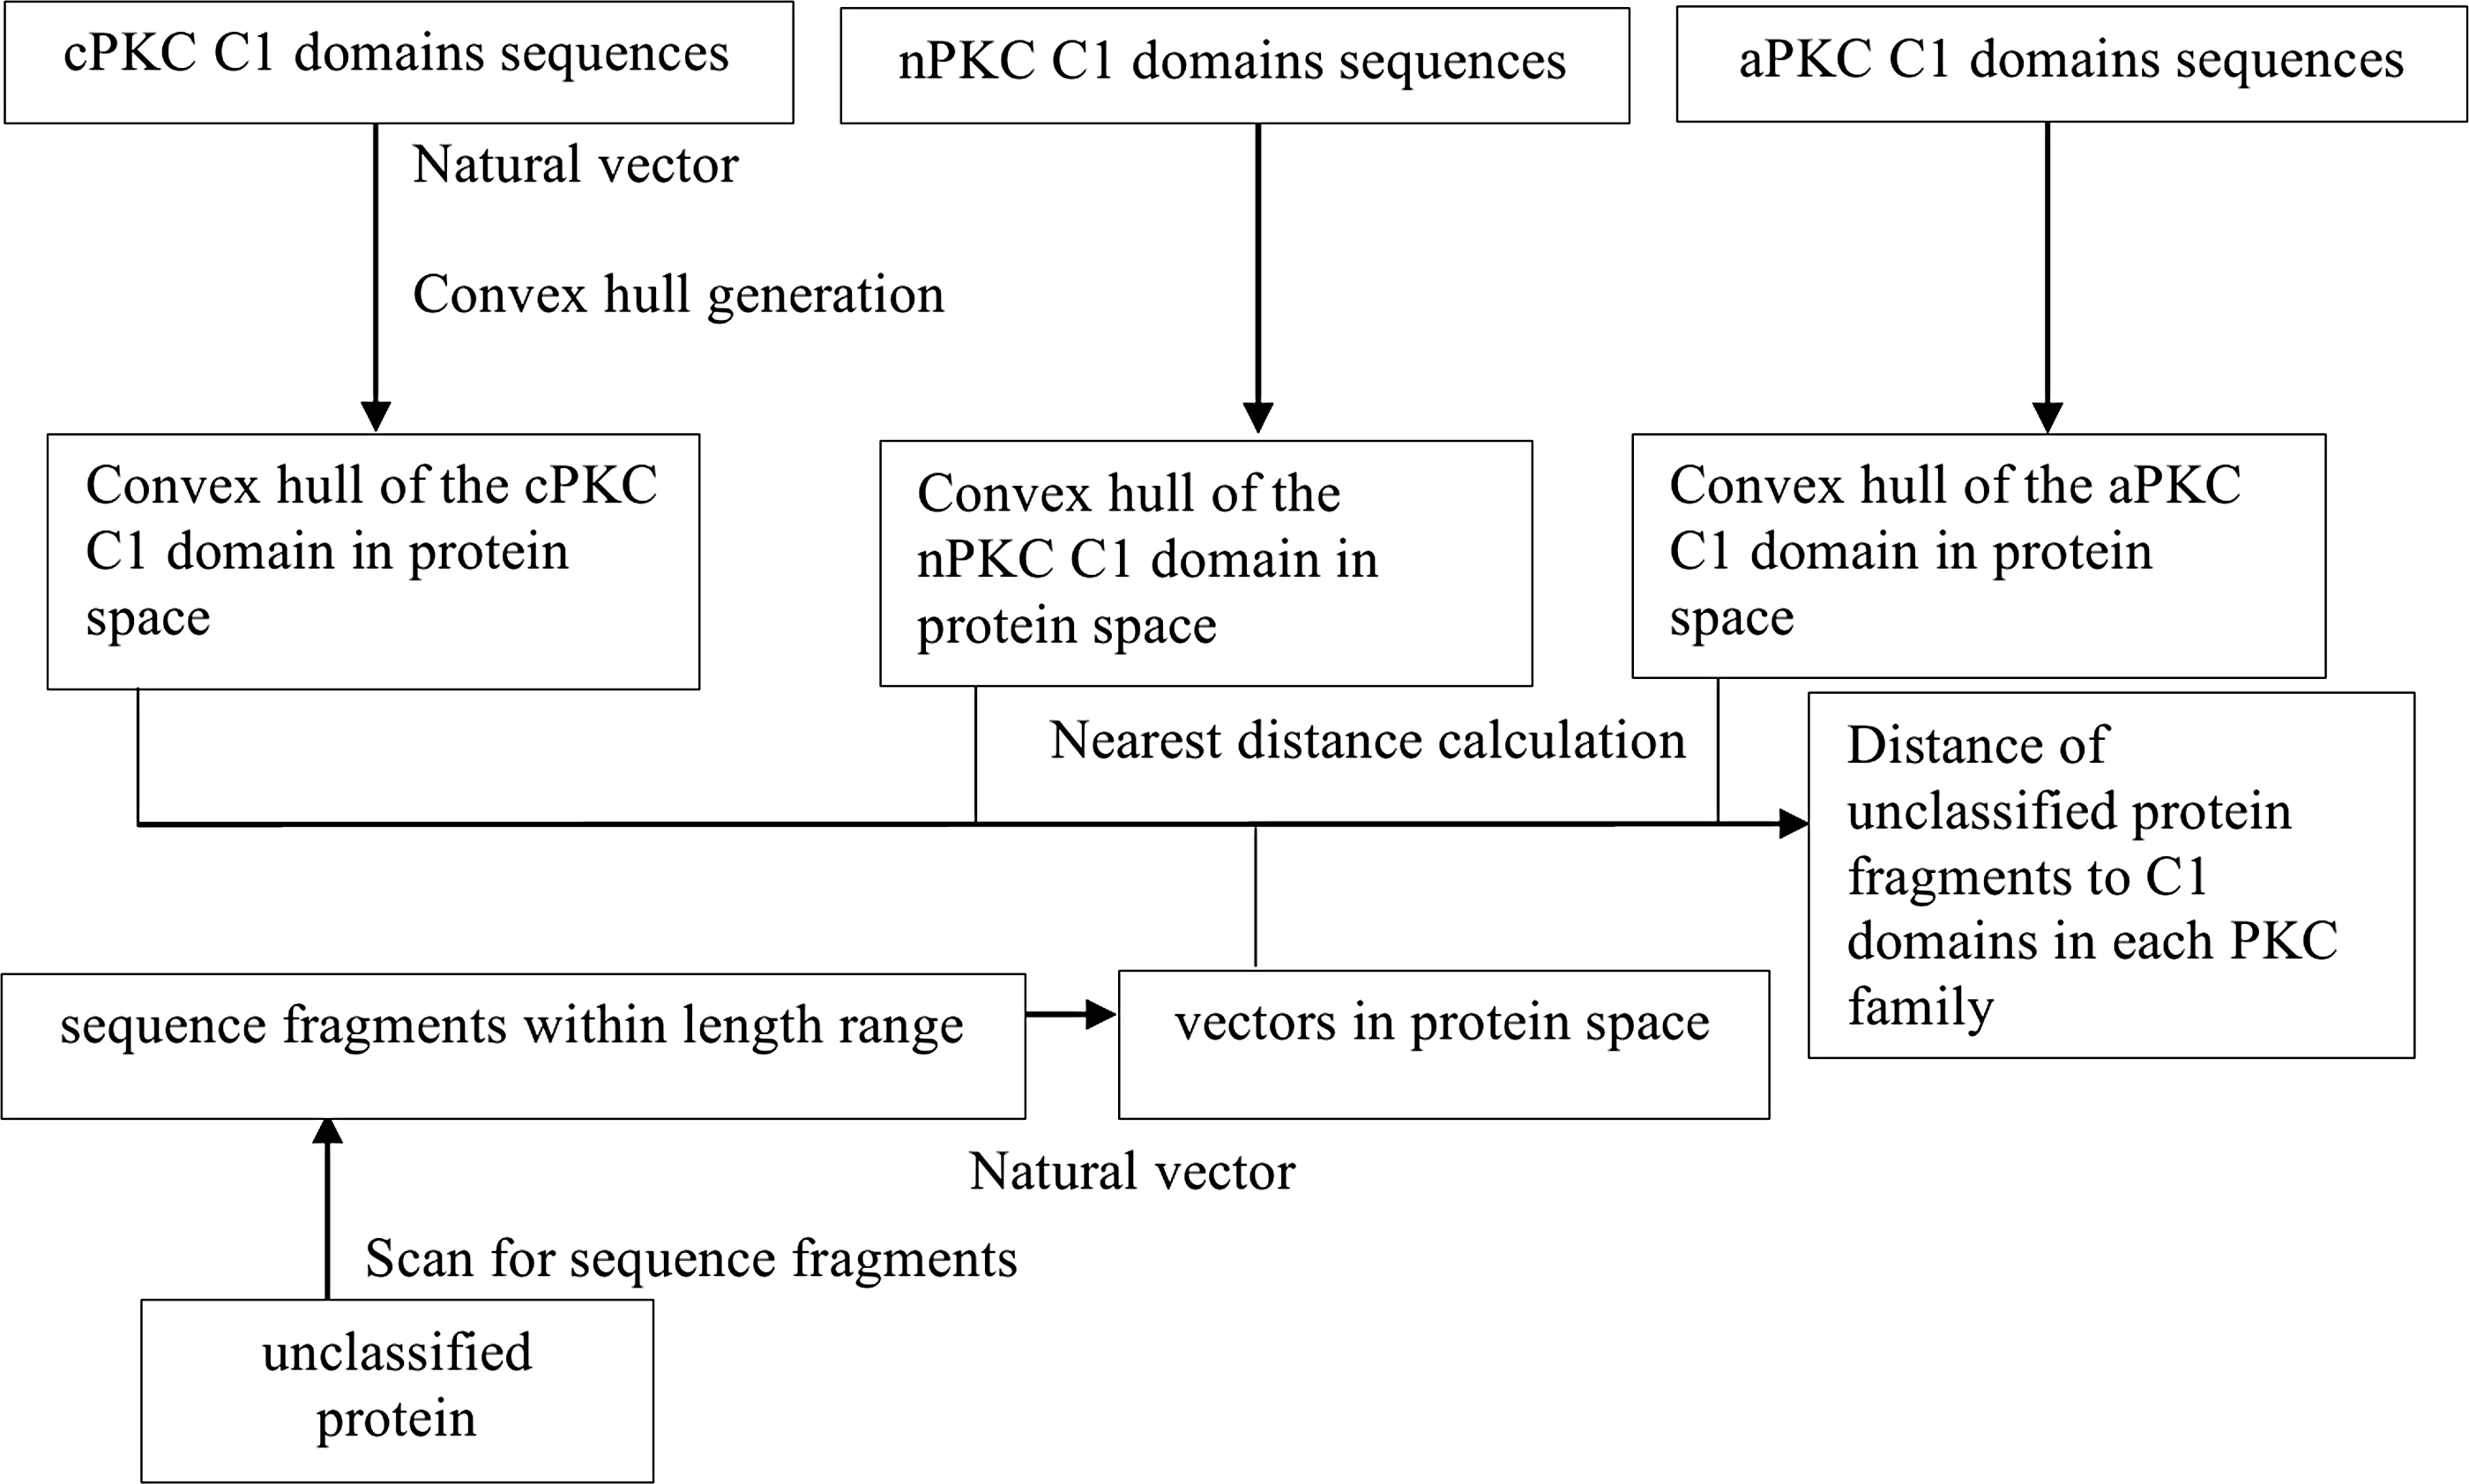
Distance calculation for domain sequences from selected proteins to PKC families using the natural vector and convex hull method. All possible sequence fragments corresponding to the length range of each kind of domain for each PKC family are selected and represented as vectors in the protein space. The convex hulls of each kind of domain of each PKC family are generated. Then the distances from vectors corresponding to each possible sequence to the corresponding domain of each PKC family are calculated.
4.3. Classification of unclassified protein kinase Cs into protein kinase C families
In the PKC domain database, kinase domains are always located at the C terminus, whereas C1, C2, and PB1 domains have mixed configurations. Of all the PKC sequences in our database, the three domains always follow the order of C1—C2—kinase in our cPKC sequences, C2—C1—kinase in our nPKC sequences, PB1—C1—kinase in our aPKC sequences (Fig. 4).
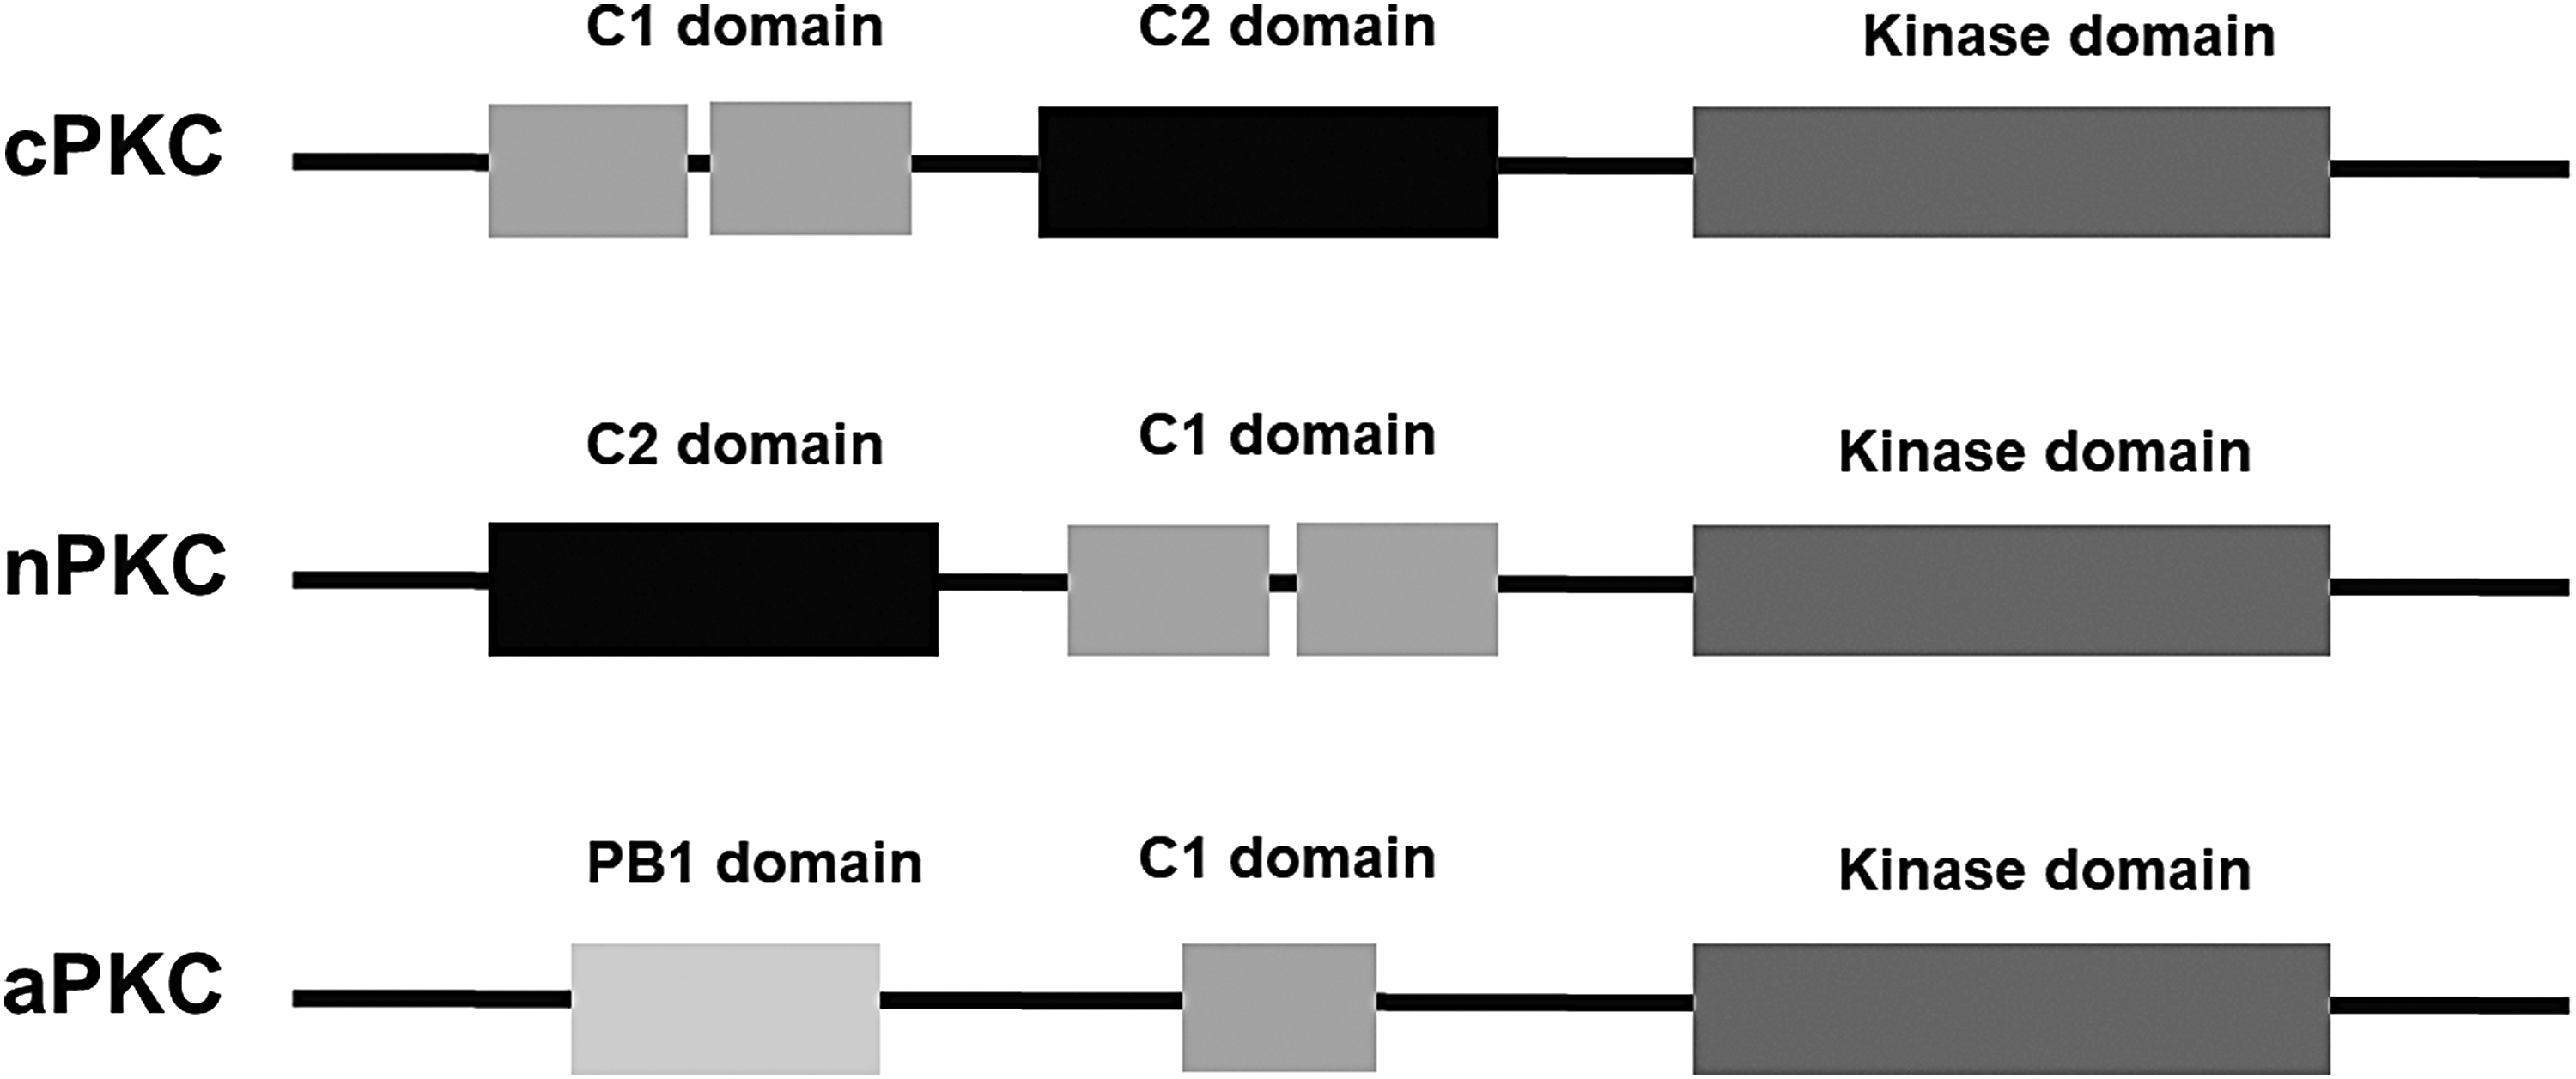
PKC basic domains. PKC is a superfamily of homologous protein kinase, composed of three families: cPKC, nPKC, and aPKC. cPKCs and nPKCs contain the C1 domain, the C2 domain, and the kinase domain. aPKCs contain the C1 domain, the PB1 domain, and the kinase domain. aPKC, atypical PKC; cPKC, conventional PKC; nPKC, novel PKC; PB1, Phox and Bem1.
We summarized the length ranges of C1 and C2 domains and denoted the minimal lengths of the two domains as L1 and L2. Since the PKC kinase domains are located at the C terminus of a protein sequence, we scanned a restricted region of kinase domain to leave space for C1 domain and C2 domain upstream. As a result, we searched for a potential cPKC kinase domain among kinase sequence fragments that start after the (L1+L2)th amino acid. We then identified the fragment with the highest similarity as a potential cPKC kinase domain, based on the distances calculated in section 4.2. We defined S1 as the location of the first amino acid of potential cPKC kinase domain on the full-length protein sequence. To avoid overlap with kinase domain, we searched for cPKC C1 domain among the C1 fragments that end before the S1th amino acid. In addition, to leave space for C2 domain, we required the fragments to start after the L2th amino acid or before the (S1 − L2) amino acid in the full-length sequence. The fragment with the highest similarity with cPKC C1 domains under these requirements was selected as the potential cPKC C1 domain of each unclassified protein kinase. From the C2 sequence fragments that only occupy the vacant regions on full-length protein sequence, we chose the potential cPKC C2 domain of each unclassified kinase. We then used a similar method to select nPKC common domains and aPKC common domains on each unclassified kinase.
We realized that our method is biased against shorter sequences. As aPKC PB1/C1 domains are generally shorter than C2/C1 domains in cPKC and nPKC, we normalized the distance from each PKC to aPKC PB1/C1 domain by multiplying the ratio of the minimal lengths between C2 domain and PB1 domain.
To classify the kinase, we take both whole protein similarity and domain similarity into account. By comparing the distances to the convex hulls, we establish a ranking of whole protein similarity to cPKC, nPKC, and aPKC, respectively. For the predicted C1 domain, we construct a similarity ranking to the C1 domains of the three PKC families. Likewise, a ranking is established for C2/PB1 and kinase domain, respectively. For final ranking of similarity to each of the three PKC families, we sum the ranks for whole protein, C1, C2/PB1, and kinase domain rankings. The protein will be classified into the PKC family with the lowest number.
4.4. Results
To test the performance of our method, we applied this method to classify each PKC in the test PKC sample using the PKC protein sequence database and the PKC domain sequence database. We used the natural vector (Deng et al., 2011) and convex hull method (Vapnik, 2000; Kodell et al., 2009) to find the whole sequence and domain sequence similarity between unclassified protein kinases and each PKC family. This resulted in the prediction of 33 cPKC, 72 nPKC, and 15 aPKC, with accuracies of 86%, 97%, and 100%, respectively (Supplementary Table S2).
We compared our method with four existing alignment-free methods that analyze protein sequences using word frequency. These four methods compare distances in specific spaces to quantify similarity between protein sequences (Kullback, 1968; Blaisdell, 1986; Torney et al., 1990; Stuart et al., 2002). Our method shows the highest classification accuracy on average compared with other four methods (Table 1).
Performance Comparison of Classification Methods
aPKC, atypical PKC; cPKC, conventional PKC; nPKC, novel PKC; PKC, protein kinase C.
5. Discussion
In this article, we introduced a protein classification method, based on natural vectors (Deng et al., 2011) and the convex hull method (Vapnik, 2000; Kodell et al., 2009). The similarity between a protein and a protein family is measured in a 60-dimensional protein space, where protein sequences are realized as vectors and the similarity of an unclassified protein to a protein family is defined as the distance from the vectors obtained from the protein sequence to the convex hull defined by the vectors obtained from the protein family members. When applied to PKC classification, the results suggest that our method has the highest accuracy in calculating the similarity between a protein and a protein family compared with other alignment-free methods (Kullback, 1968; Blaisdell, 1986; Torney et al., 1990; Stuart et al., 2002).
Footnotes
Acknowledgments
We thank Xiuqi Chen, Prof. Max Benson for helping with article revision, Xin Zhao, Rui Dong for advice on algorithm design. Funding: This research is supported by China NSF grant 31271408, Tsinghua University start up fund, and Tsinghua University independent research project grant. This work is supported by the National Natural Science Foundation of China (#91746119), and Tsinghua University start-up fund.
Authors' Contributions
S.Y. and Y.W. conceived and designed the research. Y.W. collected the database, processed the data, performed the statistical analysis, and drafted the article. K.T. helped with the algorithm design and data analysis. All authors have read and approved the article.
Author Disclosure Statement
The authors declare that no competing financial interests exist.
References
Supplementary Material
Please find the following supplemental material available below.
For Open Access articles published under a Creative Commons License, all supplemental material carries the same license as the article it is associated with.
For non-Open Access articles published, all supplemental material carries a non-exclusive license, and permission requests for re-use of supplemental material or any part of supplemental material shall be sent directly to the copyright owner as specified in the copyright notice associated with the article.