
Abstract
Abstract
Skeletal muscle is among the three major muscle types, and skeletal muscle injury (SMI) can elevate the risk of dependency and falls. This study is designed to explore the key genes involved in SMI and skeletal muscle regeneration. Microarray data set GSE81096, which included 11 injured skeletal muscle stem cell samples and 12 noninjured skeletal muscle stem cell samples, was from Gene Expression Omnibus. The differentially expressed genes (DEGs) between injured and noninjured samples were screened by R package limma, and then were performed with enrichment analysis based on the Database for Annotation, Visualization, and Integrated Discovery. Followed by protein–protein interaction (PPI), transcriptional regulatory analyses were conducted using Cytoscape software. A total of 1018 DEGs were screened from the injured samples, among which four upregulated genes and nine downregulated genes were predicted as transcription factors. Besides, four modules were identified from the PPI network. In the transcriptional regulatory network, E2F1, E2F4, JUNB, FOS, and MEF2C had higher degrees. Moreover, E2F4 and FOS might function in SMI separately through targeting E2F1 and JUNB. E2F1, E2F4, JUNB, FOS, and MEF2C might be involved in SMI and skeletal muscle regeneration.
1. Introduction
Skeletal muscle is one of the three major muscle types, and most skeletal muscles are linked to bones by tendons (Schiaffino and Reggiani, 2011). The risk factors for skeletal muscle injury (SMI) mainly include acute trauma, eccentric contractions, exercise, and disease (Järvinen et al., 2014). Following SMI, skeletal muscle experiences degeneration, inflammation, regeneration, and fibrosis successively (Urso, 2013). During aging, the loss of skeletal muscle mass can elevate the risk of dependency and falls (Fry et al., 2011). Therefore, revealing the mechanisms of SMI is essential for the reparation and regeneration of skeletal muscle.
During skeletal muscle regeneration, AMP-activated protein kinase α1 (AMPKα1) plays a critical role in macrophage skewing from a proinflammatory to anti-inflammatory phenotype (Mounier et al., 2013). Macrophages function in the resolution of tissue damage, and cAMP responsive element binding protein (CREB)-induced CCAAT/enhancer binding protein (C/EBP), β(CEBPB) expression is required for the upregulation of anti-inflammatory macrophage-specific genes and muscle regeneration (Ruffell et al., 2009). Transforming growth factor-β1 acts in inducing the differentiation of myogenic cells to myofibroblastic cells in injured muscle and the fibrotic cascades in skeletal muscle (Li et al., 2004). Both brain and muscle Arnt-like protein-1 (BMAL1) and circadian locomotor output cycles kaput (CLOCK) directly target myogenic differentiation 1 (MyoD, a master regulator of myogenesis), and their disruption can result in structural and functional alterations of skeletal muscle (Andrews et al., 2010). However, the key genes implicated in SMI and muscle regeneration have not been comprehensively explored.
Using pathway profiling and extracellular matrix array, Lukjanenko et al. (2016) find that the loss of stem cell adhesion to fibronectin impacts the regeneration of skeletal muscle. Nevertheless, they have not fully investigated the mechanisms of SMI through comprehensive bioinformatic analysis. Using the microarray data set GSE81096 deposited by Lukjanenko et al. (2016), the differentially expressed genes (DEGs) between injured samples and noninjured samples were identified. Besides, enrichment analysis, protein–protein interaction (PPI), module analyses, and transcriptional regulatory analysis were carried out to further explore the essential genes involved in SMI.
2. Methods
2.1. Data source
Microarray data set GSE81096 was from Gene Expression Omnibus database (www.ncbi.nlm.nih.gov/geo), which was detected on the GPL6885 Illumina MouseRef-8 v2.0 expression BeadChip platform. GSE81096 contained 11 skeletal muscle stem cell samples from mice with glycerol-induced muscle injury and 12 skeletal muscle stem cell samples from noninjured mice. The mice were kept in standard conditions and fed with water and food. To regenerate muscles and isolate cells, gastrocnemius, tibialis anterior, and quadriceps muscles separately were injected with 100 μL, 50 μL, or 50 μL of 50% v/v glycerol in phosphate-buffered saline (Lukjanenko et al., 2013). GSE81096 was deposited by Lukjanenko et al. (2016), and their study was approved by the Institutional Animal Care and Use Committee of the Carnegie Institution for Science (United States), the Vaud Cantonal Commission (Switzerland) for animal experimentation, and the Landesamt für Verbraucherschutz Abteilung Gesundheitlicher und technischer Verbraucherschutz (Germany).
2.2. Data preprocessing and DEG selection
Gene expression matrices were downloaded, and then, they were divided into injured and noninjured. The raw data were preprocessed using the Robust Multiarray Average method (Irizarry et al., 2003) in the R package limma (version 3.10.3, www.bioconductor.org/packages/release/bioc/html/limma.html; Ritchie et al., 2015). Probes were annotated based on platform annotation information, and the probes without corresponding genes were removed. For probes matched with the same gene, their values were averaged as the gene expression value. Subsequently, the DEGs between injured and noninjured samples were selected by the R package limma (Ritchie et al., 2015), with |logfold change(FC)|> 2 and adjusted p value <0.01 as the thresholds.
2.3. Enrichment analysis
Gene Ontology (GO; www.geneontology.org) is a database with controlled, structured vocabularies for annotating genes and gene products (Consortium, 2015). The Kyoto Encyclopedia of Genes and Genomes (KEGG; www.genome.ad.jp/kegg) is a database developed for investigating gene functions (Kanehisa et al., 2015). Using the Database for Annotation, Visualization, and Integrated Discovery (version 6.8, https://david.ncifcrf.gov) (Dennis et al., 2003), the DEGs were conducted with GO functional and KEGG pathway enrichment analyses. The count (number of enriched genes) ≥2 and p value <0.05 were set as the thresholds for selecting significant terms.
2.4. PPI network and module analyses
Search Tool for the Retrieval of Interacting Genes (STRING; version 10.0, http://string-db.org) database contains a large amount of PPIs related to multiple organisms (Franceschini et al., 2013). Combined with STRING database (Franceschini et al., 2013), PPIs among the DEGs were predicted, with combined score >0.4 as the threshold. After the PPI network was visualized using Cytoscape software (version 3.2.0, www.cytoscape.org; Saito et al., 2012), network topology analysis and module analysis separately were performed using the CytoNCA plugin (Tang et al., 2014) and MCODE plugin (Bandettini et al., 2012) in Cytoscape software.
2.5. Transcriptional regulatory network analysis
Using the iRegulon plugin (Janky et al., 2014) in Cytoscape software, transcription factors (TFs) were predicted for the nodes of the PPI network, with normalized enrichment score >3 as the threshold. Then, the predicted TFs were mapped to the DEGs to obtain the differentially expressed TFs. Finally, the transcriptional regulatory network for the differentially expressed TFs and their targets were constructed using Cytoscape software (Saito et al., 2012).
3. Results
3.1. DEG analysis
After the raw data were preprocessed, a total of 1018 DEGs (390 upregulated and 628 downregulated) were screened from the injured samples in comparison with the noninjured samples. The heatmap of the DEGs is shown in Figure 1.
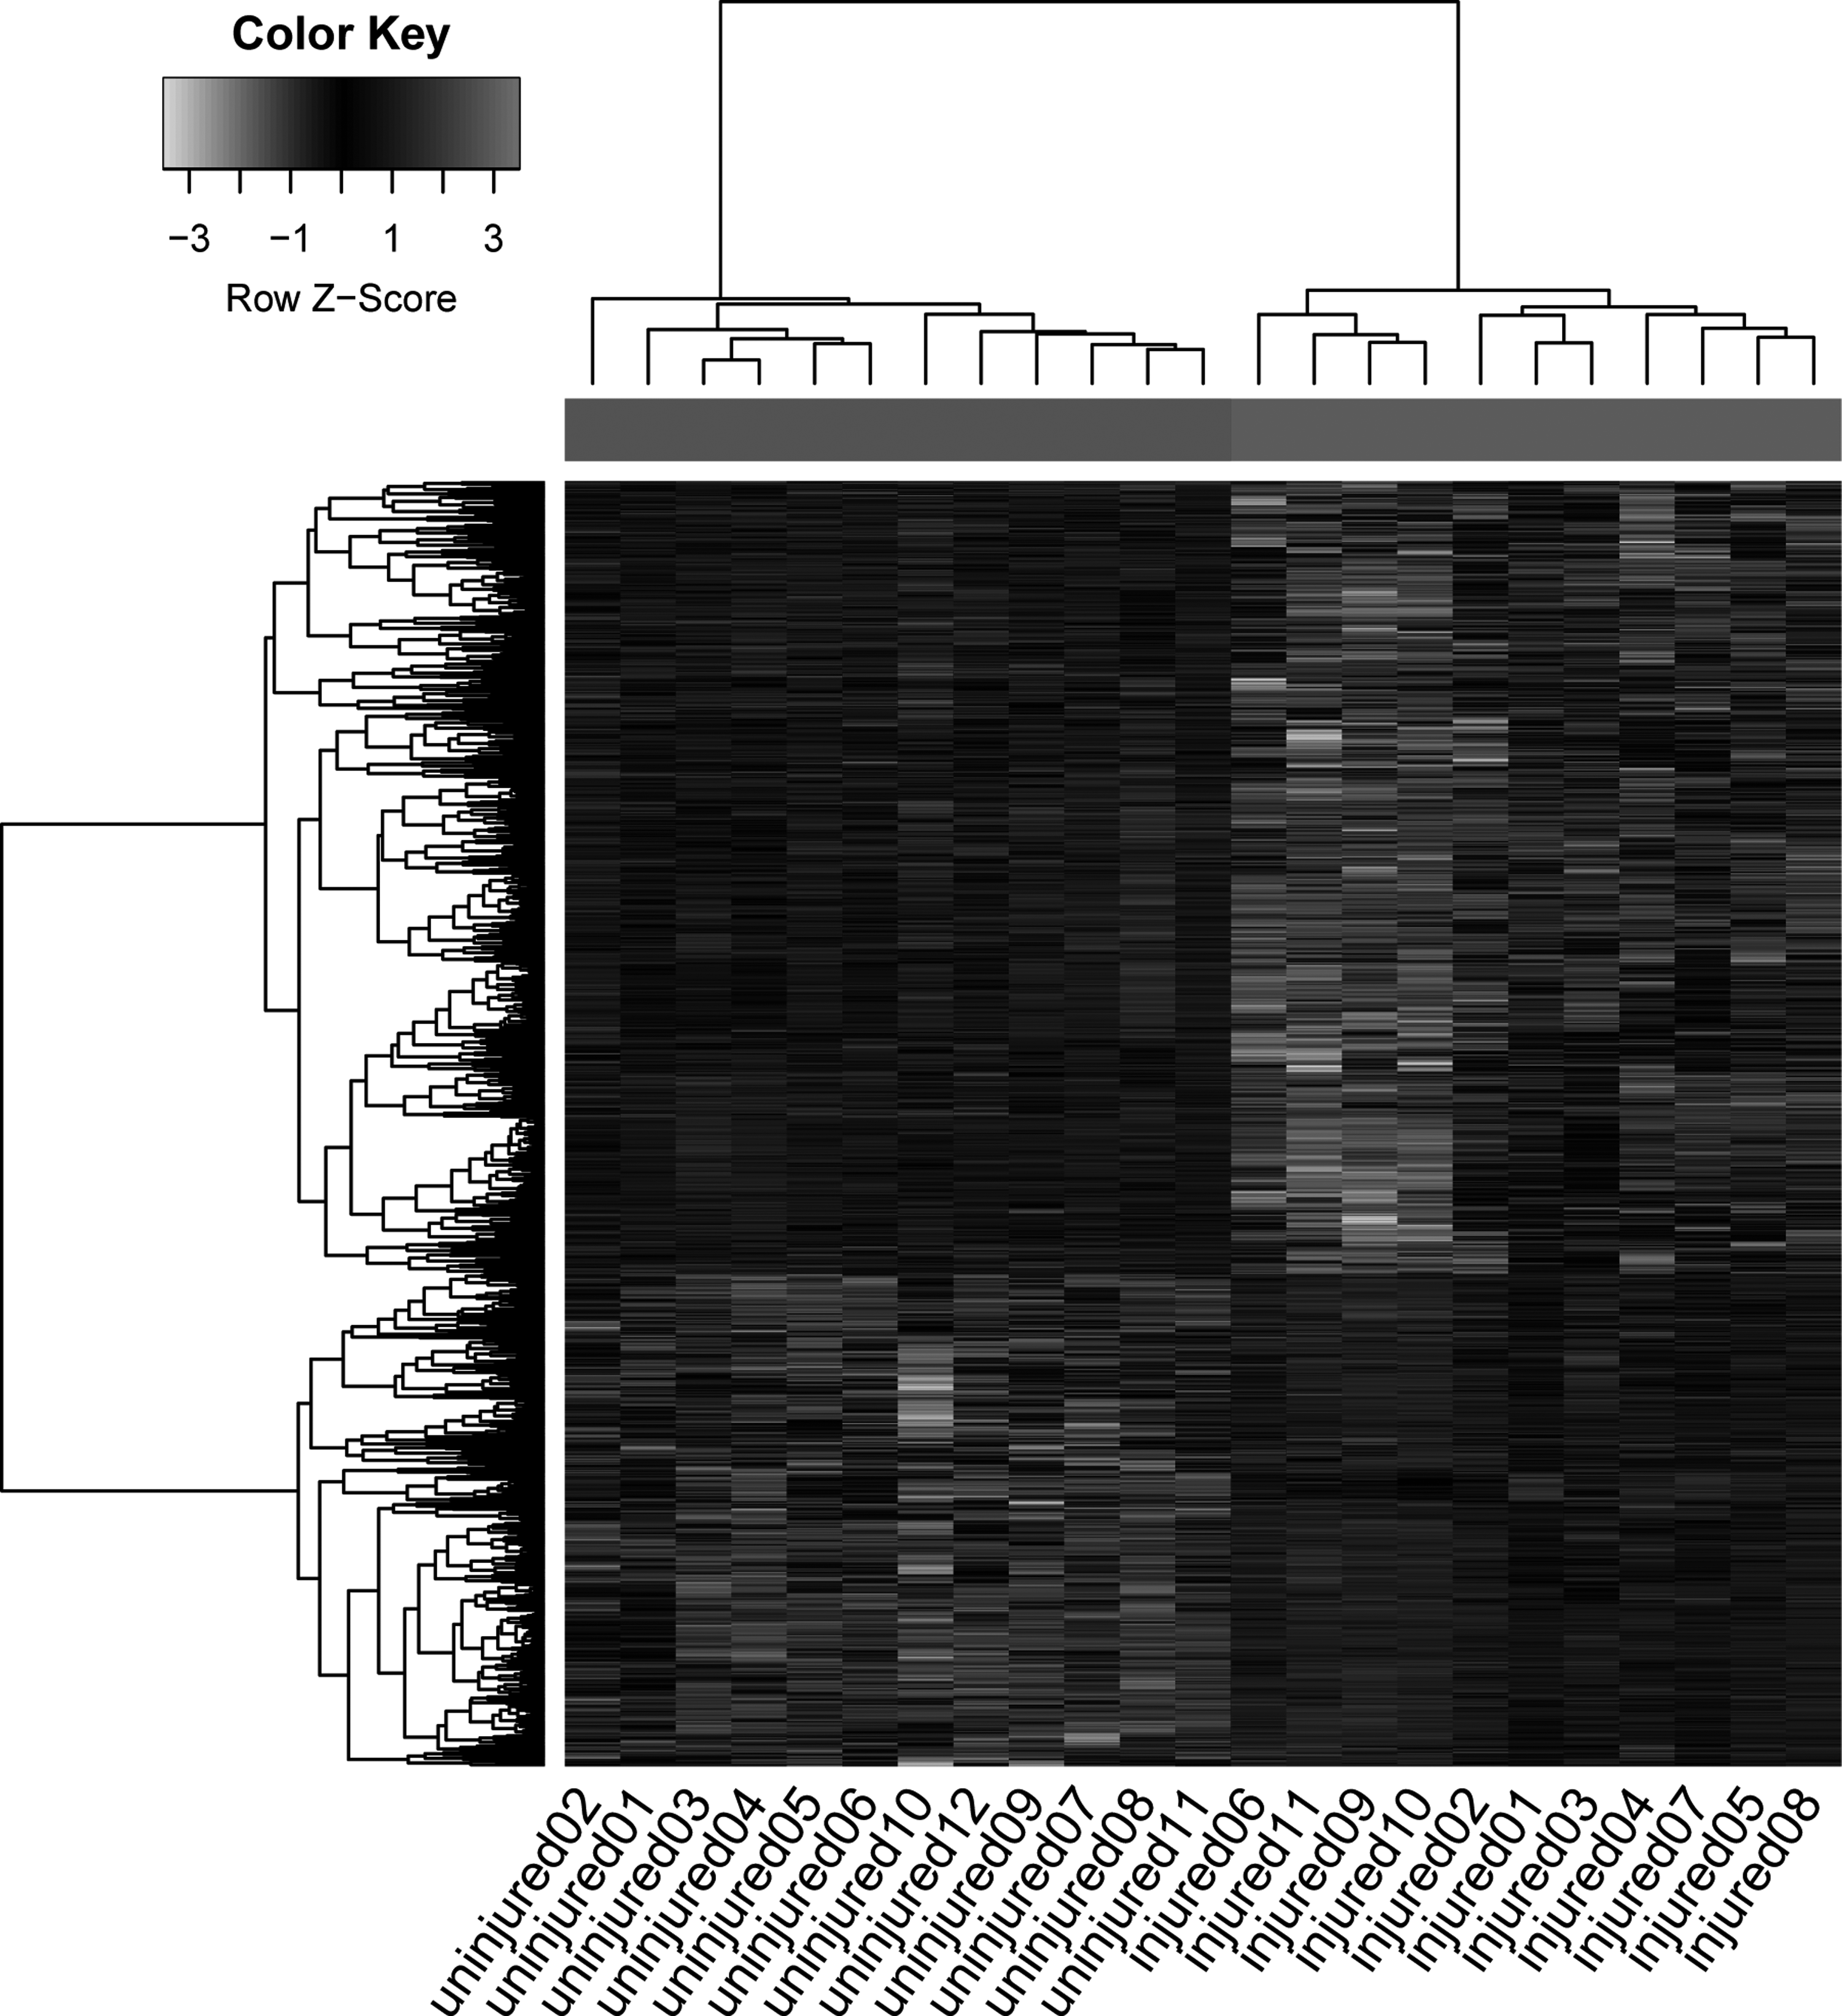
The heatmap of the DEGs. DEGs, differentially expressed genes.
3.2. Enrichment analysis
Enrichment analysis separately was conducted for the upregulated genes and the downregulated genes. The top 10 GO terms and pathways are shown in Figure 2A and B, respectively. For the upregulated genes, the enriched GO terms mainly included cell cycle (p = 2.98E-27), mitotic nuclear division (p = 1.33E-22), and cell division (p = 9.88E-20). Besides, the pathways enriched for the upregulated genes mainly included cell cycle (p = 1.67E-11), DNA replication (p = 2.22E-09), and systemic lupus erythematosus (p = 2.54E-09). For the downregulated genes, the enriched GO terms mainly included cell adhesion (p = 7.32E-11), angiogenesis (p = 1.81E-10), and positive regulation of transcription from RNA polymerase II promoter (p = 2.14E-07). Meanwhile, the pathways enriched for the downregulated genes mainly included the cGMP-PKG signaling pathway (p = 2.22E-07), vascular smooth muscle contraction (p = 1.39E-06), and circadian entrainment (p = 3.99E-05).

The top 10 GO_BP terms
3.3. PPI network and module analyses
The PPI network consisted of 843 nodes and 6940 edges, and the top 10 nodes (according to degrees) are listed in Table 1. Afterward, modules A (score = 65.42, including 70 nodes and 2257 edges; Fig. 3A), B (score = 16.375, including 17 nodes and 131 edges; Fig. 3B), C (score = 11.733, including 16 nodes and 88 edges; Fig. 3C), and D (score = 8.609, including 23 nodes and 99 edges; Fig. 3D) with score >8 were identified from the PPI network. Besides, pathway enrichment analysis for the nodes of the modules was carried out. There were 7, 0, 4, and 4 pathways enriched for the genes involved in modules A, B, C, and D, respectively (Table 2).
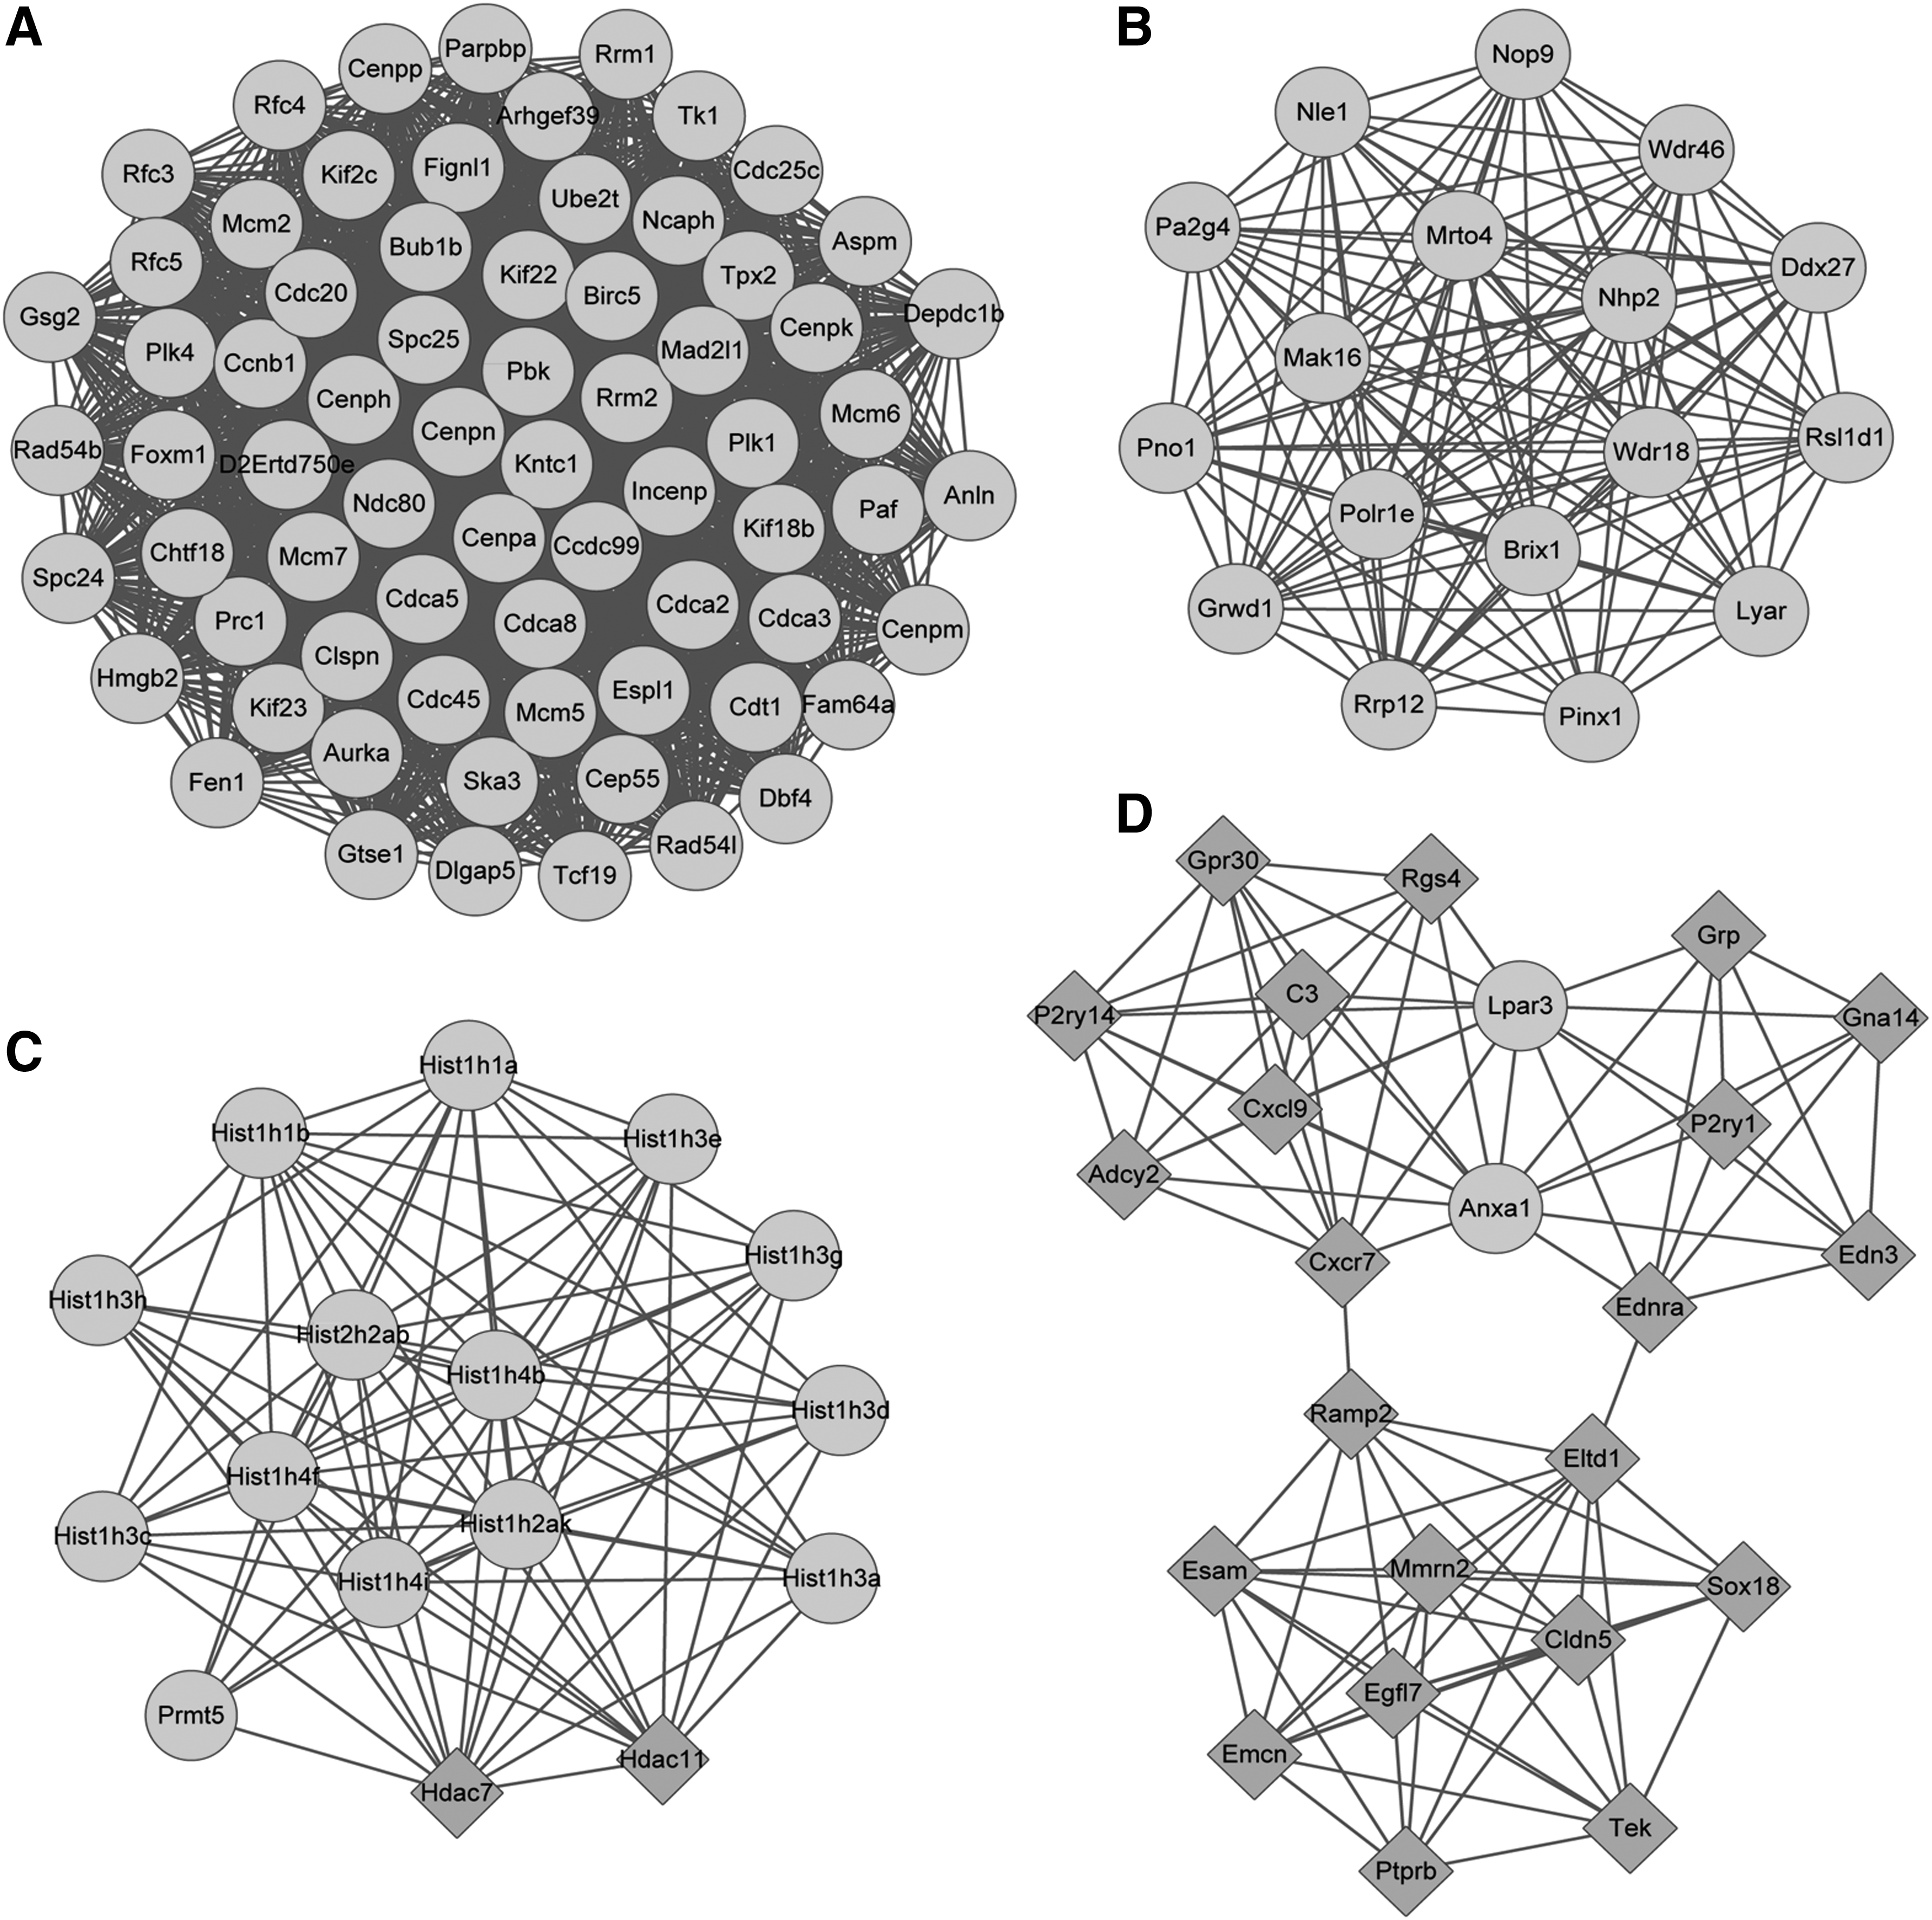
The module A
The Top 10 Nodes in the Protein–Protein Interaction Network
The Pathways Enriched for the Genes Involved in Modules A, C, and D
3.4. Transcriptional regulatory network analysis
Based on the iRegulon plugin, a total of 88 TFs were predicted for the nodes of the PPI network. Among the 88 TFs, there were 13 differentially expressed TFs (4 upregulated and 9 downregulated). Finally, a total of 1267 differentially expressed TF-target pairs were obtained, and then, the transcriptional regulatory network was constructed (including 843 nodes and 6940 pairs; Fig. 4). The top 20 nodes in the transcriptional regulatory network are listed in Table 3, including the E2F transcription factor 4 (E2F4), E2F transcription factor 1 (E2F1), jun B proto-oncogene (JUNB), FBJ osteosarcoma oncogene (FOS), and myocyte enhancer factor 2C (MEF2C). Importantly, E2F1 was targeted by E2F4, and JUNB was targeted by FOS in the regulatory network.
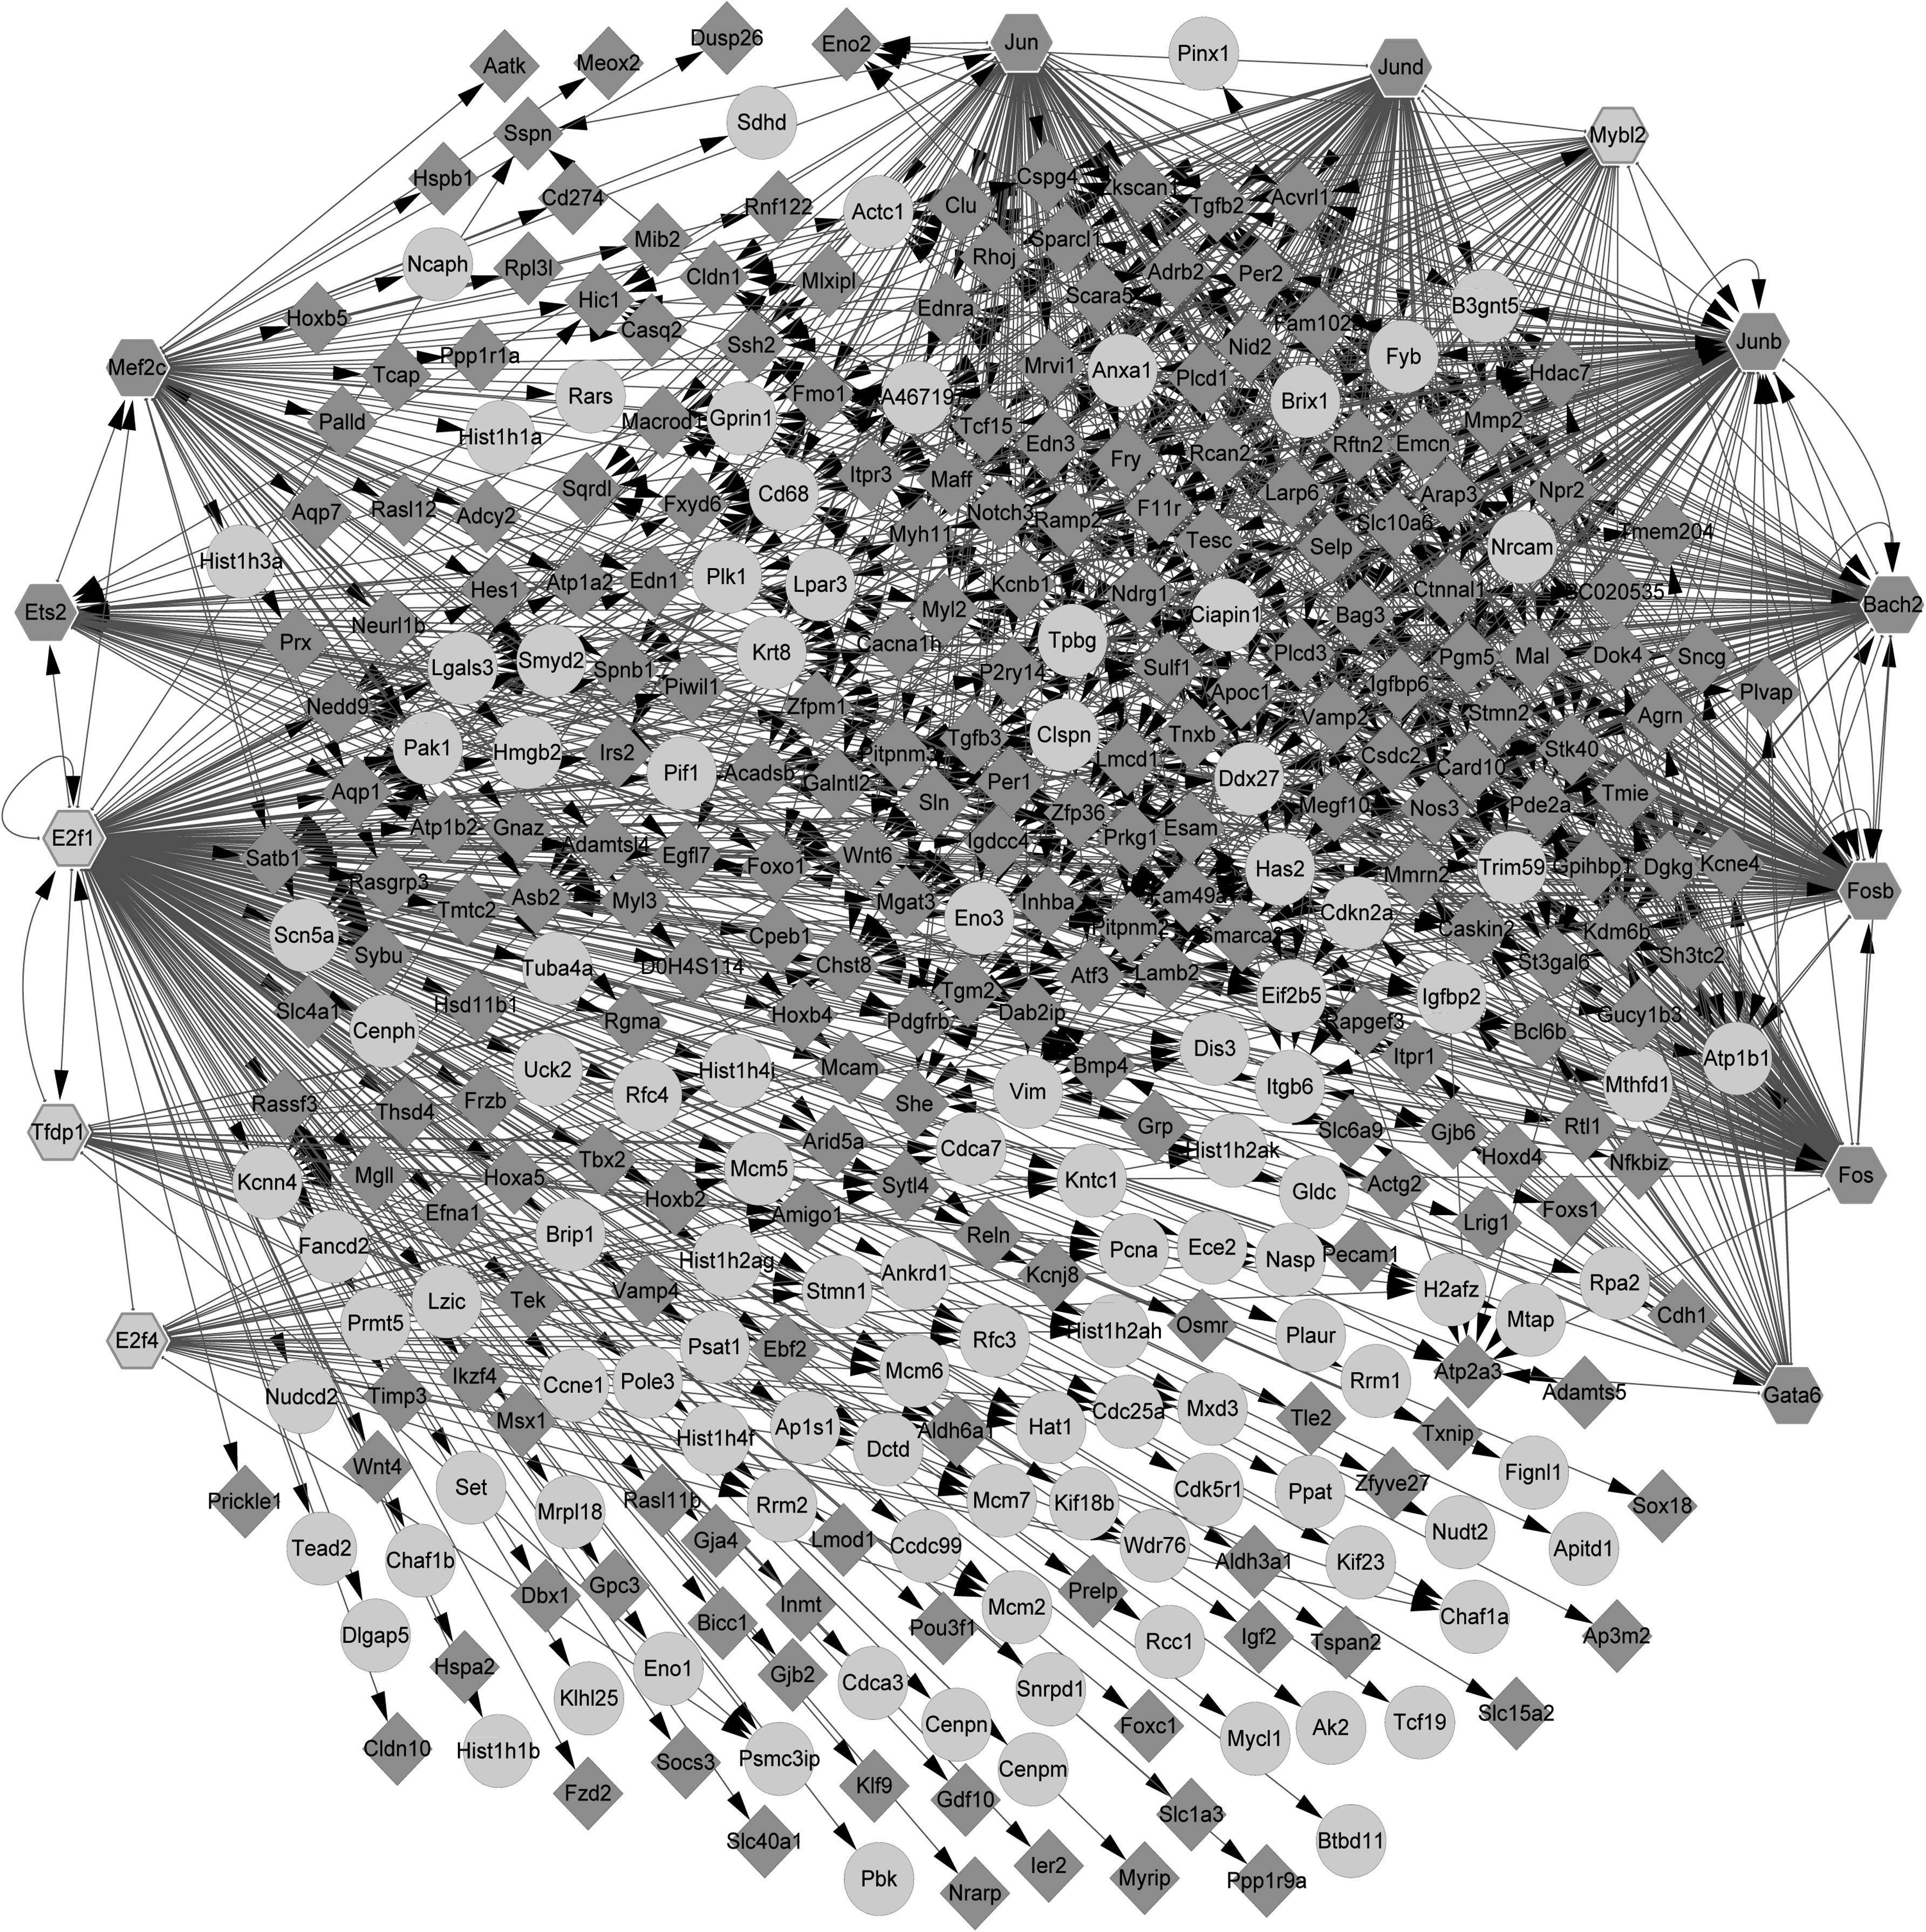
The transcriptional regulatory network constructed for the differentially expressed TFs and their targets. The circles, prismatic nodes, and hexagons represent upregulated genes, downregulated genes, and TFs, respectively. TFs, transcription factors.
The Top 20 Nodes in the Transcriptional Regulatory Network
TF, transcription factor.
4. Discussion
In this study, 1018 DEGs were screened from the injured samples in comparison with the noninjured samples, including 390 upregulated genes and 628 downregulated genes. In the PPI network, four modules (modules A, B, C, and D) with score >8 were identified. A total of 13 differentially expressed TFs were predicted for the nodes of the PPI network, and 1267 differentially expressed TF-target pairs were obtained. In the transcriptional regulatory network, E2F1, E2F4, JUNB, FOS, and MEF2C had higher degrees.
Via mediating E2F1-DP1 activity, kelch repeat and BTB domain containing protein 5 (KBTBD5) functions in the myogenesis of skeletal muscle (Gong et al., 2015). E2F1 protein levels are upregulated in patients with Duchenne muscular dystrophy, and therefore, E2F1 may be used as a potential target for the therapy of the disease (Blanchet et al., 2012). E2F directly regulates the expression of muscle-specific genes during late myogenesis; especially E2F1 contributes largely to the mediation of myogenic function (Zappia and Frolov, 2016). Fibroblast growth factor receptor 1 (FGFR1) expression is closely related to skeletal muscle development, while E2F4 can inhibit the promoter activity of FGFR1 in skeletal muscle cells (Parakati and Dimario, 2005a, 2005b). E2F1 was targeted by E2F4 in the regulatory network, indicating that E2F4 might function in SMI and skeletal muscle regeneration through targeting E2F1.
JUNB inhibits protein breakdown through blocking the binding of forkhead box O3 (FoxO3) to atrogin-1 and muscle-specific RING finger-1 (MURF-1) promoters, indicating that JUNB is important for maintaining muscle size and inducing hypertrophy (Raffaello et al., 2010). Through promoting the protein expression of JUNB in C2C12 skeletal myogenic cells via the ubiquitin–proteasome pathway, suppressor of cytokine signaling 2 inhibits myotube formation and enhances osteoblast differentiation (Ouyang et al., 2006). FOS and myogenin messenger RNA can be induced by repetitive stretch after skeletal muscle was isolated, and thus, mechanical repetitive stretch may be used for the stimulation of muscle growth and muscle training (Ikeda et al., 2003). Reiner et al. (2002) demonstrate that FOS variability may lay the foundation for phenotypic variation in skeletal muscle metabolism and fiber characteristics. These declared that JUNB and FOS might be involved in SMI and skeletal muscle regeneration. JUNB was targeted by FOS in the transcriptional regulatory network, suggesting that FOS might function in SMI via regulating JUNB.
Through targeting MEF2C, myogenic basic helix-loop-helix (bHLH) and MEF2 mediate the expression levels of muscle-specific genes during skeletal muscle development (Wang et al., 2001). MEF2A, C, and D play critical roles in satellite cell differentiation, and an MEF2-dependent transcriptome is found to be related to the regeneration of skeletal muscle (Estrella et al., 2014; Liu et al., 2014). Via the transcriptional activation of MEF2C, forkhead box J3 (FOXJ3) plays an important regulatory role in muscle regeneration and myofiber identity (Alexander et al., 2010). Through affecting the phosphorylation of MEF2C, skeletal myosin light chain kinase (skMLCK) contributes to the expression of myogenic regulatory factor and enhances skeletal myogenesis (Madhoun et al., 2011). Therefore, MEF2C might also be associated with SMI and skeletal muscle regeneration.
In conclusion, an in-depth bioinformatic analysis has been conducted. There were a total of 1018 DEGs in the injured samples. Besides, E2F1, E2F4, JUNB, FOS, and MEF2C might be involved in SMI and skeletal muscle regeneration. However, these predictive results acquired from bioinformatic analysis should be further validated by experimental researches.
Footnotes
Author Disclosure Statement
The authors declare there are no conflicting financial interests.