
Abstract
Abstract
Developments of natural inhibitors to prevent the function of cyclooxygenase-2 (COX-2) protein, responsible for a variety of inflammations and cancers, are a major challenge in the scientific community. In this study, robust QSAR classification models for predicting COX-2 inhibitor were developed, by which the self-organizing feature map neural network and random forest (RF) were adopted to improve the prediction of classification model ability. The F-score-based criterion combined with RF was used for feature selection, and good performance for COX-2 inhibitor prediction in overall accuracy was demonstrated. We used this model as a virtual screening tool for identifying the potential COX-2 inhibitor from a natural product library and found potential hit compounds. This compound further screened by applying molecular docking simulation identified five potential hits such as osthole, kavain, vanillyl acetone, myristicin, and psoralen, having a comparable binding affinity to COX-2 protein. However, in cell experiment, three hit compounds revealed COX-2 inhibitory activity in mRNA and protein level such as osthole, kavain, and psoralen.
1. Introduction
COX Cyclooxygenase, well known as prostaglandin endoperoxide synthase, is responsible for the formation of prostanoids. Cyclooxygenase-2 (COX-2) involves in many diseases as a COX subtype, such as inflammation and many cancers (Limongelli et al., 2010). Nonsteroidal anti-inflammatory drugs (NSAIDs) selective for inhibition of COX-2 are likely without gastrointestinal side effects, but able to cause cardiovascular events, including heart failure, myocardial infarction, and stroke (Micklewright et al., 2003; Hegazy and Ali, 2012). Discovering a drug for inhibition of COX-2 remains promising despite COX-2 being inhibited by natural products such as flavonoids, fish oils, and vitamins, which provide less cardiovascular risk than NSAIDs (Kingston, 2011).
In the past year, to find a better lead compound, ligand-based drug designing (LBDD) (Franke et al., 2007; Aparoy et al., 2010) and structure-based drug designing (SBDD) have been performed as a significant role in drug discovery. LBDD based on pharmacophore and QSAR (quantitative structure/activity relationship) models (Franke et al., 2007; Aparoy et al., 2010) gained by account the knowledge of known inhibitors that bind to the biological target of interest, while SBDD is used for the development of its inhibitor on structural features of the drug target. QSAR models are essential for LBDD that extract quantitative relationships between the biological activities of compounds and their chemical structures, which formulate to an appropriate model to predicting inhibitors such as 5-lipoxygenase and COX-2 (Zheng et al., 2006; Aparoy et al., 2010).
Virtual screening is a computational technique used in drug discovery to identify those structures in small-molecule library that are most likely to impact drug targets. The automatically evaluating very large chemical library on computation based on molecular descriptors with machine-learning algorithms in virtual screening is a powerful tool in drug discovery. QSAR scheme in digital form is dependent on molecular descriptors acquired from chemical information, providing links between molecular structure, physicochemical properties, and quantity. QSAR usually used in the identification of chemical structure is a specific inhibitor of the target protein by mathematical quantification and computerization. Machine-learning techniques have been applied to advancing cheminformatics disciplines for developing QSAR to more precision by which machine learning techniques such as artificial neural network, k-nearest neighbors, support vector machine (SVM), random forest (RF), or decision trees enable discovery of more complex nonlinear relationships in experimental data.
To the best of our knowledge, there is no QSAR model developed for COX-2 inhibitor by machine-learning techniques to virtual screen in large numbers of molecules. Therefore, our study is intended to develop QSAR models by the self-organizing feature map (SOM) neural network and RF to virtual screening of COX-2 inhibitors in a natural product library and to determine this method's accuracy in mRNA and protein level using real time (RT)-polymerase chain reaction (RT-PCR) and Western blotting.
2. Materials and Methods
2.1. Data set
The data set used in this study, derived from other publications (Kauffman and Jurs, 2010), contains 176 compounds that possess a COX-2 inhibition activity span of IC50 value, and these compounds range from 1 nM to 100 μM (Fig. 1 and Table 1). We divided high- and low-activity compound by IC50 = 6.5, referred to as the standard.
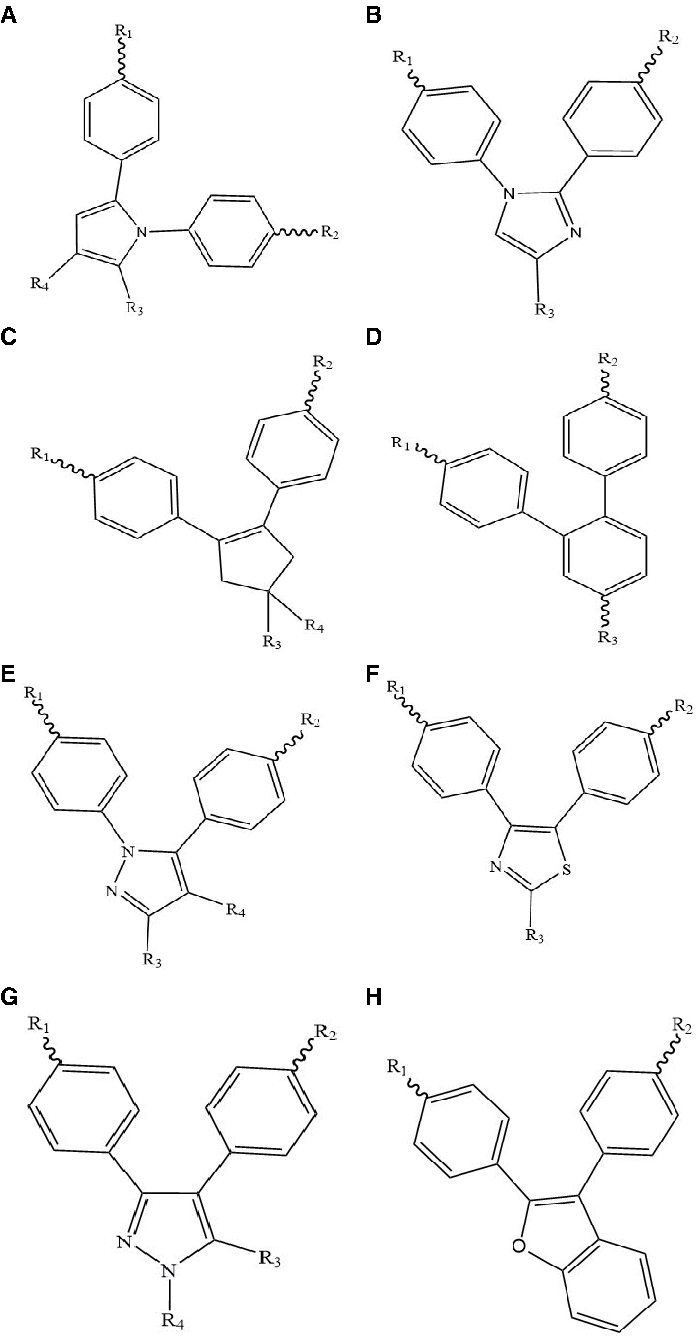
Scaffold chemical structure.
Structure, Experimental Activity of Analogs
2.2. Molecular modeling and descriptor calculation
All the structures in the database were subsequently converted to SMILES (Simplified Molecular Input Line Entry System) using ChemDraw V.10.0 (Mills, 2006), and the 176 molecular descriptors classified as 0D, 1D, and 2D families were calculated by Mold 2 (Dong et al., 2015).
2.3. Feature selection method
A selection criterion is required to remove irrelevant descriptors for the selection of suitable descriptors from a very large number of raw descriptors that contain little information or correlated with other descriptors without causing much loss of information (Jović et al., 2015). In this study, the F-score-based criterion was adopted; if the numbers of positive and negative instances are n+, and n−, respectively, then the F-score of the ith feature is defined as follows:
where
2.4. QSAR modeling
QSAR classification models have correlativity between independent variables (molecular descriptors) and a response variable that represents the class of the corresponding sample (COX-2 inhibition activity). Machine-learning techniques are generally conducted for grouping observations or instance into classes in QSAR modeling where the relationship between structure and activity is often complex and nonlinear (Lavecchia, 2015).
In this study, both the SOM neural network and RF were used. SOM is a kind of self-organization and self-learning network, which learns and classifies the input vectors in the input space as well as learns the distribution characteristics and topological structure of the input vectors (Vesanto and Alhoniemi, 2000). SOM neural network is used to distribute the input training set samples to neurons for realizing the data clustering that could randomly select some data from each class as the training set. RF algorithm combines the idea of bootstrap, aggregating with the random subspace methods that are a classifier containing multiple decision trees randomly generated. RF algorithm is similar to a bagging algorithm in resampling based on a bootstrap method to produce multiple training sets, and a decision tree trained with a training set generated by bootstrap (Breiman, 2001).
2.5. Model performance evaluation
In this study, for assessment of accuracy and selection of optimal model, performance of classification model was evaluated by receiver operating curves (ROCs). Several metrics derived from the confusion matrix were used, including sensitivity, SE = TP/(TP + FN), specificity, SP = FP/(FP + TN), and overall prediction accuracy, CA = (TP + TN)/(TP + TN + FP + FN) (TP denotes true positives; FN denotes false negatives; FP denotes false positives; and TN denotes true negatives, respectively).
CA is the total percentage of both high and low compounds that is correctly predicted; sensitivity is the proportion of actual active compound that is correctly identified; specificity is the proportion of actual inactive compound that is correctly identified; ROC have measured the quality of the classification models.
2.6. Virtual screening
Virtual screening is to find potential leads with different scaffolds from a chemical library by QSAR models. The chemical library consisted of 502 chemicals derived from natural plants and microorganisms.
2.7. Molecular docking
Molecular docking has been used to predict the best binding ligand molecule on the active site of receptor targets as well as virtual screening as a computational tool. Three-dimensional (3D) structural information obtained from the Protein Data Bank, Human COX-2 stable crystal structure (PDB ID: 5ikq), for the molecular docking applied by which MOE (Molecular Operating Environment, v2014.0901; Chemical Computing Group, Inc.) software determined the overall lowest potential energy configuration by protonating 3D module in the different states of terminal amides, hydroxyls, thiols, histidines, and titratable groups.
2.8. Chemicals
Extracted chemicals from natural products, osthole, myristicin, and vanillyl acetone, were purchased from Yuanye Biology (Beijing, China), and psoralen and kavain were purchased from Beijing Zhongke Yiyou Chemical Technology Research Institute (Beijing, China).
2.9. Cell line and cell culture
HepG2, human liver cancer line, was obtained from the American Type Culture Collection (ATCC, Manassas, VA) and cultured in Dulbecco's modified Eagle's medium (DMEM; Thermo Fisher Scientific, Waltham, MA), supplemented with 10% fetal bovine serum (Thermo Fisher Scientific). The cells were incubated at 37°C in a humidified atmosphere with 5% carbon dioxide.
2.10. MTT 3-(4,5-dimethyl thiazole-2-yl)-2,5-diphenyl tetrazolium bromide assay
HepG2 cells were treated with osthole (0, 40, 80, 120, 160, 200 μM), psoralen (0, 10, 50, 100, 150, 200 μM), kavain (0, 100, 200, 300, 400, 500 μM), myristicin (0, 5, 6, 7, 8, 10 mM), and vanillyl acetone (0, 1.1, 1.2, 1.4, 1.6, 2.0 mM) for 48 hours, and the absorbance was measured at 570 nm after adding the MTT 3-(4,5-dimethyl thiazole-2-yl)-2,5-diphenyl tetrazolium bromide assay (Sigma-Aldrich, St. Louis, MO) for 4 hours at 37°C.
2.11. Real-time polymerase chain reaction
Total RNA was extracted from cells using the TRIzol reagent (Invitrogen, Thermo Fisher Scientific), and then, cDNA was synthesized using the PrimeScript™ RT Reagent Kit, and gDNA Eraser (Perfect Real TIME, Takara, Japan) for what real-time PCR was carried out using SuperReal PreMix Plus (SYBR Green; Tiangen, China). The PCR primers were as following: COX-2 (forward: TCACAGGCTTCCATTGACCAG; reverse: CCGAGGCTTTTCTACCAGA), GAPDH (forward: AATCCCATCACCATCTTCC; reverse: CATCACGCCACAGTTTCC), and the relative expression of mRNA was calculated by the 2(−delta CT) method.
2.12. Western blotting
COX-2 and β-actin antibody were purchased from Cell Signaling Technology (Danvers, MA) and Abcam (Cambridge, United Kingdom), and the relative density was calculated as the following formula: COX-2/β-actin band density.
2.13. Statistical analysis
The results were provided as mean ± SD, a difference between groups assessed through one-way ANOVA by SPSS 20.0, and p < 0.05 assumed as statistically significant.
3. Results and Discussion
3.1. Classification models for cyclooxygenase-2 inhibitor
The RF algorithm combines the idea of bootstrap, which aggregating with the random subspace methods that are a classifier contains multiple decision trees randomly generated. As the test data input to the RF classifier, each decision tree makes the decision for every training set, and the final classification acquired by majority vote. The RF algorithm is described in the flow chart in Figure 2.
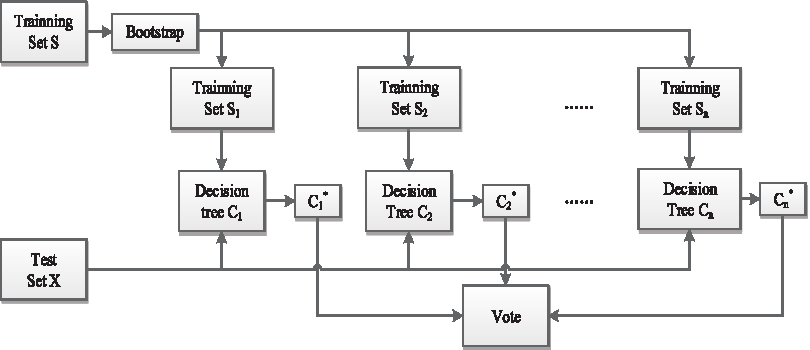
Flow chart of the RF algorithm. RF, random forest.
To reduce the redundant variables, data preprocessing is implemented as follows: (1) delete the molecular descriptors that contain zero values higher than 85%; (2) remove the molecular descriptors where invariance is lower than 0.05; and (3) remove the pair of molecular descriptors where the correlation coefficient is higher than 0.95. The number of molecular descriptor variables dropped to 180 for further investigation after preprocessing, and the F-score algorithm reduced the dimension of the 180 molecular descriptors to obtain an optimal molecular descriptor subset. The flow chart of obtaining the optimal subset of molecular descriptors is shown in Figure 3. The number of molecular descriptors chosen in the feature selection, N, was decided by looping the entire computational procedure for modeling. The number of molecular descriptors reduced to N = 110 for the feature selection, and the optimal subset of molecular descriptors in size N is obtained.
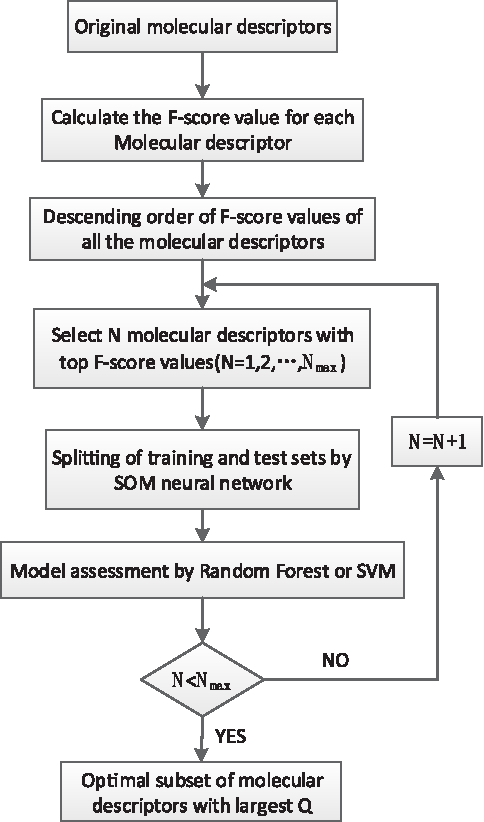
Flow chart of obtaining the optimal molecular descriptor subset.
The training and test set divided by which the SOM neural network clustered the 176 molecular descriptors into 16 neurons on the map by grids of 4 × 4 size (Fig. 4). To ensure the training set uniformly distributed in the data space to build a proper model, the selected random number was labeled in black from each cluster as the training set and the rest labeled in red as the test set.
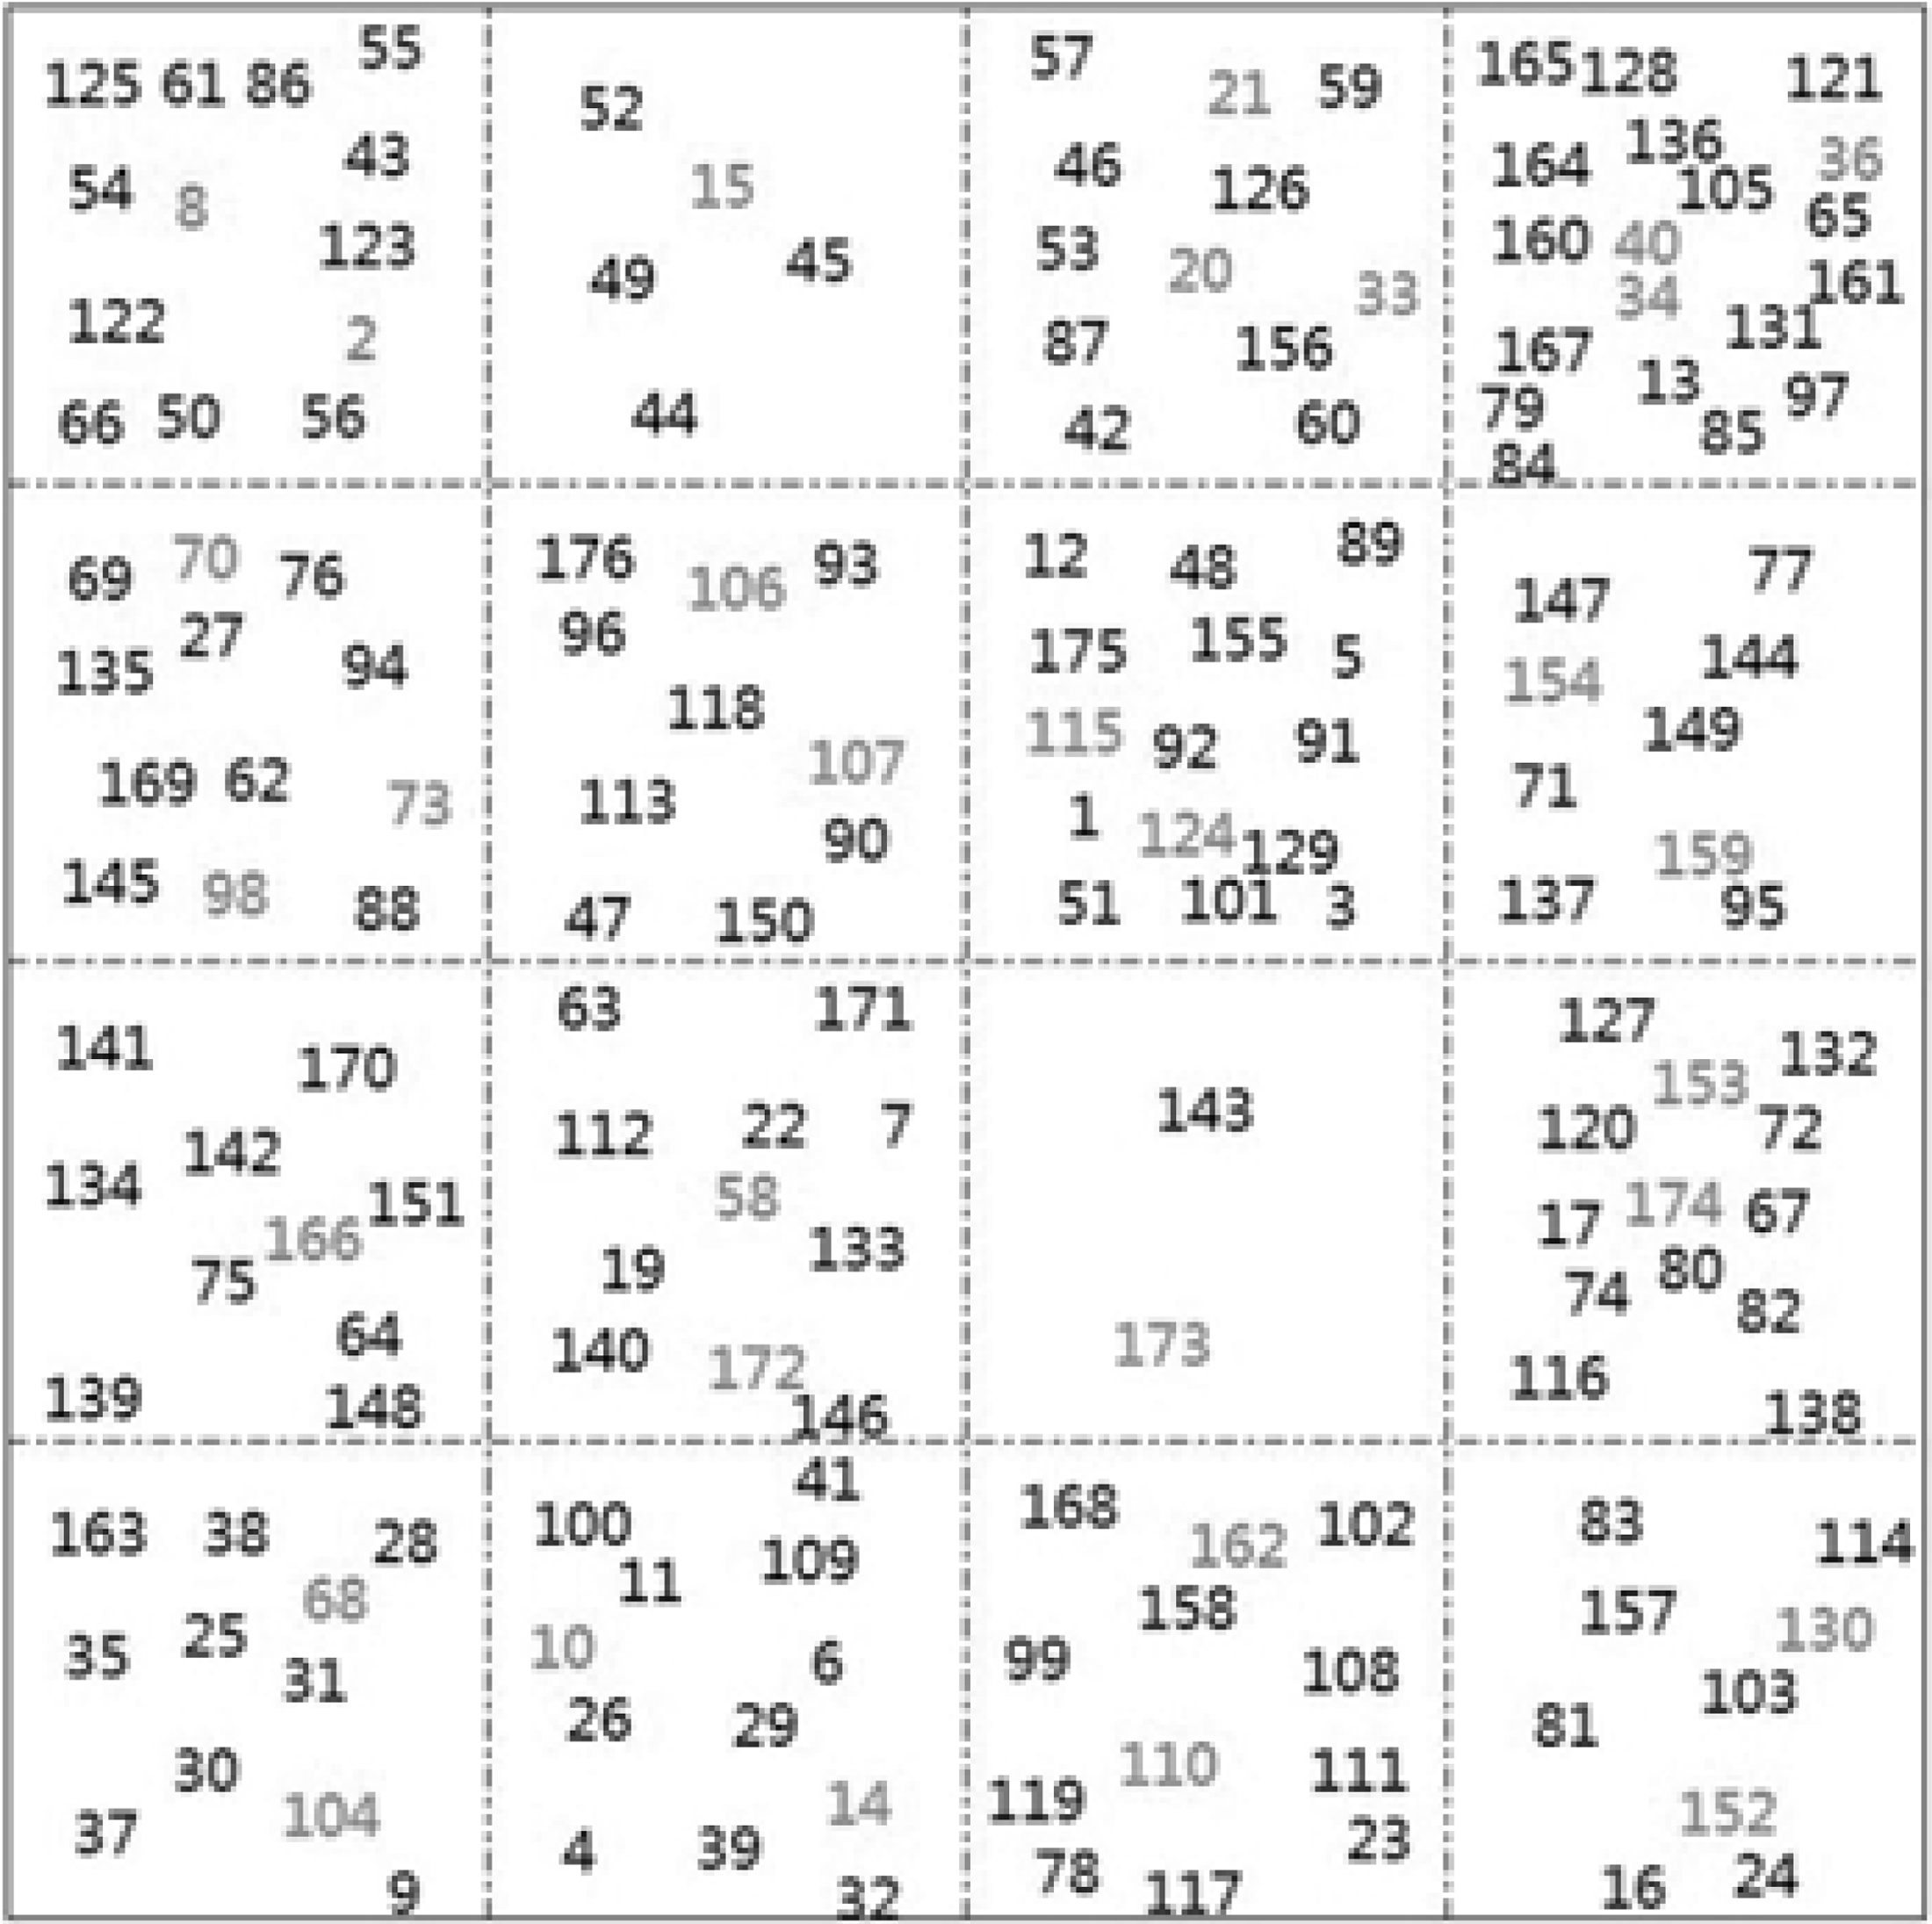
Split training and test sets by the SOM neural network. SOM, self-organizing feature map.
To more likely predict the COX-2 inhibitor, feature selection (FS) combined with RF showed good performance for COX-2 inhibitor prediction in SE, SP, and Q, respectively, in FS-RF versus RF (Table 2). In addition, area under the curve (AUC)
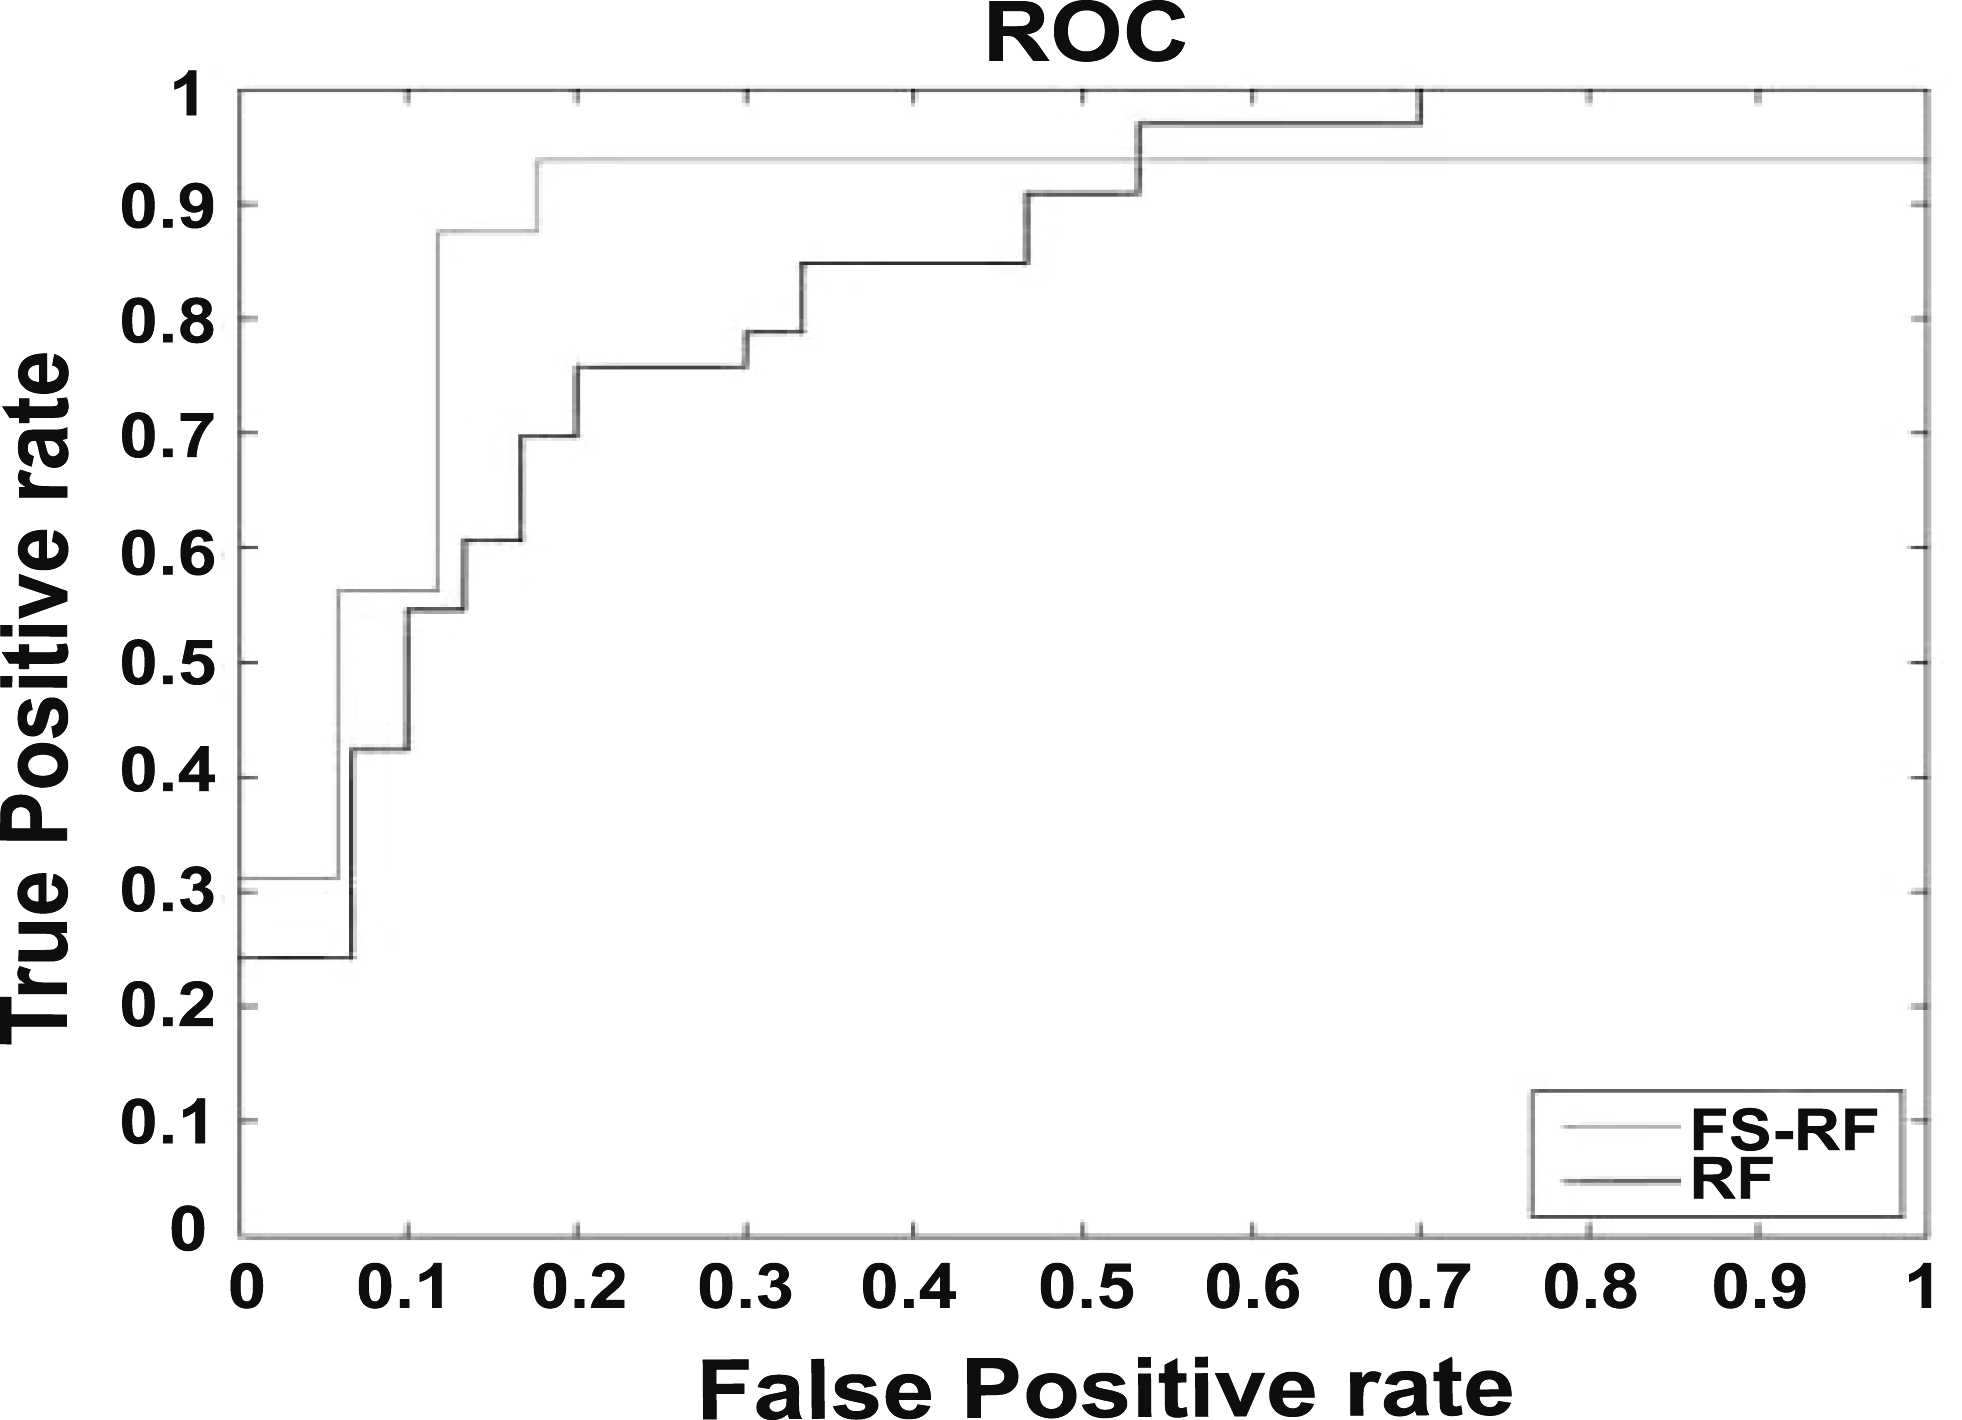
The ROC of FS-RF and RF. FS-RF, feature selection-random forest; ROC, receiver operating curve.
The Prediction Performance of COX-2 Inhibitors Using Random Forest (RF) and FS-Random Forest (Feature Selection-Random Forest) Methods
AUC, area under the curve;
3.2. Virtual screening
Recently, to prediction the lead compound in drug discovery, many different strategies, including ligand-based approaches (SAR, QSAR, pharmacophore mapping), have been performed, and which further supervised (SVM, neural network, decision tree, RF, kappa nearest neighbor, naive Bayesian, binary QSAR) and unsupervised (self-organizing map) learning methods. In our study, a combination of RF and SOM neural network is applied for developing machine learning to improve the virtual screen. We screened from the natural product library 502 chemicals acquired from natural plants and other sources (Table 3). Each of the 502 chemical structures from natural products shifted to molecular descriptors by mold2, and chemicals were identified as COX-2 inhibitor by the FS-RF model to further molecular docking.
Chemical Library for Virtual Screening from Nature Products
3.3. Molecular docking
In addition, structure-based strategies (pharmacophore mapping, homology modeling, docking) have been conducted for the prediction of the lead compound. Due to the lack of crystallographic 3D structures at a high resolution of targeting protein, few studies were carried out in the past. Ounissi et al. (2018) reported that molecular dynamics simulation was used to identify potential COX-2 inhibitors by 3D-QASR in the Chinese Universal Natural Product Database. Another publication also indicated that the COX-2 inhibitor was screened by 3D-QASR in benzopyran class (Yadav et al., 2017).
For further screening, we used MOE to what the COX-2 protein docks with virtual screened chemicals. Our results indicated that the COX-2 binding pocket successfully docked with osthole, kavain, vanillyl acetone, myristicin, and psoralen, and stabilized in electrostatic, van der Waals forces, and hydrogen interaction (Table 4, Figs. 6 and 7).
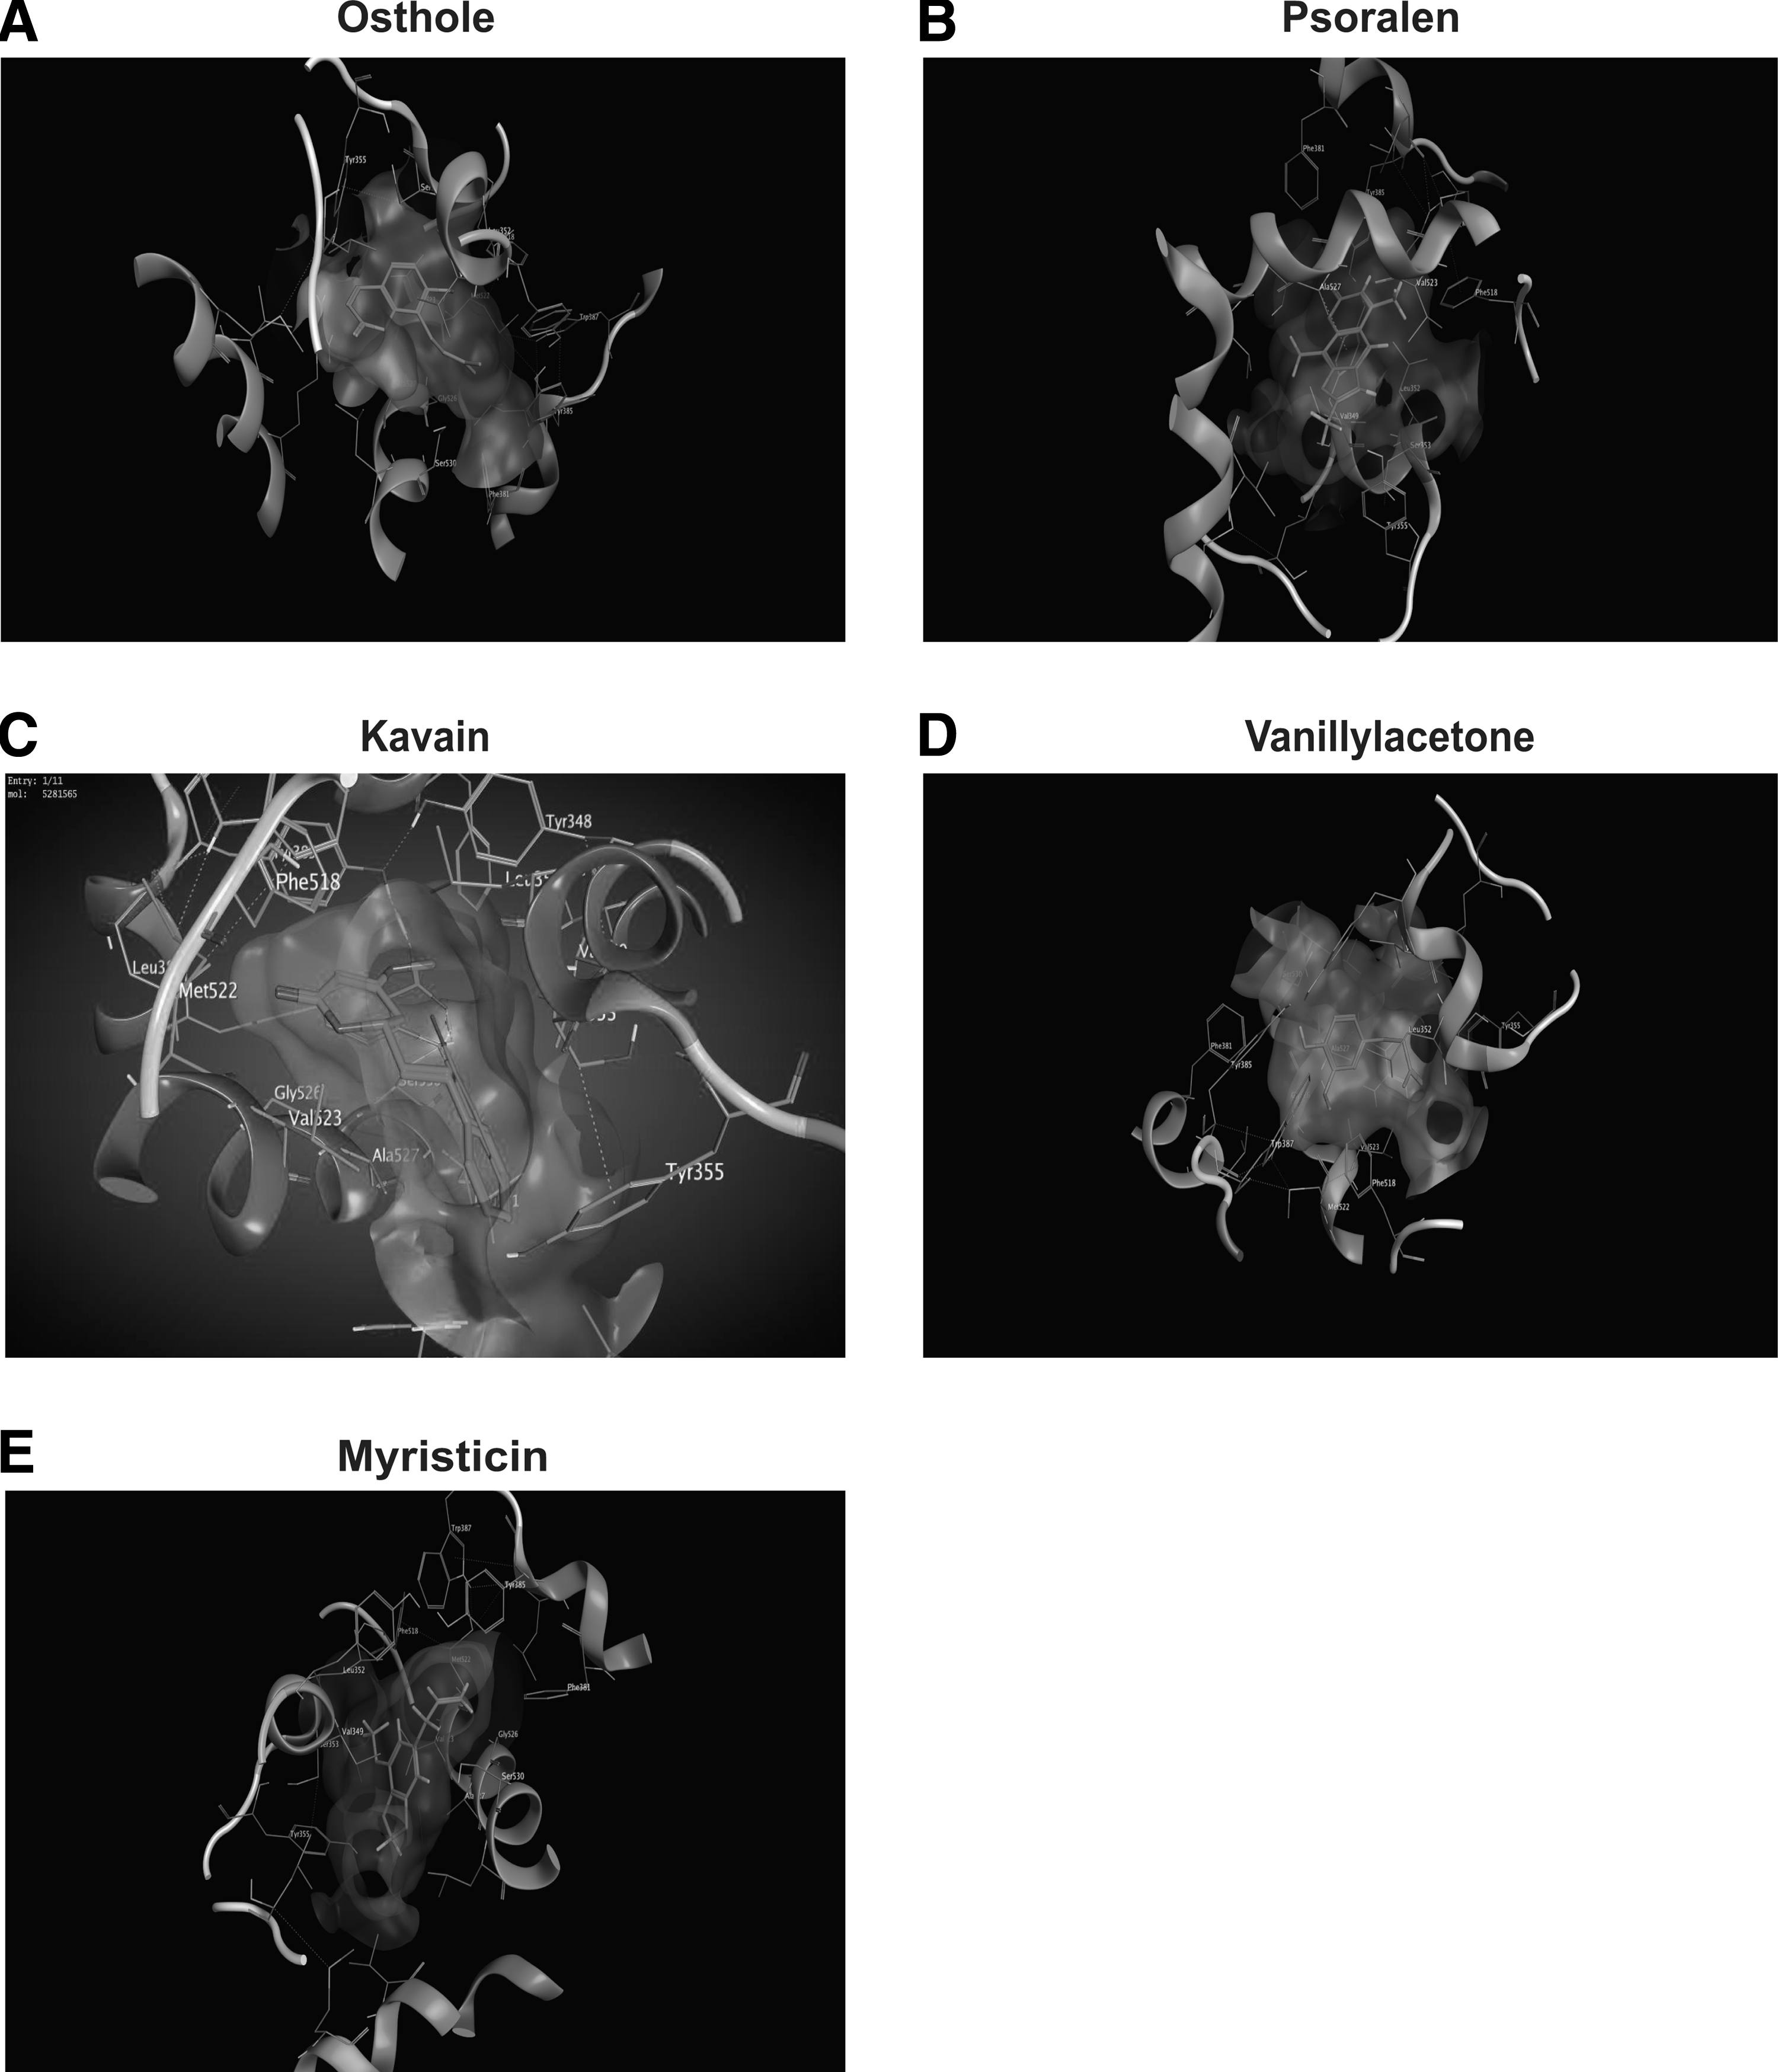
Three-dimensional view of the binding interaction of five virtual hits with COX-2.
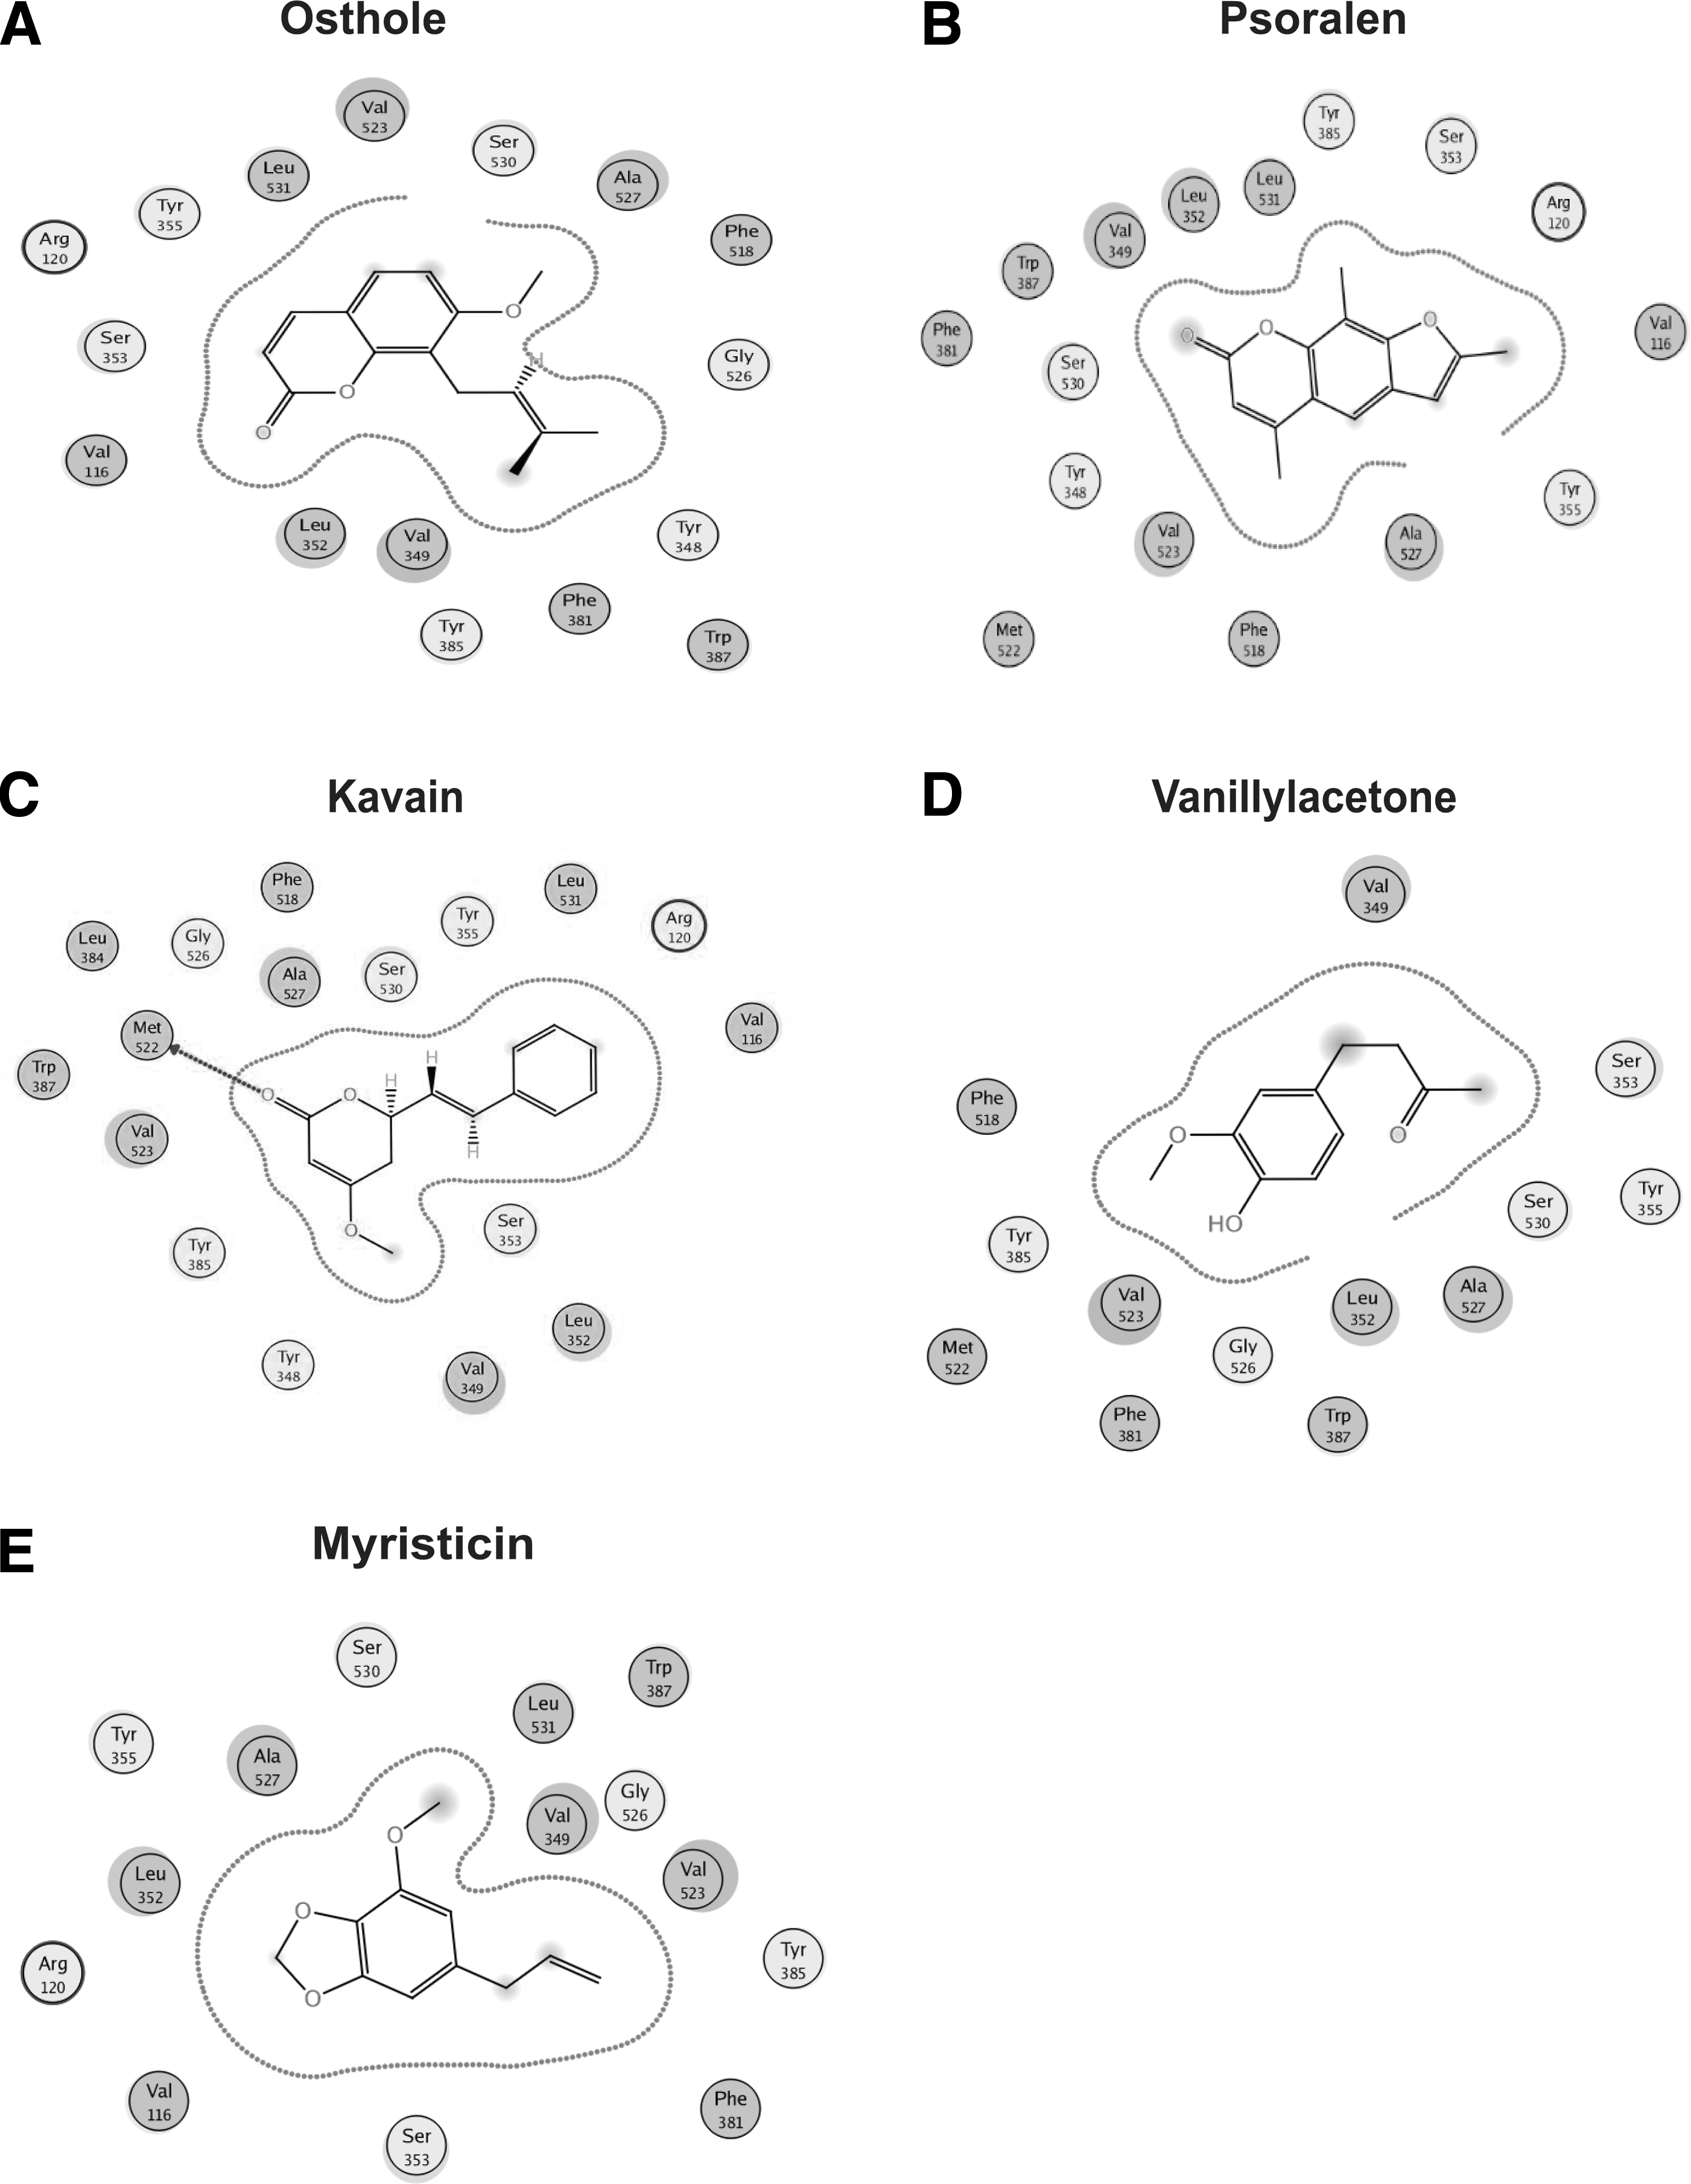
Two-dimensional view of the binding interaction of five virtual hits with COX-2.
Chemicals Identified as COX-2 Inhibitor by FS-Random Forest (Feature Selection-Random Forest) Model and Molecular Docking in Nature Product Library
RMSD, root mean square deviation.
3.4. Validation of inhibition activity in mRNA and protein level in HepG2 cell
As the selected library presented with the value of the half-maximal inhibitory concentration (IC50), whether the chemical has cytotoxicity is unknown. To do this, HepG2 cells were treated with the five hit compounds, and LC50 value of osthole, psoralen, and kavain was 120, 525, and 547 μM; furthermore, the lethal concentration 50 (LC50) value of vanillyl acetone and myristicin was higher than 1000 μM (Fig. 8).
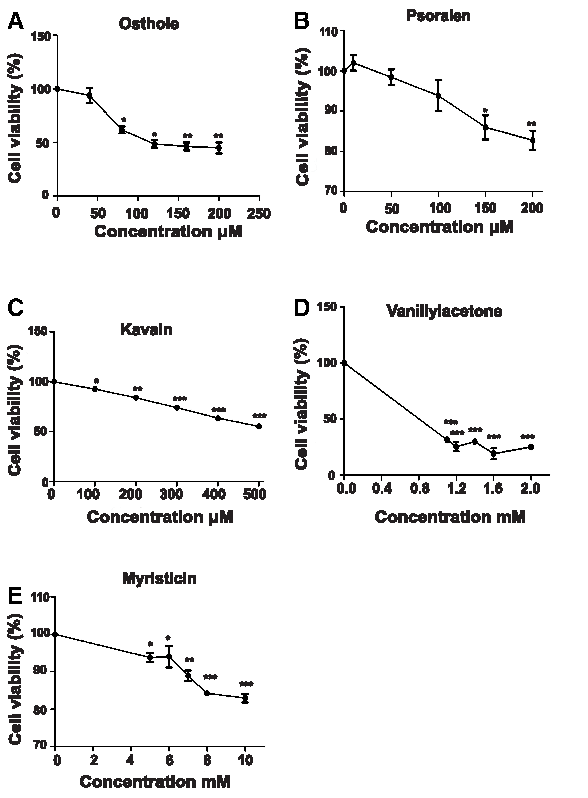
The cell viability was determined in HepG2 cell in a dose-dependent manner after the five hits' treatment.
To investigate whether screened chemicals from the natural product library suppress COX-2 expression in mRNA level, we performed real-time quantification in HepG.2 cells treated for 24 hours with the five hit compounds, but only osthole, psoralen, and kavain exhibited a decrease in COX-2 mRNA expression (Fig. 9). To investigate whether selected chemicals from the natural product library suppress COX-2 expression in protein level, we performed Western blotting in HepG2 cells treated for 24hr with the five hit compounds; only osthole, psoralen, and kavain inhibited COX-2 protein expression, yet myristicin elevated inversely (Fig. 10).
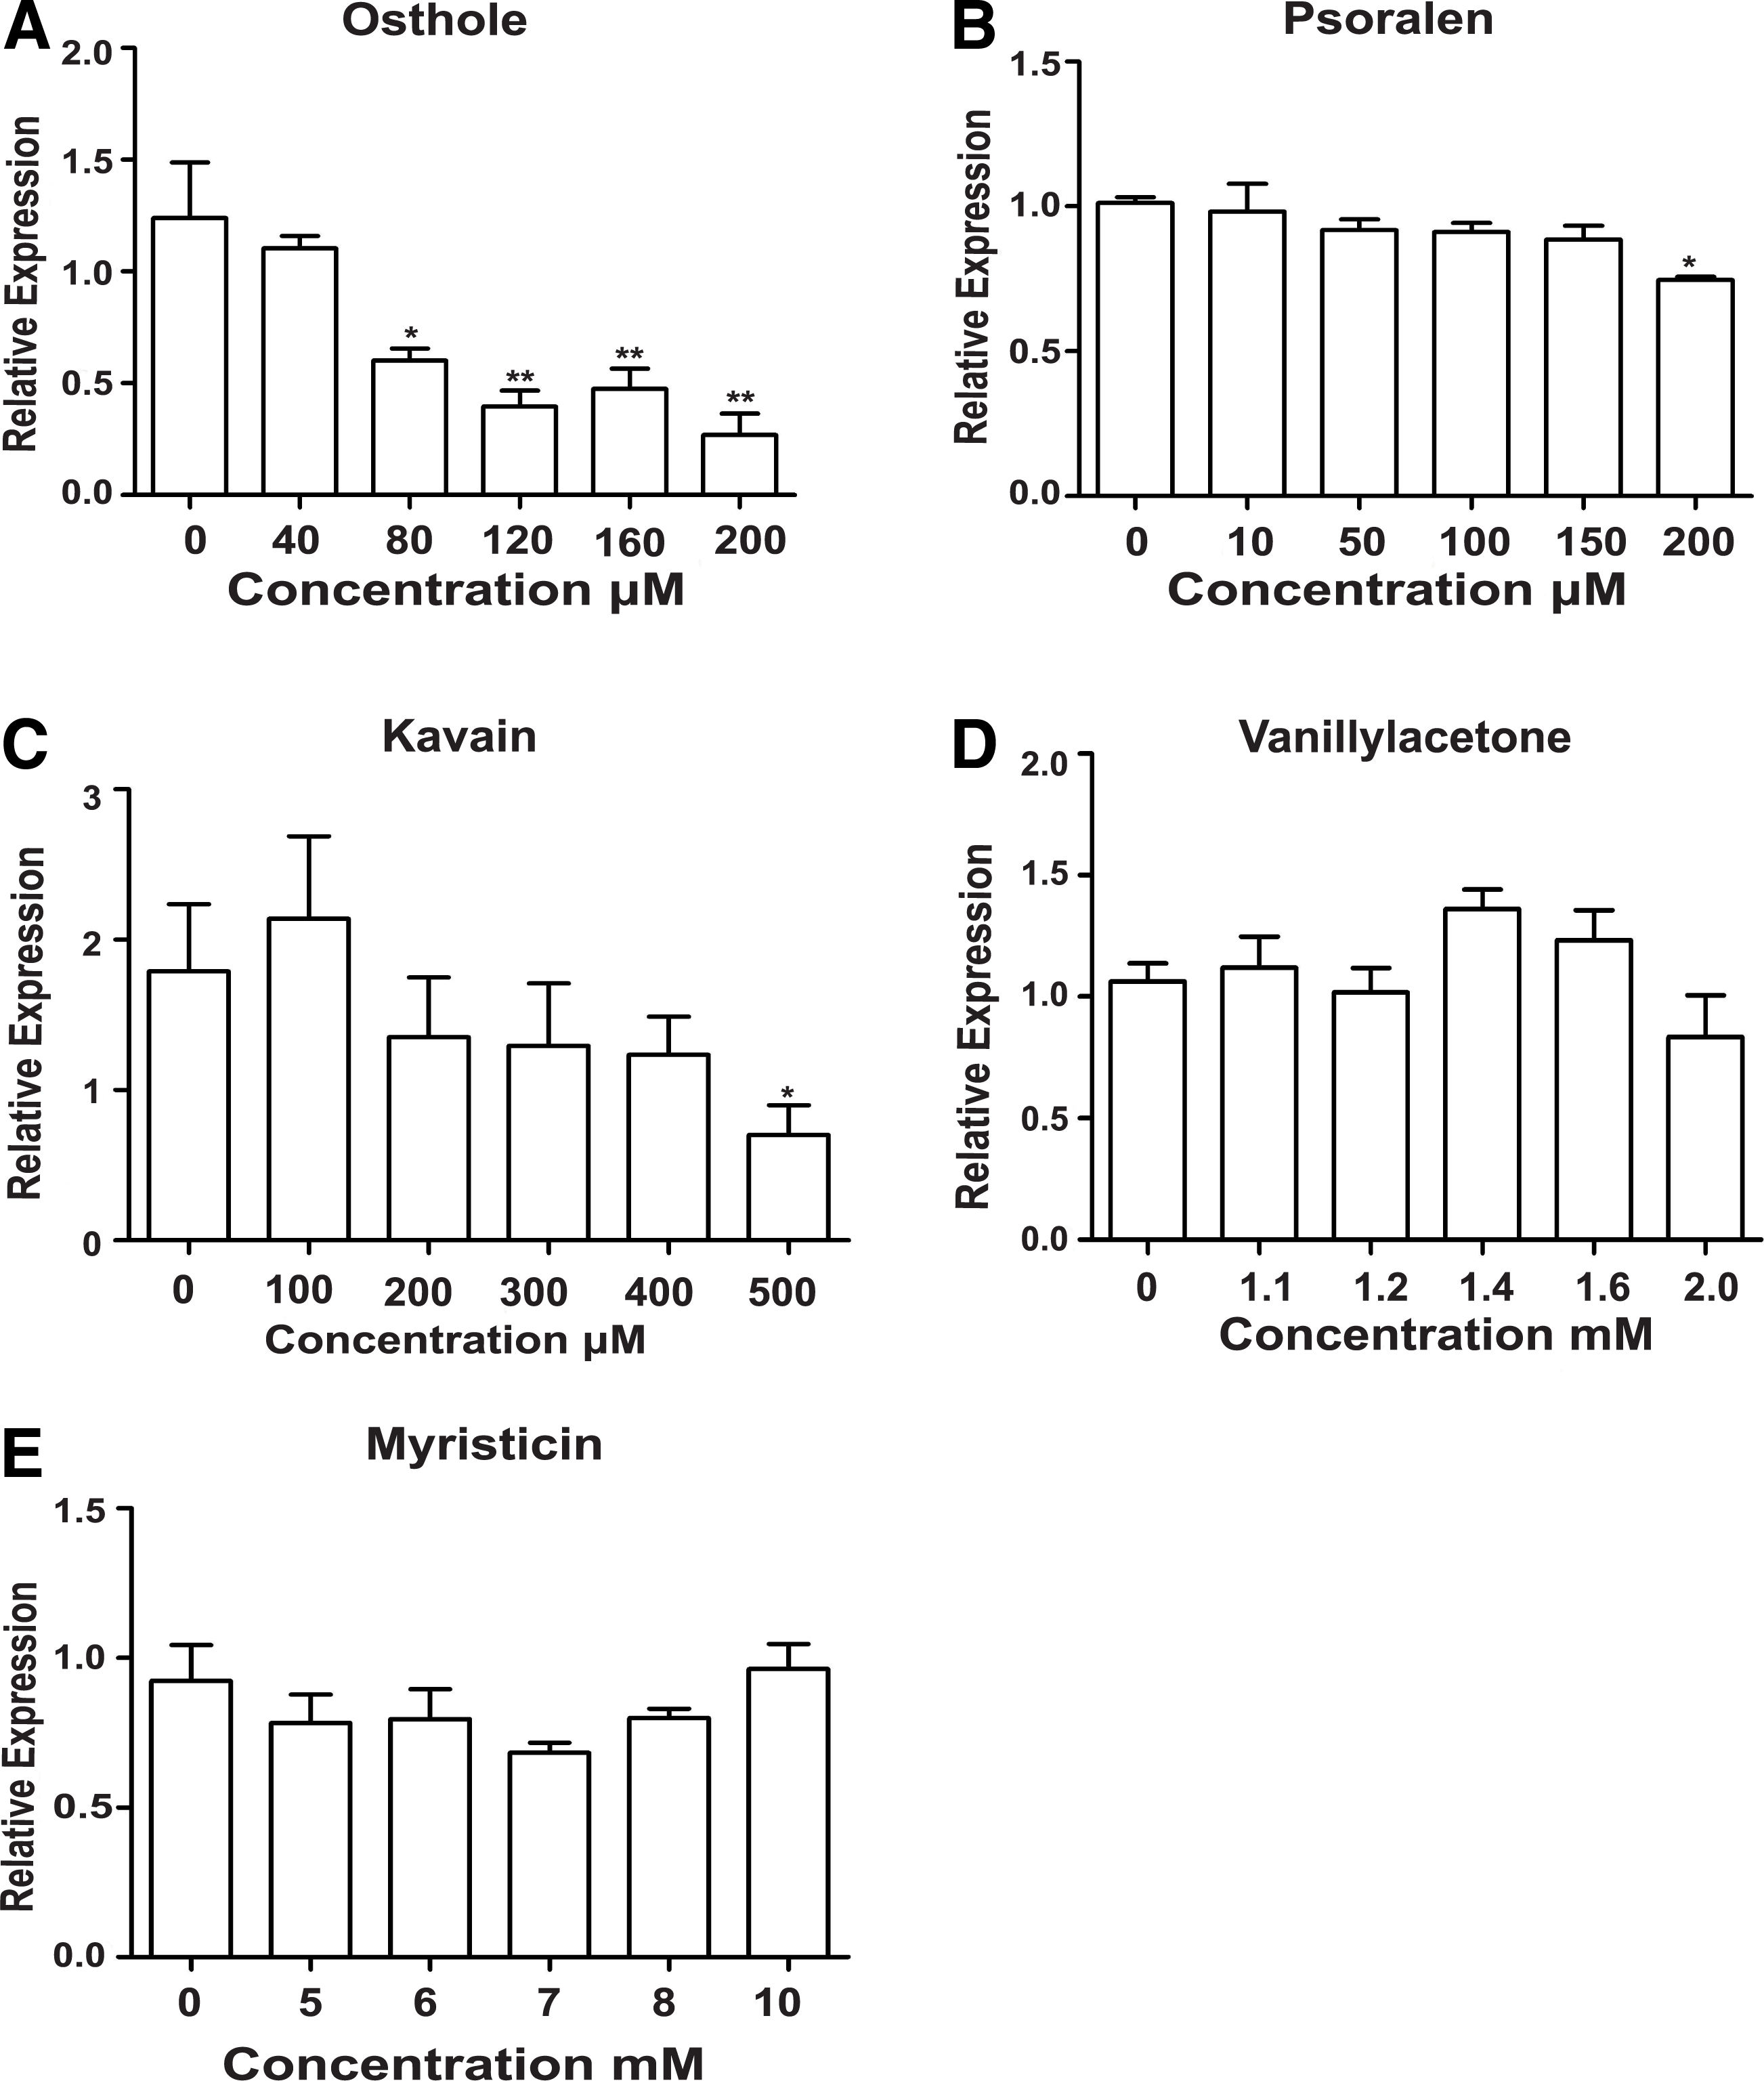
The mRNA level was determined by real-time PCR in HepG2 cell in a dose-dependent manner after the five hits' treatment.
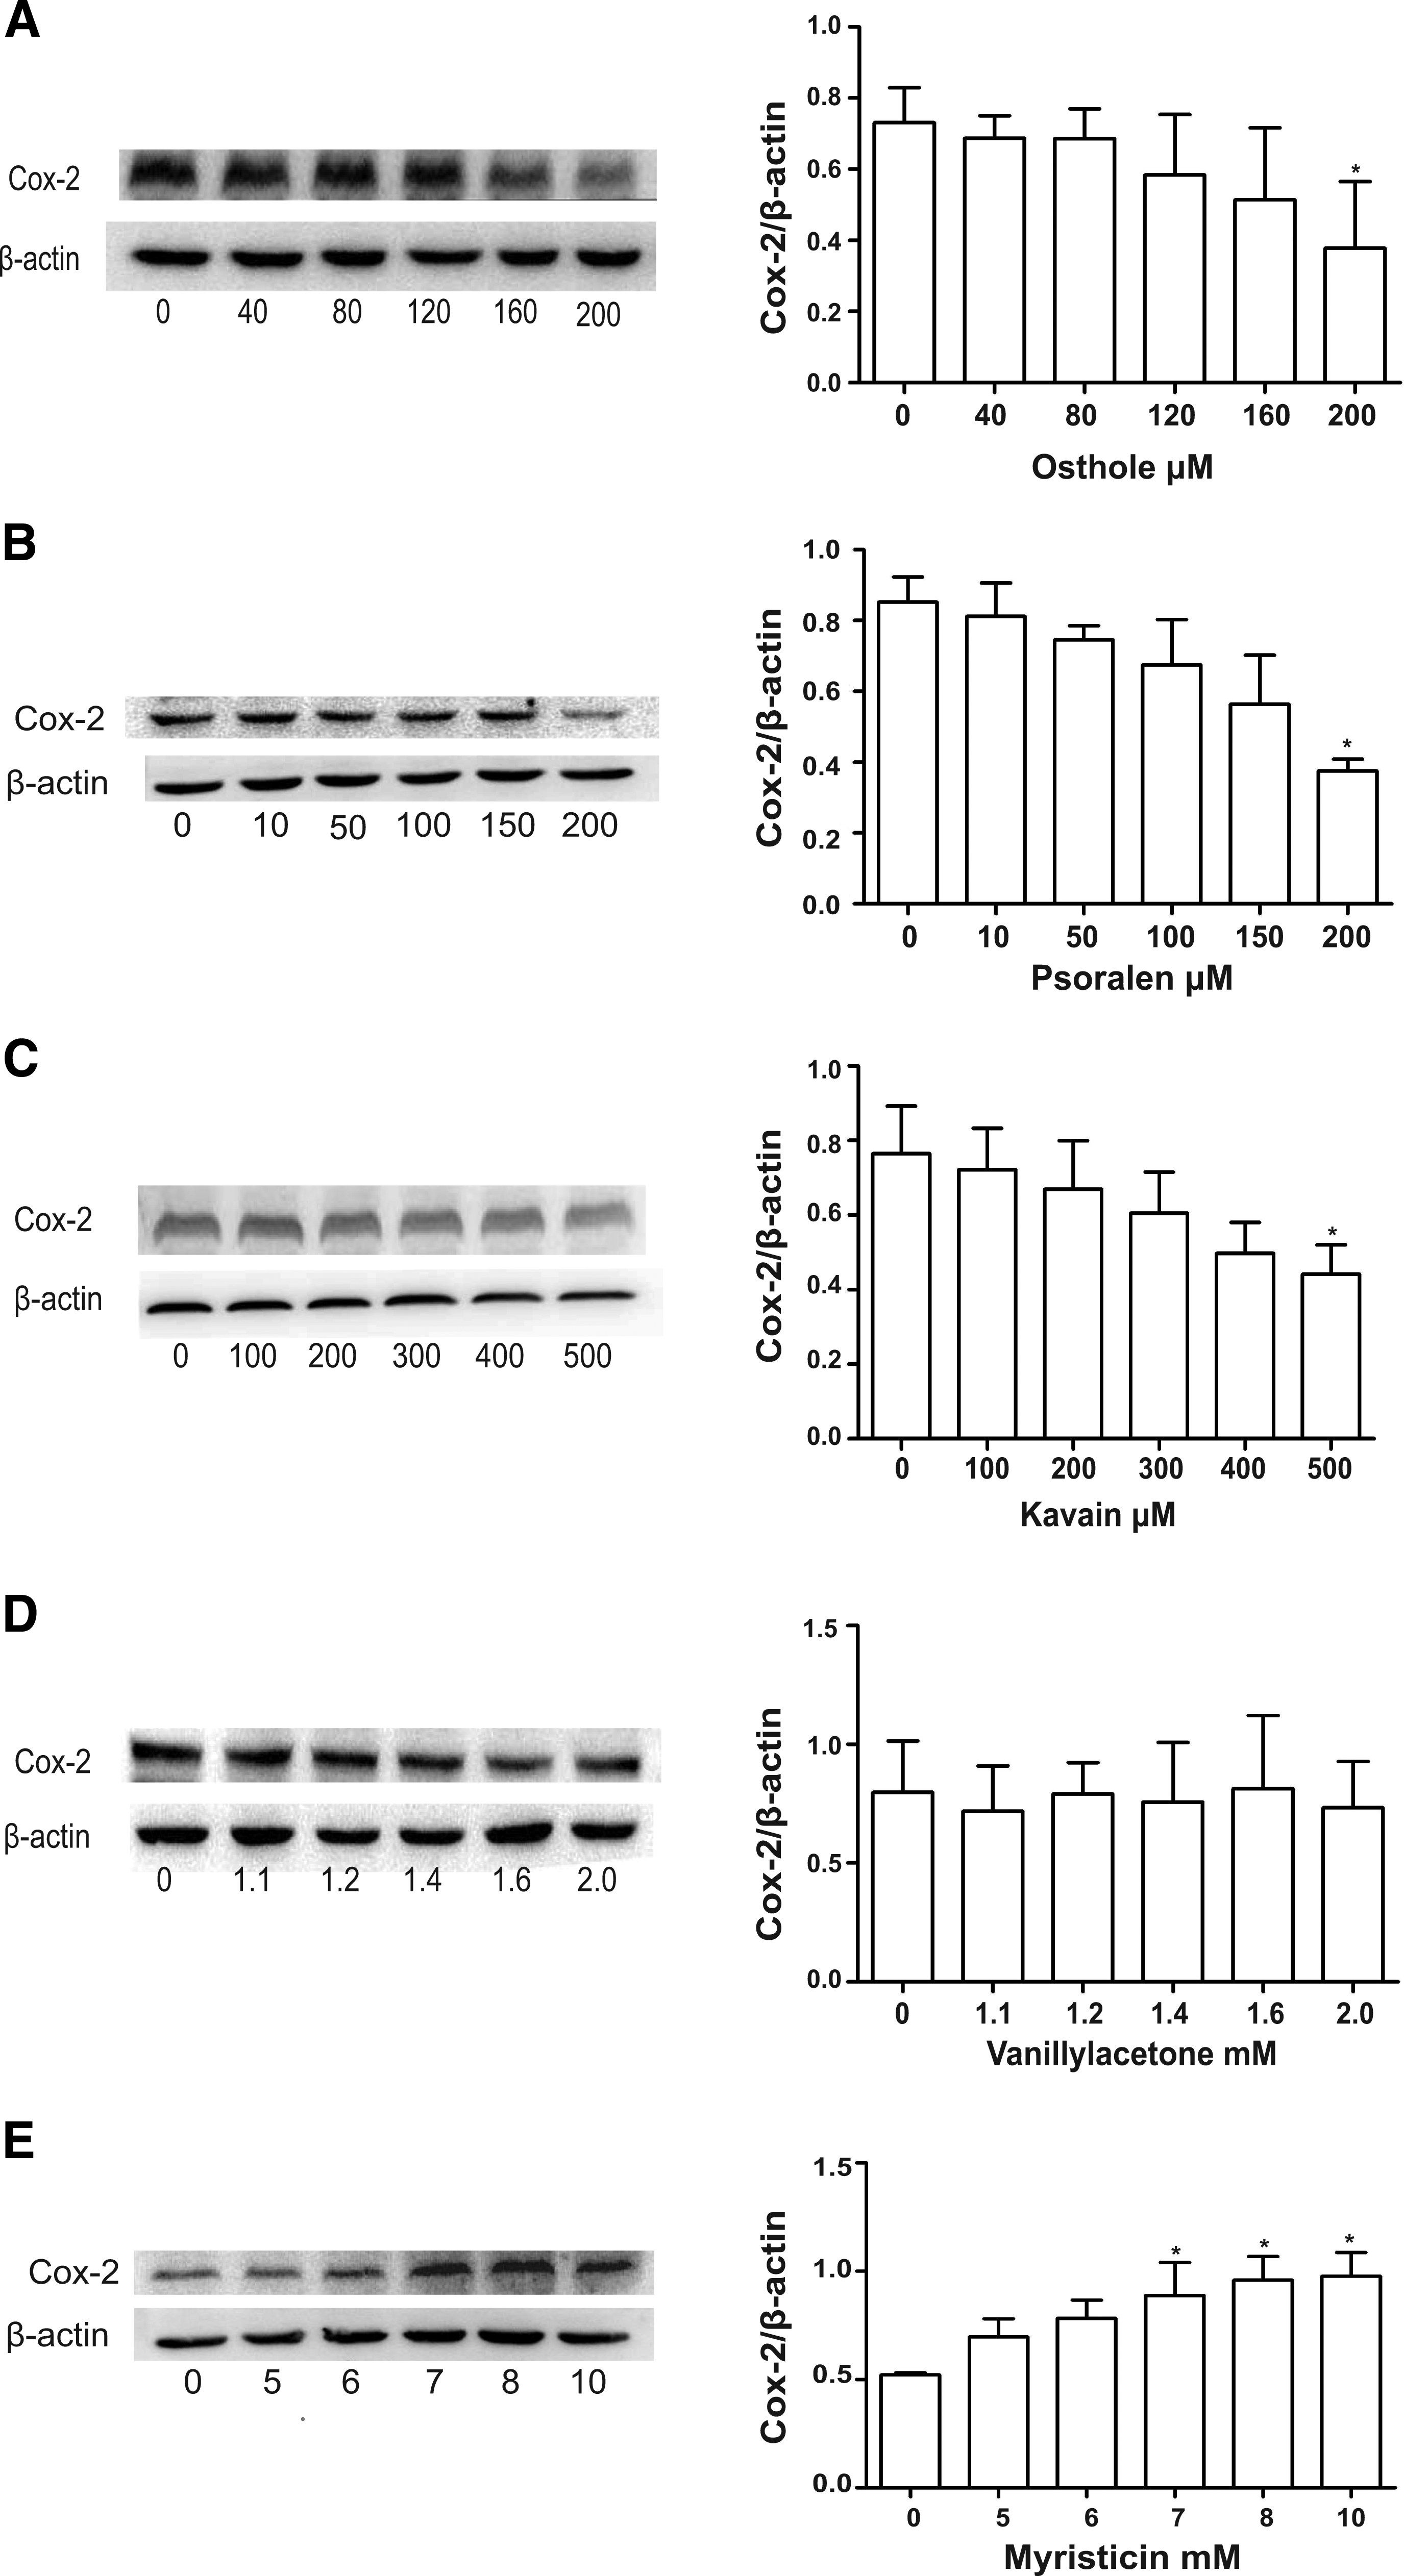
The protein level was determined by Western blotting in HepG2 cell in a dose-dependent manner after the five hits' treatment.
Conclusion
In this work, a combination of RF and SOM neural network has been used to develop QSAR models that could discriminate COX-2 inhibitors from high and low activity, adopted in the natural product library to screen COX-2 inhibitors. According to the selected chemicals by virtual screening, we further investigated the interaction between COX-2 protein structure and chemical by molecular docking analysis in MOE. Through the above two steps, we predicted that osthole, kavain, vanillyl acetone, myristicin, and psoralen have COX inhibitor activity, however, only osthole, psoralen, and kavain showed COX inhibitor activity in mRNA and protein levels in HepG2 cells.
Footnotes
Acknowledgment
L.P. was supported by the Natural Science Foundation of Hainan Province (No. 817143).
Author Disclosure Statement
The authors declare they have no conflicting financial interests.