
Abstract
We aimed to identify critical genes for metastasis and prognosis of high-grade serous ovarian cancer (HGSOC). The mRNA data of GSE73064 including 15 HGSOC samples (5 primary tumor cells, 5 ascites tumor cells, and 5 metastasis tumor cells) were applied for the present analysis. The data were first preprocessed using robust multiarray average (RMA) method, and time-series gene expression analyses were performed using short time-series expression miner (version 1.3.11). Then, functional analysis for clustered genes was conducted, and protein–protein interaction (PPI) network was constructed. Subnetwork module was also analyzed. After that, we analyzed the miRNA regulatory network. Finally, survival analysis was performed. In this study, PPBP, ITGB2, and ITGAM were genes with higher degrees in the PPI network. miR-4469, miR-6734-5p, and miR-1304-5p were several of important miRNAs in the miRNA-target regulatory network. In addition, survival analysis showed that nine genes such as CLEC5A, FPR1, and CXCL12 might be important for HGSOC prognosis. PPBP, ITGB2, and ITGAM may be critical for HGSOC metastasis. CLEC5A, FPR1, and CXCL12 may be important for the prognosis of HGSOC. Furthermore, miR-4469, miR-6734-5p, and miR-1304-5p may be important miRNAs associated with HGSOC.
1. Introduction
High-grade serous ovarian cancer (HGSOC), the most aggressive type of ovarian cancer (OC), accounts for most death resulted from gynecological cancers (Reiner et al., 2017). Worldwide, OC is the seventh most common cancers in females, and more than 239,000 patients are diagnosed with OC each year (Ferlay et al., 2015). Although initial treatment for OC has higher response rate, most patients develop chemotherapy resistance eventually (Coleman et al., 2013). In the past few decades, there has been no significant change in the overall survival of HGSOC (Bowtell et al., 2015). Therefore, it is significant to identify effective treatment for HGSOC to improve the overall survival rate of it.
Understanding of the important genes or miRNAs for the development of HGSOC may provide clues for the finding of effective therapy. Some previous studies have indicated that some genes or miRNAs are significantly associated with HGSOC. For example, Zaid et al. (2013) indicated that fibroblast growth factor receptor 4 (FGFR4) could be regarded as a prognostic marker for HGSOC. Kannan et al. (2014) showed that CDKN2D-WDFY2 might be a clinical biomarker for HGSOC detection. Cesaratto et al. (2016) suggested that BNC2 might be a suppressor gene in HGSOC. FRS2 was identified as an oncogene in HGSOC by the study of Luo et al. (2015). In addition, miR-29a played tumor-suppressive roles in OC (Creighton et al., 2012). miR-34c might be a tumor suppressor in HGSOC and might have potential therapeutic advantages in this cancer (Zhifeng et al., 2014). Yu et al. (2014) showed that miR-1236-3p inhibited cell invasion and migration in HGSOC via targeting zinc-finger E-box binding homeobox 1 (ZEB1). Many previous studies reported the critical genes or miRNAs for HGSOC metastasis, but these studies were mainly focused on primary and metastasis tumor samples (Lalarukh et al., 2010; Ruifen et al., 2014; Tucker et al., 2014), and the study of ascites tumor, as intermediate stage of primary tumor and metastasis tumor, is limited. Ascites progression is related to the development of HGSOC in patients (Emma et al., 2013). Thus, not only primary tumor and metastasis tumor are important for the study of HGSOC metastasis but also ascites tumor is significant for it.
In this study, we aimed to identify critical genes for HGSOC metastasis and prognosis by combining primary tumor, ascites tumor, and metastasis tumor samples. First, the mRNA data of GSE73064 including15 HGSOC samples (5 primary tumor cells, 5 ascites tumor cells, and 5 metastasis tumor cells) were applied for the analysis. The data were preprocessed and time-series gene expression analyses were performed. Then, functional analysis for clustered genes was conducted, and protein–protein interaction (PPI) network was constructed. Subnetwork module was also analyzed. After that, we analyzed the miRNA regulatory network. Finally, survival analysis was performed and survival-related mRNAs in subnetwork modules were selected.
2. Materials and Methods
2.1. Data source
The mRNA data of GSE73064, the platform of which was GPL570 [HG-U133_Plus_2] Affymetrix Human Genome U133 Plus 2.0 Array, were downloaded from Gene Expression Omnibus database. There were 15 HGSOC samples (5 primary tumor cells, 5 ascites tumor cells, and 5 metastasis tumor cells) in these data.
2.2. Data preprocessing
The downloaded expression profile data (cel format) were preprocessed using R (3.4.3) package Affy (version 1.56.0, http://bioconductor.org/packages/release/bioc/html/affy.html). Data normalization was performed using robust multiarray average (RMA) method in Affy. The probe ID was mapped to gene symbol using annotation files in the platform. The probe not mapping to gene symbol was removed. For different probes mapping to the same symbol, the mean values of different probes were applied as the final expression value of this gene.
2.3. Identification of time-series genes
Short time-series expression miner (STEM) is a tool used to analyze gene expression data of short time series (Ernst and Bar-Joseph, 2006). Cluster analysis for gene expression profile of different time points was performed using STEM (version 1.3.11, www.cs.cmu.edu/~jernst/stem). The parameters were set as following: number of genes not less than 20, correlation coefficient of gene expression higher than 0.7, p-value less than 0.05, and Homo sapiens as gene annotation source. Genes with consistent trends were clustered together for the subsequent analyses.
2.4. Functional analysis for clustered genes
Gene Ontology (GO)–biological process (BP) (Ashburner et al., 2000) and Kyoto Encyclopedia of Genes and Genomes (KEGG) pathway (Kanehisa and Goto, 2000) were analyzed to obtain two-color module gene sets using DAVID (Da et al., 2009) (version 6.8, https://david.ncifcrf.gov). p-Value <0.05 and count ≥2 were applied as screening criteria.
2.5. PPI network for clustered target genes and subnetwork analysis
The interaction between proteins encoded by two-color module genes was predicted based on STRING (version 10.5) database (Szklarczyk et al., 2017). The PPI network was constructed using Cytoscape (version 3.6.1) (Kohl et al., 2011). Degree centrality was applied to analyze node score in the network. Higher node scores indicated the importance of this node in the network, more likely to be key nodes. MCODE (version 1.4.2) plug-in (Bandettini et al., 2012) in Cytoscape software was used to analyze the subnetwork for the PPI network. The threshold value was >5.
2.6. miRNA regulatory network analysis
Based on ENCODE miRTarBase data in Enrichr database (Chen et al., 2013), upstream miRNAs that regulated the genes in subnetwork modules were predicted. The results with p-value <0.05 were selected. miRNA-target regulatory relationships were sort out, and the miRNA-target regulatory network was constructed.
2.7. Survival analysis
Disease (ovarian) information in The Cancer Genome Atlas (TCGA) database (http://firebrowse.org) was searched, and the data of 307 tumor samples were selected to use in the study. Combining clinical survival information of samples in TGCA database, the samples were divided into two groups (high expression and low expression groups) based on the expression values of genes in tumor group using R package Survival (version 2.42-6, https://cran.r-project.org/web/packages/survival/index.html). Log-rank statistical test was carried out. Survival-related mRNAs in subnetwork modules were selected with setting p < 0.05 as significant threshold value.
3. Results
3.1. Data preprocessing
After preprocessing, 20,192 genes were obtained. As presented in Figure 1, after normalization, the median of the data was on the same horizontal line, indicating good effect.
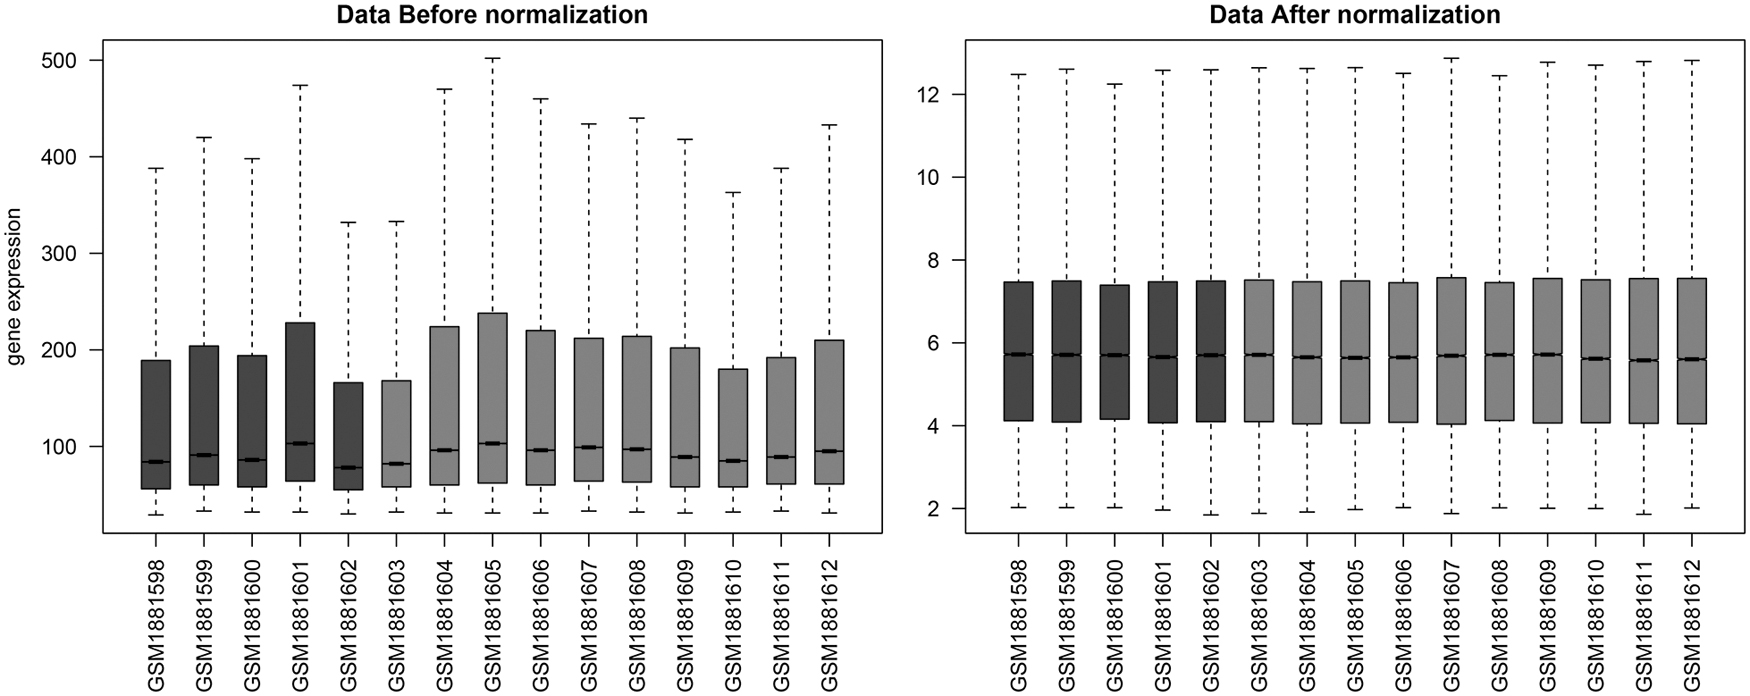
The box plot of expression profiles for the two set of data before and after normalization. Dark grey: normal samples; light grey: disease samples; lateral axis: sample name.
3.2. Identification of time-series genes
Four significantly enriched clusters were screened through time-series gene expression analysis (Fig. 2). The same color indicated the same trends; therefore, profile 10 and profile 14 were combined as dark grey-profile (494 genes) and profile 5 and profile 1 were combined as light grey-profile (303 genes). Collectively, these 797 genes were identified as time-series genes relative with HGSOC.
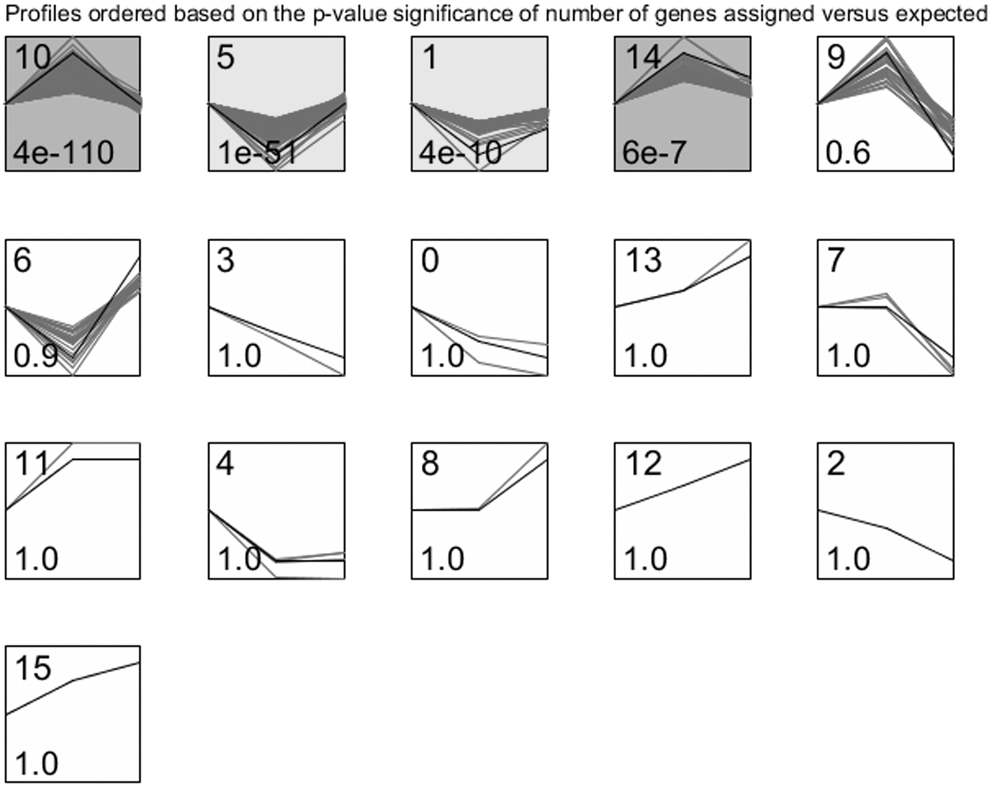
STEM cluster analysis. The square represents the different cluster gene sets obtained by STEM, and black polygonal line in square indicates the overall trend of all gene expressions in this gene set. The number in the left bottom of square indicates significant p-value in this gene set. Square in color represents significant difference. Square with the same color represents the same trend of the gene sets. STEM, short time-series expression miner.
3.3. Functional analysis for clustered genes
After functional analysis for mRNA in dark grey-profile and light grey-profile, pathways and GO-BP results associated with these genes were obtained. The top 10 results for dark grey-profile and light grey-profile are shown in Figure 3. Most genes in dark grey-profile were significantly enriched in Staphylococcus aureus infection pathway (e.g., FPR1), rheumatoid arthritis pathway (e.g., CXCL12), and lysosome pathway (e.g., CXCL12, Fig. 3A). Most genes in light grey-profile were significantly enriched in response to virus and negative regulation of viral genome replication (e.g., ISG20, Fig. 3B).
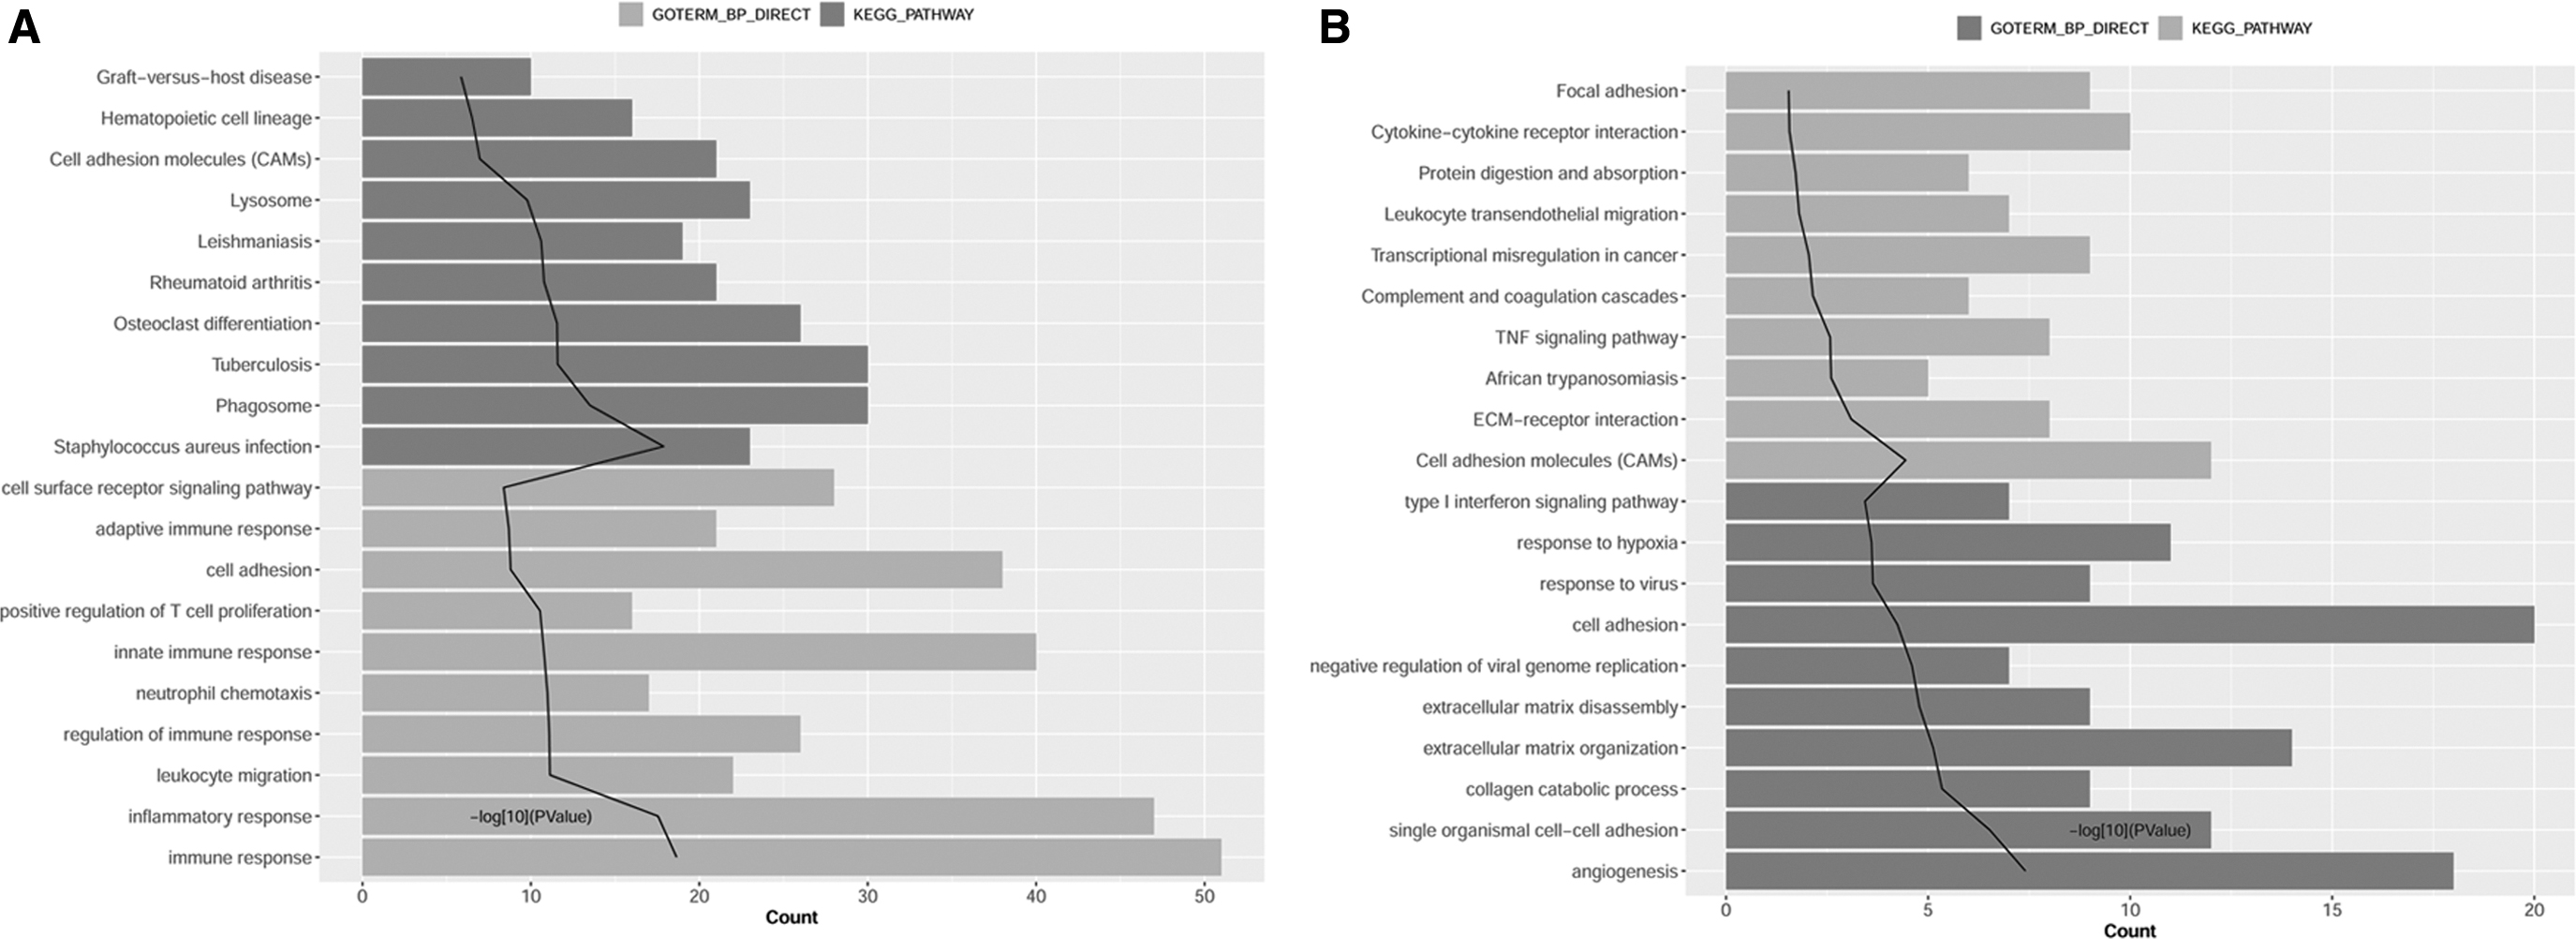
The results of pathways and GO-BP involved by dark grey-profile genes
3.4. PPI network analysis and subnetwork analysis
There were 369 nodes and 1417 interaction pairs in the PPI network (Fig. 4). Five modules were obtained using Cytoscape plug-in MCODE with the threshold score of >5. Module 1 (score = 19.59) included 40 nodes and 382 interaction pairs, module 2 (score = 15) included 15 nodes and 105 interaction pairs, module 3 (score = 10.545) included 12 nodes and 58 interaction pairs, module 4 (score = 7.529) included 35 nodes and 128 interaction pairs, and module 5 (score = 7.25) included 9 nodes and 29 interaction pairs. The degrees of genes in the PPI network and modules are presented in Table 1. PPBP, ITGB2, and ITGAM were highlighted in the PPI network with high degrees.
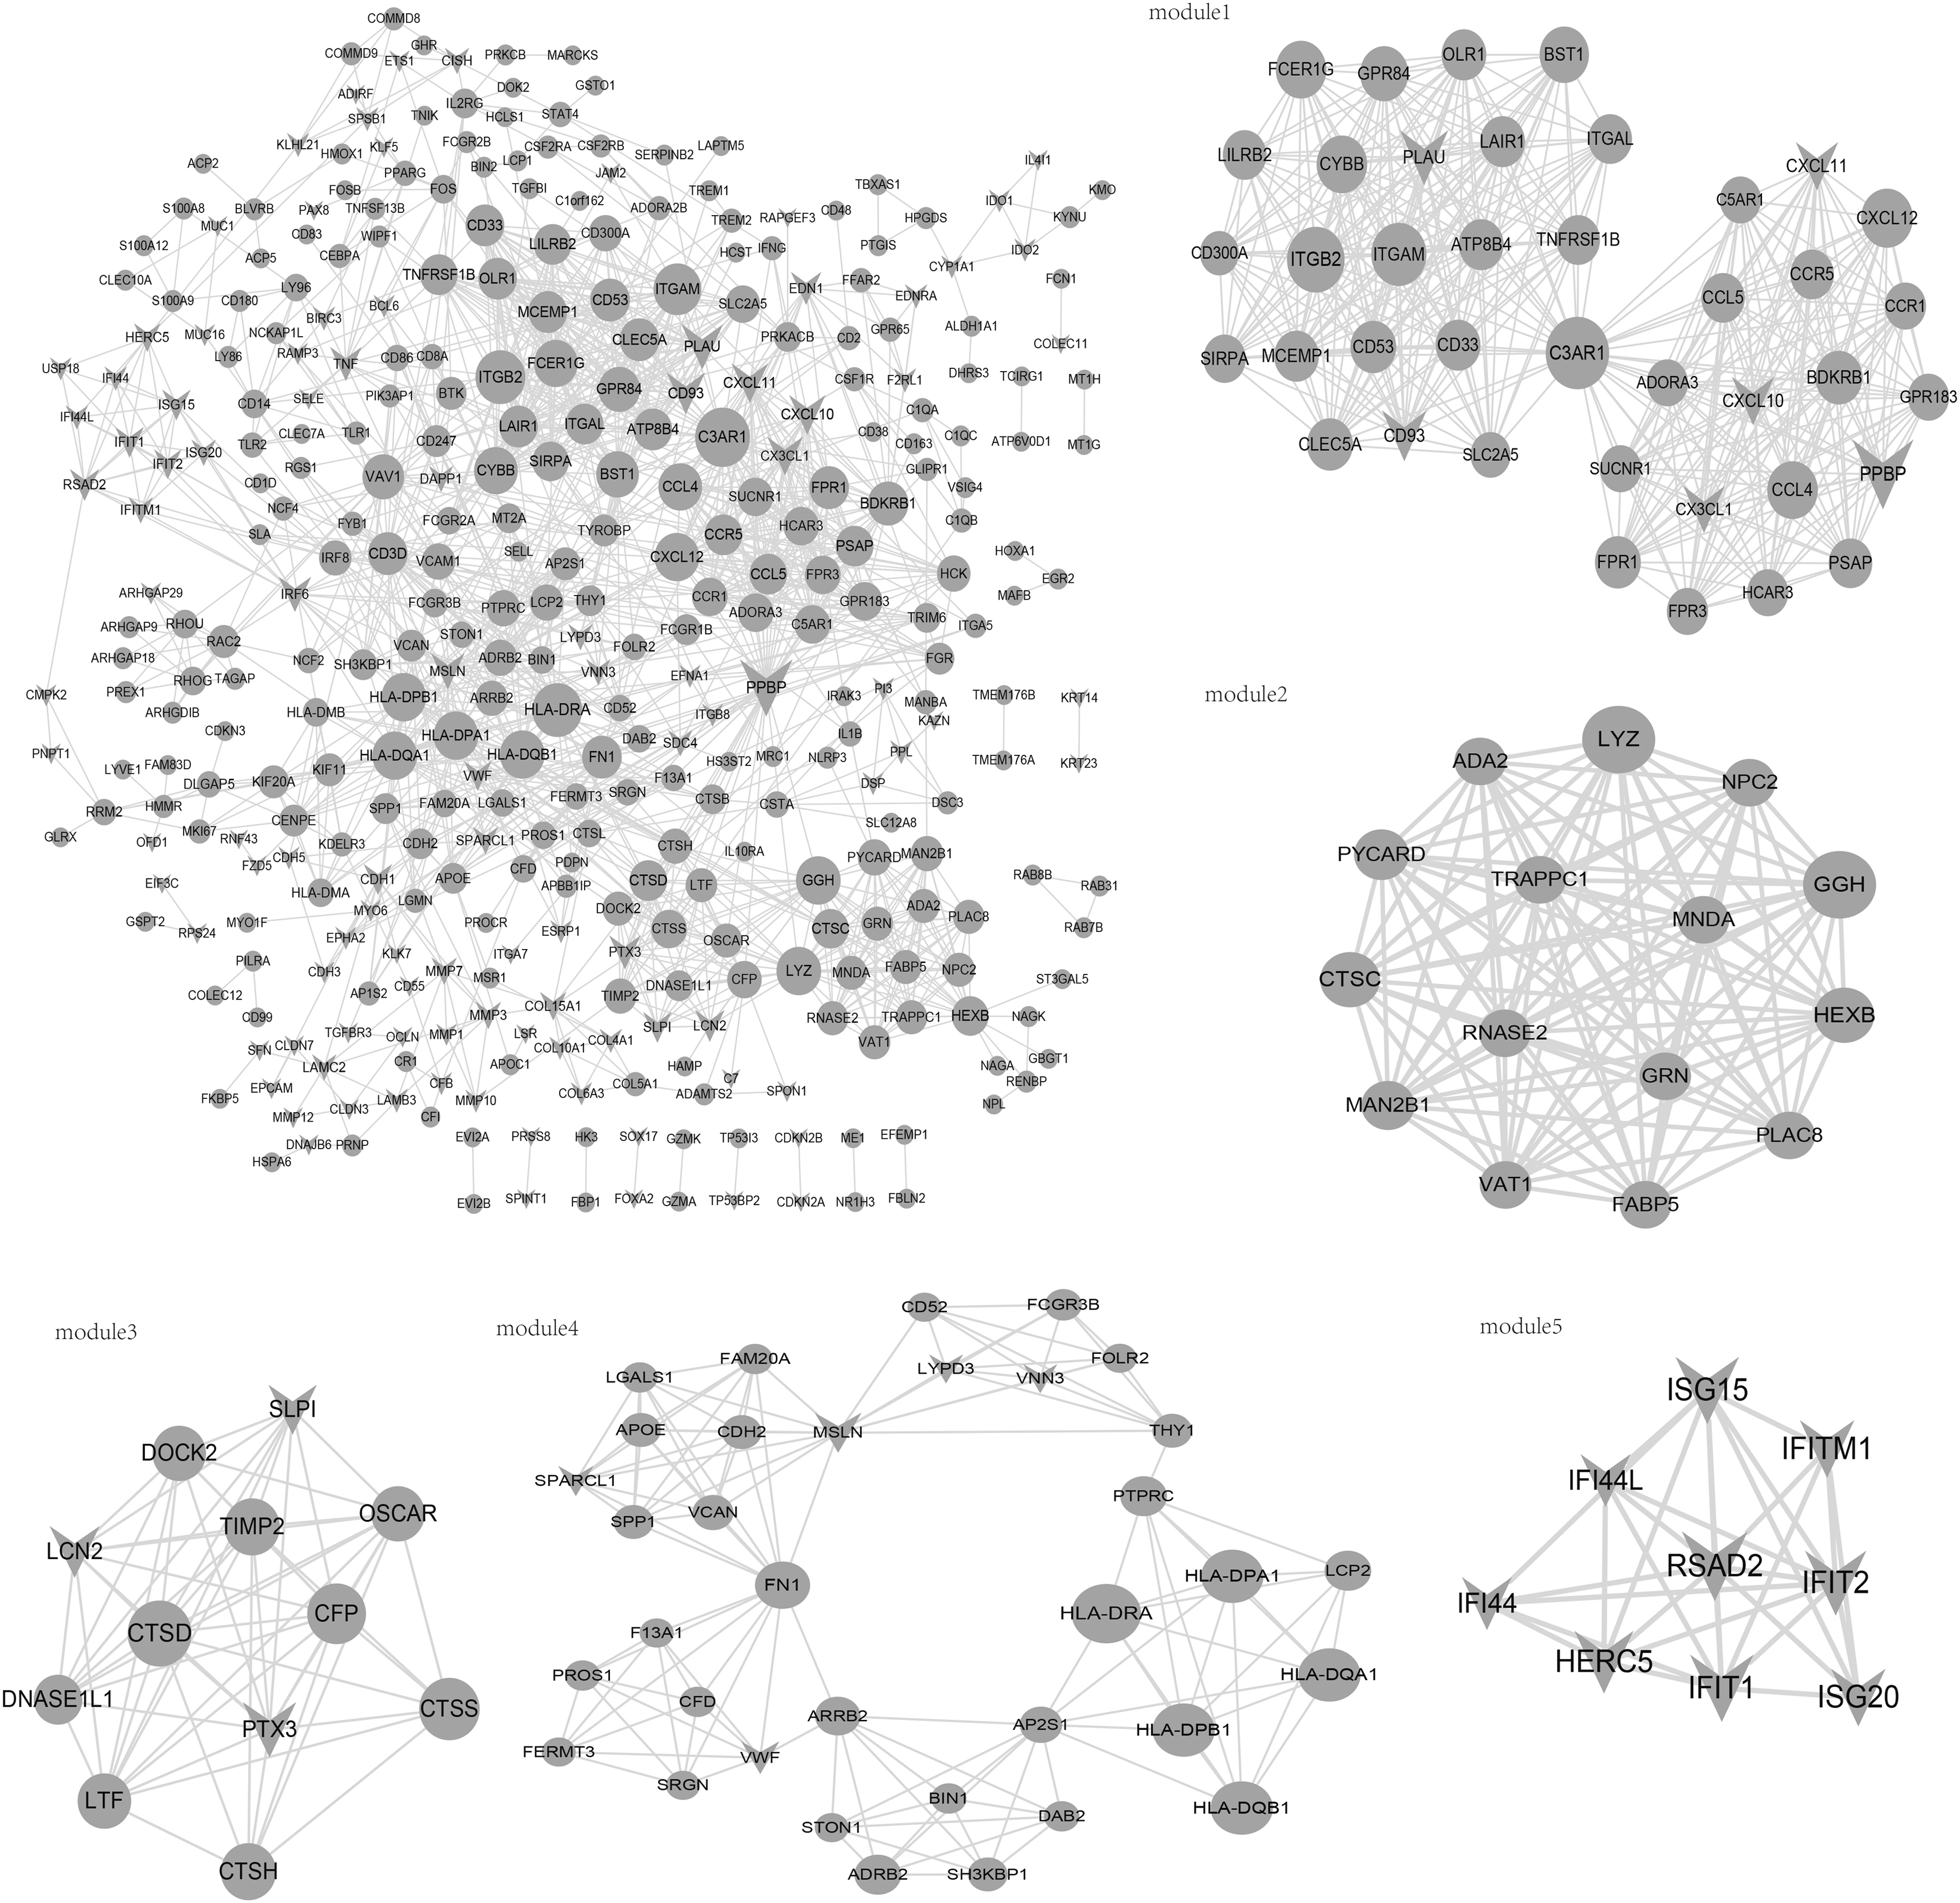
PPI network for clustered genes. Circle: dark grey-profile genes; triangle: light grey-profile genes. PPI, protein–protein interaction.
The Degrees of Genes in the Protein–Protein Interaction (Top 30) and Submodule Networks
3.5. miRNA regulatory network analysis
A total of 24 miRNAs were predicted, and 85 miRNA-target regulatory pairs were obtained. There were 29 genes from dark grey-profile and 13 genes from light grey-profile in this regulatory relation pairs. The miRNA-target regulatory network is presented in Figure 5. VAT1, OLR1, and SLC2A5 were targeted by more miRNAs than other genes. miR-1-3p and miR-146a-5p targeted more genes than other miRNAs in this regulatory network. For example, ISG20 and CXCL12 were targeted by miR-1-3p, and CXCL12 was targeted by miR-146a-5p. miR-4469, miR-6734-5p, and miR-1304-5p were also several of important miRNAs in the miRNA-target regulatory network.
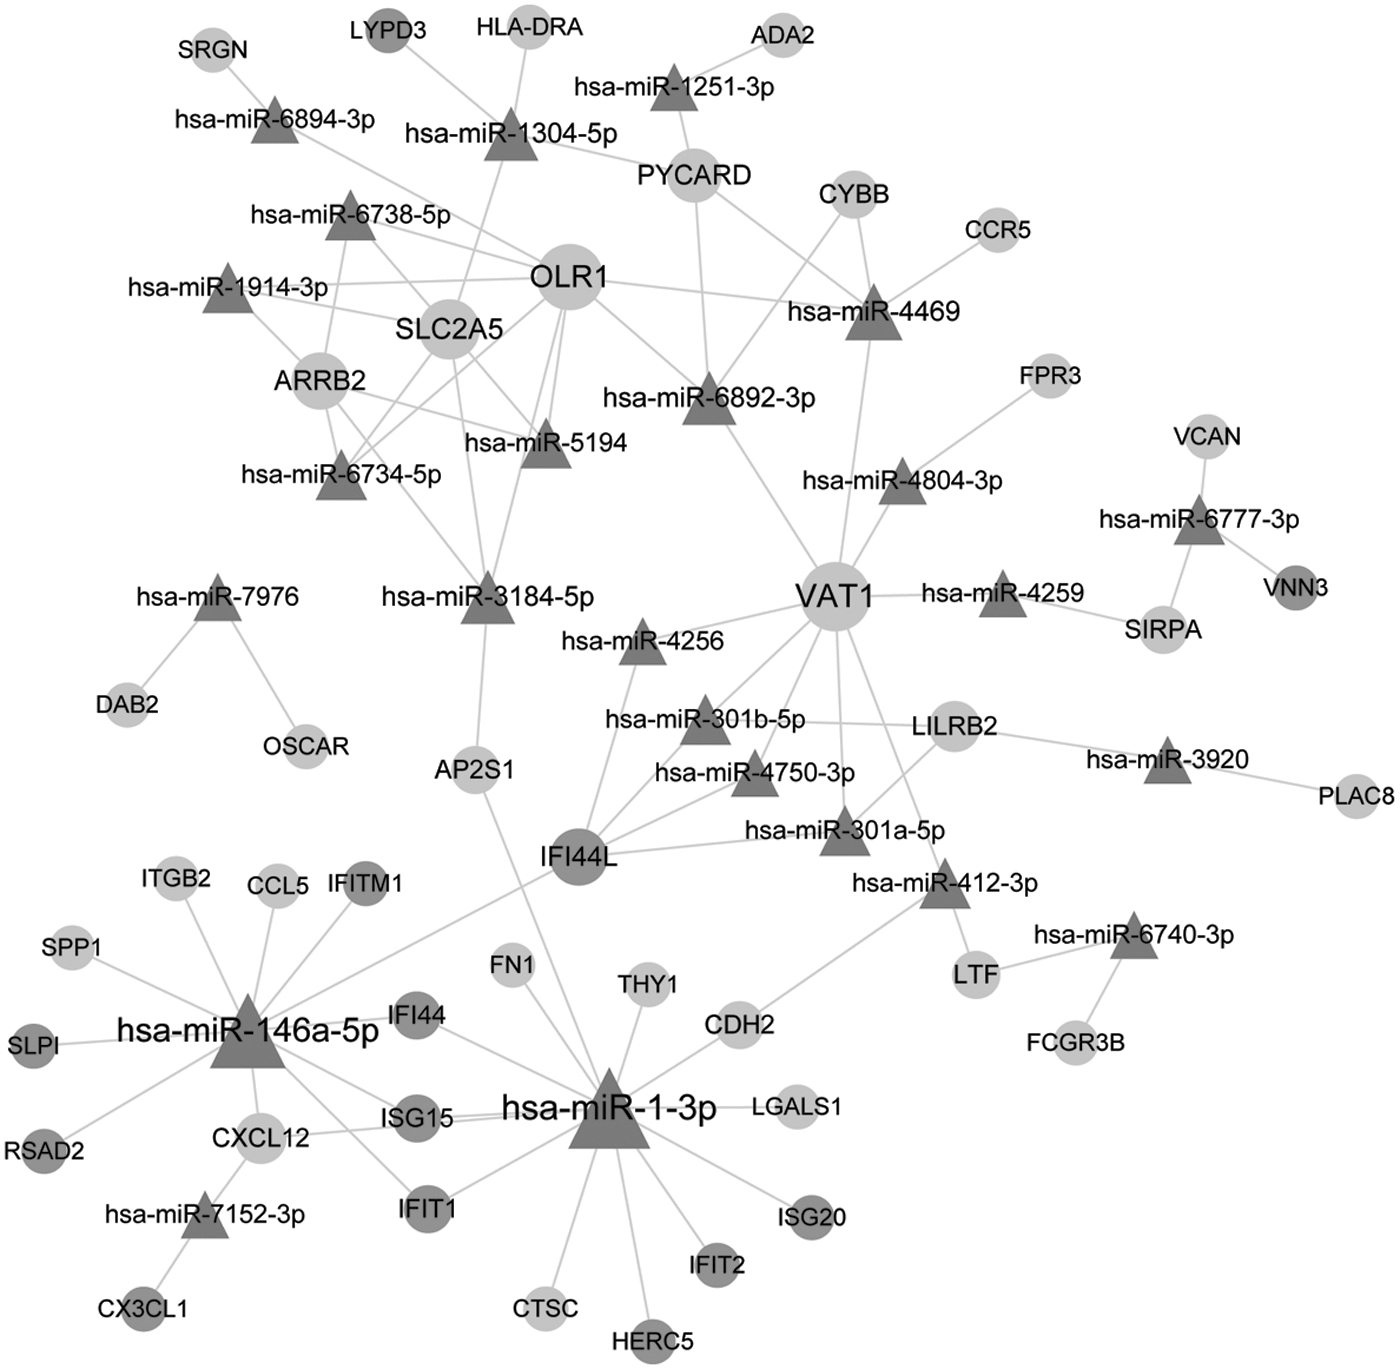
The miRNA-target regulatory network. light grey circle: dark grey-profile genes; dark grey circle: light grey-profile genes; triangle: miRNA.
3.6. Screening of prognosis-related genes
A total of 111 subnetwork genes were extracted to screen prognosis-related genes. We obtained nine genes (ISG20, CLEC5A, ADORA3, CD300A, BDKRB1, THY1, FPR1, CXCL12, and SPP1) that were associated with the prognosis of HGSOC. Kaplan–Meier survival curves for these nine genes are shown in Figure 6.
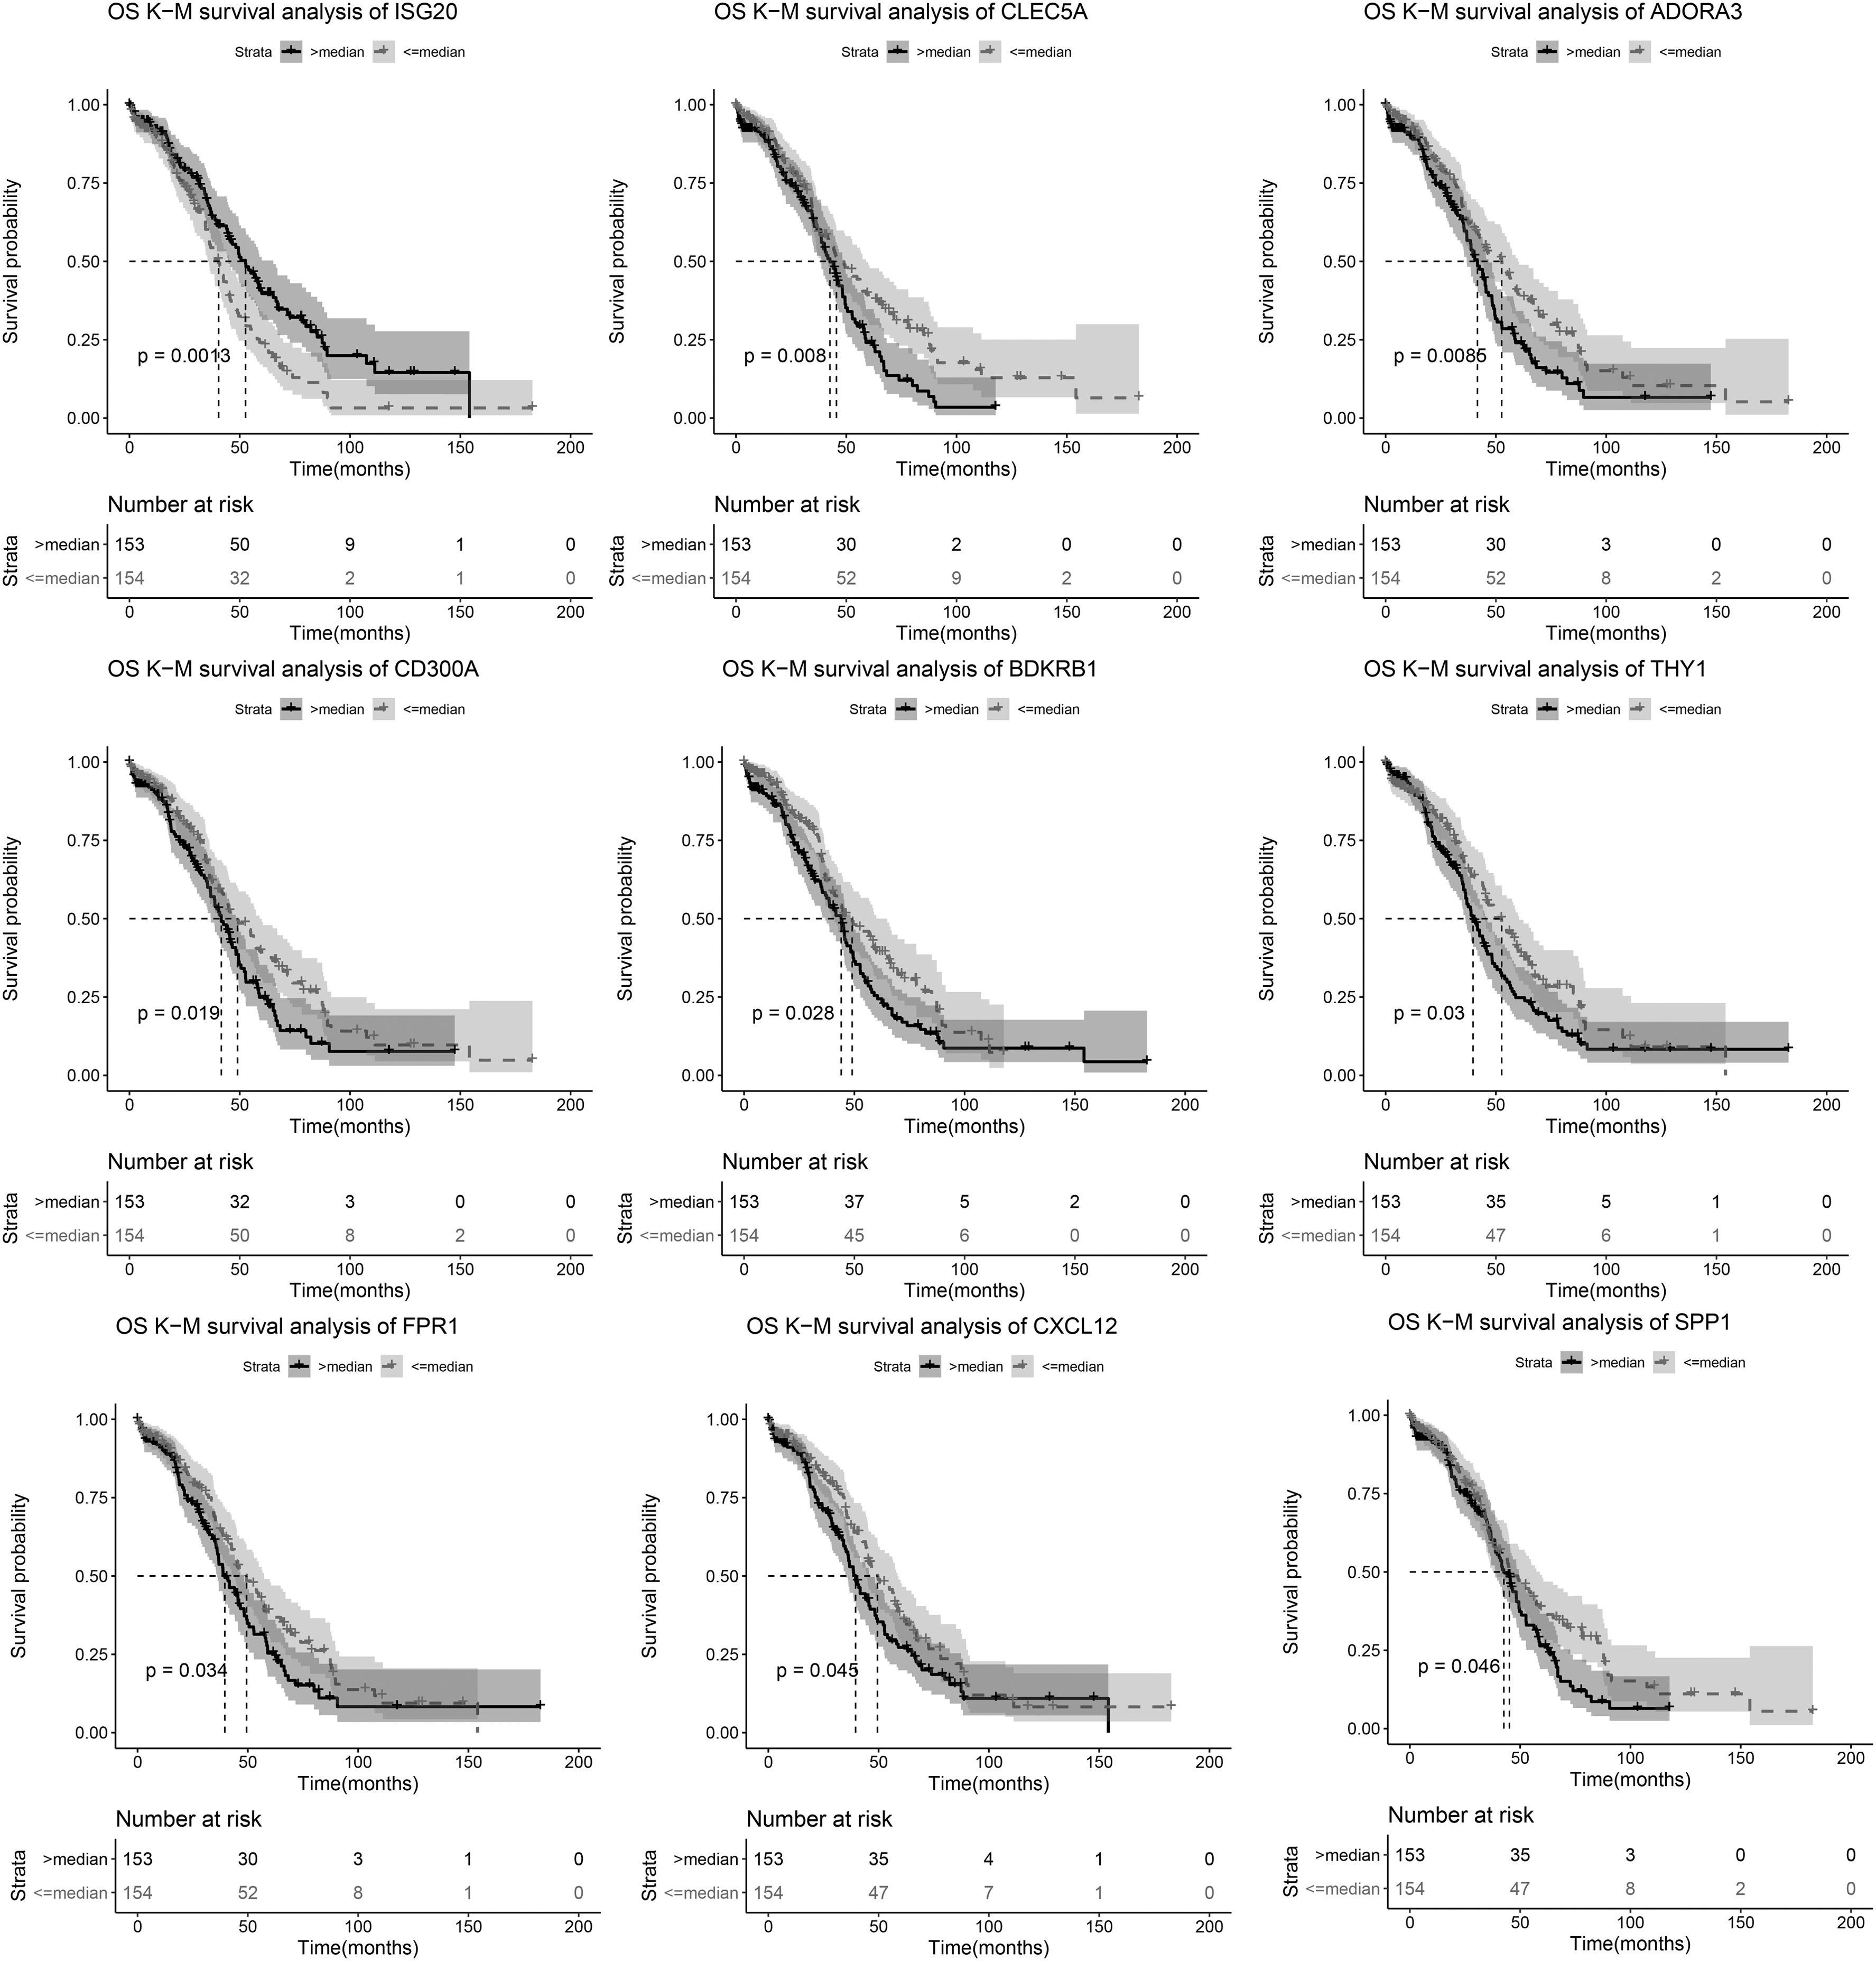
Kaplan–Meier survival curves for nine genes (ISG20, CLEC5A, ADORA3, CD300A, BDKRB1, THY1, FPR1, CXCL12, and SPP1). Dotted line: below the median (lower expression group); Solid line: above the median (higher expression group).
4. Discussion
As the most aggressive type of OC, the effective treatment of HGSOC is urgently needed. In the present study, PPBP, ITGB2, and ITGAM are the genes with higher degrees in the PPI network. miR-4469, miR-6734-5p, and miR-1304-5p were several of important miRNAs in the miRNA-target regulatory network. In addition, survival analysis showed that nine genes such as CLEC5A, FPR1, and CXCL12 might be prognosis-related genes for HGSOC.
In the present PPI network, PPBP, ITGB2, and ITGAM were hub genes with higher degrees. PPBP, also known as CXCL7 (a member of the CXC subfamily of chemokines), promotes invasion and growth of cholangiocarcinoma cells (Guo et al., 2017). Hironobu et al. (2010) suggested that chemokines/chemokine receptors were associated with cancer metastasis and might be regarded as new targets for the treatment of metastatic cancer. The data of Zhuo et al. (2008) showed that CXCL7 might be significant for the metastasis of breast cancer. CXCL7/CXCR2 (receptor of CXCL7) axis is correlated with the metastasis of breast cells to malignant phenotype (Ju, 2012).
ITGB2 (CD18), one chain of αMβ2, can form multiple heterodimers, which play important roles in immune response and cellular adhesion (Arnaout, 1990). Cell adhesion is significantly involved in cancer metastasis (Kannagi et al., 2010).
ITGAM (CD11B) is the second chain of αMβ2, which is involved in the innate immune system (Solovjov et al., 2005). ITGAM plays role in adhesion, spreading, and migration of cells with the presence of CD18 (Solovjov et al., 2005). The blockage of CD18 or CD11B can result in significant decreases of microparticle-mediated metastasis of tumor cells (Jingwei et al., 2013). The β2 subunit of the LFA-1 (CD18/CD11a) plays modulatory role in the metastatic development of colorectal cancer to the liver through harming activation of liver endothelium (Benedicto et al., 2017).
CD11B/Gr1 is involved in colorectal cancer liver metastasis (Su et al., 2014). CD11B is correlated with tumor metastasis stage in gastric cancer (Okita et al., 2014). Thus, PPBP, ITGB2, and ITGAM may be critical for HGSOC metastasis.
It is reported that CLEC5A was correlated with the metastasis of prostate cancer (Marín-Aguilera et al., 2015). Szu-Ting et al. (2012) showed that blockade of CLEC5A attenuated inflammation of central nervous system. Joyce-Shaikh et al. (2010) indicated that in autoimmune joint inflammation, the blockade of CLEC5A reduced the clinical signs. Factors associated with inflammation (e.g., IL-6) can be applied to predict the prognosis of gastric cancer (Chang et al., 2014). Besides, CLEC3A plays role in the progression of breast invasive ductal cancer and can be used to predict prognosis of this cancer (Ni et al., 2018).
FPR1 is involved in the development of many cancers or tumors, such as lung cancer (Morris et al., 2016), breast cancer (Vecchi et al., 2018), and neuroblastoma (Snapkov et al., 2016). FPR2 promotes metastasis of cells and invasion of gastric cancer and can be used for predicting the prognosis of this cancer (Hou et al., 2017).
In rectal cancer, CXCL12 and CXCR4 are correlated with poor prognosis (Susumu et al., 2010). Furthermore, CXCL12 is related to prognosis in non-small cell lung cancer (Suzuki et al., 2008) and esophageal squamous cell carcinoma (Uchi et al., 2016). CXCL12-CXCR4 plays important roles in OC cell migration, growth, invasion, and metastasis (Wang et al., 2014; Qing et al., 2015) and may be potential therapeutic targets for OC (Salomonnson et al., 2013). Our present survival analysis showed that CLEC5A, FPR1, and CXCL12 were prognosis-related genes for HGSOC. Thus, combining with the previous studies, we inferred that CLEC5A, FPR1, and CXCL12 were critical genes for the prognosis of HGSOC.
In a previous study, Cao et al. (2017) showed that miR-4469 suppressed the metastasis of breast cancer by targeting CDK3. Kang et al. (2016) indicated that miR-6734 was involved in apoptosis and cell cycle arrest in colon cancer cells. Cheng-gang et al. (2017) suggested that miR-1304 could inhibit cell growth in non-small cell lung cancer through heme oxygenase-1. No more studies about the associations between these three miRNAs and cancers were reported. In our present study, miR-4469, miR-6734-5p, and miR-1304-5p were several of important miRNAs in the miRNA-target regulatory network. Thus, we inferred that miR-4469, miR-6734-5p, and miR-1304-5p might be significant miRNAs associated with HGSOC. But further verifications about this infer are needed.
In summary, PPBP, ITGB2, and ITGAM may be critical for HGSOC metastasis. CLEC5A, FPR1, and CXCL12 may be important for the prognosis of HGSOC. Furthermore, miR-4469, miR-6734-5p, and miR-1304-5p may be important miRNAs associated with HGSOC. However, because of the limitations existed in this study, for instance, small sample size and without experimental verification, further studies are needed.
Footnotes
Author Disclosure Statement
The authors declare they have no financial conflicts of interest.
Funding Information
This work was supported by the Traditional Chinese Medicine Science and Technology Development Plan Project of Jining City (grant number ZYY2015022).