
Abstract
Predetermination, formation, and maintenance of the primary morphogenetic gradient (bicoid, bcd) of the early Drosophila embryo involves many interrelated processes. Here we focus on the biological systems analysis of the bcd mRNA redistribution in an early embryo. The results of the quantitative analysis of experimental data, together with the results of their dynamic modeling, substantiate the role of active transport in the redistribution of the bcd mRNA. The role of the nonlinearity of degradation mechanisms in the mRNA pattern robustness is discussed.
1. Introduction
In the 1960
The gradient of Bcd protein emerges when maternal bcd mRNA accumulates (is deposited) at the anterior end of an embryo at the early stage of its formation (St Johnston et al., 1989). bcd mRNA begins to translate as soon as an egg is laid, and the protein gradient is formed within 3 hours.
bcd mRNA is deposited in the head of a zygote as a conglomerate, forming a complex with several proteins (Weil et al., 2012). This forms an extremely specialized structure (P-bodies [Weil et al., 2012]), which supports the translation stability and production of large amounts of Bcd protein. However, the mechanism of action of this structure has not yet been clarified. Therefore, the widely used working hypothesis considers this conglomerate as a point source (not extended spatially) for the synthesis of Bcd protein. This led to the formulation of the synthesis/degradation/diffusion (SDD) model for the Bcd morphogenetic gradient (Grimm et al., 2010). The idea underlying the SDD model is that the Bcd protein synthesis begins at the anterior point of the embryo and then the protein diffuses from the head to the tail, while gradually degrading.
Recent studies of this primary morphogenetic gradient suggest the higher complexity of its regulation. In particular, it turned out that the bcd mRNA forms not a point source, but an extended spatial gradient, which is highly dynamic (Spirov et al., 2009; Little et al., 2011; Ali-Murthy and Kornberg, 2016; Cai et al., 2017). This leads to the understanding that processes at the mRNA level significantly contribute to the mechanism of the Bcd morphogenetic gradient formation.
The purpose of this report is to outline our systematic approach to analyzing the behavior of the bcd mRNA using the data-based dynamic modeling. Specifically, we clarify the importance of the bcd mRNA active transport along microtubules (MT). In particular, we consider the role of the nonlinearity of degradation mechanisms in the robustness of the bcd mRNA pattern.
2. Biological Background
Below, we briefly describe what is known about the behavior of the bcd mRNA in the early Drosophila embryogenesis. In a mature zygote, the bcd mRNA is fixed in the anterior cortical layer of an egg. After fertilization, mRNA-containing particles are released into the cytoplasm. Following this, complex processes of redistribution of this mRNA in the earliest embryogenesis are started (Alexandrov et al., 2018). There are at least three stages of redistribution of the mRNA bcd.
First, it is the redistribution of particles containing mRNA during the very first cycles of cleavage division at the preblastoderm stage (Little et al., 2011). The detailed analysis of the data suggests a consistent full-scale reorganization of the head region of an early embryo (Spirov et al., 2009; Little et al., 2011). The second event is the further expansion of the mRNA gradient in the posterior direction (Spirov et al., 2009). It lasts from the late cleavage stage to the beginning of the 14th division. The third key event is the basal/apical redistribution of the bcd mRNA at the beginning of cycle 14 (Spirov et al., 2009).
We can consider these observed redistributions and reorganizations of the mRNA-containing material as the identification of some key stages in the formation of the source of the Bcd protein gradient (Bcd production site): assembly (1), sequential enlargement and amplification (2), and finally, disassembly of the spatially distributed source of the Bcd protein (3).
3. Methods and Approaches
3.1. Quantitative data on the redistribution of the bcd mRNA in a zygote early embryo
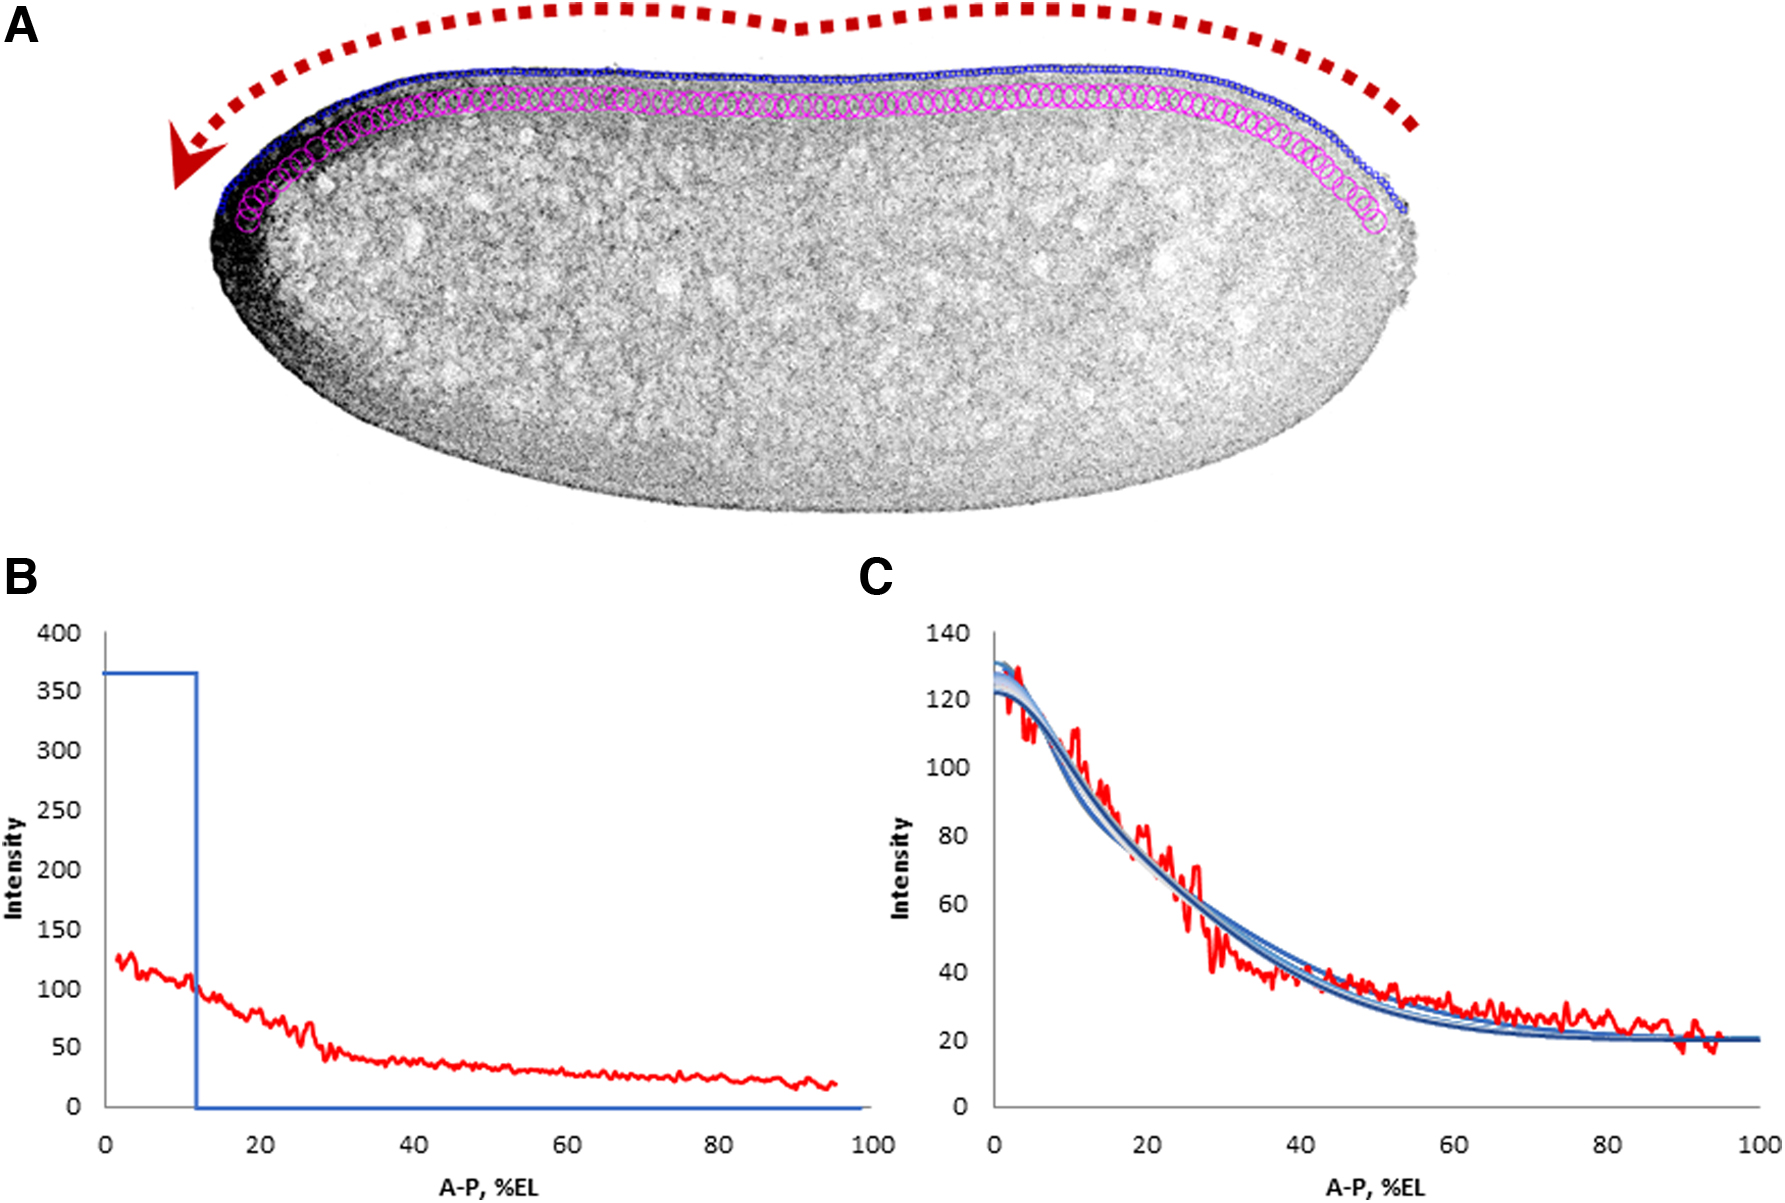
Embryos were heat-fixed and processed by the fluorescence in situ hybridization (FISH) method on the bcd mRNA modified to achieve the high sensitivity, as described in Spirov et al. (2009).
Next, the embryos were subjected to layer-by-layer confocal scanning. Then, the obtained sagittal images were subjected to quantitative processing so as to obtain a series of expression profiles, as in Figure 1.
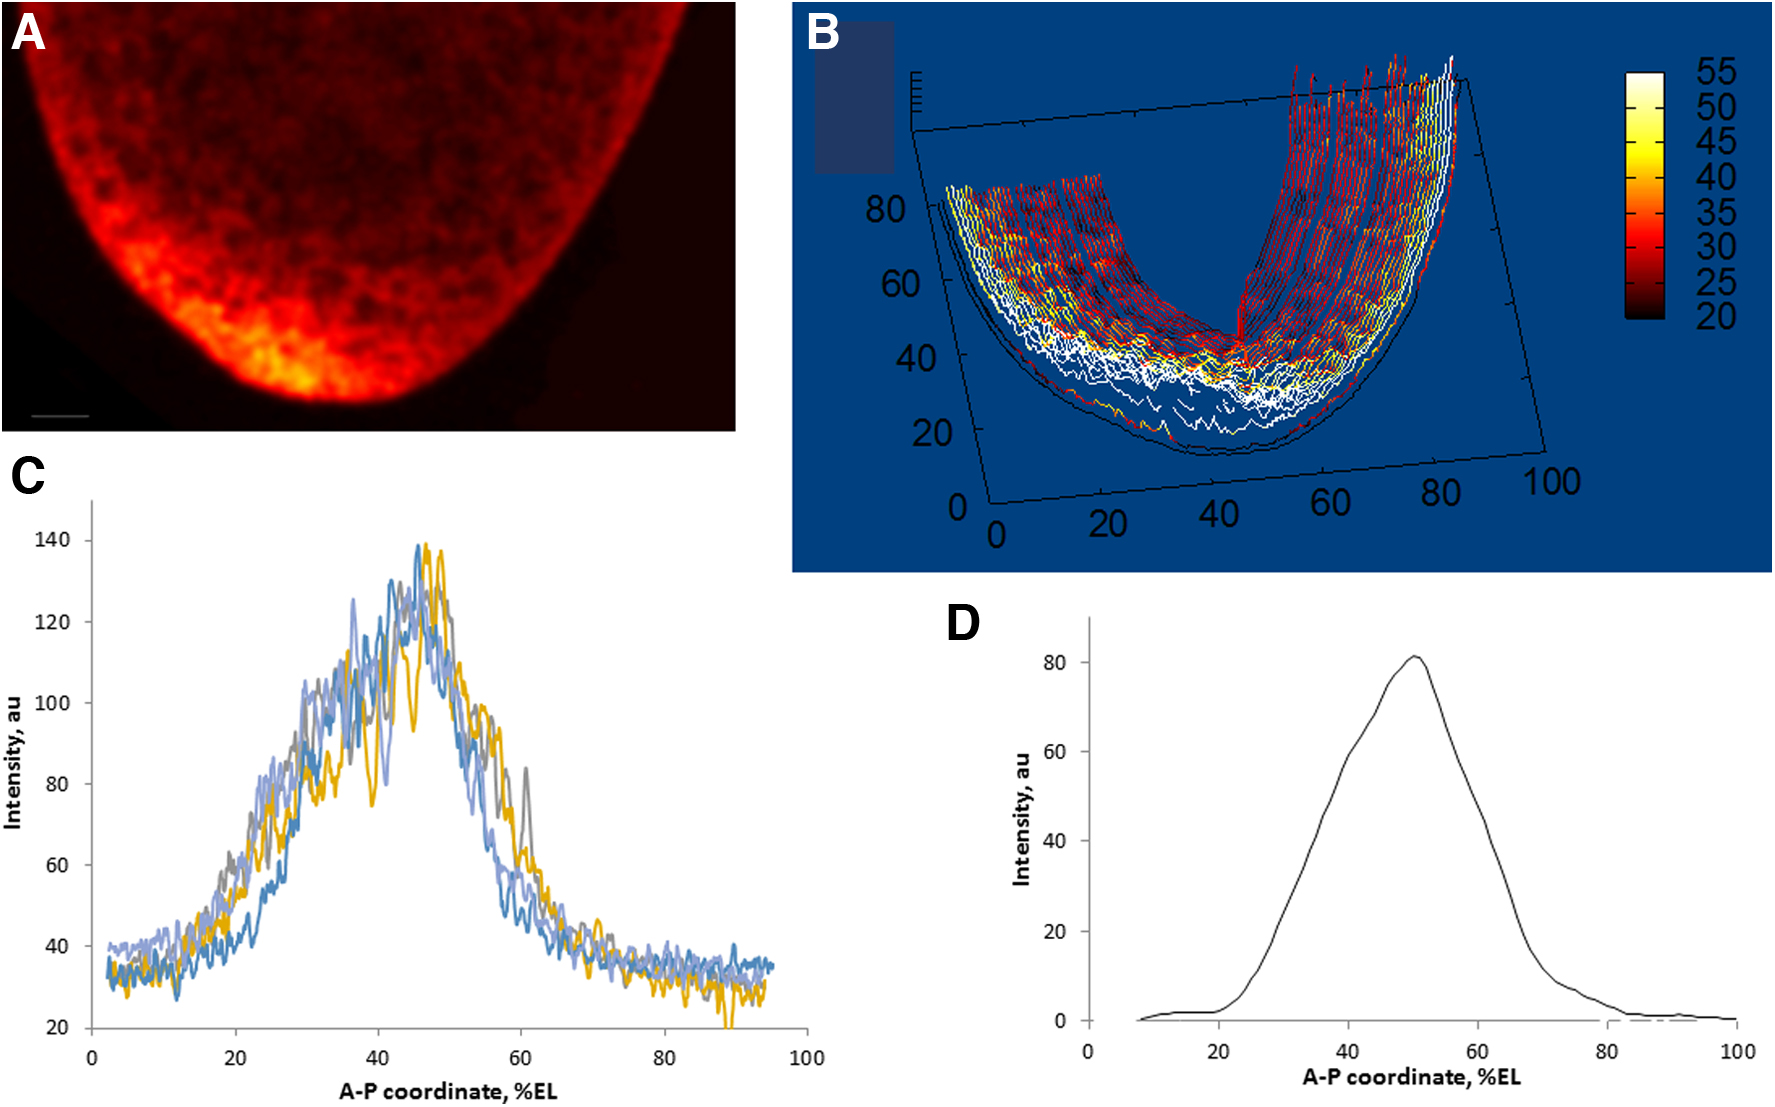
An example of a sagittal image of a bcd mRNA pattern [fluorescence in situ hybridization (FISH)] in the head of an early embryo
As is known, FISH procedures give variable and noisy results; therefore, for the acquisition of robust quantitative data, it is necessary to meet specific requirements (first of all, acquisition of the entire data set in one experiment; cf. Spirov et al., 2009), as well as averaging over many samples. In this article, we use our original method for scan processing, resulting in noise-free two-dimensional (2D) data on the bcd mRNA pattern (Fig. 1). The processing procedures involve the extraction of a series of profiles running parallel to the surface and eventually “covering” the entire cortex of the embryo (Fig. 1A, B). Then, these profiles are denoised by means of a singular spectrum analysis, as described in Alexandrov et al. (2008) and Spirov et al. (2009).
The one-dimensional (1D) profiles used in this article to fit dynamic models to real data were obtained either by averaging over data from several embryos (Fig. 1D) or by choosing a representative profile for such a group of embryos (Fig. 3B). Specifically, 4 early cleavage embryos were processed, 12 from the middle 13 cleavage cycle (cc) and 8 from the earliest 14 cc.
3.2. Dynamic modeling of the bcd mRNA redistribution
Now we give a brief description of our dynamic model. The model represents the system of two reaction/diffusion equations, the first of which describes the dynamics of large complexes with bcd mRNA, and the second of small ones.
Our first equation describing the large apical bcd complexes is as follows:
where [bcd] is the concentration of the bcd mRNA (in fact, RNA molecules are located in large partially immobilized macromolecular complexes, which we call RNP for simplicity);
The second equation describes the dynamics of bcd in complexes that can be transported via MT:
Here [bcd′] is the concentration of bcd mRNA in complexes with motors such as dynein that can move along MT;
We assume that the MT network is not oriented, and so, bcd transport can be described by the Fick's law. The diffusion coefficient in this case should be significantly higher than in the above case (Eq. 1).
We performed quite simple, but sufficiently detailed, tests with 1D models. We used 500 cells of 1 μm each. The duration of each run is 7200 seconds, ∼120 minutes.
3.2.1. Fitting the model to the data by genetic algorithms
The model was fitted to real experimental data by the genetic algorithms (GA), as described in detail in Zagrijchuk et al. (2014). Chromosomes were implemented as sequences of four real numbers. Specifically, these are the possible values of the model parameters: Drna, Drnp, C, and
We used standard GA with mutations only. A mutation is a small change in the value of a parameter by adding or subtracting a small real value. The mutation rate was set as Pmut = 0.05 per bit per generation. In accordance with the selection scheme by truncation, 20% of the best solutions (chromosomes) were used to obtain a daughter population by their reproduction with mutations. The purpose of the procedure was to obtain a set of model solutions that describe the experimental profile well enough.
4. Results and Discussion
In this report, we present the results of modeling two of the three consecutive stages of the dynamics of the bcd mRNA gradient (second and third, final).
4.1. Redistribution of bcd mRNA in a syncytial embryo
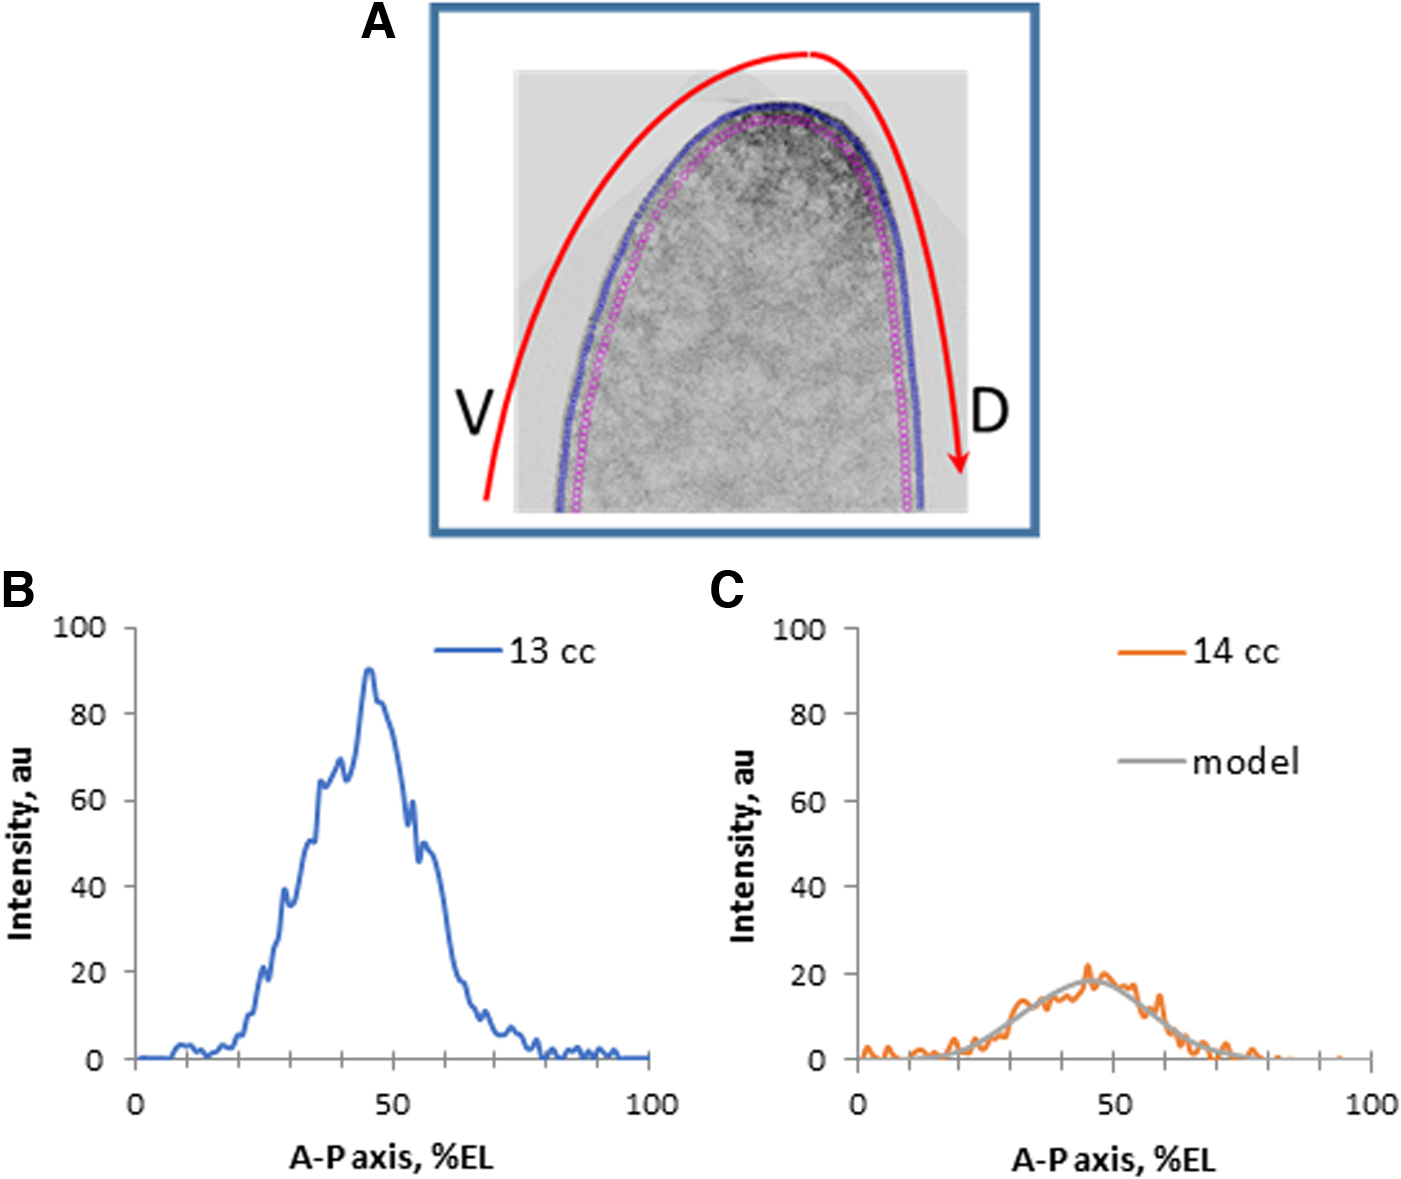
The quantitative analysis of surfaces and expression profiles of the bcd (both in previous publications [Spirov et al., 2009; Alexandrov et al., 2018] and here) showed that mRNAs (and Stau factor) are redistributed most dramatically along the anteroposterior axis in the period from the stage of early fragmentation (nuclear cycles 1–6) and before the beginning of the process of cellularization (end 13 cc). A typical pair of sagittal images stained with bcd mRNA illustrating this is shown in Figure 2.
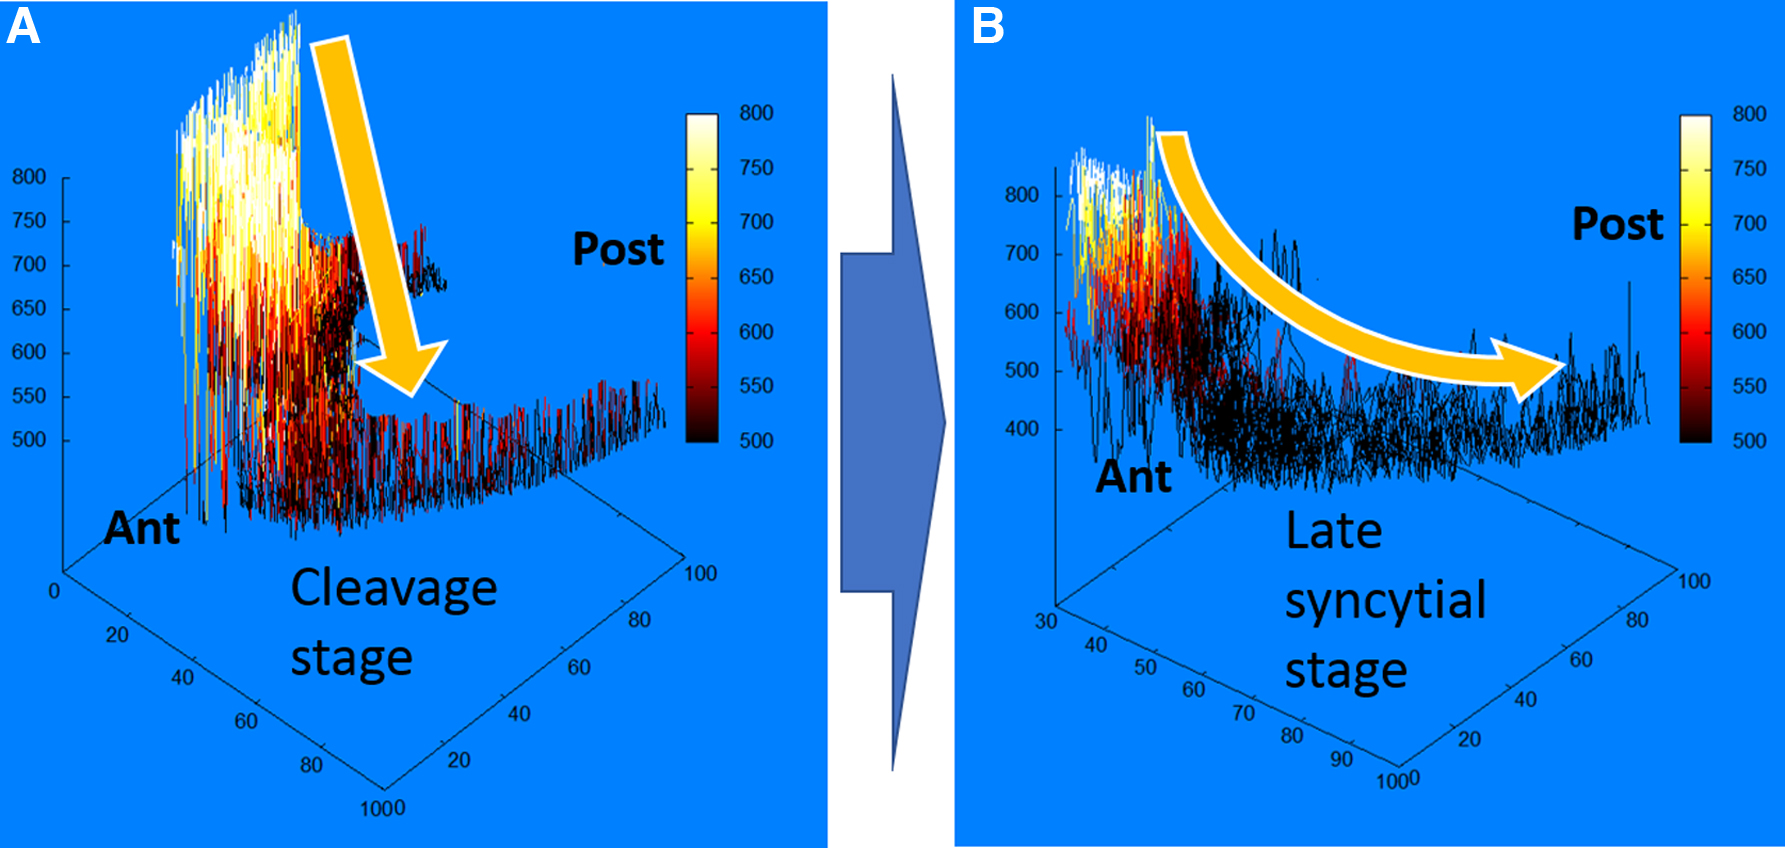
Redistribution on bcd mRNA from later cleavage stage
Figure 2 clearly shows how the compact accumulation of mRNA in the cortical layers of the embryo head by cycle 13 looks like a concentration gradient in the cortical layer of the cytoplasm in the anteroposterior direction.
Hence, the second stage of the bcd mRNA dynamics consists in the propagation of the gradient of this RNA in the posterior direction. Our approach to modeling the bсd mRNA dynamics includes explicitly the observation that this mRNA in early embryogenesis is in specific complexes with other factors, and these complexes are likely to be somewhat different in their composition, size, and mobility (e.g., Little et al., 2011). We explicitly consider two extreme cases of these complexes: large and therefore unable to diffuse over long distances ([bcd]), and small more mobile complexes ([bcd′]). In this case, small complexes are formed by decomposition (and possibly modification) of large ones.
We have reason to believe that usually any bcd mRNA profile consists of a short and sharp anterior gradient and a long flattened “tail” (Alexandrov et al., 2018). The tail may be flat, decreasing, or increasing (in the AP direction). For the purposes of our dynamic modeling, we consider only profiles with a decreasing tail.
We assume here that the well-known experiments with the bcd mRNA injection (RNA injection assay [Ferrandon et al., 1994, 1997]) reflect some key features of the mechanisms of the bcd mRNA transport. Our main hypothesis here is that the mRNA released from the initial anterior conglomerate forms complexes with adapter proteins and molecular motors. These complexes, in turn, are able to move along the MT network of the syncytial embryo. The experimental data on which this hypothesis is based are presented in Spirov et al. (2009) and Cai et al. (2017).
Multiple computational tests with fitting the dynamic model (Eqs. 1–2) to real data using GA resulted in a set of solutions that fairly well approximated the bcd mRNA profile. Parameter values for a dozen best solutions are shown in Supplementary Table S1. The graphs of these best solutions are shown in Figure 3.
Modeling the redistribution of bcd mRNA in a syncytial embryo.
As we found out in these computational experiments, the diffusion coefficient for larger and very slow bcd containing particles (Drnp) is about 0.05 μm2/second (Supplementary Table S1). This is a very slow movement indeed, even if we compare with Gregor's results for the Bcd protein, D ≈ 0.3 μm2/second (Gregor et al., 2007). It is six times smaller and corresponds to large multimolecular complexes, partial immobilization through the cytoskeleton, or both. On the contrary, as one would expect, the second transportation process looks really fast: Drna ≈ 1.50 μm2/second.
It is appropriate to recall here how large complexes such as the bcd-Stau-Dynein are. So, we come to the conclusion that this numerical result really implies the processes of active molecular transport for the bcd mRNA. Due to the apparently very low rate of the mRNA propagation in the posterior direction, the diffusion coefficient must be very low. This would correspond to those large bcd mRNA complexes that are still probably linked to some cytoskeletal elements.
4.1.1. Dynamic simulation results and two-exponential model of the bcd profile
In a previous publication (Alexandrov et al., 2018), we showed that the bcd mRNA profiles considered here are well approximated by a two-exponential model. This model is defined by
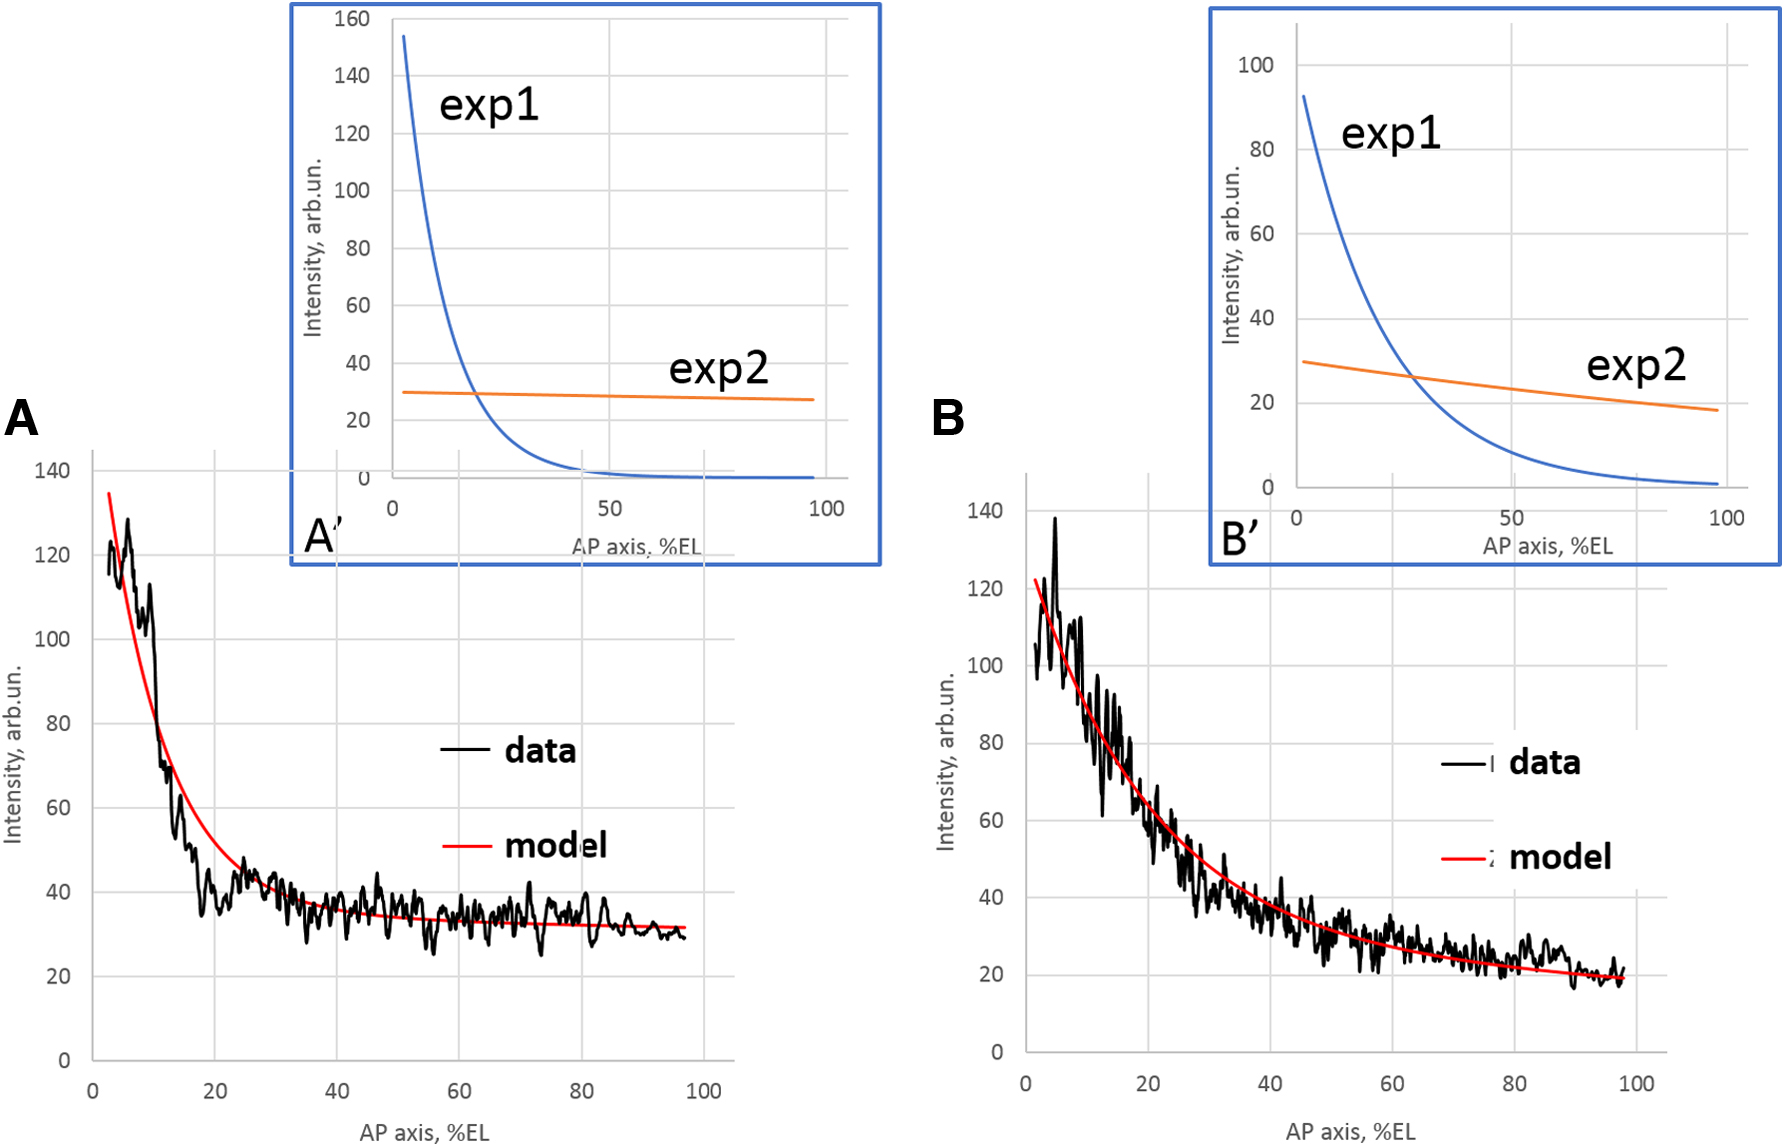
Representative bcd mRNA profiles for cleavage
The profiles in the Figure 4 illustrate well their composite nature: the steep gradient of the head tip and the long gentle tail. Moreover, the redistribution (spreading) of mRNA in the anteroposterior direction is interpreted by a preferential change in the parameters of the head (rather than tail) exponent (cf. Alexandrov et al., 2018). We believe that the composite (two-component) organization of the dynamic model (Eqs. 1–2) can be associated with the composite (two-component) organization of such an exponential model of the bcd mRNA profile. We can assume that the head exponent mainly corresponds to the spatial distribution of heavy sedentary aggregations with bcd mRNA (Eq. 1), while the tail exponent mainly describes the distribution of lighter and more mobile particles with bcd mRNA (Eq. 2). This conclusion needs further investigation.
4.1.2. Robustness of our model
A series of works on the analysis of distribution and redistribution of the bcd mRNA in an early embryo under various conditions (dose of the bcd gene, embryo size, and mutant background) demonstrated the scaling and robustness of these processes (Gregor et al., 2008; Cheung et al., 2011, 2014). A close examination of the dynamic model (Eqs. 1–2) makes it possible to formulate some hypotheses regarding the active transport of the bcd mRNA, which could explain some aspects of the scaling and robustness of redistributions of this mRNA.
Therefore, here we consider the possible mechanisms for compensating the dose of the bсd gene due to the nonlinear degradation of the bсd mRNA in our model. We consider a problem similar to that in Figure 3, but we use nonlinear versions of the term
The test results are shown in Figure 5. As it turned out, the fractional power index, n, ensures the robustness of the bcd mRNA gradient to the bсd gene dose in comparison with a linear dependence (n = 1).
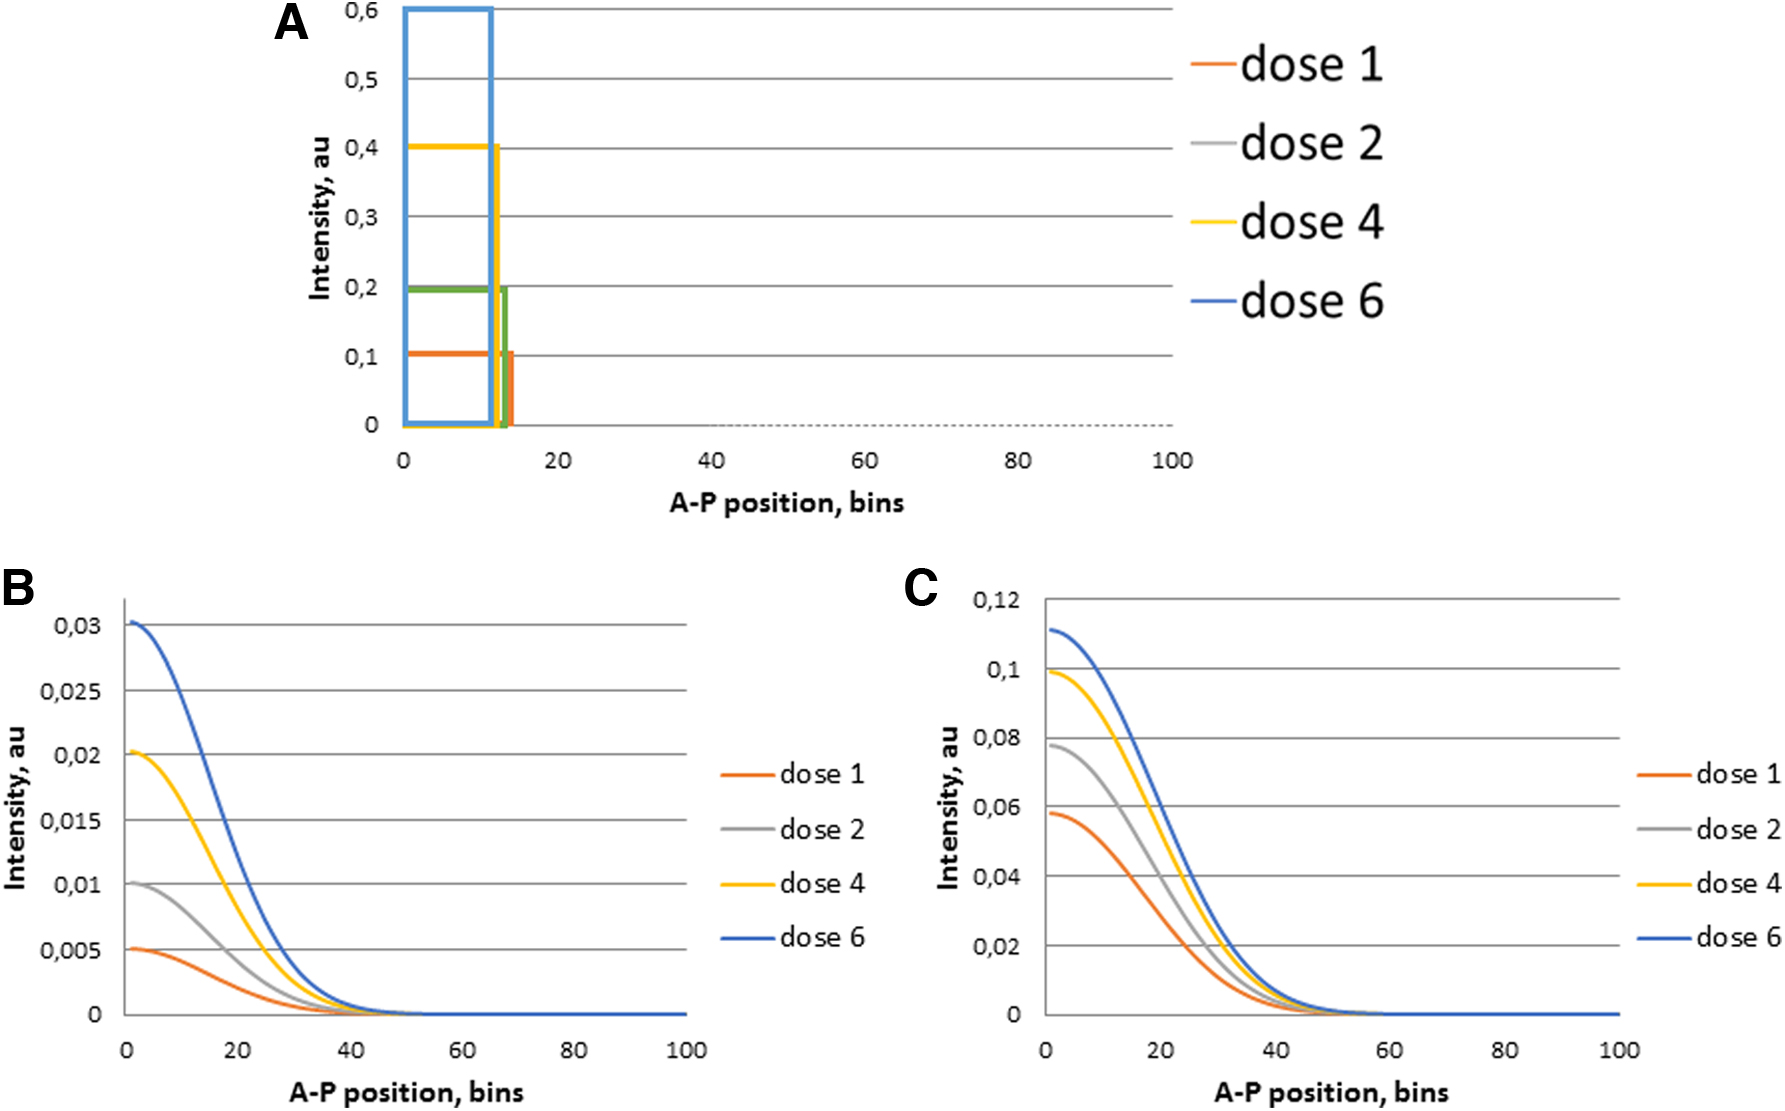
Nonlinear, of a fractional power, dependence of the degradation of the bcd mRNA on its concentration makes the spatial mRNA gradient more robust to changes in the dose of this gene compared with the linear dependence.
The conditions for the robust behavior of the model could be interpreted from a biological point of view as follows. Namely, the decomposition of large complexes to small ones depends nonlinearly on the concentration of large complexes in such a way that the greater their initial concentration is, the faster the decomposition proceeds. In turn, higher concentrations of small complexes are more actively redistributed along the AP axis posteriorly. This hypothesis needs further analysis and experimental verification.
4.2. Elimination of the bcd mRNA gradient
In this subsection, we present the results of modeling the third stage of the bcd mRNA dynamics. At this stage, the mRNA gradient is being quickly eliminated. Within the framework of the proposed approach, we consider transport processes along one spatial axis only, modeling the cortical layer of an embryo as a 1D profile.
These simulations are illustrated in Figure 6. This 1D model of the transport was organized to simulate the process in the apical part of an early embryo (as opposed to the model presented in Fig. 3). Here, our goal was to fit the simulation results to really observed changes in the bcd profile at the stages of the mature syncytial embryo, the beginning of cellularization. As the initial conditions, the representative bcd profile for the 13th cycle embryo, acquired as described in Section 3, was used here.
Data and model of the bcd mRNA degradation organized to simulate the process in the apical part of the early embryo only.
We assume that at this stage, all large complexes containing bcd ([bcd]) have already completely degraded to small ones ([bcd′]), so that the dynamics of the bcd mRNA is described by Eq. (2) with C = 0. Therefore, the dynamics is determined by the values of only three parameters: the diffusion coefficient Drna, coefficient of elimination
The key point here was to study the effect of the mRNA degradation law, that is, the effect of
To our surprise, we found that the best value of the degradation rate of the bcd mRNA matching the experimental data was about 3/2 (as illustrated in Figs. 6 and 7). That is, degradation is not just proportional to the concentration, but the higher the concentration of mRNA, the faster is its degradation (Fig. 7).
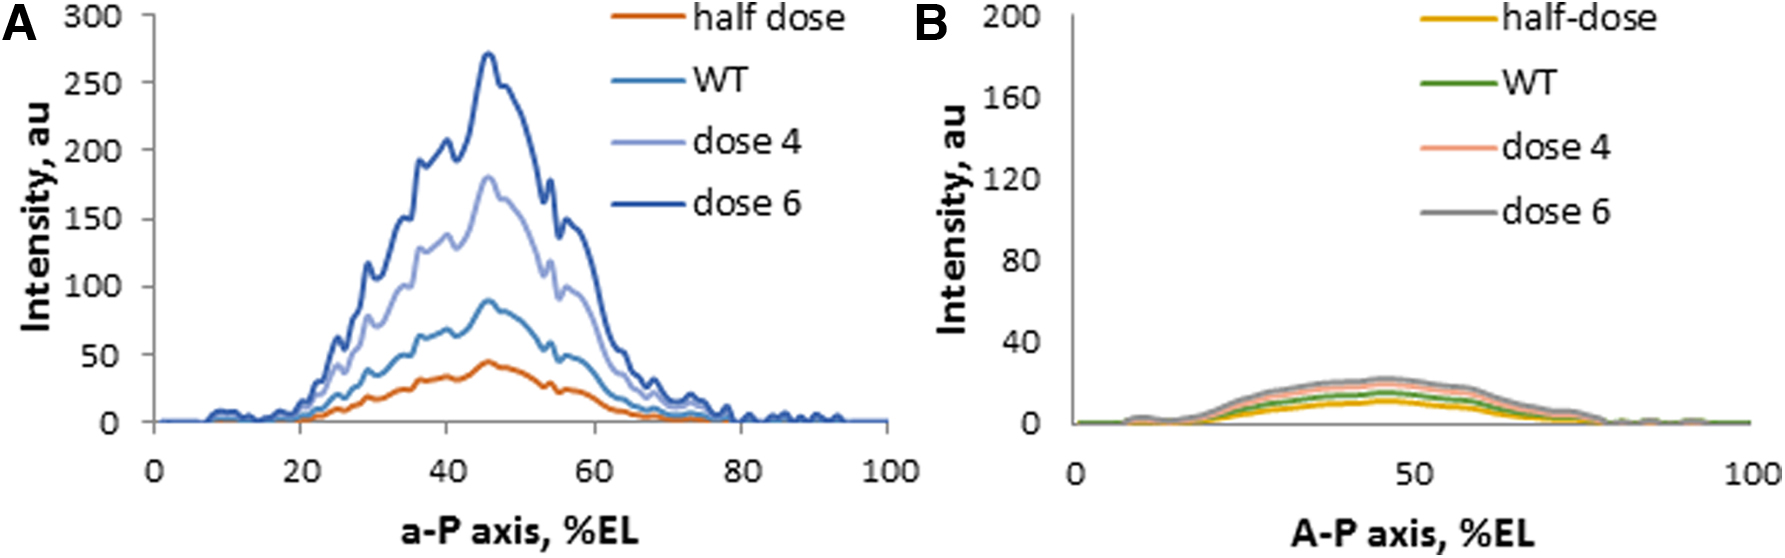
The mRNA degradation model, as in Figure 4, at various doses of the bcd gene. Typical simulation result: the initial profile
What is especially interesting is that the model with the degradation rate higher than one demonstrates the robustness (insensitivity) of the solution to the variability of the initial gradient. The bcd doses that have been tested are as follows: 1 (haploid), 2 [wild type (WT)], and higher doses (4 and 6). Simulation results demonstrated that the higher order degradation (e.g., 2/3) can compensate for the gene dosage at the mRNA level (Fig. 7).
Such compensation was reported at the level of accuracy of the Hb factor domain, but the mechanisms are still unclear (Houchmandzadeh et al., 2002). It is known that the beginning of cycle 14A, immediately before the midblast transition, is characterized by a much more stable pattern of segmentation than in the early cycles (Holloway et al., 2006; Surkova et al., 2008). What we found here means that the robustness of pattern formation can be realized not only at the level of segmentation factors but also at the level of some mRNAs.
4.2.1. Self-reinforcing degradation
In this section, we essentially use the same hypothesis as in the previous one. Namely, we assume that the processes of decomposition of complexes to macromolecules depend nonlinearly on the concentration of these complexes (so that the higher their initial concentration is, the faster the decomposition proceeds). This explains those aspects of regulation, when large initial accumulations of bcd mRNA complexes quickly degrade to small ones, thereby undergoing faster elimination.
In conclusion, we note that at this stage of elimination of the bcd mRNA gradient, the processes of active transport along the basal/apical axis are of great importance. Therefore, the future directions of our approach are to develop a spatial 2D model from this 1D model, to explore in detail the role of base-apical transport in an explicit form.
4.2.2. Mechanisms of the earliest bcd redistributions
Finally, we focus on the problem of modeling large-scale redistributions of bcd mRNA at the very beginning of embryonic development (first stage). Although this larger computational problem is outside the scope of this publication, we outline reasonable approaches to solving it. Moreover, the general formulation of model (Eqs. 1–2) with convection terms allows us to make an attempt of modeling the first stage of the formation of the bcd mRNA gradient.
The bcd mRNP material redistribution is complex movement in three spatial dimensions and reminiscent of a fountain. This fountain-like motion assumes fountain-like forces to perform it fast and coordinated.
Those fountain-streams were described in detail together with the discussing of the forces to produce them by von Dassow and Schubiger (1994). During cycles 1–3, slow steady movements of the cytoplasm from the poles to the center were observed, corresponding to the displacement of bcd from the cortical layers deep into the medullary cytoplasm of the early embryo head. A little later, the direction of the cytoplasm movement changes to the opposite, so that the fountain from the core to the anterior pole eventually moves bcd back to the head cortical layers and further under the plasma membrane in the anteroposterior direction.
Hence, our hypothesis is that the main force redistributing the RNP particles during preblastoderm (and probably the beginning of syncytial blastoderm) is the fountain cytoplasmic flows. Detailed analysis of such processes within the framework of the general form of the model (Eqs. 1–2) requires not just one- but rather two- or even three-dimensional modeling. Such modeling will be our goal in future publications.
Footnotes
References
Supplementary Material
Please find the following supplemental material available below.
For Open Access articles published under a Creative Commons License, all supplemental material carries the same license as the article it is associated with.
For non-Open Access articles published, all supplemental material carries a non-exclusive license, and permission requests for re-use of supplemental material or any part of supplemental material shall be sent directly to the copyright owner as specified in the copyright notice associated with the article.