
Abstract
With the rapid spread of COVID-19 worldwide, viral genomic data are available in the order of millions of sequences on public databases such as GISAID. This Big Data creates a unique opportunity for analysis toward the research of effective vaccine development for current pandemics, and avoiding or mitigating future pandemics. One piece of information that comes with every such viral sequence is the geographical location where it was collected—the patterns found between viral variants and geographical location surely being an important part of this analysis. One major challenge that researchers face is processing such huge, highly dimensional data to obtain useful insights as quickly as possible. Most of the existing methods face scalability issues when dealing with the magnitude of such data. In this article, we propose an approach that first computes a numerical representation of the spike protein sequence of SARS-CoV-2 using k-mers (substrings) and then uses several machine learning models to classify the sequences based on geographical location. We show that our proposed model significantly outperforms the baselines. We also show the importance of different amino acids in the spike sequences by computing the information gain corresponding to the true class labels.
1. INTRODUCTION
The adaptability of viruses such as SARS-CoV-2, when coupled with a variety of selection pressures from the various ecosystems, host immunities, and approaches to pharmaceutical intervention, provides an evolutionary environment that leads to the emergence of strains and variants in different geographical locations. While SARS-CoV-2 has spread rather quickly to many parts of the globe since the initial outbreak in Wuhan at the end of 2019, which led to the COVID-19 pandemic (Wu et al, 2020), it continues to raise global concerns as the virus persistently evolves and accumulates new mutations. Consequently, new variants of SARS-CoV-2 have emerged in different parts of the world: the alpha variant (B.1.1.17) emerged in the United Kingdom, beta (B.1.351) in South Africa, gamma in Brazil, epsilon in California, iota (B.1.526) in New York, and the delta (B.1.167.2) and kappa (B.1.167.1) in India, to name a few.
All of these variants possess some mutations that confer increased transmissibility or higher binding affinity of their spike protein (Fig. 1) to human host ACE2 receptors (Farinholt et al, 2021; Huang et al, 2020).
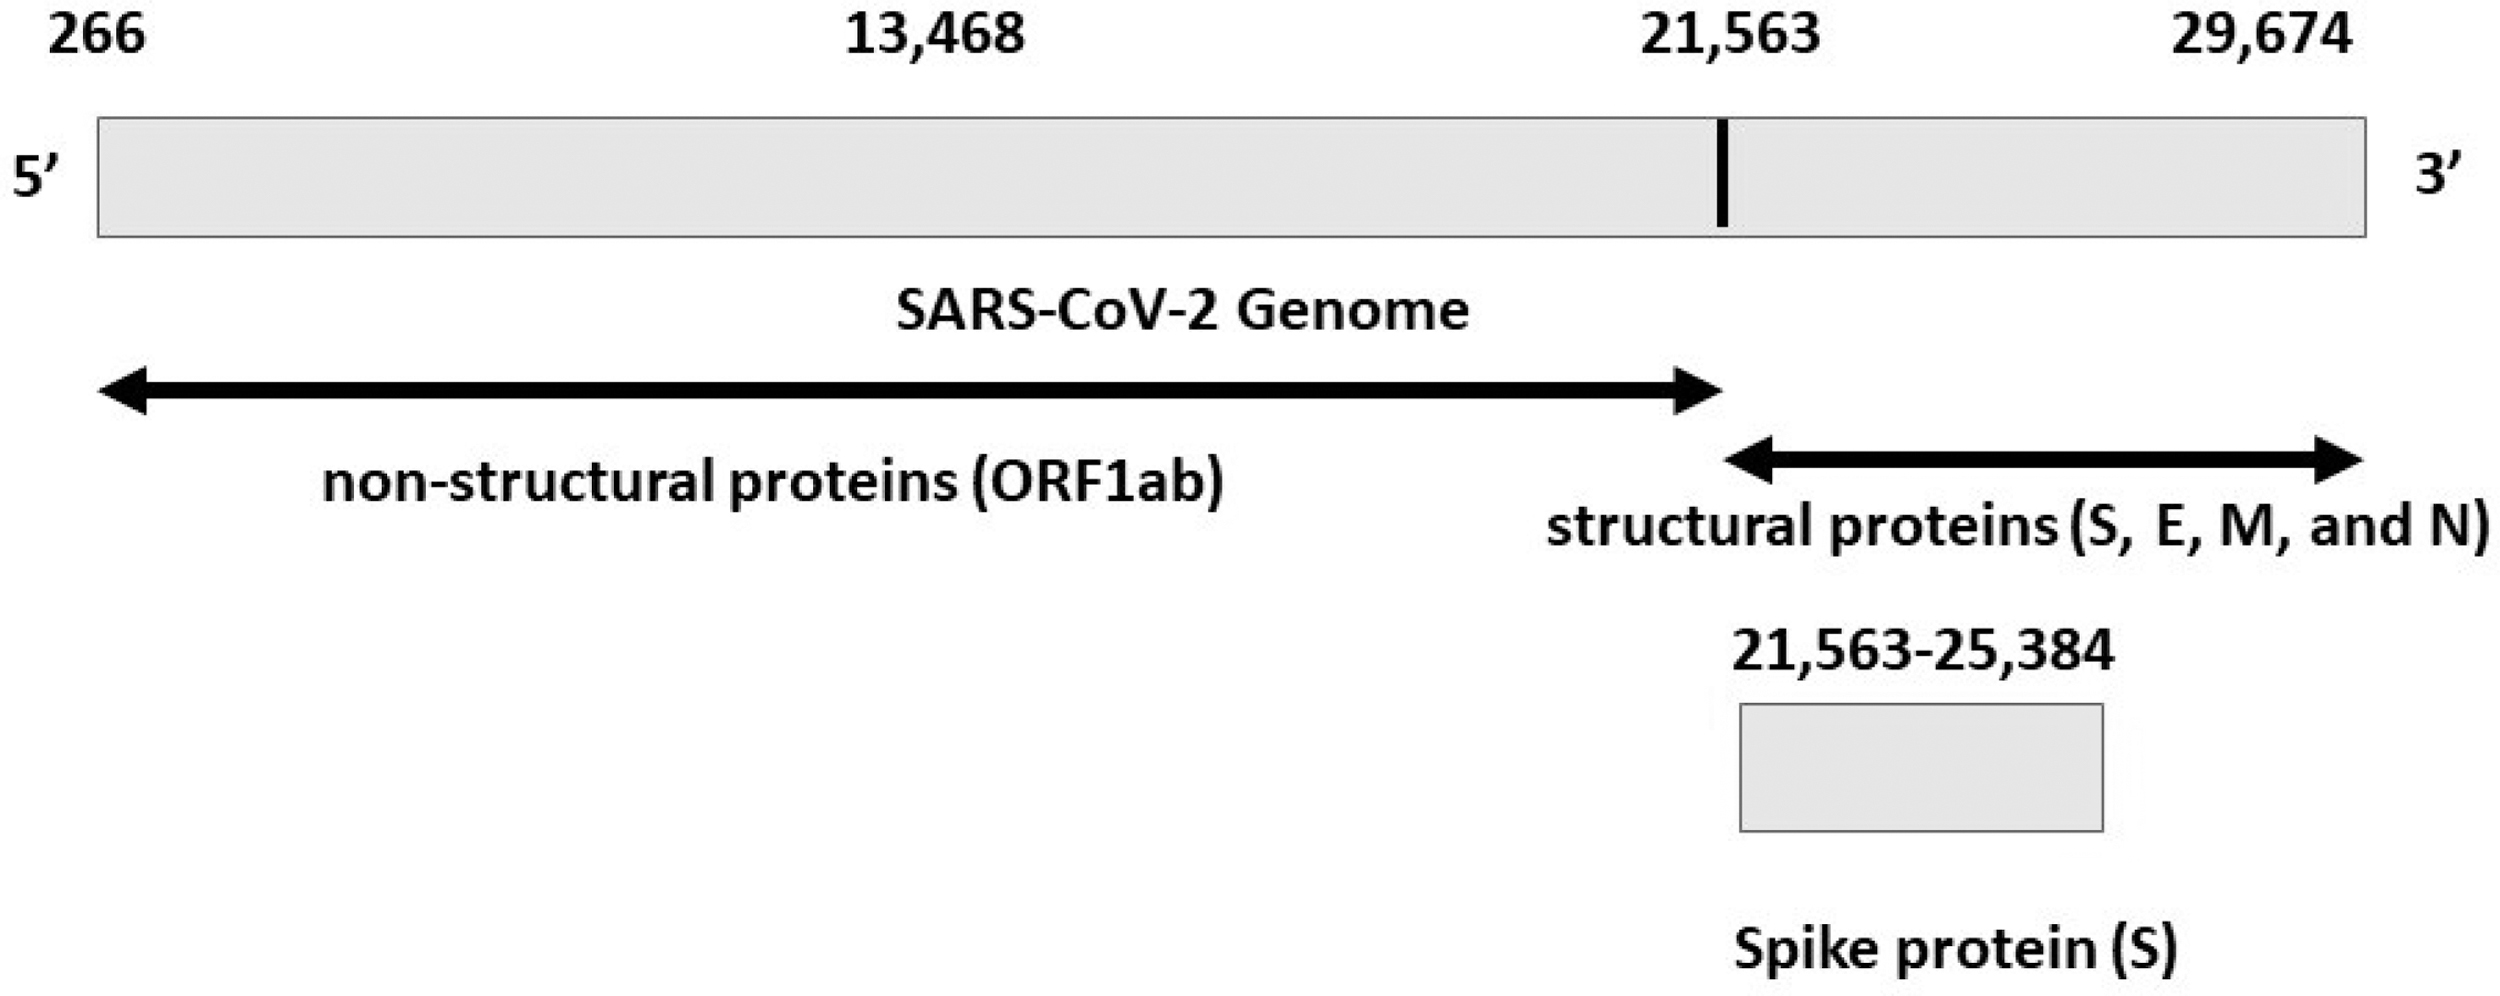
The SARS-CoV-2 genome codes for several proteins, including the surface, or spike protein. The spike protein is composed of 3821 (25,384 − 21,563) nucleotides (and “one-stop” character “*”). Therefore, the final length of the spike protein is
It is concerning that the longer SARS-CoV-2 has to propagate, its exposure to wider ranges of immune response attacks across diverse communities and geographically diverse environments may be incubating the virus to evolve new variants and strains that are dangerous and extremely immunologically evasive both locally and globally, as the pandemic prolongs. From the point of view of evolution, this is like giving the virus robust evolutionary room and time to learn, to evolve adaptations, gain of function, and escapes from host immune arsenal and attacks. Sadly, this is gradually the case already, as the original Wuhan strain is now almost completely replaced by new variants with different characteristic behaviors and hence less responsive to the currently available vaccines (Korber et al, 2020; Hu et al, 2021).
This is why it is important to characterize different strains and variants of SARS-CoV-2 based on the geographical location, to understand the patterns of spread in the hopes to contain, or at least cope with, this virus.
All viruses mutate with time—RNA viruses particularly do so at a faster rate. The SARS-CoV-2 is an RNA virus, it, however, exhibits a moderately lower rate compared with other RNA viruses such as HIV and influenza due to the possession of a genetic proof-reading mechanism for correcting errors. The SARS-CoV-2 genome typically accrues 1 or 2 point mutations [single nucleotide variations (SNPs)] in a month. According to a review, some 12,706 such mutations have so far been detected by researchers since the advent of the COVID-19 pandemic. While some changes have neutral effects, a few that occur in major proteins—be it, addition, substitution, or deletion—are critical to viral evolution, genomic stability, transmissibility, antigenicity, virulence, adaptation, and escape from the host immune response (Lorenzo-Redondo et al, 2020; Pachetti et al, 2020).
The SARS-CoV-2 spike (S) protein is a key player in the virus life cycle. The protein is composed of 1274 amino acids encoded by the S gene of the virus (Fig. 1). It is the major target of the neutralizing antibodies from host immune response and currently available vaccines for COVID-19. The virus uses the spike protein to bind the host ACE2 receptor on the cell surface (found abundantly in airways, lungs, mucous lines, and the intestine), which facilitates the uptake of the virus into host cells (Lamers et al, 2020; V'kovski et al, 2021).
Thus, mutations in the S gene have reportedly imparted viral pathogenesis, binding activity of the spike protein to the host, as well as causing conformational changes in the protein molecule. For instance, mutation D614G—that is, a substitution of glycine (G) for aspartate (D) at position 614—was found to enhance the viral infectivity and stability of the SARS-CoV-2 genome, which has been attributed to spike protein assembly on the virion surface (Korber et al, 2020).
At present, quite a number of novel variants are being identified by the US Centers for Disease Control and Prevention (CDC) and the World Health Organization (WHO) SARS-CoV-2 Variant Classifications and Definitions. The variants are divided into categories such as Variants of Concern (VOCs), Variants Being Monitored (VBMs), Variants of interest (VOIs), and Variants of High Consequence (VOHCs). At the time of this study, the VOC was the delta variant (B.1.617.2 and AY.1 sublineages), SARS-CoV-2 Variant Classifications and Definitions. Since all of these variants are characterized by different spike protein contents (Farinholt et al, 2021; Huang et al, 2020), classification can help us to discover also patterns in the geographic distribution of these variants.
At the time of this study, the VBMs comprised the alpha (B.1.1.7, Q.1-Q.8 Pango lineage), beta (B.1.351, B.1.351.2, B.1.351.3 Pango lineage), gamma (P.1, P.1.1, P.1.2 Pango lineage), epsilon (B.1.427 B.1.429 Pango lineage), eta (B.1.525 Pango lineage), iota (B.1.526 Pango lineage), kappa (B.1.617.1 Pango lineage), zeta (P.2 Pango lineage), and MU (B.1.621, B.1.621.1 Pango lineage) SARS-CoV-2 Variant Classifications and Definitions. There are no VOIs or VOHCs at the time.
The SARS-CoV-2 still circulates among human populations in different locations, weather conditions, and epidemiological descriptions. It is important to investigate how this regional diversity contributes to viral evolution and the emergence of new variants in these regions. Research suggests possible selective mutations in the SARS-CoV-2 genome—specific sites that appear more subjective to selective mutation. Some mutational sites in the ORF1ab, ORF3a, ORF8, and N regions of SARS-CoV-2 reportedly exhibit different rates of mutation (Wang et al, 2020). A study involving the analysis and characterization of samples from COVID-19 patients in different parts of the world identifies eight novel recurrent mutational sites in the SARS-CoV-2 genome. Interestingly, the studies also note changes at sites 2891, 3036, 14408, 23403, and 28881 to be common in Europe, while 17746, 17857, and 18060 are common in North America (Pachetti et al, 2020).
A recent study also identified the ongoing evolution of SARS-CoV-2 to involve purifying selection, and that a small number of sites appear to be positively selected. The work also identifies the spike protein receptor binding domain (RBD) and a region of nucleocapsid protein to be also positively selected for substitutions. The work also highlighted trend in virus diversity with geographic region and adaptive diversification that may potentially make variant-specific vaccination an issue (Rochman et al, 2021).
Given all of the novel SARS-CoV-2 variants and strains that have emerged from different geographical regions of the world, we need to investigate this connection to the spread of the virus, for example, weather factors possibly play a systematic role (Pezzotti et al, 2016; Segovia-Dominguez et al, 2021). There is also diversity of immune system across the human population. Genomic variations only cause 20%–40% of this immune system variation, while the remaining 60%–80% is accounted for by age, environmental factors, such as where we live and our neighbors, cohabitation, and chronic viral infections. Immune response is also known to show intraspecies variation (Liston et al, 2016).
There is an ongoing evolutionary arms-race between the hosts and pathogens they are exposed to, which constantly changes the host antipathogen attack and in turn causes the pathogen to refine or adjust its escape from host immune attack (Brodin et al, 2015; Liston et al, 2016). This is constantly taking place, with the virus under evolutionary pressure and natural selection to propagate the virus with the highest fitness. It may be complex to characterize how each factor contributes to this variation. The immune system variation is possibly an important driver on how new variants of SARS-CoV-2 are regionally emerging with positive selections for escaping immune neutralization, increased infectivity, and transmissibility, as observed recently.
Classification of the SARS-CoV-2 spike protein sequences based on geographical location of emergence is therefore an important and informative exploration for possible unique patterns, trends, and distribution. The SARS-CoV-2 spike protein must interact chemically with the host receptor molecule, ACE2, for cellular uptake. Since millions of spike sequences are available now on public databases such as GISAID, classifying those sequences becomes a Big Data problem. When dealing with big data, scalability and robustness are two important challenges. Some algorithms are robust, while others scale well, but give a poor predictive performance on larger data sets. Ali and Patterson (2021) proposed a scalable approach, called Spike2Vec, which is scalable to larger sized data sets. When there is some structure (natural clustering) in the data, Spike2Vec is proven to be useful compared with one-hot embedding (Ali and Patterson, 2021).
However, we show in this article that Spike2Vec does not always work in all types of scenarios. To further improve the results of Spike2Vec and that of one-hot embedding, we use a neural network (NN) model.
In this article, we propose to use a simple sequential convolutional NN along with a k-mer-based feature vector representation for classifying the geographical locations of COVID-19 patients using spike protein sequences only. Our contributions in this article are the following:
We show that the NN model is scalable on a high volume of data and significantly outperforms the baseline algorithms. We show the importance of different amino acids within the spike sequence by computing information gain (IG) corresponding to the class label. We show that given the complexity of the data, our model is still able to outperform the baselines while using only 10% of the training data. We show that preserving the order of amino acids using k-mers achieves better predictive performance than the traditional one-hot encoding (OHE)-based embedding approach. Our approach allows us to predict the geographical region of the COVID-19-infected patient while accounting for important local and global variability in the spike sequences.
The rest of the article is organized as follows: Section 2 contains the related work. The proposed approach is given in Section 3. Data set details and experimental setup are in Section 4. The results of our method and comparison with baselines are shown in Section 5. Finally, we conclude our article in Section 6.
2. RELATED WORK
Sequence classification is a widely studied problem in domains such as sequence homology (shared ancestry) detection between a pair of proteins and Phylogeny-based inference (Dhar et al, 2020) of disease transmission (Krishnan et al, 2021). Knowledge of variants and mutations can also help in identifying the transmission patterns of different variants, which will help to devise appropriate public health interventions so that the rapid spread of viruses can be prevented (Ahmad et al, 2020, 2017, 2016; Tariq et al, 2017). This will also help in vaccine design and efficacy. Previous studies on working with a fixed length numerical representation of the data successfully perform different data analytic tasks. It has applications in different domains such as graphs (Hassan et al, 2021, 2020), nodes in graphs (Ali et al, 2021a; Grover and Leskovec, 2016), and electricity consumption (Ali et al, 2020b, 2019).
This vector-based representation also achieves significant success in sequence analysis, such as texts (Shakeel et al, 2020a, 2020b, 2019), electroencephalography and electromyography sequences (Atzori et al, 2014; Ullah et al, 2020), networks (Ali et al, 2020a), and biological sequences (Ali et al, 2021c). However, most of the existing sequence classification methods require the input sequences to be aligned. Although sequence alignment helps to analyze the data better, it is a very costly process.
In the evolution of the SARS-CoV-2 genome, it is well-known that a disproportionate amount (in terms of its length) of the variation takes place in the spike region. Kuzmin et al (2020) show that viral-host classification can be done efficiently using spike sequences only and applying different machine learning (ML) models. They use OHE to obtain a numerical representation for the spike sequences and then apply traditional ML classifiers after reducing the dimensions of the data using the principal component analysis (PCA) method (Wold et al, 1987). Although OHE is proven to be efficient in terms of predictive performance, it does not preserve the order of amino acids in the spike protein if we want to take the pairwise Euclidean distance (Ali et al, 2021d). Another problem with the OHE-based approach is that it deals with aligned sequential data only.
Many previous studies propose the use of k-mers (substrings of length k), which is an alignment-free approach, instead of the traditional OHE-based embedding to obtain the numerical vector representation for the genomic data (Ali and Patterson, 2021; Ali et al, 2021b, 2021d). After computing substrings of length k, a fixed-length feature vector is generated, containing the count of each unique k-mer in a given sequence. This k-mer- based method has been used for phylogenetic applications (Blaisdell, 1986) and has shown success in constructing accurate phylogenetic trees from DNA sequences. Ali et al (2021d) argue that better sequence classification results can be achieved using k-mers instead of OHE because k-mers tend to preserve the order of amino acids within a (e.g., spike) sequence.
After obtaining the numerical representation, a popular approach is to compute the kernel matrix and provide that matrix as input to traditional ML classifiers such as support vector machines (SVM) (Farhan et al, 2017; Kuksa et al, 2012; Leslie et al, 2003). Farhan et al (2017) propose an approximate kernel (Gram matrix) computation algorithm, which uses the k-mer-based feature vector representation as an input to the kernel computation algorithm.
3. PROPOSED APPROACH
In this section, we present our proposed model for classifying population regions based on spike sequences only. We start by explaining the basic MAJORITY-based model for the classification. We then show the OHE-based feature vector generation approach. After that, we show how we generate k-mer-based frequency vectors. Then, we introduce our models, which we are using for the purpose of classification. Finally, we give brief details on the experimental setup, before reporting the results of these experiments in the following section.
3.1. Majority
We start with a simple baseline model called MAJORITY. In this approach, we simply take the class with majority representation in the training data and declare it as the class label for all data points in the test set. We then measure the performance of this baseline model using different evaluation metrics.
3.2. One-hot encoding
To obtain a numerical representation for the sequence-based data, one of the popular methods is using OHE (Ali and Patterson, 2021; Ali et al, 2021b, 2021d; Kuzmin et al, 2020). Note that the length of each spike sequence in our data set is 1274, which contains characters (amino acids) from a set of 21 unique alphabets “ACDEFGHIKLMNPQRSTVWXY.” For OHE, since we need to have a 21-dimensional subvector for each amino acid, the length of the OHE-based feature vector for each spike sequence will be 21 × 1273 = 26,733 (we take the length of spike protein as 1273 instead of 1274 because we have the stopping character “*” at the 1274th position). After obtaining the OHE for the whole data, since the dimensionality of the data will be high, Kuzmin et al (2020) use the typical PCA approach for dimensionality reduction.
Since the size of the data is much larger in our case, we simply cannot use PCA because of the high computational cost (Ali and Patterson, 2021). For this purpose, we use instead an unsupervised approach for low-dimensional feature vector representation, called random Fourier features (RFF) (Rahimi and Recht, 2007).
3.3. RFF-based embedding
To compute the pairwise similarity between two feature vectors, a popular method is to compute the kernel (similarity) matrix (Gram matrix) and give it as input to popular classifiers such as SVM (Farhan et al, 2017). However, exact kernel methods are expensive in terms of computation (scale poorly on training data) (Rahimi and Recht, 2007), and they require huge space to store an n × n matrix (where n is the total number of data points). To overcome this problem, we can use the so-called kernel trick.
The kernel trick relies on the assumption that any positive definite function
Although the kernel trick is effective in terms of computational complexity, it is still not scalable to millions of data points. To overcome these computational and storage problems, we use RFF (Rahimi and Recht, 2007), an unsupervised approach that maps the input data to a randomized low-dimensional feature space (Euclidean inner product space). It can be described in a formal way as
3.4. Spike2Vec
Spike2Vec is a recently proposed method that uses k-mers and RFF to design a low-dimensional feature vector representation of the data and then perform typical ML tasks such as classification and clustering (Ali and Patterson, 2021). The first step of Spike2Vec is to generate k-mers for the spike sequences.
3.4.1. k-mer computation
The main idea behind k-mers is to preserve the order of amino acids within spike sequences. The k-mers are basically a set of substrings (called mers) of length k. For each spike sequence, the total number of k-mers is
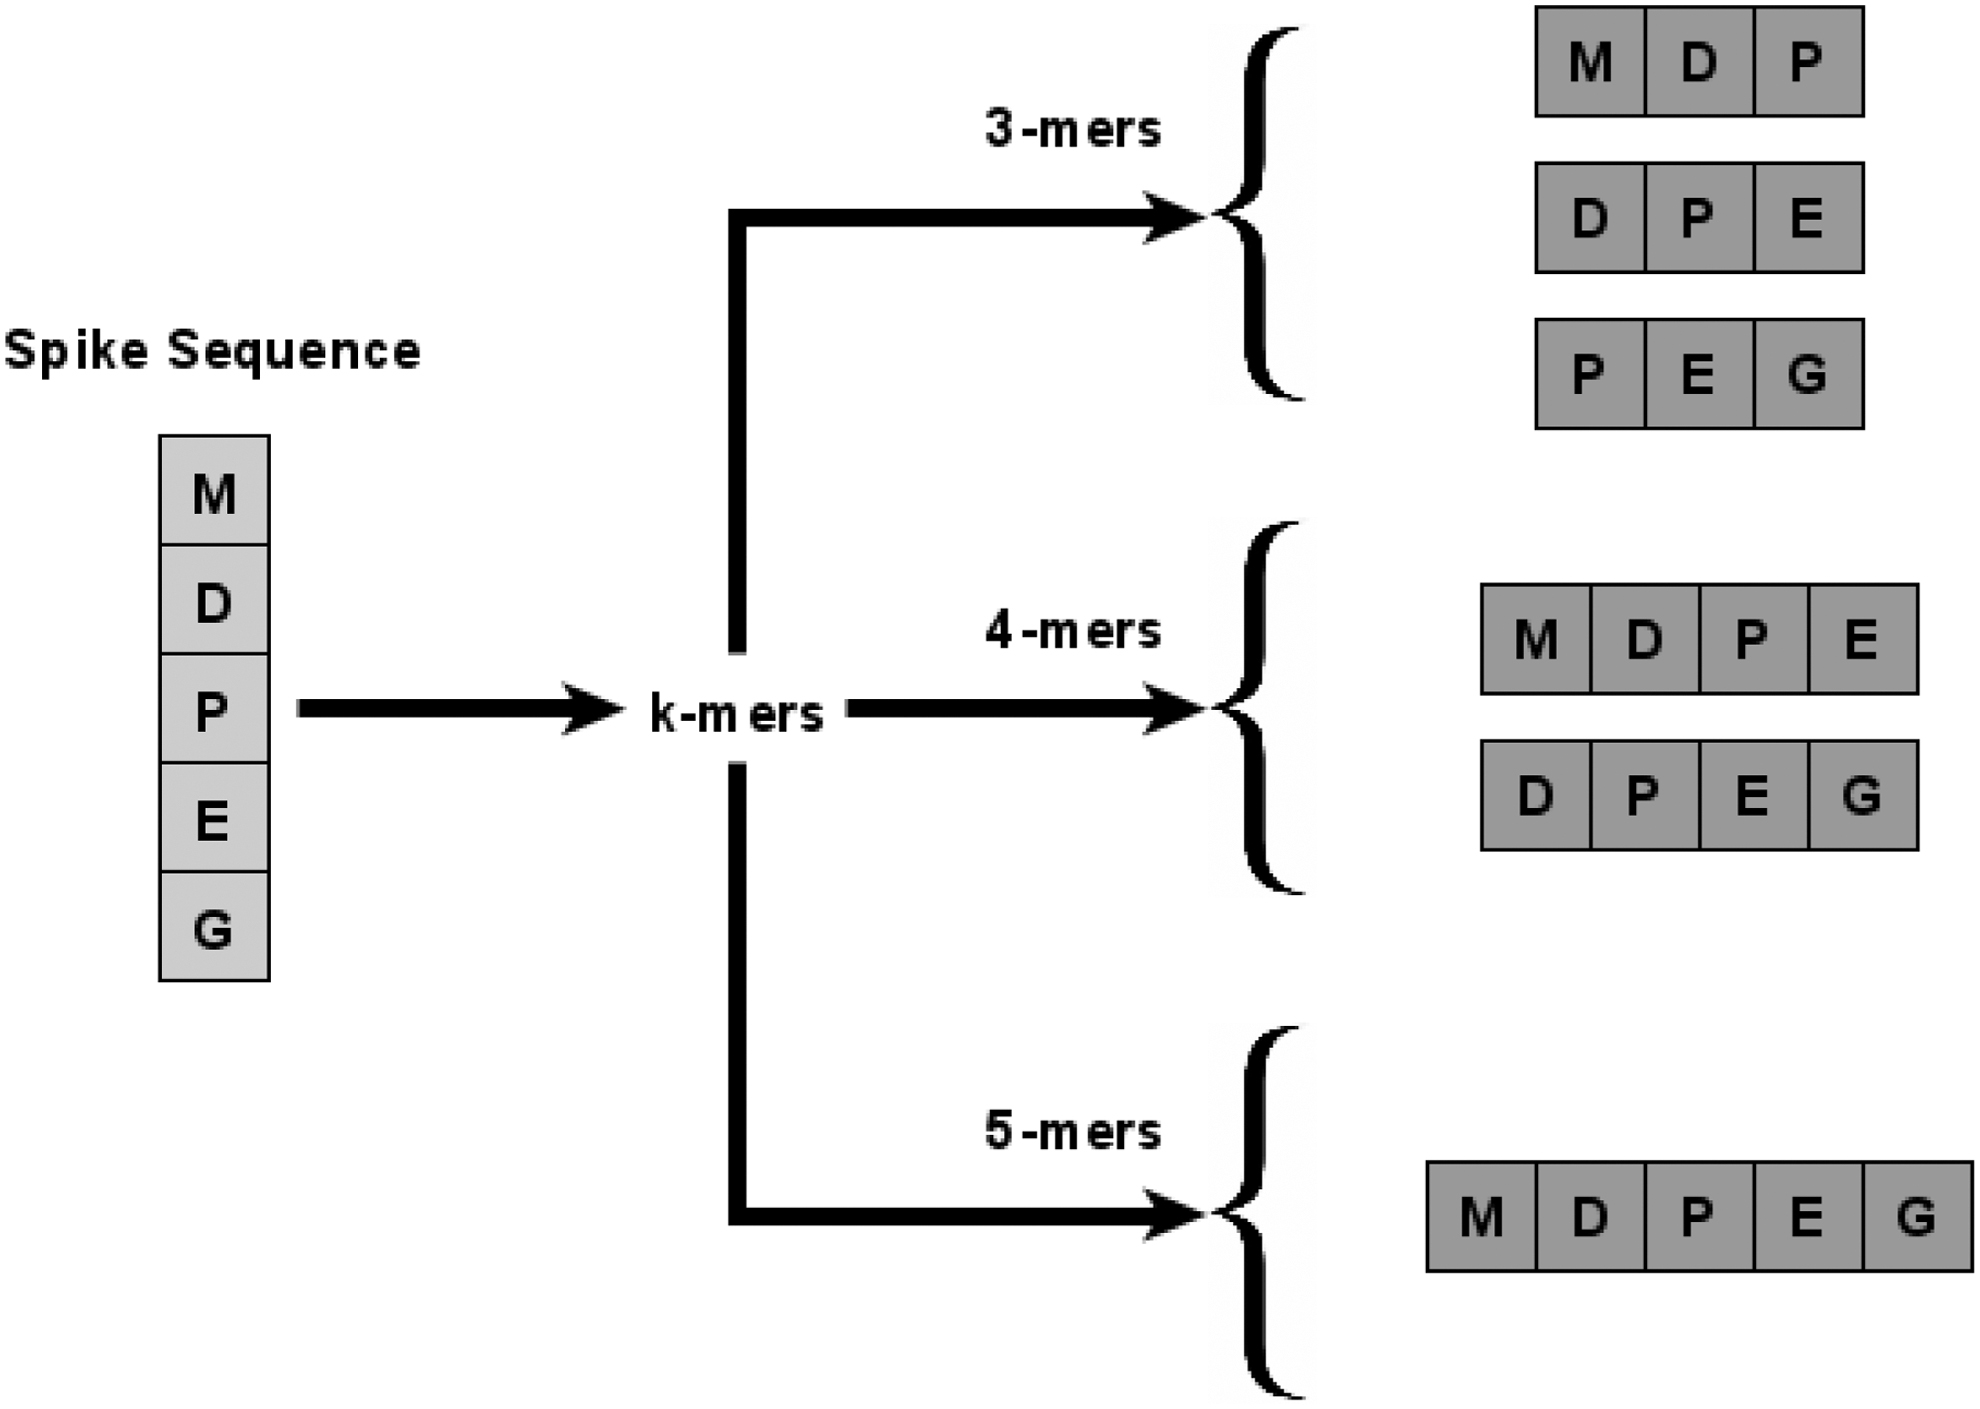
Example of different length k-mers in spike sequence “MDPEG.”
3.5. ML models
To both feature engineering based embeddings, namely OHE and Spike2Vec, we apply three ML classifiers downstream, namely naive Bayes (NB), logistic regression (LR), and ridge classifier (RC). For all these classifiers, default parameters are used for training. To measure the performance, we use average accuracy, precision, recall, and weighted and macro F1, receiver operating characteristic area under the curve (ROC-AUC). We also show the training runtime (in seconds) for all methods.
3.6. NN model
Although the Spike2vec embedding allows the downstream ML models to scale to data sets with millions of sequences, and is proven to outperform the typical OHE, it is not always effective in terms of overall predictive performance in certain scenarios. To further increase the predictive performance, we move to an NN architecture, which takes OHE- or k-mer-based vectors as input. Note that no dimensionality reduction step (e.g., PCA, RFF) is applied beforehand—the NN model takes the OHE- or k-mer-based vectors directly. Our NN architecture comprises a sequential constructor. We create a fully connected network with one hidden layer that contains 9261 neurons (which is equal to the length of the feature vector, i.e., one neuron for every feature at the beginning). The activation function that we are using is “rectifier.” In the output layer, we use the “softmax” activation function.
At the end, we use the efficient Adam gradient descent optimization algorithm (Zhang, 2018) with the “sparse categorical cross-entropy” loss function (used for multiclass classification problems), which computes the cross-entropy loss between the labels and predictions. The batch size that we are taking is 100, and we take 10 as the number of epochs for training the model. Note that we use OHE- and k-mer-based frequency vectors (separately) as input to the NN.
4. EXPERIMENTAL EVALUATION
In this section, we provide some statistics and visualization on the data that we use, and then the precise details of the experimental setup used to produce the results.
4.1. Data set statistics
We use a set of 2,384,646 spike amino acid sequences obtained from the GISAID (n.d.), along with metadata on geographical location (continent, country, and in the case of the US states). These data, organized by country, are given in Table 1.
The Set of 2,384,646 SARS-CoV-2 Spike Sequences Used in This Study, Labeled by Country of Origin
4.2. Data visualization
To evaluate any natural clustering in our data (if any exist), we use the t-distributed stochastic neighbor embedding (t-SNE) (van der Maaten and Hinton, 2008). The t-SNE approach maps the data into a two-dimensional (2D) real vector, which can then be visualized using a scatter plot. Since applying t-SNE on the whole data is very costly and time-consuming, we randomly sampled a subset (
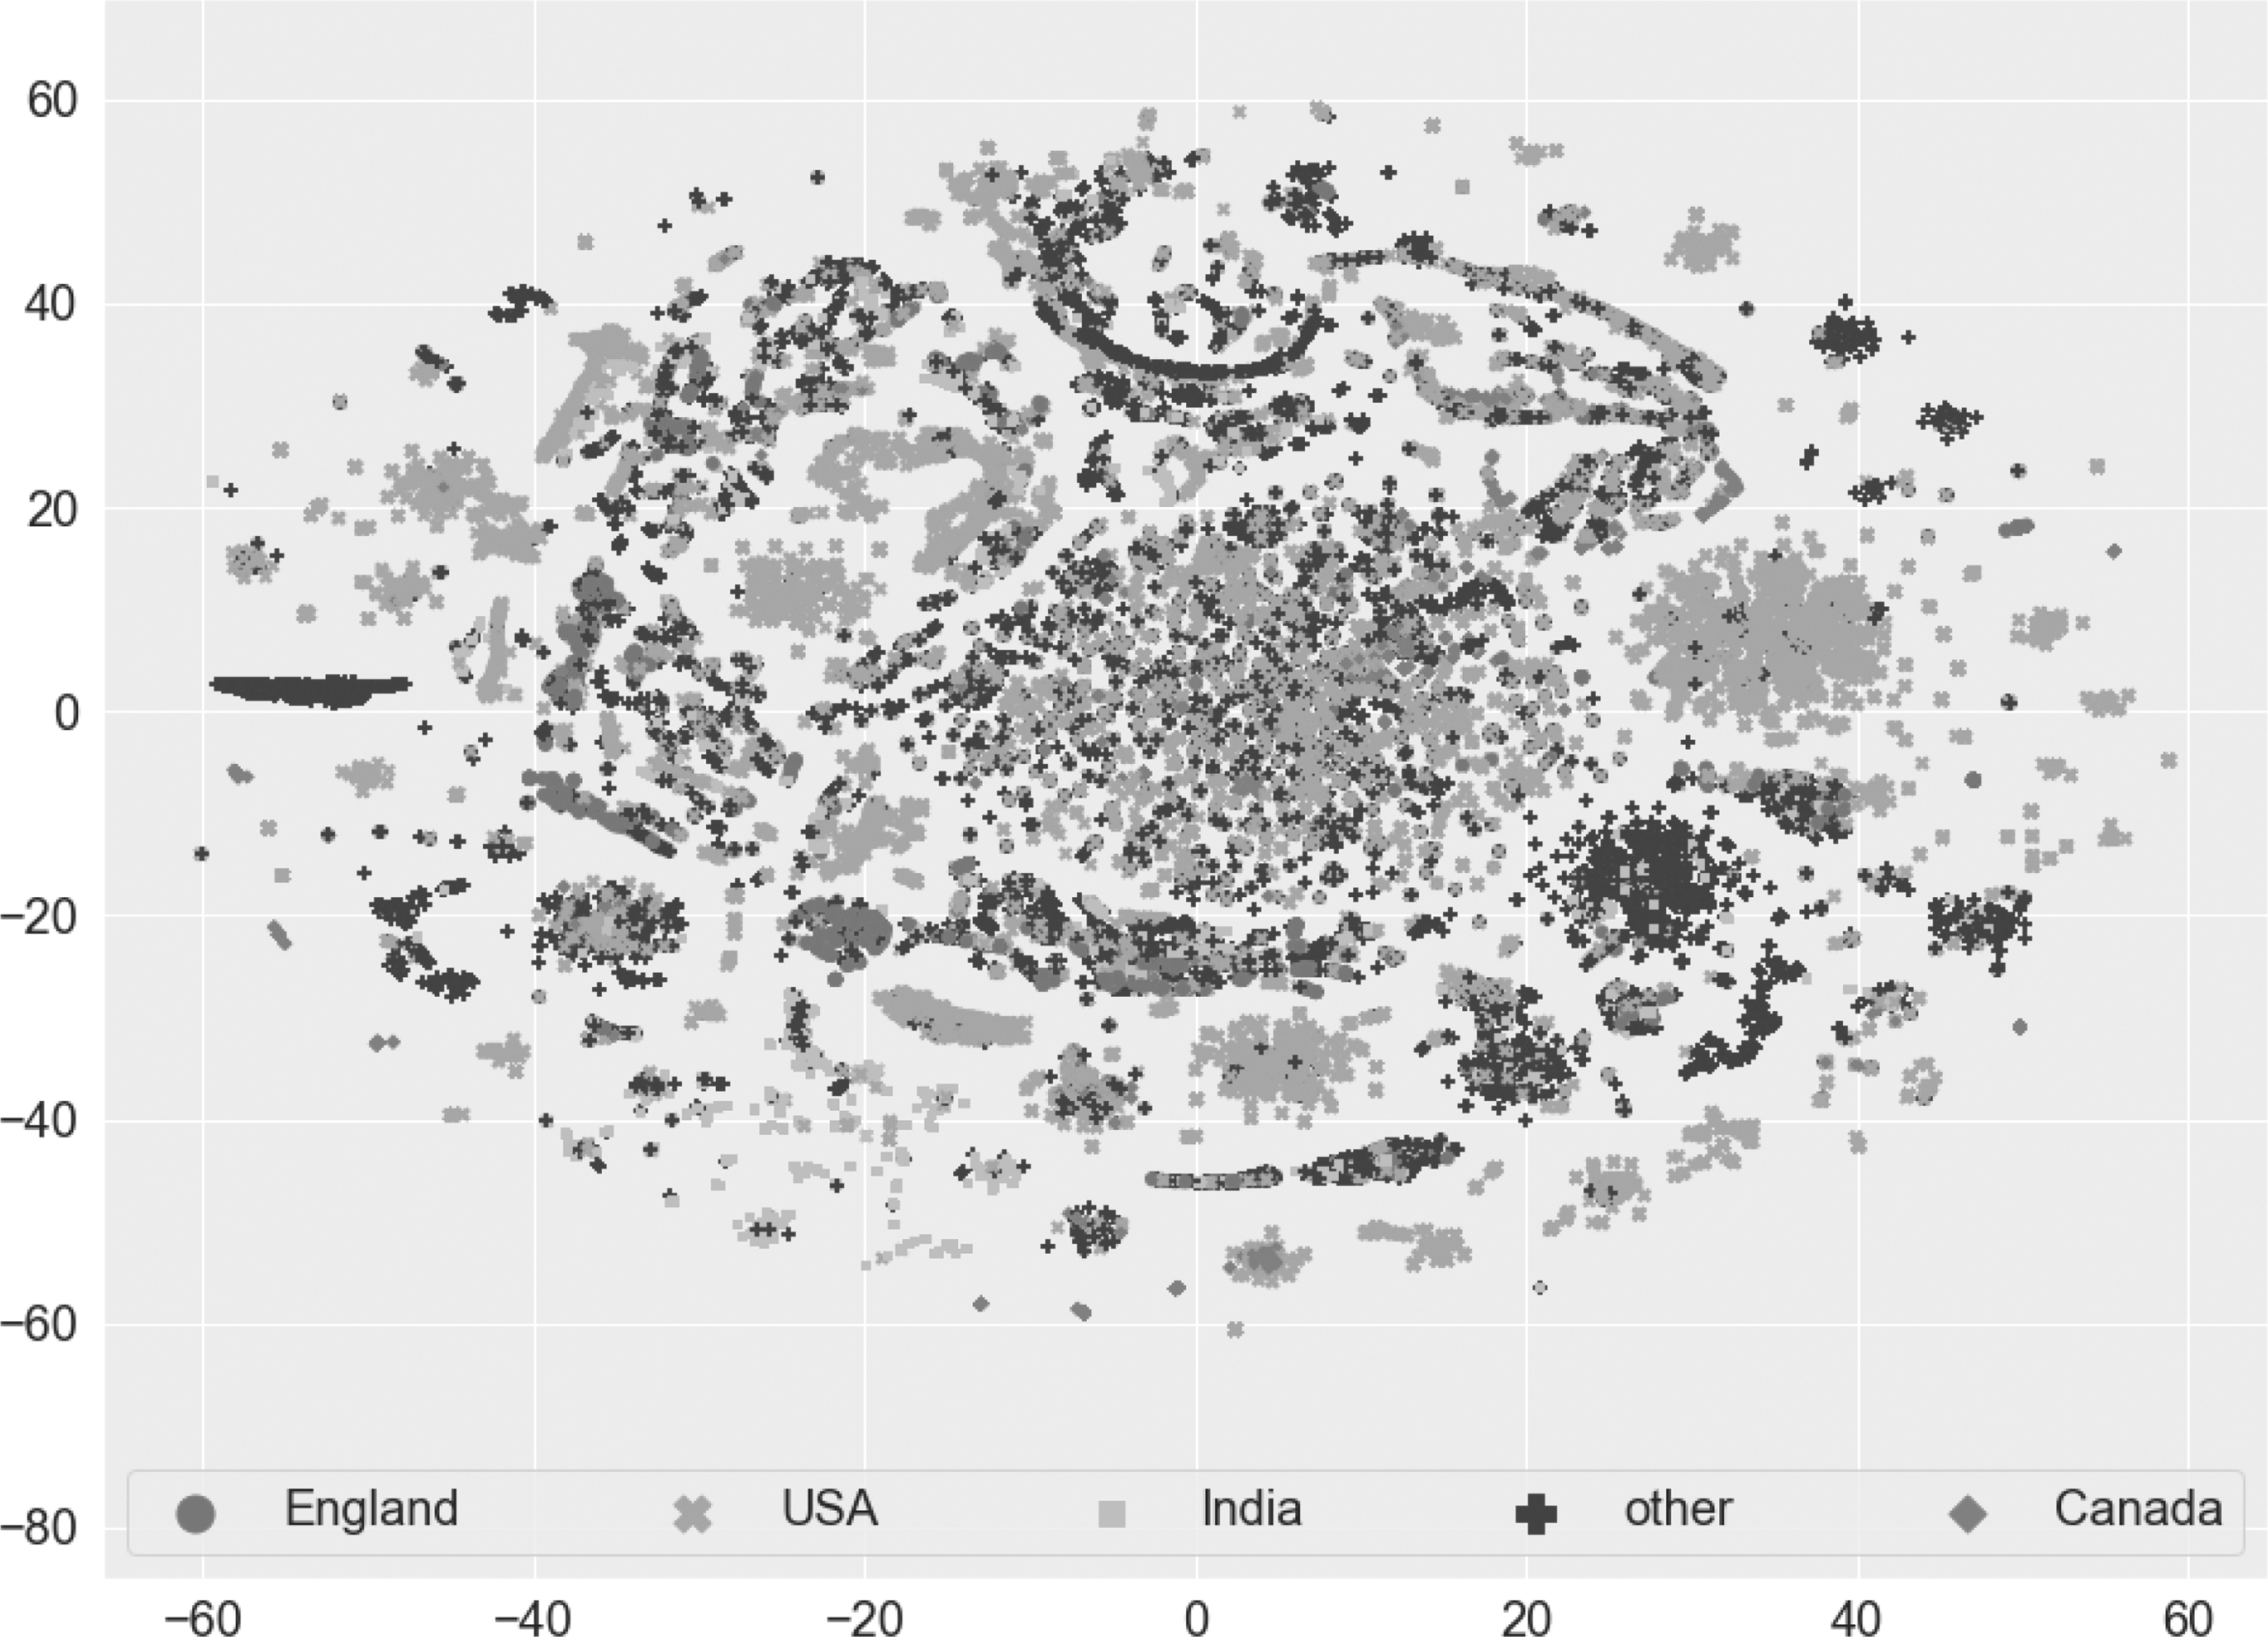
A t-SNE plot from the frequency (k-mer-based feature) vectors along with the country information for
The rate of spread of the three most common variants of SARS-CoV-2 (in the United States) from March 2020 to July 2021 from our data is given in Figure 4. We can see that the alpha variant was clearly the VOC when it reached its peak in April 2021. We can see a drop from this peak for all variants after April 2021. This is likely because a significant proportion of the population was vaccinated by this point, and hence, the total number of cases started decreasing (Ali and Patterson, 2021).
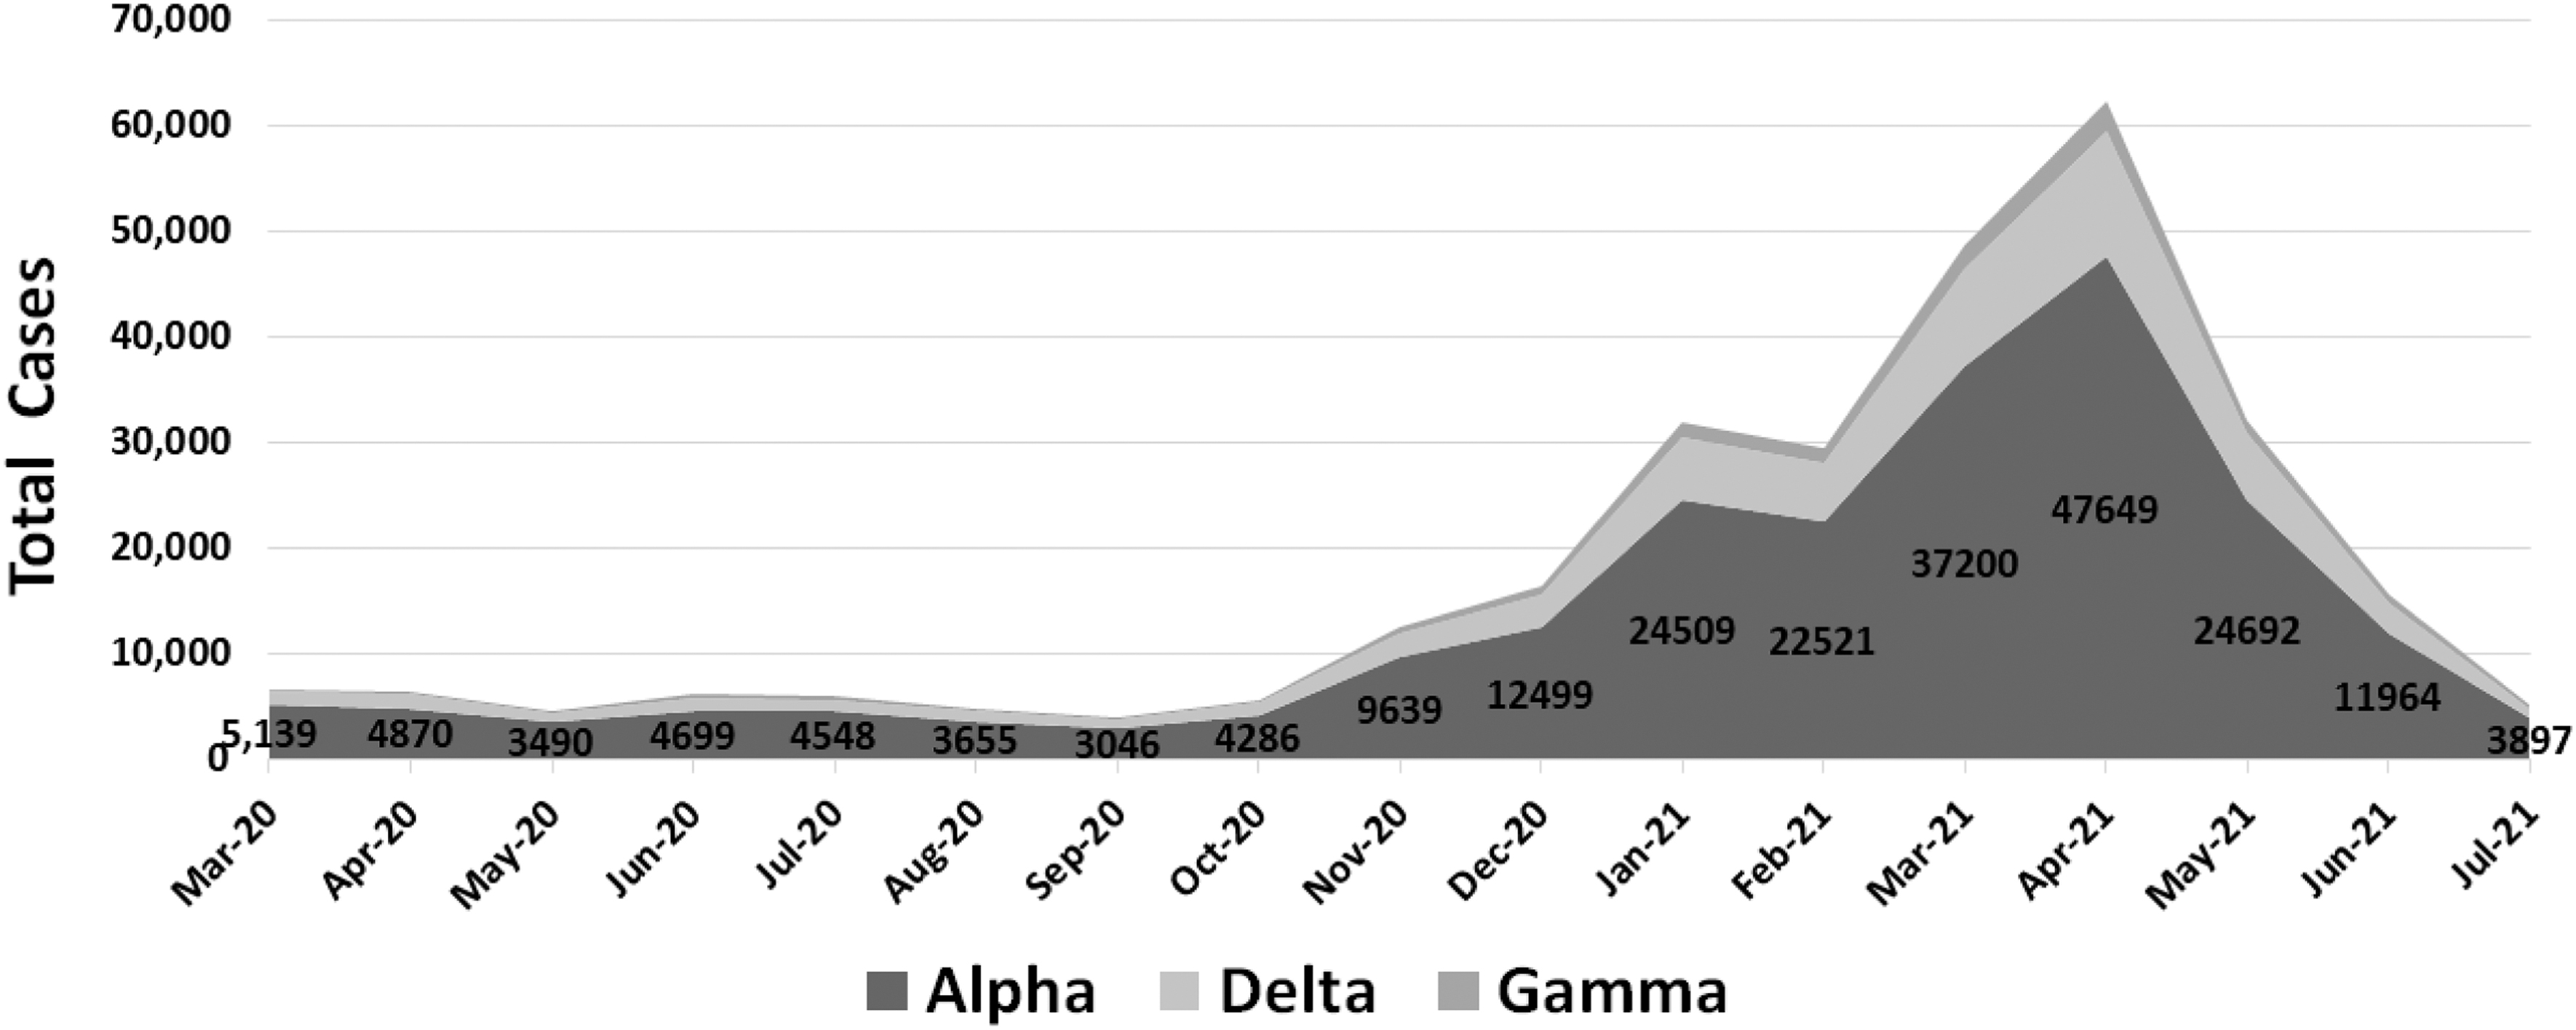
The rate of spread of the three most common SARS-CoV-2 variants (in the United States) from March 2020 till July 2021.
4.3. Experimental setup
All experiments are conducted using an Intel® Xeon® CPU E7-4850 v4 @
5. RESULTS AND DISCUSSION
In this section, we present results for three different granularities of class labels, namely continents, countries, and finally states in a case study of the United States.
5.1. Continent classification
In this section, we show classification results for five different continents, namely Europe, North America, South America, Asia, and Australia (Table 1). The classification results (average
Continent Classification Results (Average ± Standard Deviation of 5 Runs) for 5 Continents Comprising 2,384,646 Spike Sequences (10% Training Set and 90% Testing Set)
Best average values are shown in bold.
LR, logistic regression; NB, naive Bayes; NN, neural network; OHE, one-hot encoding; RC, ridge classifier; ROC-AUC, receiver operating characteristic area under the curve.
5.2. Country classification
After classifying the continents, we take countries as the class label and train all ML and NN models again with the same parameter settings. The classification results (average
Country Classification Results (Average ± Standard Deviation of 5 Runs) for 27 Countries Comprising 2,384,646 Spike Sequences (10% Training Set and 90% Testing Set)
Best average values are shown in bold.
5.3. A case study of the United States
After classifying continents and countries, we investigate our model with more highly granular class labels. For this purpose, we first take the single country with the highest number of spike sequences in the data. Since the United States contains most of the spike sequences in our data (Table 1), we took it as a case study to further explore different states within the United States. The pie chart showing the distribution of the sequences over the US states is given in Figure 5.
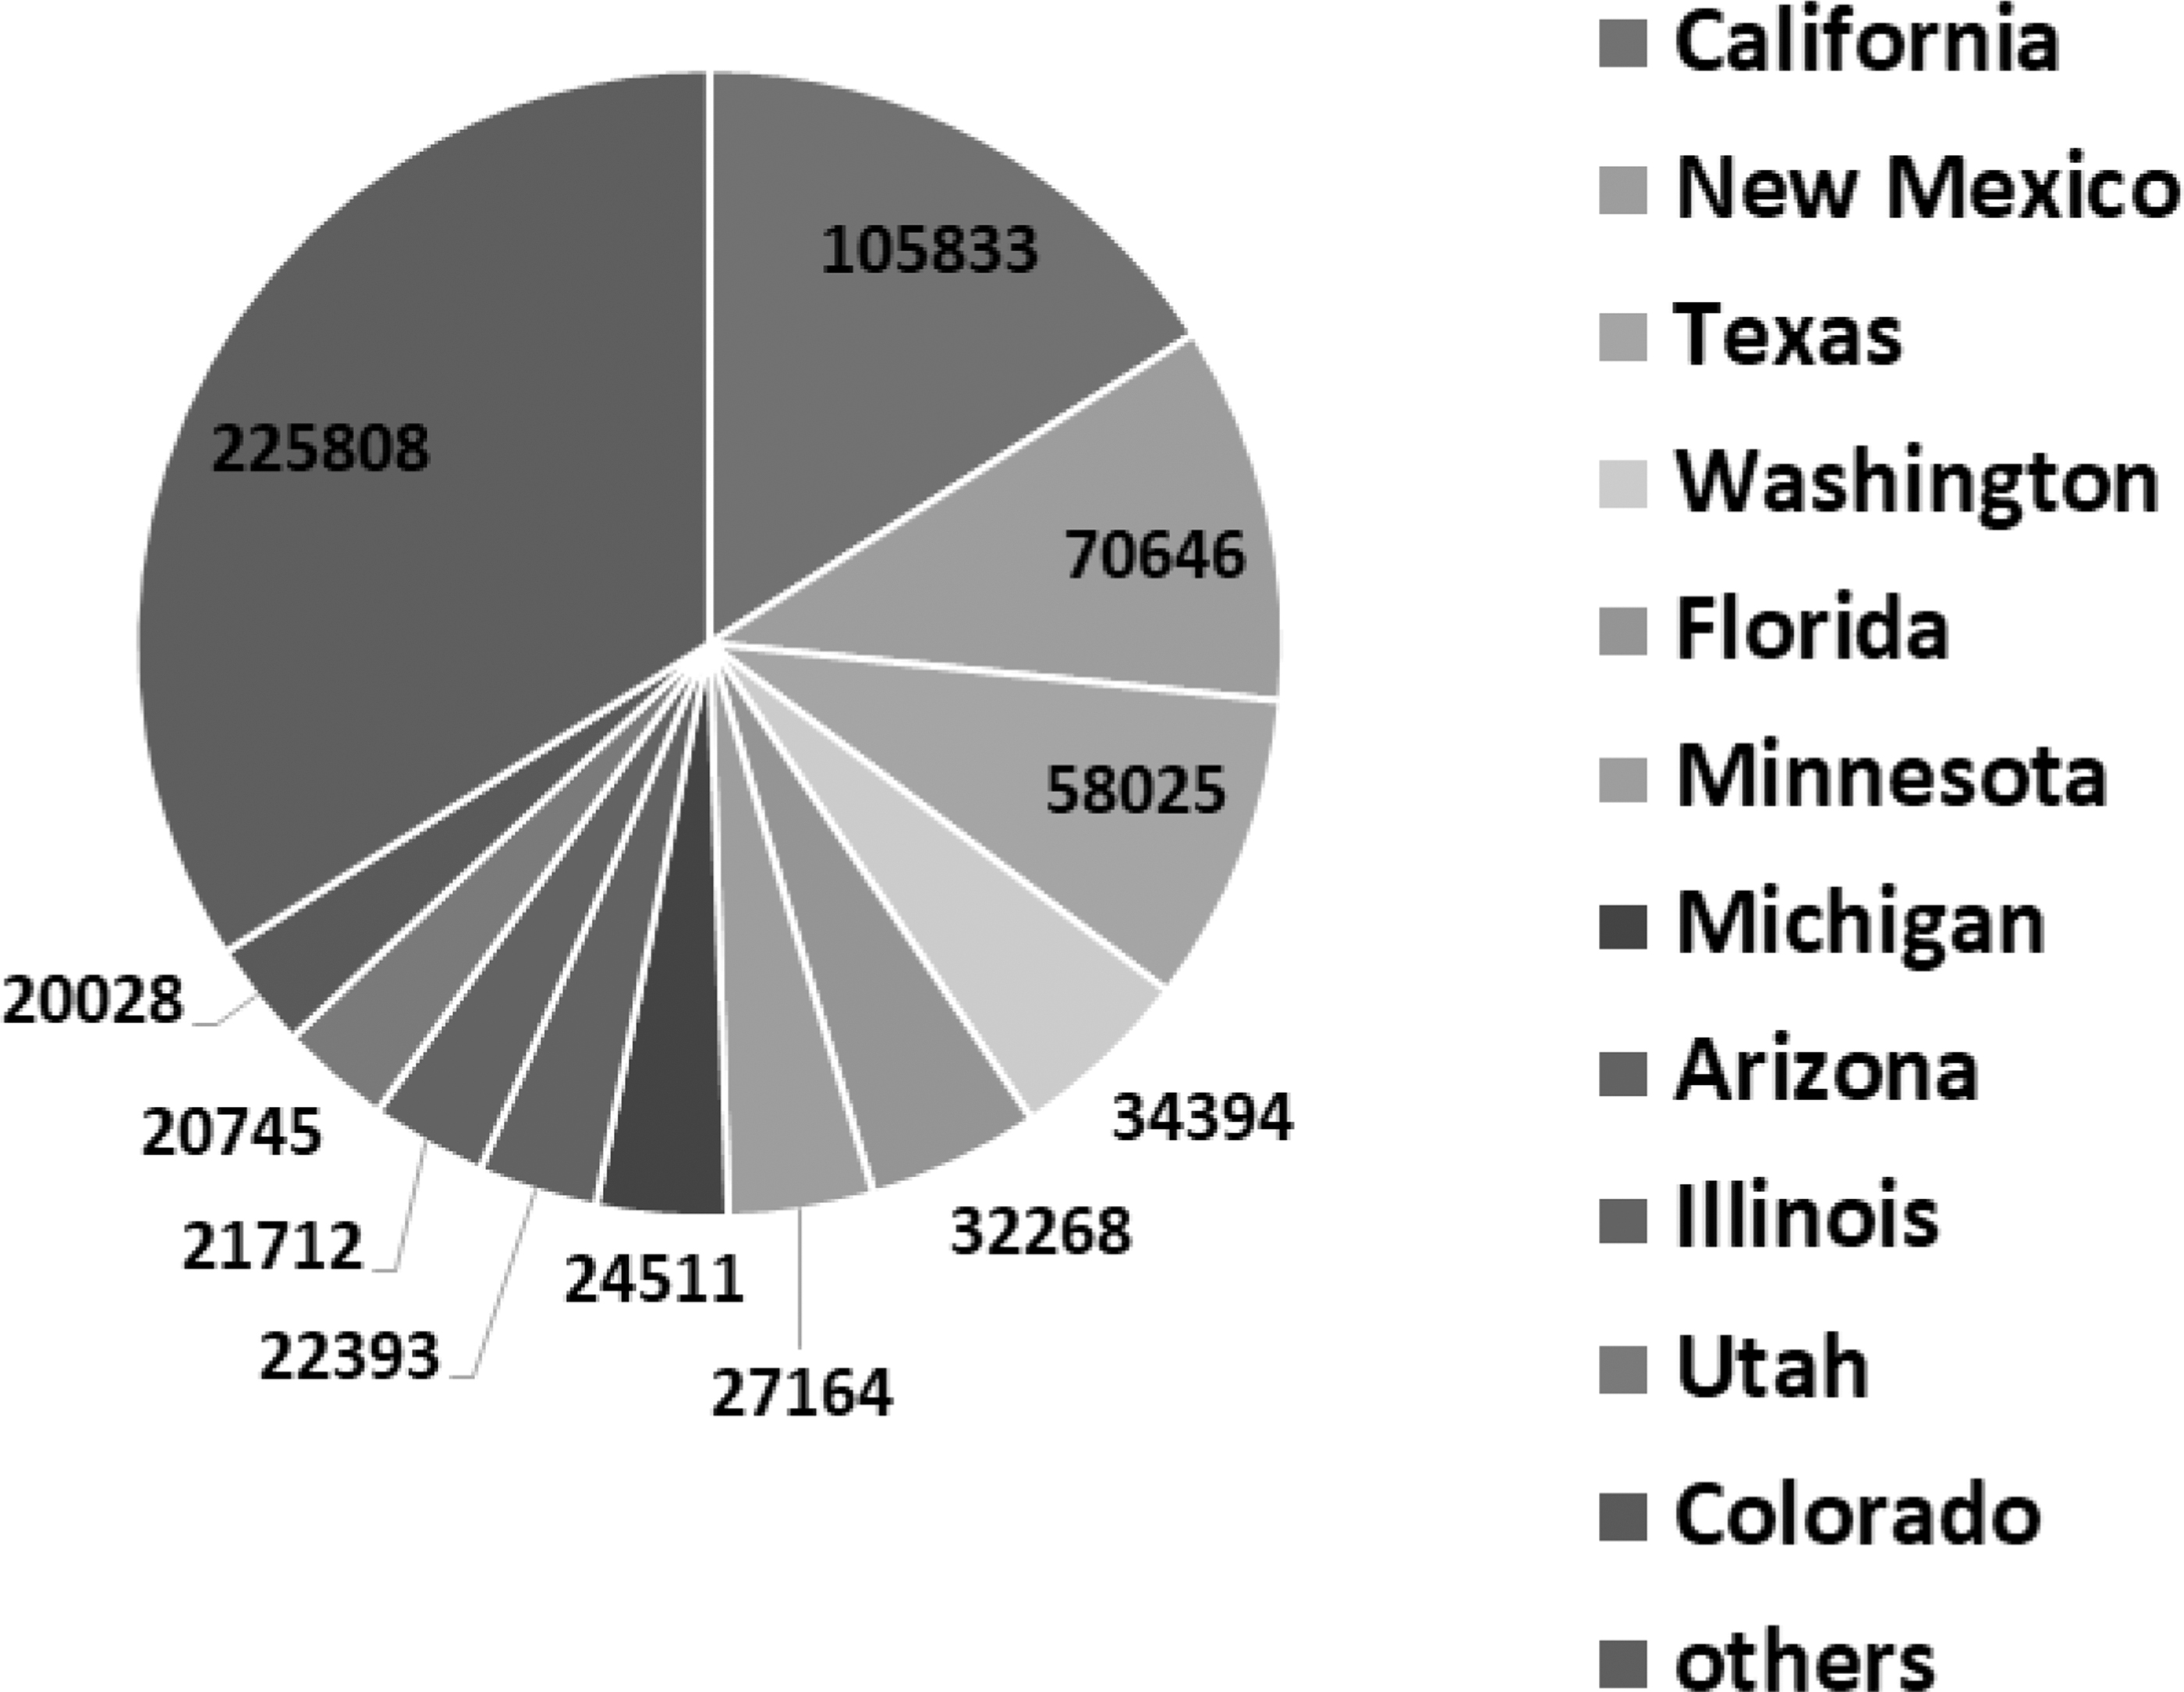
Distribution of the 663,527 sequences over the US states, with the top 11 states specified, while the remaining fall into the “others” category.
The classification results (average
Classification Results (Average ± Standard Deviation of 5 Runs) for Different US States (10% Training Set and 90% Testing Set)
The best average values are shown in bold.
5.4. Importance of attributes
To evaluate the importance of the positions in the spike sequences, we find the importance of each attribute with respect to class label (using the WEKA tool
§
). For this purpose, a randomly selected subset of spike sequences (
where
where pi is the probability of the class i. The IG values for each attribute are given in Figure 6. The IG values for each attribute are also available online. **
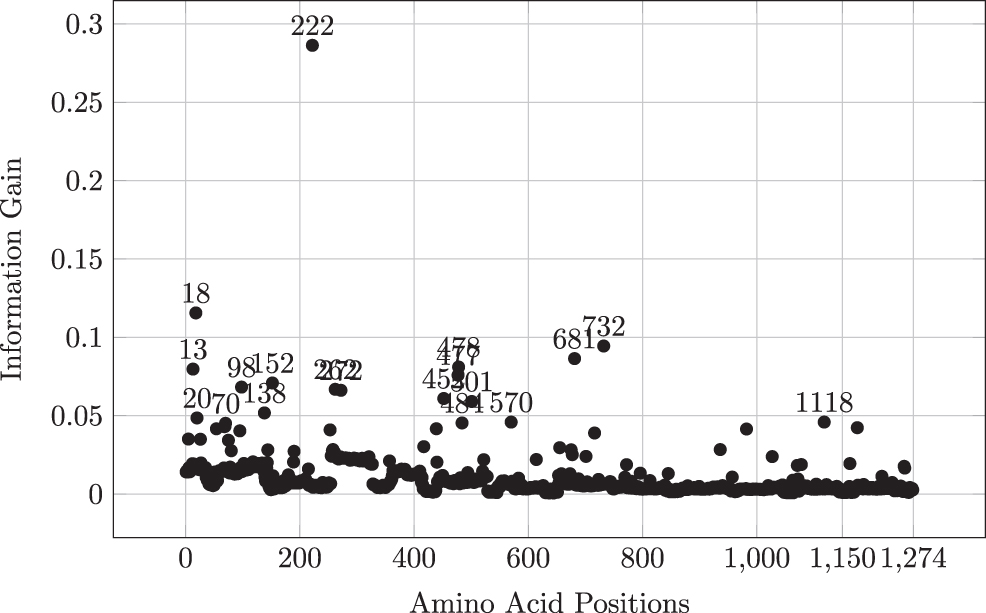
Information gain for each amino acid position corresponding to the class.
6. CONCLUSION
This article uses several ML models using a k-mer-based representation as input and efficiently classifies SARS-CoV-2 spike sequences based on geographical location. We show that our proposed approach outperforms the baselines in terms of predictive performance. Using IG, we also show the importance of attributes (amino acids) in the spike sequences. Such classification and its analysis can help researchers to study more deeply the connection between geographical location and SARS-CoV-2 variants. In the future, we will explore more sophisticated models such as long short-term memory (LSTM) and gated recurrent unit (GRU), and also use other attributes such as months' information to increase the predictive performance, and maybe give an idea of the dynamics (spread) of the virus over time. Using other alignment-free methods such as minimizers is another possible future direction.
Footnotes
AUTHORs' CONTRIBUTIONS
S.A. and M.P.: Conceptualization. S.A.: Methodology. S.A.: Software. S.A. and Z.T.: Validation. S.A. and M.P.: Formal analysis. S.A., B.B., and Z.T.: Investigation. All: Resources. All: Data curation. All: Writing—original draft. All: Writing—review and editing. S.A.: Visualization. S.A. and M.P.: Supervision. M.P.: Project administration. M.P.: Funding acquisition.
AUTHOR DISCLOSURE STATEMENT
The authors declare they have no financial conflicts of interest.
FUNDING INFORMATION
Research supported by an MBD Fellowship for S.A., and a Georgia State University Computer Science start-up grant for M.P.