
Abstract
Somatic evolution plays a key role in development, cell differentiation, and normal aging, but also in diseases such as cancer. Understanding mechanisms of somatic mutability and how they can vary between cell lineages will likely play a crucial role in biological discovery and medical applications. This need has led to a proliferation of new technologies for profiling single-cell variation, each with distinctive capabilities and limitations that can be leveraged alone or in combination with other technologies. The enormous space of options for assaying somatic variation, however, presents unsolved informatics problems with regard to selecting optimal combinations of technologies for designing appropriate studies for any particular scientific questions. Versatile simulation tools are needed to explore and optimize potential study designs if researchers are to deploy multiomic technologies most effectively. In this study, we present a simulator allowing for the generation of synthetic data from a wide range of clonal lineages, variant classes, and sequencing technology choices, intended to provide a platform for effective study design in somatic lineage analysis. Users can input various properties of the somatic evolutionary system, mutation classes, and biotechnology options, and then generate samples of synthetic sequence reads and their corresponding ground truth parameters for a given study design. We demonstrate the utility of the simulator for testing and optimizing study designs for various experimental queries.
INTRODUCTION
Advanced sequencing technologies have made it possible to profile genetic variation at the single-cell level on population scales, revealing in part that the human body is a continuously evolving genetic mosaic (García-Nieto et al., 2019; Abascal et al., 2021). Genetic and epigenetic modifications in somatic cells over many generations of cell growth and replication result in heterogeneity between cells, tissues, and organs in normal aging and development, as well as in disease conditions such as neurodegeneration and, most notably, cancer (Olafsson and Anderson, 2021). Accumulating genomic data has made it apparent that somatic mutability is much more complicated than early models of tumor clonal evolution first suggested (Coorens et al., 2021) and far more extensive in even healthy tissues (c.f. Colom et al., 2021).
Somatic variation produces complex patterns of “mutational signatures” (Alexandrov et al., 2020) reflecting different endogenous and exogenous mechanisms of mutability. In cancers and other precancerous conditions, high levels of somatic mutability are frequently observed due to damage to cell replication or error correction machinery (Salk et al., 2010). They further may include not just single nucleotide variations (SNVs) but also potentially extensive copy number alterations (CNAs) and structural variations (SVs), including complex chromosomal rearrangement patterns and genome duplication events (Li et al., 2020).
As we have come to understand the extent and importance of somatic evolution, enormous effort has been put into developing biotechnological tools for profiling somatic variability at ever greater scales, precision, and accuracy (Ellis et al., 2021). No one technology is able to comprehensively characterize somatic variability across a complex tissue and do so with precision and accuracy and at low cost. Rather, investigators attempting to characterize somatic variation processes now have available to them a vast array of technologies, for example, short read versus long read versus single-cell sequencing, liquid biopsy versus tissue biopsy, whole genome versus whole exome versus targeted sequencing each with distinctive different properties and tradeoffs (Slatko et al., 2018).
Current work increasingly depends on multiomic biotechnology combinations (long read and short read, single cell, whole genome and exome, etc.), along with various other involved study design choices (e.g., number of biopsy replicates), with uncertain knowledge of how these choices together with analysis software will influence one's ability to quantify any particular feature of the somatic evolution process (Koboldt, 2020). There is currently little empirical or theoretical basis on which an investigator planning a study can select a combination of technologies and study design well suited for any particular investigation.
Simulation presents a viable solution to these issues by allowing for efficient tests of various study designs with direct knowledge of most biological parameters of interest. Synthetic data have held a long tradition of use in computational biology, allowing for testing and algorithm design without the expense of carrying out an experimental protocol. One prominent example is the popular BAMSurgeon simulator (Ewing et al., 2015), which has been valuable in testing tumor variant calling algorithms.
However, current simulators fail to capture the broad range of hypermutability processes that occur in cancer cell populations, and often focus on one particular aspect of cancer evolution (e.g., copy number or spatial analysis). Furthermore, no simulator currently exists that allows for the exploration of widely varying study designs and multiomic technologies. For a comparison between features available in our simulator versus others, see Table 1.
A Feature Comparison Between Our Simulators and a Few Other Sequencing Simulators with Related Functions
A Feature Comparison Between Our Simulators and a Few Other Sequencing Simulators with Related Functions
Here, we seek to meet the needs of sequencing study design for somatic variation studies through a new clonal evolution simulator. Our simulator links a coalescent model of clonal evolution to a versatile model of read generation with user-configurable variant classes, mutation rates, evolutionary models, sequencing setups, and study design decisions. Our framework focuses on general properties of sequencing that allow for the design of better experiments and future sequencing technologies.
It also introduces a wide variety of features important to somatic variation studies that are not, to our knowledge, found in any other current simulator, such as capturing broad classes of complex SV that have been implicated in certain cancers. We demonstrate utility of this simulator through application to a series of hypothetical questions in testing and optimizing study design for somatic evolution studies.
The complete simulator consists of four main modules: (1) sampling an evolutionary lineage tree for the clonal evolution, (2) sampling mutation events on the lineage tree, (3) simulating sequence reads, and (4) sampling reads based on experimental design decisions. Hereunder, we describe each module in turn. Each module has a number of user-tunable parameters to control different biological parameters of the presumed cell lineages as well as experimental parameters of the sequencing strategy. Additional information on mutation types and module implementations is provided in the Supplementary Data. The major tunable parameters are summarized in Table 3.
Lineage simulation and mutation events
For each simulation, we generate a cell lineage assuming that mutations are selectively neutral and generally follow the assumptions of the standard coalescent model (Nordborg, 2019). User-definable parameters include a total population size
The simulator supports commonly discovered types of somatic variations, particularly those implicated in the development of cancer (Dentro et al., 2021). These currently include the following: SNVs, CNAs, insertions, deletions, kataegis, chromothripsis, chromoplexy, aneuploidy, translocations, inversions, and breakage fusion bridge cycles. Each mutation type is implemented by sampling from various probability distributions for location and length while simultaneously maintaining constraints encapsulating our knowledge of the mechanism for each mutation type. For a short description of these mutations, see Table 2.
Description of Available Mutation Types
Description of Available Mutation Types
CNV, copy number variation; SNV, single nucleotide variation.
The scale of many of these forms of variations can be tuned, but with default values set based on estimated distributions of sizes found in current studies of cancer genomes (Li et al., 2020). Size distributions for SVs are modeled as a truncated mixture of negative binomials to represent small-, medium-, and large-scale events. Each mutation type also has a rate at which that mutation appears that we assume may differ between tumor stages and in healthy tissues per the “mutator phenotype” hypothesis (Loeb, 2001). The simulator also currently supports simulating mutations drawn from single base substitution signatures derived from the COSMIC data set (Forbes et al., 2010). Distributions over mutation size and location are also flexible.
Once a lineage is simulated, we apply mutations to this lineage going forward from the most recent common ancestor of all the clones to be sampled. Mutation rates for each class of variation are defined as a uniform discrete distribution of potential rates, Mi. For each edge of the lineage, a specific rate is generated through
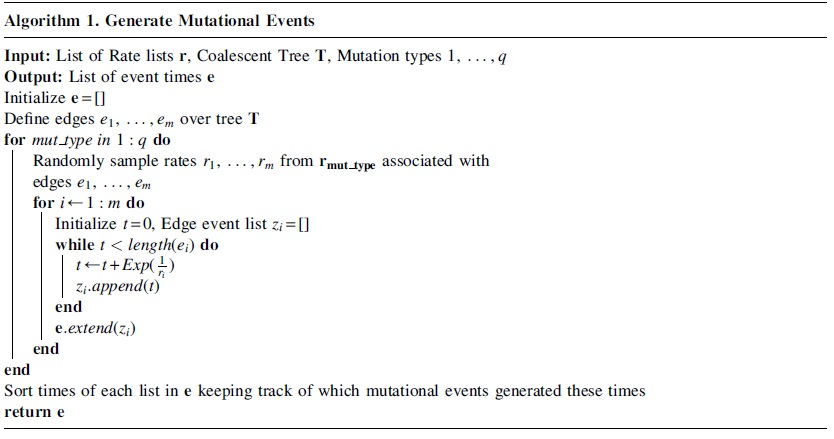
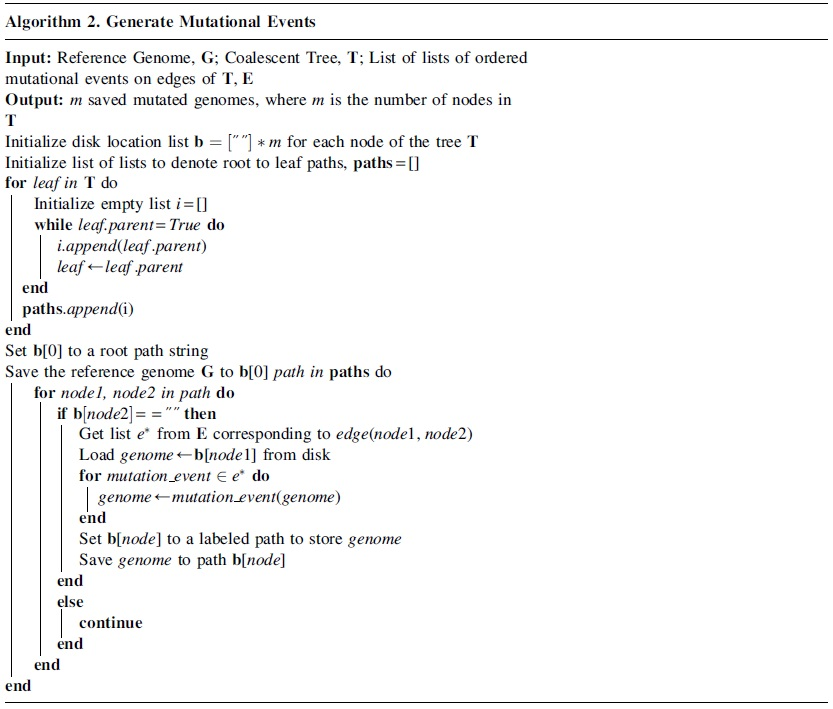
Next, the simulator imposes each of these mutations on a reference genome to establish the sequences of clones at all nodes of the lineage tree. Given that mutations were independently simulated for each mutational class, we first merge and sort the mutational events by time. We first compute all root-to-leaf paths in the tree, which allows us to generate all potential clonal genomes. We start with the root node as the reference and impose sorted mutations for each root-to-leaf path. The end result of this process is a stored genomic sequence for each clone, including those at internal nodes, which is later sampled in the sequencing step.
Pseudocodes for this procedure are shown in Algorithms 1 and 2.
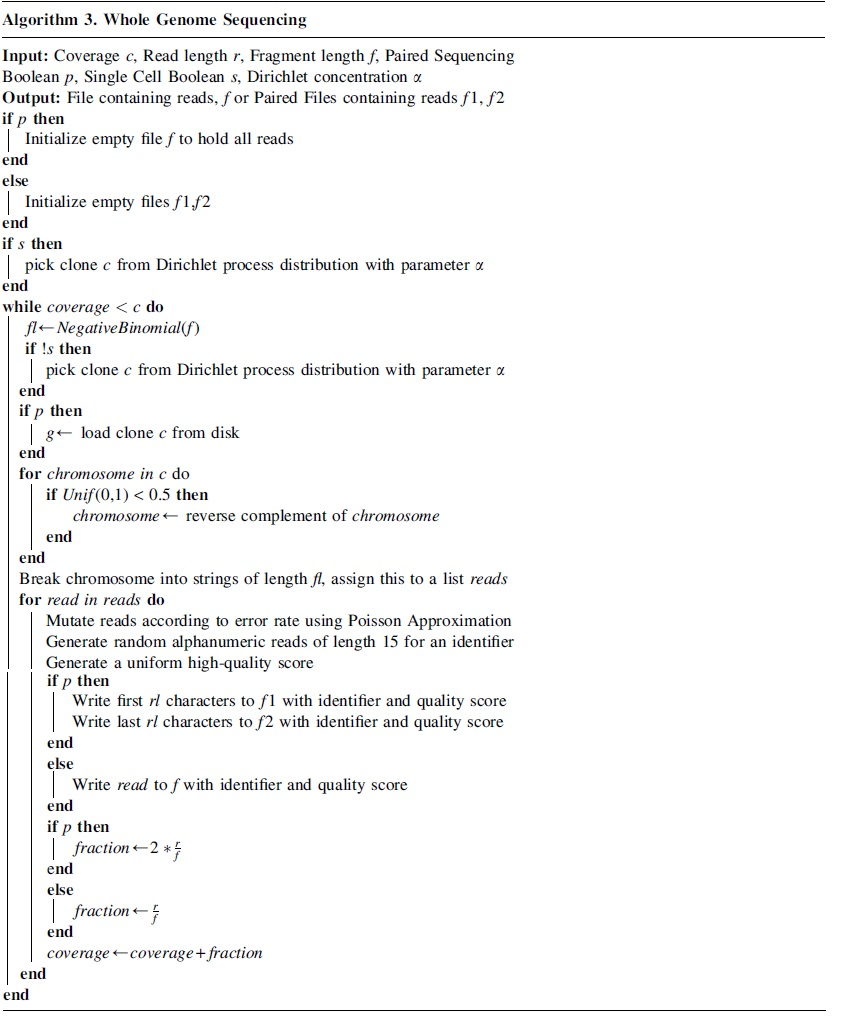
Sequencing procedures differ depending on the type of sequencing chosen (e.g., whole genome sequencing or targeted sequencing). The general strategy, however, is similar. First, a clone from the tree is sampled from a Dirichlet process with distribution
Using these fragment lengths, operations are performed on fragmented clonal reads defined by the user parameters. Specifically, clone k is loaded, “chopped” according to fragment length, subsetted based on read length and paired sequencing type, seeded with errors according to the error rate, and written to a FASTQ file, a standardized genomic file format developed by the Wellcome Sanger Institute. After this particular clone is sequenced, the coverage of the simulator is updated according to the fraction of the genome covered depending on the read and fragment length. This process repeats with independent repeats of each stochastic process until the desired coverage is reached.
The process for exome and targeted sequencing requires additionally identifying reads that align to exon or targeted gene sequences. This approximate string matching problem is computationally infeasible over every possible read so we make a few simplifying assumptions. First, we create k-mer sets for each of our target sequences and use locality sensitive min-hashing—a technique where we use a min-hash function to generate a lower dimension of the genomic sequence, and a locality-sensitive hashing algorithm to quickly determine match probability—to index these sequences for fast lookup (Rajaraman and Ullman, 2011). Then, for genome locations surrounding our target sequence intervals, we calculate whether reads originating from these genome locations match some target sequence in the hashing index above a certain threshold. If this location matches some sequence, then we add it to a list of locations.
We repeat this sampling according to the user set parameter GN times, and use this list combined with the original sequence locations to generate a discrete probability density to sample read locations. We sample reads from this generated list with the given read length while simultaneously sampling different clones until our desired coverage is reached. Psuedocodes for genome and exome sequencing are shown in Algorithms 3 and 4.
Modifications also occur for single-cell sequencing, where we do not continually resample cell clones, but instead sample only once and use the given clone until the desired coverage is reached. Finally, for liquid biopsy, we perform a similar iterative clonal sampling procedure, but do not chop the sequence uniformly. Rather, we draw random fragments from the genome strings of each clone and mix them at some frequency with reference DNA then return these in a read file.
The full simulation is defined by looping the lineage, mutation, and sequence sampling over tumors and samples. Specifically, we independently define and execute a separate lineage sampling and mutational frequency for the number of user-defined tumors generated. Similarly, we configure parameters related to sequencing decisions, and execute the procedures already listed according to the number of user-defined samples requested. The final result of the simulator is a labeled directory with subdirectories corresponding to reference reads, tumor reads, and sample reads as shown in Figure 1.
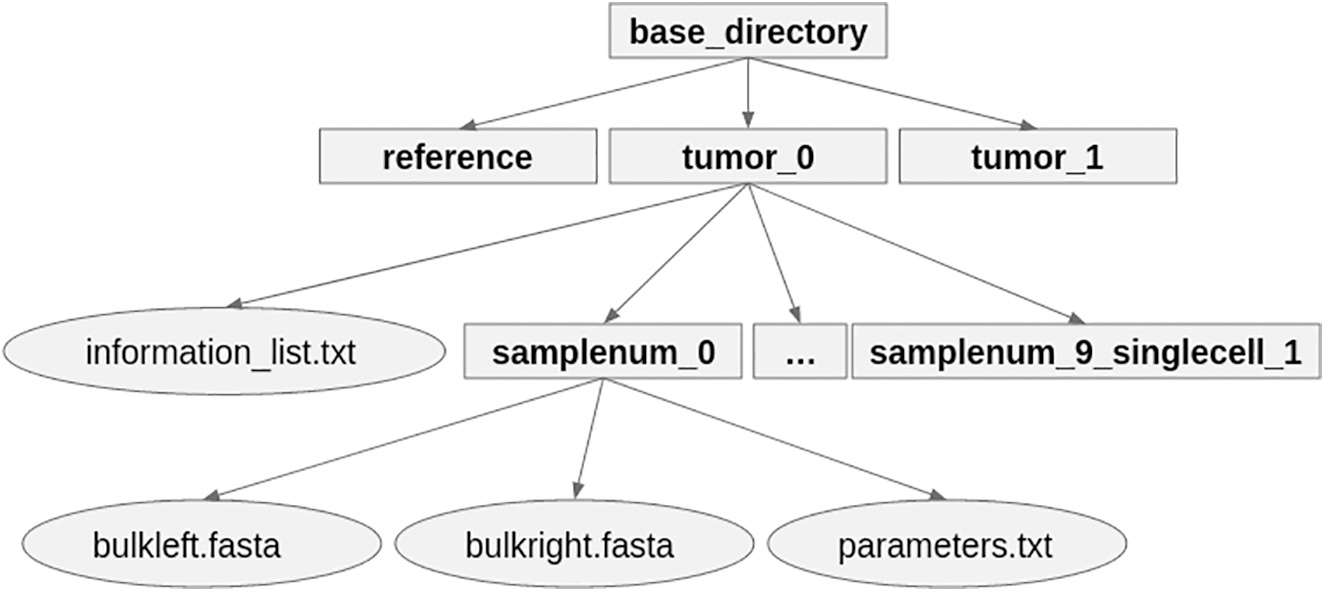
Example simulator output and directory structure for a single run.
Each of these directories holds ground truth parameters with information about the tumor and sequencing parameters. Although we described the simulation method for singular values of the parameters listed in Table 3, the practical implementation of the simulator encodes most of the parameters as a list of values and samples from each list to generate the total simulation. This random sampling procedure allows for grid search exploration of study design spaces more easily. We refer to each parameter with a subscript to denote the sample number. For example, ni would denote the number of single cells on the ith sample. In cases where we survey multiple sites of somatic evolution, we use a double subscript to remove ambiguity. For example,
Summary of the Main Tunable Parameters
Defining
The maximum memory usage is constrained by the genome size, read length, and sequencing type. In general, this factors to around 5–10 × the size of the genome in standard sequencing settings. If the user wants to minimize memory footprint, then he or she should set the batch and subblock size to 1, or avoid generating long-read exome-sequenced data. The amount of disk storage of the program is bounded by the storage of the clonal genomes during the mutational process as well as the sequencing FASTQ files. This is approximately proportional to
The code for the simulator is implemented in Python, and a single run of the simulator involves changing the parameter file and running the Python command. A single run of the simulator only uses one core, allowing for parallelization across cores or nodes, provided the system has enough memory. All our tests were performed on a multinode Ubuntu system with 184 cores, 850GB of memory, and 10TB of storage. As a reference point, three 30 × -paired whole genome sequenced (WGS) samples take ∼3.5 hours to generate on our system and use ∼250–300GB of disk storage and <40G of memory.
Simulator usage
The simulation process already described has a number of tunable biological and experimental parameters (detailed in Table 3). The main biological parameters include mutation rate, number of clones, and number of tumors. The main experimental parameters include the number of samples and various parameters describing the sequencing modalities. Each major tunable parameter is encoded as a list, which is randomly sampled, allowing for the user to vary both the biology of the tissue and the different experimental setups. The intended usage of the simulator revolves around testing the limitations of various study design paradigms against different somatic evolution instances.
For example, if one were interested in finding a study design for testing presumably “healthy” tissue for mutation burden, he or she might fix the mutation rate list to a low rate and replicate a large number of tumors as well as search over a broad experimental design space. In contrast, if one were interested in the limitations of a particular study design (for instance, 30 × WGS), he or she might replicate a broad range of tumors with various mutation rates and clone numbers while fixing the experimental strategy.
EXPERIMENTAL RESULTS
In this section, we demonstrate the utility of our simulator in evaluating or optimizing sequencing study designs for profiling clonal evolution. A primary motivation of this simulator is to plan study designs for evaluating questions about differences in somatic mutability between subsets of samples. The questions for study design are to test whether a difference can be detected between two subsets of samples under a given study design or to find a study design optimizing power to detect such differences. Here, study design might include changes in the types of sequencing applied, the informatics software used to evaluate it, and features such as the number of tumors and tumor sites or regions to be examined.
We would then assume that the study is being used to test for differences in biological parameters between subsets of samples. Such biological parameters might include mutation rate differences, presence of rare variations, variation in mutational signatures, phylogeny structures, or clonal frequencies.
Notation and performance measures
For the analyses presented here, we take the sequencing read outputs from our simulator and perform alignment to the hg38 reference genome, after which we call several forms of variation for analysis. The aligners used were minimap2 (Li, 2018), Bowtie (Langmead and Salzberg, 2012), and bwa-mem (Li, 2013); the callers used were Strelka (Kim et al., 2018) and Delly (Rausch et al., 2012). Throughout the tests, we reference our study design, which we formally define as a collection of matrices
Matrices Xi denote the sequencing decisions taken on tumor i and encapsulate every sample. Namely, each matrix Xi is of dimension
Vector
To judge a study design's utility, we require performance measures that assess whether the design is recovering a signal related to the intended hypothesis. Judging the performance of variant caller outputs is a challenging problem in its own right, especially in the case of highly mutated and heterogeneous somatic samples. Temporally layered mutation events add difficulty to pinpointing the original source of variation. This difficulty is compounded in the case of SV, where we do not have a standardized labeling scheme, nor a way to traceback the location of an event with respect to the original genome.
However, we aimed to create measures that correlated with overall performance, particularly on the types of somatic populations we would expect in cancer patients. We use recall as the metric for highly mutated SNV samples and F1 score for less heavily mutated SNV samples. For structural variants, we use the measure described in the following text. Call the variant output locations for chromosome i,
In this measure, we assign a score by checking whether each ground truth event overlaps with some called event (this is our rough estimate of a “correct” call). The overall chromosome's score—the inner sum—is then determined as the fraction of ground truth events that have been overlapped. The scores for each chromosome are then weighted averaged with weight according to the total number of variant events in that chromosome for the total score. By judging the structural variant callers on overlap rather than precise matching, we are able to bypass some of the labeling fidelity problems mentioned previously. Finally, all of these measures have their range in the unit interval [0, 1] that allows for straightforward construction of more nuanced measures.
We first evaluate whether a given study design would be able to detect a difference in SNV mutation rates between tumors. A motivating hypothesis for these tests is the idea that cancerous and precancerous tissues should typically exhibit hypermutability phenotypes, that is elevated rates of particular kinds of variation that lead to genetic heterogeneity across cells. We would then wish to detect whether a specific study design would be powered to detect a hypothetical difference in mutation rate between two samples indicative of a hypermutability phenotype specific to one sample.
We assume that we have two independently sampled tissues, and we wish to determine whether the mutation rates of various mutation classes are different between these tissues. To create a specific scenario, we generated two sets of SNV data, one where the average rate was high and the other where it was comparatively low (denote the rates as
All other parameters were kept equal at reasonable values (0 error rate, paired-end sequencing, 0 single cells, with 1 sample per tissue). We assume that the first tissue has mutation count generated as
Several statistics can be used to establish p values for a two-sample Poisson rate test (c.f. Gu et al., 2008), but here we favor a conditional test based on the fact that the conditional distribution of M1 given
In our empirical test case, 244 mutations were called in the higher SNV rate data set and 2 were called in the lower SNV rate data set. Times t1 and t2 are estimated, with uncertainty, as depths of somatic lineages that could plausibly lead to a tumor; we assign them random variables
In our test case, we took 500 random draws of times
Evaluating study parameter choices
A more involved use of the simulator would be to test a range of study designs and identify those powered to detect a hypothesized effect. To provide a concrete example of such a study design question, we first evaluate how varying coverage would change our ability to call SNVs. To do this, we generated eight sets of data, each with an average SNV rate of ∼
All biological parameters were fixed. The depth of coverage parameter was sampled from the set
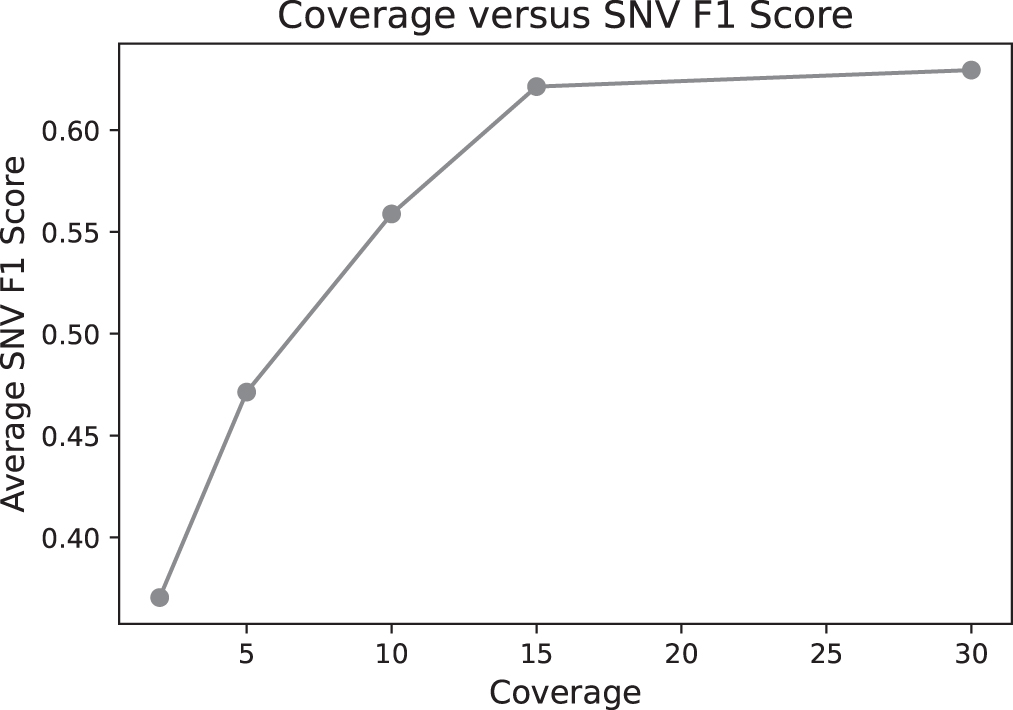
F1 score for single nucleotide variation calling accuracy on simulated bulk sequencing data as a function of depth of coverage.
The most involved intended use of the simulator is to optimize a study design to evaluate a particular hypothesis about somatic variability. The presumed goal is to design a study that is optimally powered to detect the hypothesized signal within available resource constraints. Here, we demonstrate the use of our simulator to answer such a study design question to find an approximately optimal study design for a particular hypothesis. The prior premise can be framed as the following optimization:
Here
The expectation can be approximated by Monte–Carlo methods, where a singular study design,
We assume that our study design variable
We fix our callers as Strelka and Delly, fix most biological parameters, and fix our number of samples at 1. We assume that all study designs have fixed cost
The best study design had a read length of 2000, a coverage of 25 × , a 0.0 error rate, and was whole-genome sequenced. Further study design scores are given in Table 4, as well as the github repository. As expected, the best study designs were mostly whole-genome sequenced, which allowed the recovery of more variants across noncoding regions. Similarly, high coverage did seem to boost the power of the design, but there did not appear to be a large difference between 10 × and 30 × coverage.
Top Four Scoring and Bottom Four (Nonzero) Scoring Study Designs
Increasing the read length boosted our ability to detect structural variants in samples, in both exome- and genome-sequenced samples. The error rate parameter did impact the rate of false calls and the ability to detect SNVs, but the overall scores were not heavily affected by the error rate even though many more false SNV calls were generated. However, with respect to SV, the larger error rate samples did not appear to do significantly worse. This meant that long-read high error rate designs did well with respect to our scoring measure. There were also some sample size effects, as shown by the variance bars in Figure 3.
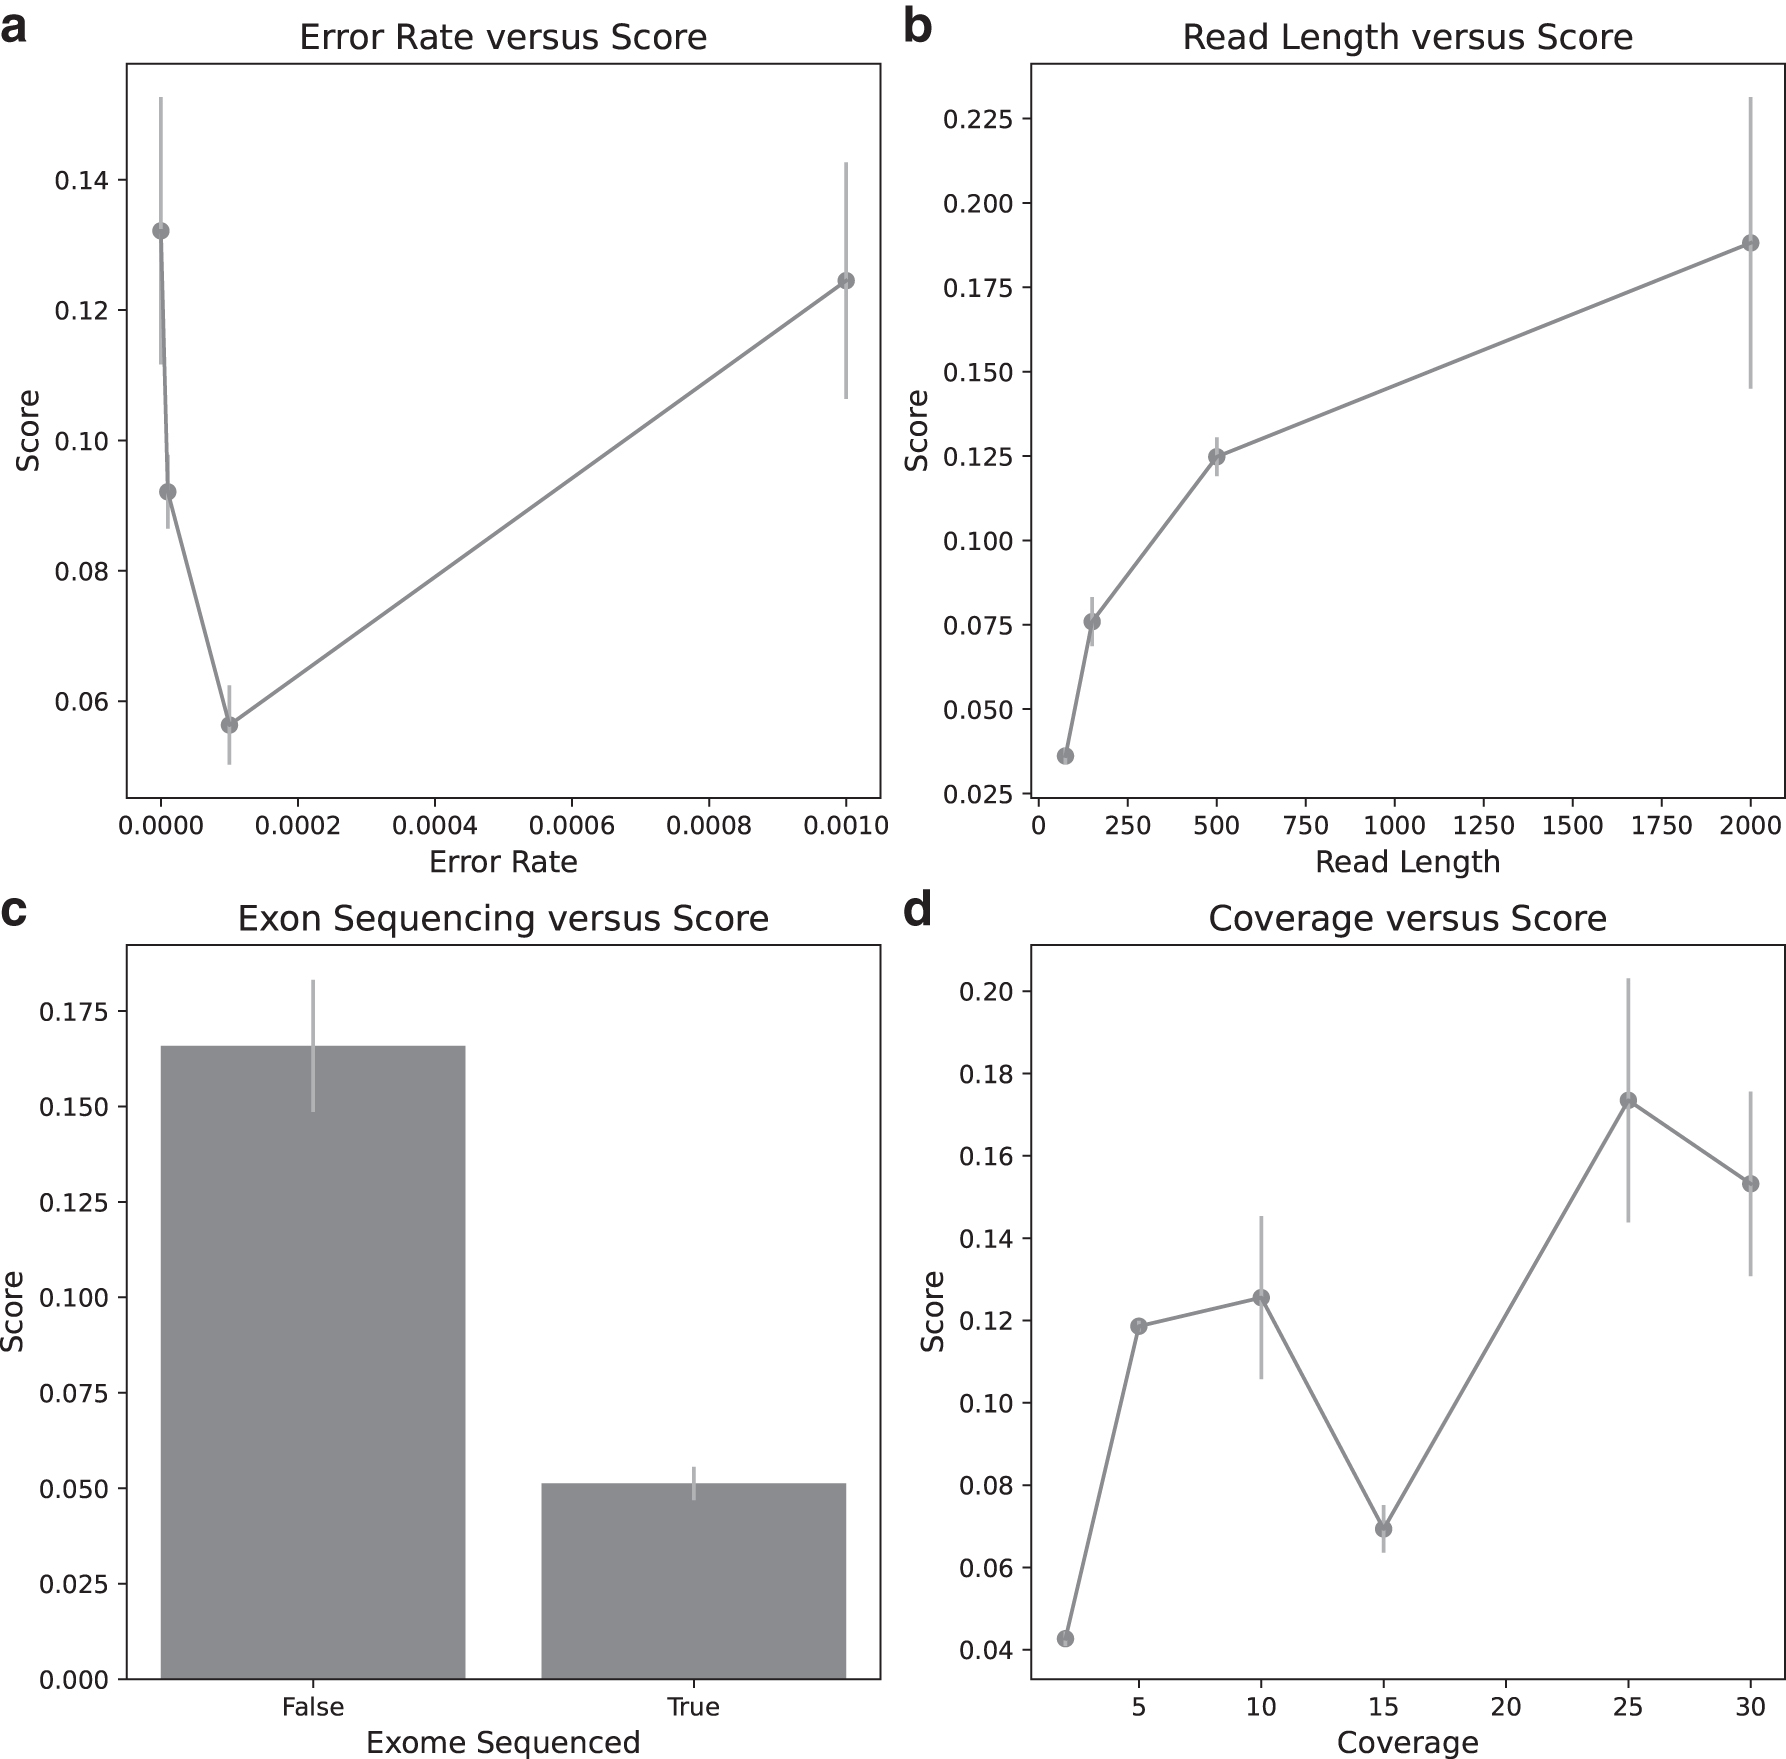
Visualizations of various parameters and their impact on the efficacy of a study design. Read length showed the strongest positive correlation with study design score (
For instance, the point with highest error rate in Figure 3a had a relatively high variance, which might be due to its low sample size in conjunction with association with other advantageous study design parameters. We might expect more confident identification of trends with an increase in the number of replicated tumors. In particular, we might expect the “dip” seen in the coverage plot of Figure 3d to revert to a smooth logistic-type curve, and the error rate plot of Figure 3a to show a more clearly negative trend of score versus error rate.
The worst study designs were often exome sequenced, had poor coverage, or completely failed to recover a particular variant type due to noise. Figure 3 shows tradeoffs between score and the model design parameters in our exploration of the search space. Different conclusions may have been reached if we imposed budget or cost constraints for various parameters.
Aside from identifying efficacious study design vectors and study design parameters, our simulations yielded a number of tangentially interesting results. One finding that may have implications for future cancer informatics development was the effect of hypermutability and rearrangements on our ability to recall variants. High-frequency SV introduced a substantial amount of noise in our SNV caller report. As expected, the task of calling layered SVs at various frequencies was more challenging than that of SNV. With regard to analysis, the patterns that large scale hypermutability, high sequencing error, and imbalanced clonal samples can induce on sequencing reads should be considered when developing the next generation of cancer informatics tools.
In particular, the standard practice of genome alignment and variant calling may not return valuable information in the case of a highly structurally varied and low frequency sample. A final observation generated by the simulator was that ensembled and merged study designs often tended to perform better than single-sample designs with respect to profiling the variant spectrum of a tumor, though this often came at the cost of increased false positive mutations. Namely, in tumor samples where we generated multiple genomic sequencing samples on a single tumor, the merged samples often recovered significantly more forms of variation, even with relatively rudimentary sequencing protocols.
This holds ramifications for researchers in the practical use case as it suggests that relatively large improvements in signal can be gained for relatively a cheap cost by resampling the tumor or using a differing sequencing protocol. The raw data for the ensembled data and each of their constituent sequencing designs are present as comma separated value (CSV) files in the referenced github repository.
We compared reads generated by our simulator with an Ion Torrent targeted cancer sequencing panel in a colorectal cancer patient, found in the sequencing read archive (SRA Access Key: SRX9731615). This particular case used single-end reads in the read-length range 50–300 base pairs. For a comparison case, we generated 150 base pair exome-sequenced reads. The guanine cytosine (GC) content distributions as well as the GC percentage of the reads in the real reads seemed to closely mirror that in our simulated reads, with a real GC content of 46% versus simulated GC content of 44%. GC bias is likely platform specific (Benjamini and Speed, 2012) and may be less pronounced for this system than others.
The Ion Torrent reads used in the study had a read length range of
Although the simulated read files do not exactly mirror the distributions found in current sequencing technology platforms, we are mainly concerned with invariance with respect to sequencing attributes. That is, a shift in signal accuracy caused by simulated sequencing parameters (say, read length) should produce a similar shift in accuracy in real sequencing technologies under that same shift in sequencing parameters. In a loose sense, our simulated reads can be viewed as a limiting case of current sequencing platforms, which does not over-represent parts of the genome and has a more defined distribution of read lengths.
This is not necessarily an issue for the purpose of this simulator, as it is conceivable that future technologies/sequencing protocols could be developed that do not possess the same read length distributions, read over-representations, or sequencing quality scores. In addition, these distributions vary depending on the sequencer and random stochasticity they could, however, be plausibly integrated into the simulator in future iterations. Our main conclusion is that it appears possible to mimic arbitrary sequencer properties by altering distributions within our simulator.
DISCUSSION AND CONCLUSION
In this study, we introduced a new simulation toolkit to generate sequencing reads from somatic variation processes under a wide range of biological and technological parameters. We used a bottom-up approach, encoding various aspects of somatic evolution and sequencing with user customizable probability densities. We demonstrated the utility of our simulator for several hypothetical questions in evaluating and optimizing study designs for profiling somatic variability in cell lineages.
A downside of our approach is that, in the service of modeling general classes of technologies, we may not encode some unique properties of specific sequencing platforms. Details such as distributions over sequencing quality and exon error tolerance are somewhat crudely approximated by our simulator and might need to be customized to specific current platforms in future study. In the exon sequencing case, we try to find subsets of reads that may match exon sequences well, but this is done in an inexact way due to computational considerations.
Another approximation in our experimental tests was the de facto alignment to a linear reference genome as the first part of our experiments. In the case of highly rearranged cancer genomes, alignments may not provide high-quality insights into the original mutation sources. Alternatives such as graph-based alignments or reference-free sketching ideas could be explored in the future. In the case of ultra-long reads, it may be computationally feasible to assemble the genome, raising further questions not explored here such as the lengths at which assembly becomes feasible.
The simulator might also be extended in various ways in future study. Although DNA sequencing has come to be the standard lens by which researchers view the cancer evolutionary system, a growing body of work on epigenetic theory demonstrates that some neoplasms may use epigenetic modifications to generate a selective advantage (Kanwal and Gupta, 2012). Incorporating various forms of epigenetic modifications—three-dimensional genome alterations, methylation, etc.—and the technological methods used to probe these changes could be a valuable addition to our simulator.
As our knowledge of the mechanisms of somatic evolution and mutagenesis change, modifications could be made to our simulation system to incorporate these novel patterns. For instance, progress in understanding complex patterns of SVs and the mechanisms by which they arise in somatic cells is still in its infancy, with new patterns of SV are continuing to be discovered (Hadi et al., 2020). It may be possible for future iterations of the simulator to encode arbitrary rearrangements in the genome rather than only some defined arrangements.
In addition, novel mutational signatures are being discovered with a wide variety of endogenous and exogenous causes. Arbitrary mutational signatures and alternative forms of SV could be readily incorporated into our current framework by modifying the distributions over genome lengths and frequencies of mutation. Evolutionary modeling is another potential area of improvement. We utilized a neutral coalescent model to represent the evolutionary process stemming from a single cell, and a Dirichlet process to model the clonal frequencies in each sample. There is room here to incorporate various selection pressures, clonal dynamics, drift, and bottleneck effects with greater knowledge of how these processes act in the cancerous setting.
The primary goal of this simulator is to allow thorough exploration and optimization of spaces of study design decisions and evaluate their impacts on our power to detect significant patterns of somatic evolution. We are particularly interested in our ability to reconstruct evolutionary lineages, find their characteristic mutational signatures and rates, and detect patterns of SV. An important task going forward is to provide user-friendly software for study design inquiries. This software would allow a user to input properties they wish to detect in a cancer sample along with cost settings; the software would then return sets of study design parameters that allow for their detection under minimal cost.
Ideas from Bayesian hyperparameter optimization will likely prove useful to our optimization goals since each iteration of our output function is expensive to obtain. Ideally, we wish for a symbiotic loop between sequencing technology development and simulation study design optimization. That is, simulations could produce realistic sets of data of a neoplastic process, optimization techniques could then produce feasible sets of technological parameters with which details of this process are revealed, and finally sequencing technological development could then be targeted toward parameter sets that provide maximal amounts of information.
Footnotes
DISCLAIMER
The content is solely the responsibility of the authors and does not necessarily represent the official views of the National Institutes of Health. The Pennsylvania Department of Health specifically disclaims responsibility for any analyses, interpretations, or conclusions.
AVAILABILITY
The complete code for the simulator and current experiments can be found at: https://github.com/CMUSchwartzLab/MosaicSim. Additional pseudocodes and testing information can be found in the ![]() .
.
AUTHOR DISCLOSURE STATEMENT
The authors declare they have no conflicting financial interests.
FUNDING INFORMATION
Portions of this study have been funded by Pennsylvania Department of Health award FP00003273. Research reported in this publication was supported by the National Human Genome Research Institute of the National Institutes of Health under award number R01HG010589.
References
Supplementary Material
Please find the following supplemental material available below.
For Open Access articles published under a Creative Commons License, all supplemental material carries the same license as the article it is associated with.
For non-Open Access articles published, all supplemental material carries a non-exclusive license, and permission requests for re-use of supplemental material or any part of supplemental material shall be sent directly to the copyright owner as specified in the copyright notice associated with the article.