
Abstract
The extraction of biomarkers from functional connectivity (FC) in the brain is of great significance for the diagnosis of mental disorders. In recent years, with the development of deep learning, several methods have been proposed to assist in the diagnosis of depression and promote its automatic identification. However, these methods still have some limitations. The current approaches overlook the importance of subgraphs in brain graphs, resulting in low accuracy. Using these methods with low accuracy for FC analysis may lead to unreliable results. To address these issues, we have designed a graph neural network-based model called AFMDD, specifically for analyzing FC features of depression and depression identification. Through experimental validation, our model has demonstrated excellent performance in depression diagnosis, achieving an accuracy of 73.15%, surpassing many state-of-the-art methods. In our study, we conducted visual analysis of nodes and edges in the FC networks of depression and identified several novel FC features. Those findings may provide valuable clues for the development of biomarkers for the clinical diagnosis of depression.
INTRODUCTION
Major depressive disorder (MDD) is a drastic psychiatric disorder that not only imposes significant negative impacts on the individuals affected but also imposes a substantial economic burden on public systems (Abdoli et al., 2022). Therefore, the search for accurate biomarkers for clinical diagnosis is of utmost importance. Despite the existence of various hypotheses to explain the pathogenesis of depression, there is still a lack of widely accepted and utilized biomarkers for clinical diagnosis of depression. This situation leads to issues of overdiagnosis or misdiagnosis, placing additional burdens on patients and health care systems. Hence, there is an urgent need to identify and validate reliable biomarkers to improve the diagnostic accuracy and treatment outcomes of depression (Shi et al., 2021).
Resting-state functional magnetic resonance imaging (rs-fMRI) is a noninvasive neuroimaging technique that captures spontaneous brain activity reflecting brain functional organization by recording blood oxygen level-dependent signals and establishing brain functional mechanism models (Li et al., 2019). Research indicates a potential link between psychological activities occurring during rest and the onset of MDD. The extraction of brain functional networks from rs-fMRI offers significant advantages in investigating the pathological processes of brain diseases and revealing the underlying brain functions (Shi et al., 2020).
Analyzing the brain functional connectivity (FC) networks based on fMRI has been proven to be an important method for developing high-precision biomarkers for psychiatric disorders (Gallo et al., 2023). In recent years, scholars have been exploring the use of deep learning techniques to extract key features from the FC network of depression and attempting to achieve automatic identification of depression. Among them, Noman et al. (2022) proposed a model based on graph autoencoders, which can perform an automatic diagnosis of depression and FC analysis, achieving a certain accuracy. However, due to the small size of their dataset, which only included dozens of depression patients, the generalization ability of their results is limited. By 2023, Gallo et al. (2023) and Fang et al. (2023) used a larger-scale rest-metamdd dataset to train their deep learning models and perform brain FC analysis. Although the scale of the dataset has been expanded, their models directly encode the entire brain graph, ignoring the subgraph structure of the brain graph. In addition, the network frameworks they used were relatively simple. Therefore, these models have lower accuracy in detecting depression, which affects the accuracy of brain FC analysis. After an in-depth exploration of FC analysis of depression (MDD) in the past, we have identified some existing issues. First, existing deep learning-based methods often overlook the hierarchical information in brain graphs, leading to incomplete and inaccurate analysis of FC. Second, despite the powerful capabilities demonstrated by deep learning in many fields, there are still issues with insufficient accuracy in analyzing FC of MDD. This is mainly due to the simplicity of the network frameworks they used, which limit the performance and accuracy of deep learning models. This indicates that further improvement and refinement of deep learning models and related frameworks are needed to achieve more accurate FC analysis.
To this end, we propose a depression FC analysis framework based on reinforcement learning (RL) and mutual information (MI) mechanism. Through RL, we identify significant subgraphs in the brain graphs of depression patients. The MI mechanism is used to preserve the global information in the brain graph. Extensive experiments have demonstrated the superiority of our framework over many state-of-the-art methods. Furthermore, we conducted a more comprehensive analysis of FC, resulting in the identification of numerous potential biomarkers. These findings provide evidence for the interpretability of our approach.
METHODS
We used the method defined in the literature of Zhang et al. (2023) to build the FC network. The graph of the FC network is denoted as
Sampling and encoding the sub-brain graph
The process of sampling and encoding the sub-brain graph is shown in Figure 1 (1.1, 1.2, 1.3):
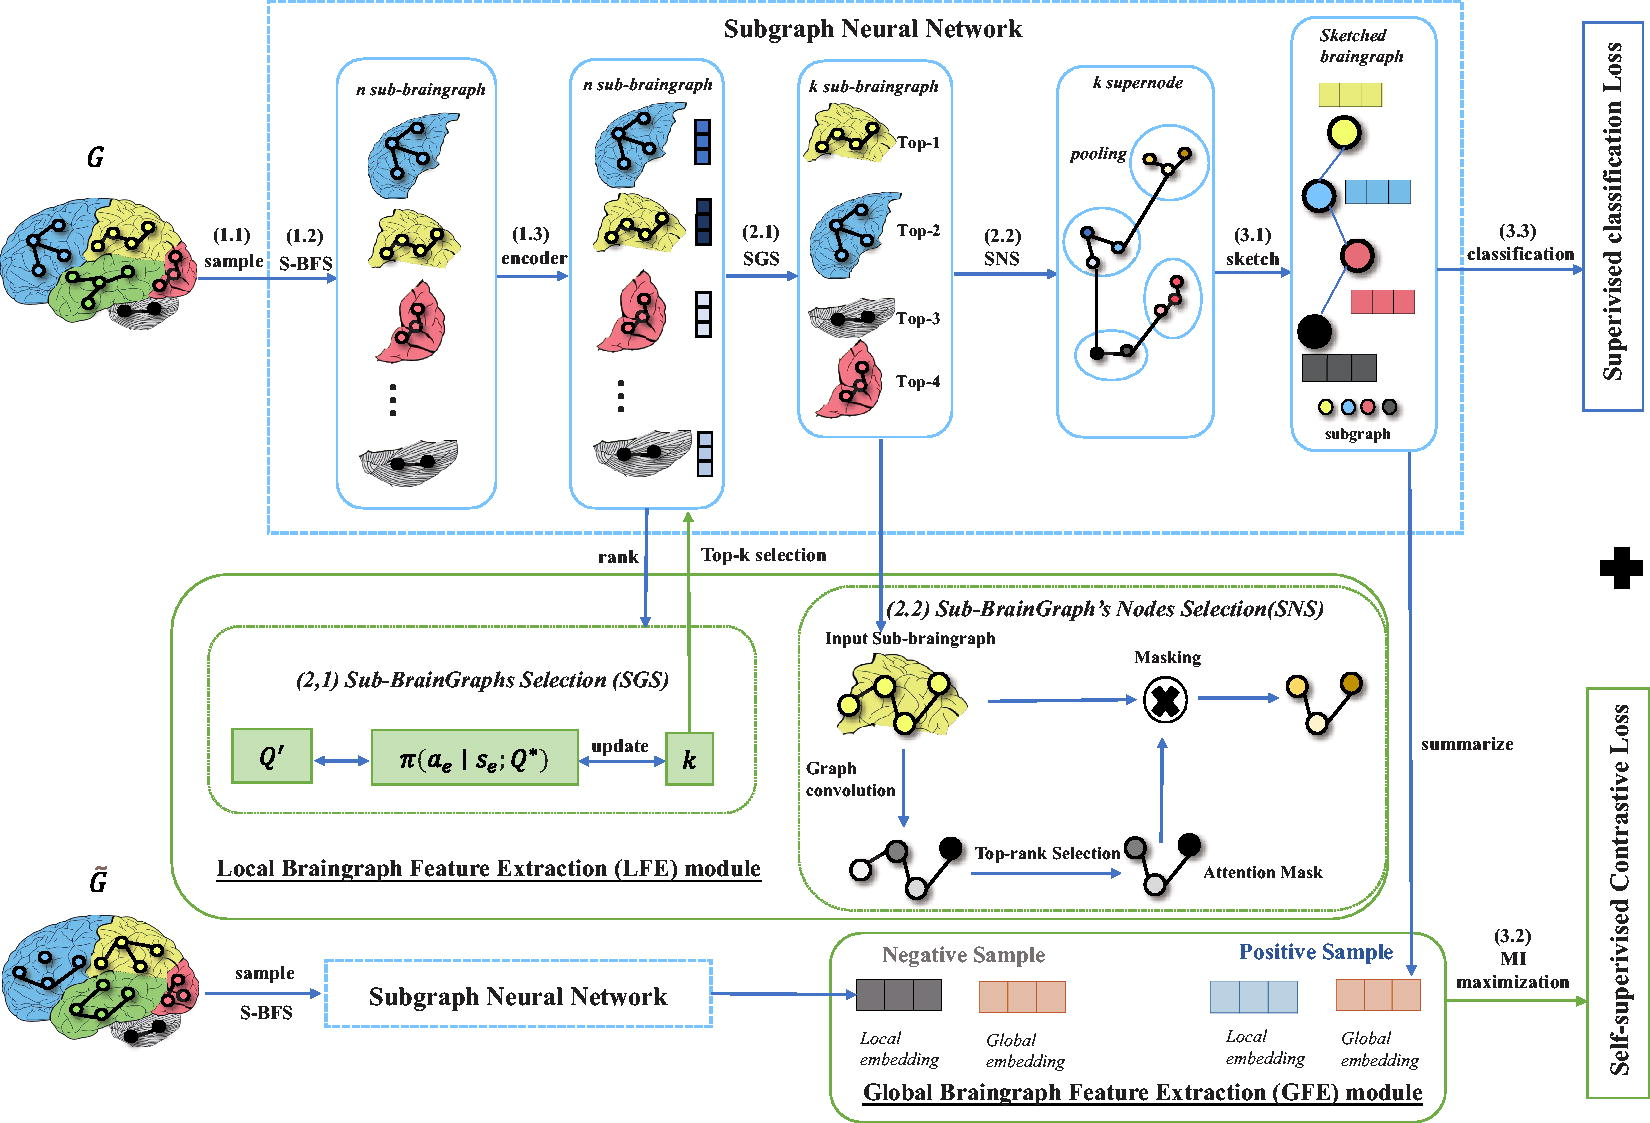
An illustration of AFMDD architecture.
(1.1): The process of identifying the centers of each sub-brain graph involves multiple steps. First, all nodes within the brain network are sorted in a descending order based on their degree, which refers to the number of connections to other nodes. This sorting allows us to prioritize the most influential nodes within the network. Next, from the nine subfunctional brain regions, we select the top N nodes with the highest degree as the central nodes for the subsequent creation of sub-brain graphs. These central nodes are expected to represent the key regions within each subfunctional area, capturing the most significant connectivity patterns.
(1.2): Once the central nodes are determined, we utilize the Selective-Breadth First Search (S-BFS) algorithm to generate the sub-brain graphs. The S-BFS algorithm is designed to expand the graph starting from the selected central nodes while prioritizing the exploration of nodes within the same subfunctional region. This approach ensures that the resulting sub-brain graphs are representative of the local connectivity patterns within each subfunctional area. To maintain a manageable size for the sub-brain graphs, we set a limit of no more than s nodes in each subgraph. This constraint allows for a more focused analysis while reducing computational complexity. The resulting set of sub-brain graphs is denoted as
(1.3): To capture the node representations of the sub-brain graphs, we utilize a graph neural network-based encoder denoted by
To incorporate
To compute the attention coefficient
In this equation, the weight vector
AFMDD utilizes a Local Braingraph Feature Extraction (LFE) module to preserve crucial substructure information of the brain graph. The LFE contains two parts as shown in Figure 1 (2.1, 2.2).
Sub-Brain Graph Selection section (2.1): To identify noteworthy sub-brain graphs, we use the top-k sampling approach with an adaptive pooling ratio k. By projecting the features of all sub-brain graphs onto 1D footprints using a trainable vector p, we subsequently select the top
To assess the significance of sub-brain graphs and acquire the indices of the
After identifying the significant sub-brain graphs, we proceed to the sub-brain graph’s Node Selection section (2.2) using self-attention pooling (Lee et al., 2019), as shown in Figure 1 (2.2). Specific details can be referenced in the literature of Zhang et al. (2023).
The process of sketching the brain graph by the GFE module for classification consists of three distinct steps, as shown in Figure 1 (3.1, 3.2, 3.3).
(3.1): The conversion process of the original graph into a sketched graph is depicted in Figure 1 (3.1). In this process, the sub-brain graphs are treated as supernodes, resulting in a sketched brain graph denoted as
To calculate the attention coefficient αij of sub-brain graph gi on gj, we use a multihead attention mechanism defined in Veličković et al. (2017). Subsequently, we derive the sub-brain graph embeddings
(3.2): The GFE module applies a self-supervised MI (SSMI) mechanism to optimize the MI between local sub-brain graph representations and the global brain graph representations to a maximum value, as shown in Figure 1 (3.2). By using the GFE module, all the obtained sub-brain graph representations are enforced to be aware of the global structural characteristics.
A READOUT function is utilized to condense the sub-brain graph level embeddings into a fixed-length vector that denotes the global graph representation
We specifically apply an averaging strategy as the READOUT function. The Jensen–Shannon (JS) MI estimator (Nowozin et al., 2016) is used to maximize the estimated MI on the local/global pairs. Specifically, a discriminator function
To optimize the SSMI objective and enhance the MI between
Third (3.3): The sub-brain graph embeddings are transformed into label predictions by utilizing a softmax function. The graph classification outcomes are then determined by conducting a voting mechanism among the sub-brain graphs. The loss
The contribution of the SSMI loss is determined by the value of β; the parameter set Θ in AFMDD, which consists of trainable parameters, is subject to L2 regularization with a coefficient of λ.
Data acquisition and parameter settings
The REST-meta-MDD Project dataset is the most comprehensive rs-fMRI database of individuals with depression available at present (Yan et al, 2019). It was utilized to verify the efficacy of our proposed AFMDD. The REST-meta-MDD Project dataset consists of rs-fMRI data collected from 25 research groups across 17 Chinese hospitals/sites, encompassing 1255 patients (57% male, aged 36.6 ± 15.7 years) and 1083 healthy controls (62% male, aged 35.1 ± 14.7 years). The fMRI data were subjected to standard preprocessing protocols using the Conn toolbox (version 15.g) in SPM 12. The AAL atlas was utilized to generate an anatomical parcellation of the entire brain, dividing it into 116 ROIs; this allowed for the extraction of region-wise fMRI time series by computing the average across voxels.
To implement the proposed method, we utilized PyTorch (Paszke et al., 2019) and the GraphConv module from the PYG library (Wang et al., 2019). Common parameters for model training were set as follows: momentum = 0.8, dropout = 0.4, and L2 norm regularization weight decay = 0.01. GCN with two layers was used as our subgraph encoder. In this study, we have chosen to use proportional thresholding (van den Heuvel et al., 2017), which involves setting a proportion τ of the strongest connections in the FC network to 1 while setting other connections to zero. Evaluating over a range of thresholds, we choose
Overall evaluation
As shown in Table 1, the performance of the AFMDD is evaluated by benchmarking them against BrainNetCNN (Kawahara et al., 2017), Wck-CNN (Jie et al., 2020), XGBoost (Chen and Guestrin, 2016), and five GCN-based methods (Zhang et al., 2023), which are cutting-edge connectome-based models. The proposed AFMDD significantly outperformed the other models. Compared with GAE-FCNN, AFMDD performs better; GAE-FCNN is a novel GAE architecture that leverages GCN to capture the topological framework and node characteristics of large-scale fMRI networks and project this information into a compact latent representation with reduced dimensionality. Unlike our proposed models, GAE-FCNN does not take into account the subgraph structure of the brain graph, resulting in lack of specificity for brain graph. The proposed model’s superior performance compared with other methods indicates that our method can offer distinguishing information to diagnose depression.
Comparing AFMDD’s Performance (Average Accuracy ± Standard Deviation) with Other Methods
Comparing AFMDD’s Performance (Average Accuracy ± Standard Deviation) with Other Methods
Discriminative brain regions
To identify which brain regions (ROIs) exhibit a higher discriminatory ability in diagnosing brain disorders, we conducted ablation experiments and visualized them in Figure 2a. Specifically, removing nodes during the node sequence selection process and observing the decrease in accuracy. We found that the thalamus (THA) had the greatest influence on accuracy, as shown in Figure 2a (left), indicating that the thalamus is the most discriminative node (ROIs) when diagnosing MDD.
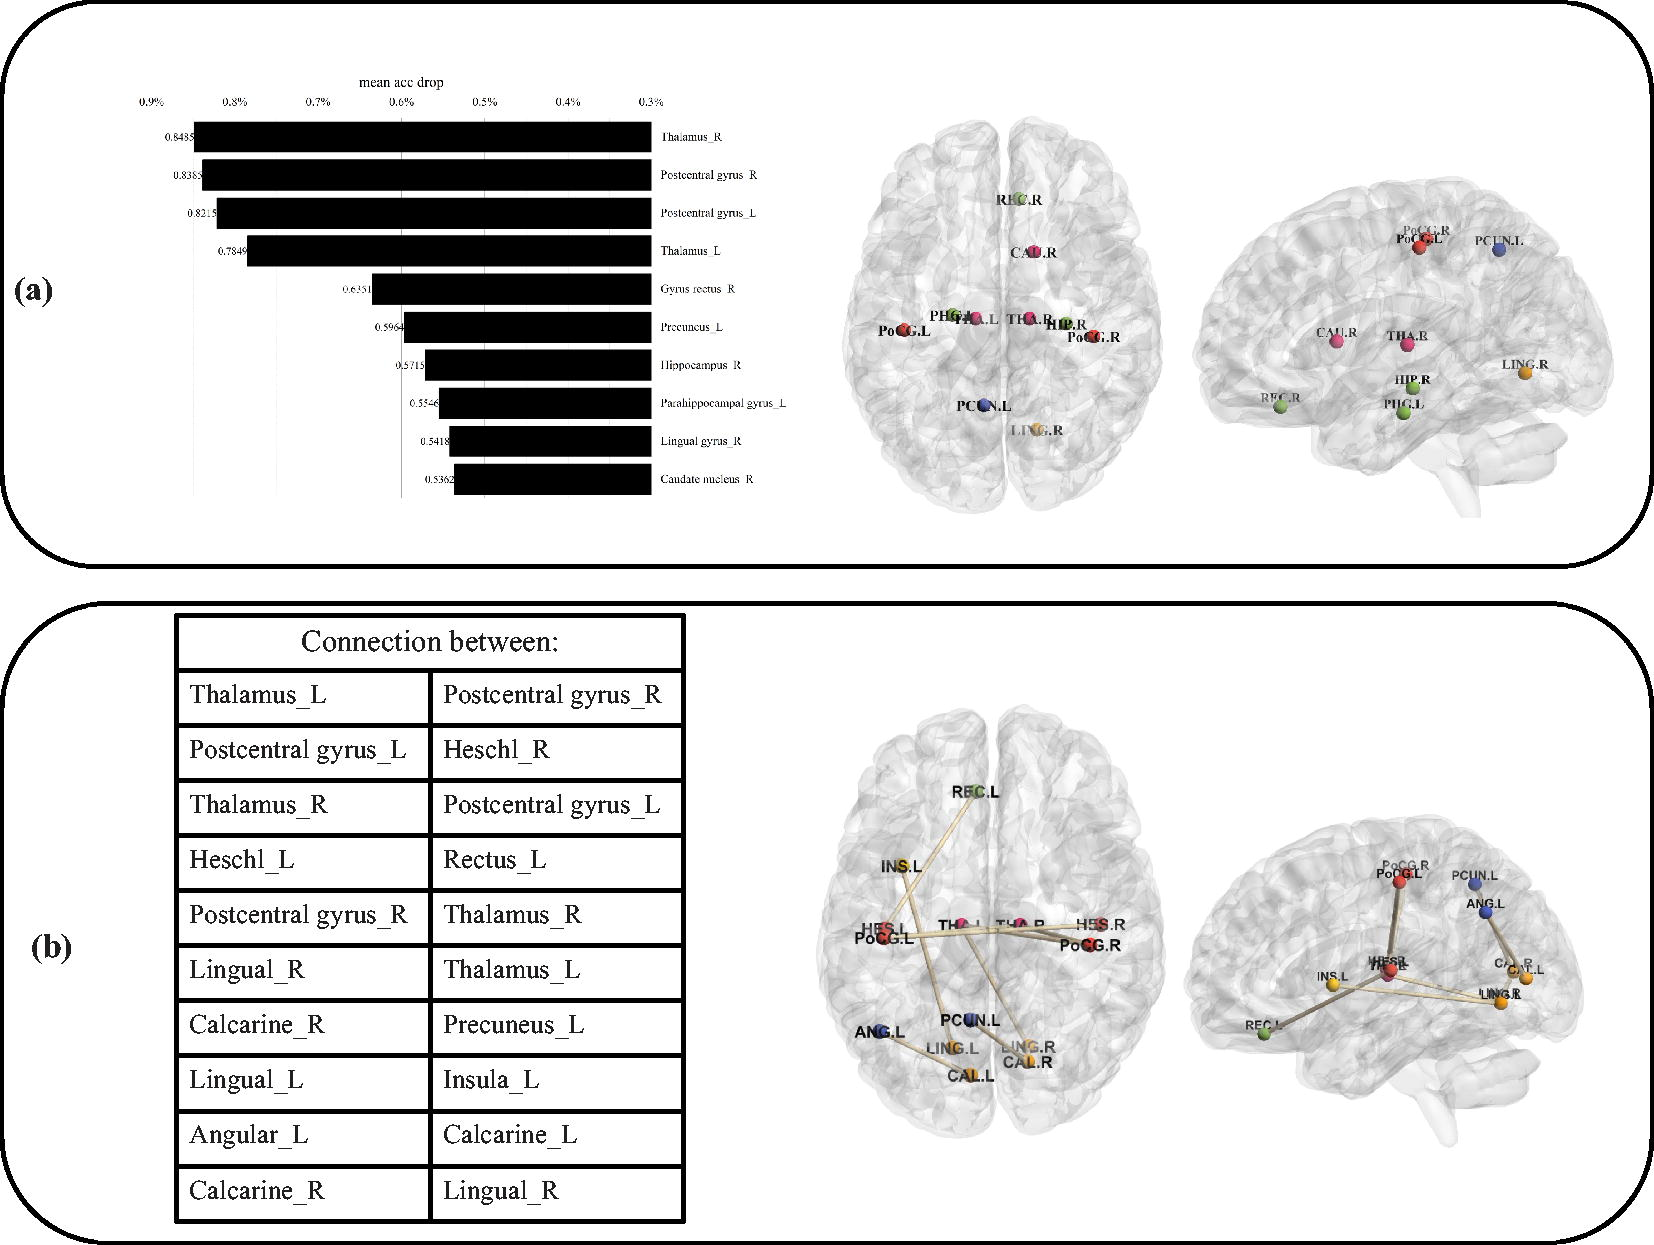
Top 10 most discriminative brain regions and connections, (
We used the attention mechanism in the literature of Fang et al. (2023) and Gallo et al. (2023) to determine which edge has a higher discriminative ability. The top 10 discriminative edges are shown and visualized in Figure 2b. Through in-depth analysis of discriminative edges, we have discovered a significant phenomenon: A large number of discriminative edges are connected to the thalamic region. This finding is of great significance as it reveals the connectivity of depression at the brain structural level. In addition, we have also noted that the thalamus and the cingulate gyrus often serve as key components in the discriminative lymph nodes of depression. Previous studies have reported metabolic abnormalities in the thalamus of depression patients, and these abnormalities have been closely associated with the onset of depression (Li et al., 2010). Specifically, the medial regions of the thalamus have been shown to have a direct link to the manifestation of depressive symptoms (Neumeister et al., 2004). The experimental results of our study are consistent with previous research observations, further confirming the important role of the thalamus in depression. In conclusion, our research findings reveal the critical role of the thalamus in depression, providing new perspectives and approaches for the diagnosis and treatment of depression.
CONCLUSION
To address the limitations of existing depression FC analysis network frameworks, we have developed a novel framework. This framework is based on RL and MI mechanism. With the application of RL techniques, we are able to accurately identify key subgraphs in the brain graphs of depression patients, thereby gaining deeper insights into the underlying mechanisms of the disease. The utilization of the MI mechanism ensures the proper preservation of global information in the braingraph, avoiding the omission of important information. Through extensive experimental validation, our framework has shown significant superiority over many state-of-the-art methods in the field. Furthermore, it is worth mentioning that our framework enables a more comprehensive analysis of FC, leading to the successful discovery of various potential biomarkers. These findings provide a robust basis for the interpretability of our approach and offer new avenues for research and treatment of depression.
Footnotes
ACKNOWLEDGMENTS
The authors express their gratitude to Panrui Tang for the insightful discussions pertaining to this work. They are also thankful to Dr. Zuping Zhang for her assistance with supervision, article preparation for review, and editing of this article.
AUTHORS’ CONTRIBUTIONS
Y.Z.: Methodology, validation, visualization, and writing—original draft. X.L.: Formal analysis, data curation, and investigation. P.T.: Software, resources, and data curation. Z.Z.: Supervision, writing—review and editing, and conceptualization.
AUTHOR DISCLOSURE STATEMENT
No conflicts of interest are declared by the authors.
FUNDING INFORMATION
No funding was received for this article.